fatigue results and analysis for thick adhesive … sdm... · fatigue results and analysis for...
TRANSCRIPT

2010 AIAA SDM, Wind Energy Session, Orlando, AIAA-2010-2821
Fatigue Results and Analysis for Thick Adhesive Notched Lap Shear Test
Aaron T. Sears, Daniel D. Samborsky, Pancasatya Agastra and John F. Mandell, Department of Chemical and Biological Engineering, Montana State University,
Bozeman, MT, 59717, USA
ABSTRACT
Three test methods have been developed for thick paste adhesives typical of wind turbine blades, all adaptations from studies reported in the adhesives literature. Each test can provide important data for thick paste adhesive joints under a full range of loading conditions experienced in the wind turbine blade application. The notched lap shear test results for static loading explore a variety of parameters including: batch to batch variation, loading rate, laminate adherend peel plies, overlap length, adhesive thickness and applied load direction (tension vs. compression). The effects found are largely resolved by finite element analysis using a maximum local tensile strain failure criterion based on neat adhesive tests. Six paste adhesives were tested, showing a range of notched lap shear strength. Fatigue data were obtained for three loading conditions (tension, reversed loading and compression) with two blade adhesives, one relatively brittle and the other relatively tough. Fatigue results were similar for the two adhesives despite their toughness difference, which was evident in the crack propagation phase of the lifetime. Two fracture mechanics based test methods were studied with artificial starter cracks. The mixed mode cracked lap shear test was run under reversed loading to obtain fatigue crack growth data for two adhesives; the data were separated by the GI/GII ratio. The cracks for both adhesives propagated inside the laminate surface, along the top of the reinforcement, with the exception at higher growth rates of some growth inside the adhesive, next to the interface, for the tougher adhesive. Mode I DCB tests produced crack growth down the adhesive mid-thickness for the three adhesives tested. The static GIc values ranged from a low of 581 J/m2 to 1626 J/m2 for the three adhesives studied.
I. Introduction
Typical wind turbine blade joints use paste adhesives several millimeters thick, of varying geometry. They can be expected to experience significant static and fatigue loads under various environmental conditions over their service life. Test methods which represent the blade application may be based on either strength/fatigue life [1, 2] for representative joint geometries, or fracture mechanics/crack growth rate [1, 3]. Literature related to these areas has been reviewed in recent publications [1-6]. Typical adhesives test parameters include: laminate adherend properties and surface preparation, adhesive composition (chemistry, additives, mixing, curing), adhesive thickness, temperature, and moisture, as well as joint geometry. Cyclic fatigue and time dependent creep/stress relaxation are major loading issues [6], in addition to static loading conditions and multi-axial loads. Fatigue loading for blades must consider, as a

minimum, R-values (R = minimum load/maximum load) in the range of tensile fatigue (R = 0.1), reversed tension-compression (R = -1) and compression (R = 10).; additional R-values are needed for laminate fatigue to allow adequate prediction of lifetime under typical blade loading spectra [7, 8]. Extreme strength issues not generally included in coupon test programs are large areas where the adhesive does not fill the bond gap, and large un-bonded or partially bonded areas; these are inspection issues. This paper reports on the development and initial testing of three adhesives tests designed for thick laminates and thick adhesive layers and a full range (tension to compression) of uniaxial loading conditions. The notched lap shear geometry is designed to include a crack initiation phase with crack initiation localized to the adhesive layer, at the notch root (to suppress initiation in the adherend or interface, allowing meaningful comparisons of different adhesives). The mixed-mode (modes I, opening, and II, shearing) cracked lap shear test and double cantilever beam (DCB) tests use a starter crack to explore the static and fatigue crack propagation behavior. Crack growth for the cracked lap shear test is near the laminate interface, while the crack in the mode I DCB test tends to grow in the mid-thickness range of the adhesive layer. None of these test methods is original in this work, but are adaptations of reported methods to the wind blade joint application.
II. Experimental Methods
A. Notched Lap Shear The thick adhesive lap shear test method has been developed along the lines of various standard methods (ASTM D1002, D3165, D5656, and D5868), but with improved application to fatigue studies with laminate adherends and thick adhesive layers typical of wind turbine blade structures. The following were the target attributes of interest:
1. The test should be capable of determining static strength and fatigue response under a range of R-values including compressive loads. 2. Loading should be through standard hydraulic grips (with lateral movement constraint). 3. Specimen preparation should be convenient and reproducible. 4. Failure should initiate in the adhesive for a broad range of adhesives of interest (as opposed to failure initiating inside the laminate interface). 5. The overlap length should be sufficient to explore damage initiation and propagation. 6. The test should be able to accommodate a broad range of adhesive properties and thicknesses.
The specimen geometry is depicted in Figure 1. This geometry is similar to that reported by Tomblin, et al [6]. Preliminary tests with other geometries, including notches at various positions in the adhesive, showed inconsistent failure initiation sites and increased scatter. Data are reported later for overlap lengths of 12.7 and 25.4 mm, with the fatigue geometry using 25.4 mm. Laminate adherend choice is important in that failure may initiate within the laminate for some layups; this is more common for ±45 laminates than for unidirectional laminates with relatively thick plies. The laminate used in these studies was four plies of unidirectional glass fabric (Vectorply ELT-5500) with Hexion 135/1366 epoxy resin; the fiber volume content was 56 - 58%. The adhesives are listed in Table 1.

Test development included linear and nonlinear finite element analysis discussed later in more detail. Figure 2 gives a maximum tensile strain map for a typical specimen with a 25.4 mm overlap length, L, under tensile load. The strain concentration area at the notch radius is the dominant crack initiation site as indicated for a typical fatigue specimen in Figure 3. The crack usually propagates through the adhesive to the opposite adherend interface, then along the interface, either in the adhesive or inside the laminate surface, as described in the results. Static tests were conducted at a displacement rates of 0.025 and 12.7 mm/s as discussed later; fatigue tests were conducted at a frequency of 1-5 Hz. The nonsymmetrical specimens with clamped ends tend to deform out-of-plane, which was restrained by large hydraulic grips with special lateral constraints [1].
Table 1. Adhesives, mixing and cure temperature.
Designation Adhesive Mixing Cure temp
(oC)
ADH-1 Hexion
EP135G3/EKH1376 Hand 70
ADH-2 3M DP460 NS Mixer Head 50 ADH-3 EFI 20236/50219 Hand 70 ADH-4 Rhino 105 Hand 70 ADH-5 Rhino 405 Hand 70 ADH-6 3M W1100 Hand 70
B. Cracked Lap Shear Test The cracked lap shear specimen shown in Figure 4 (single notch only) was used to determine crack growth resistance under mixed mode loading, where the crack generally propagates near the laminate interface. The test was run under tensile loading for static tests and reversed loading in fatigue for this study, but a full range of tension to compression can be run with hydraulic grips under lateral constraint, and with relatively thick adherends. Crack tip strain energy release rates, GI, GII, and the total, GTot (GI + GII), were determined from FEA using the approach and properties outlined later for the notched lap shear analysis, with the addition of virtual crack closure and surface elements, similar to Reference 9. The strain energy release rates as a function of crack length are given in Figure 5 for tension and compression loading. The effects of the crack boundary elements on GII under compressive loading were significant in offsetting material interpenetration along the crack flank, so GII in tension is not equal to GII under tension. Results are given in Figure 5 for crack positions just inside the adhesive (Figure 6) and just inside the surface resin of the laminate. Little effect of crack location is seen, due to the similar resin and adhesive elastic constants. Test data for the cracked lap shear specimen are reduced to G-values for particular loads and crack lengths using Figure 5. For reversed loading data, the GTot plotted is the maximum tension value, which is greater than that for compression. The curves in Figure 5 are determined using a linear FEA at a load of 4.45 kN. The G-values for other maximum loads (Pmax) can be calculated from the elastic FEA solution at 4.45 kN by Equation (1)[1].

GTot = GTot(Fig. 5) (Pmax / 4.45)2 (1) C. Mode I DCB Test The pure mode I test (Figure 7) is used to determine the GIc value for cracks propagating in a cohesive mode within the adhesive layer. The following calculation was adapted from delamination testing (ASTM D5528) following Reference 1, but ignoring the contribution of the adhesive to the beam stiffness:
13
112
2o2
o11
32
2I
I 10G
Eh
λ
1
λ
2aa
Ehb
12PG (2)
4
11
22
E
6E
h
1λ (3)
where,
ao = crack length b = width of specimen h = adherend thickness E11, E22 = longitudinal and transverse adherend moduli, respectively G13 = inplane adherend shear modulus GI = strain energy release rate in mode I PI = mode I critical loading λ = elastic foundation correction To date, this test has only been used in a static mode. The critical load, PI, for crack advance is determined using the 95% slope intersection with the load-displacement trace, illustrated in Figure 8 for stable crack extension. The maximum load was the consistent outcome of this method for unstable growth. The test is conducted by loading the specimen through pins at the end under displacement control, until the crack advances by some distance, either stably or unstably; the specimen is then unloaded, and another test may be run at the new crack length. The displacement rate ranged from 0.1 to 0.5 in/min as the crack extended over the length of the specimen; the rate increase was used to offset the decreasing specimen stiffness with increasing crack length.

Figure 1. Geometry of notched lap shear fatigue specimen.
Figure 2. Maximum principal tensile strain linear FEA map.
Figure 3. Notched lap shear fatigue specimen failing in reversed loading fatigue at 3004
cycles (left) and 3006 cycles (right).
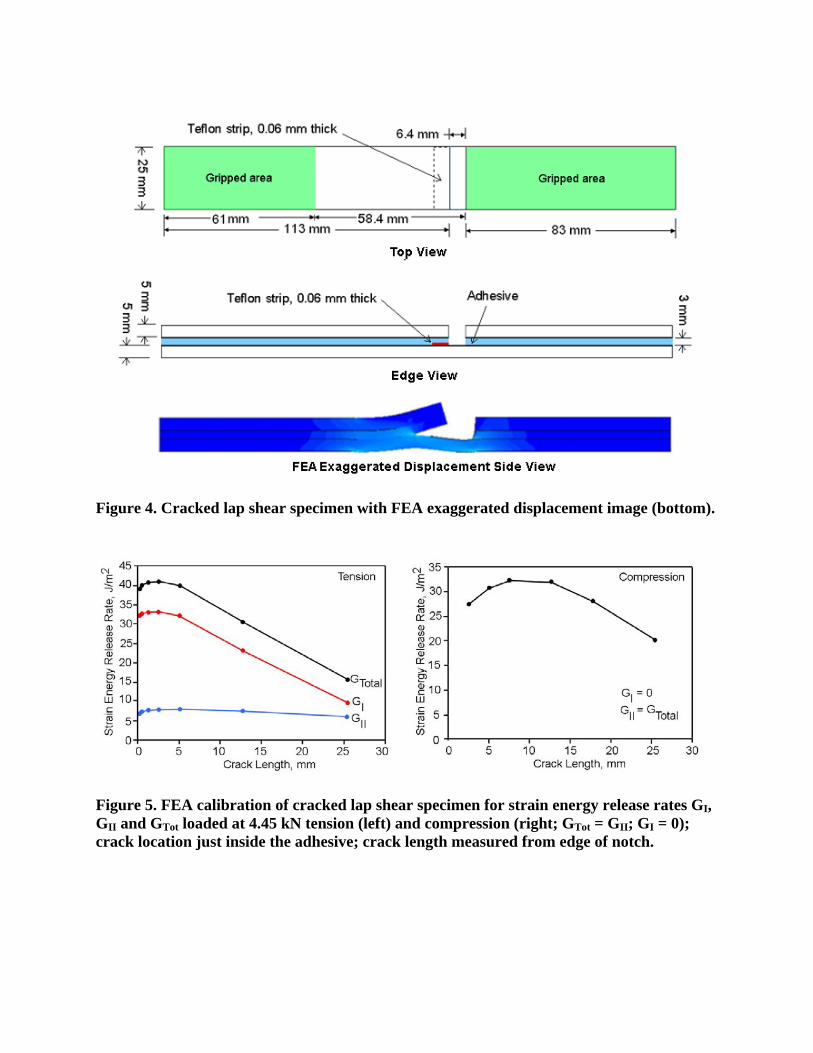
Figure 4. Cracked lap shear specimen with FEA exaggerated displacement image (bottom).
Figure 5. FEA calibration of cracked lap shear specimen for strain energy release rates GI, GII and GTot loaded at 4.45 kN tension (left) and compression (right; GTot = GII; GI = 0); crack location just inside the adhesive; crack length measured from edge of notch.

Figure 6. FEA mesh for cracked lap shear. Crack location 0.04 mm inside the adhesive (red).
Figure 7. Mode I Double Cantilever Beam specimen.
Figure 8. Typical critical load determination using the 5% offset method, stable growth

III. Results and Discussion A. Notched Lap Shear Tests Static Tests. Static test results have been obtained for several geometries, peel plies, adhesives, displacement rates and adhesive thicknesses to explore the effects of various test parameters on the static strength. The baseline geometry and FEA results are given in Figures 1-3. The Hexion adhesive EP135G3/EKH1376, designated ADH-1, was used as a baseline adhesive for most these studies, with selected comparisons to several other adhesives. Strength results are obtained at a test rate of 0.025 mm/s except as noted, and the apparent shear strength is calculated from the maximum load to complete separation. Figure 9 gives a series of bar charts with standard deviation markers for several static test comparisons; at least five test results were included for each case, except where noted. The apparent lap shear strength, τapp, is calculated for each case from Equation 4; it should be noted that failure is associated with the local stress concentration area at the notch root in Figure 2, so the average shear stress has limited physical meaning except in comparisons with other results from the same geometry. τapp = F/ W×L (4) where F is the applied force, W is the width (about 25 mm) and L is the overlap length (either 12.7 mm or 25.4 mm). Figure 9(a) gives different mixing batch results for adhesive ADH-1, all taken from the same containers. The slight variations between mixing batches should be taken into account when considering comparisons of other parameters. The hand mixing of very viscous adhesive and hardener, while done carefully, is not precise, and resulting porosity varies somewhat between batches. Adhesive joints are well known to be sensitive to interface preparation [4], which, for wind blades may be a surface produced by the removal of the peel ply. The type of peel ply used is reported [10] to significantly affect the joint strength for prepreg carbon/epoxy laminates in some instances. Figure 9(b) indicates little effect of peel ply type for the three products evaluated, for two adhesives. The peel ply is applied to both laminate surfaces, but the resin distribution layers are used only on the top, under the vacuum bag. Since the bottom (mold) side is more nearly flat than the top side, the bottom mold side is used as the bonding surface unless noted. No significant effect on joint strength was found for bonding on the mold side or the resin distribution layer side, so the data shown are for bonding on the mold side. Figure 9(c) provides data for several adhesives, three tested at two overlap lengths. As discussed in the FEA section which follows, the longer overlap length results in the mid-length section of the adhesive carrying low stresses relative to the notch areas, so the calculated average shear stress over the entire length is lower than for shorter lengths at the same load. If failure initiates near the notch at a similar local stress condition, then the longer overlap length will result in lower apparent shear strength. The strength ratio for 25.4 mm length to 12.7 mm length ranges from 0.48 to 0.65. As noted earlier, the longer overlap length is desirable for observing crack initiation and growth modes in fatigue. DCB tests in the final section show ADH-6 to be

significantly higher in toughness than ADH-1, with ADH-5 intermediate. ADH-2 is a tough adhesive used for test development, but with a significantly lower viscosity compared with typical blade adhesives. The mode of failure under tensile loading (Figure 3) is crack initiation in the adhesive at the notch root, growth through the adhesive to the opposite interface, and then growth along the laminate interface either inside the adhesive or just inside the adherend surface. Under compressive loading the peel stress components reverse sign to compression, and the failure initiation site shifts to the interface. The crack appears to grow suddenly under compression, crossing the adhesive at approximately 45o (consistent with the FEA predicted maximum tensile direction resulting from the mainly shear strain field), to the opposite laminate interface part way along the length. Figure 10 compares failed specimens under tension and compression loading, and Figure 9(d) compares apparent shear strength values. The compressive strength is much higher than the tensile strength for the relatively brittle adhesive ADH-1, which appears to fail due to the local (tensile) peel stress component. The shear stresses are equal but in opposite direction under tensile and compressive loading for the same applied absolute force level. The effect of adhesive thickness on apparent shear strength was determined for adhesive ADH-1, with the same 5 mm thick adherend laminates and a 25.4 mm overlap length. Figure 9(e) compares the joint strength for three different adhesive layer thicknesses, nominally 3.25, 6.50 and 9.75 mm, and Figure 11 shows failed specimens of each. Failure initiates at about the same location on the notch radius for each case, and then propagates along the opposite interface, just inside the laminate surface, as noted earlier. A significant decrease in joint strength with increasing adhesive thickness is evident in Figure 9(e). This is consistent with the trend in Ref. 11 for thinner adhesive layers, and is somewhat steeper than reported for a broad range of adhesive thicknesses in Reference [12]. The performance of adhesives is generally recognized to be sensitive to time (creep) and temperature [13]. Data for three displacement rates for ADH-1 are given in Figure 9(f). These data show only a slight decrease in strength with increasing rate over the rate range of standard static tests and fatigue tests. A similar finding was reported for simulated blade joints in Reference 2.

Figure 9(a). Repeatability of static strength results for three batches of adhesive ADH-1, overlap length 12.7 mm.
Figure 9(b). Effect of laminate peel ply for adhesives ADH-1 and ADH-2, 25 mm overlap length (ES- Econostitch, EPE- Econo ply E, SF - Super F).
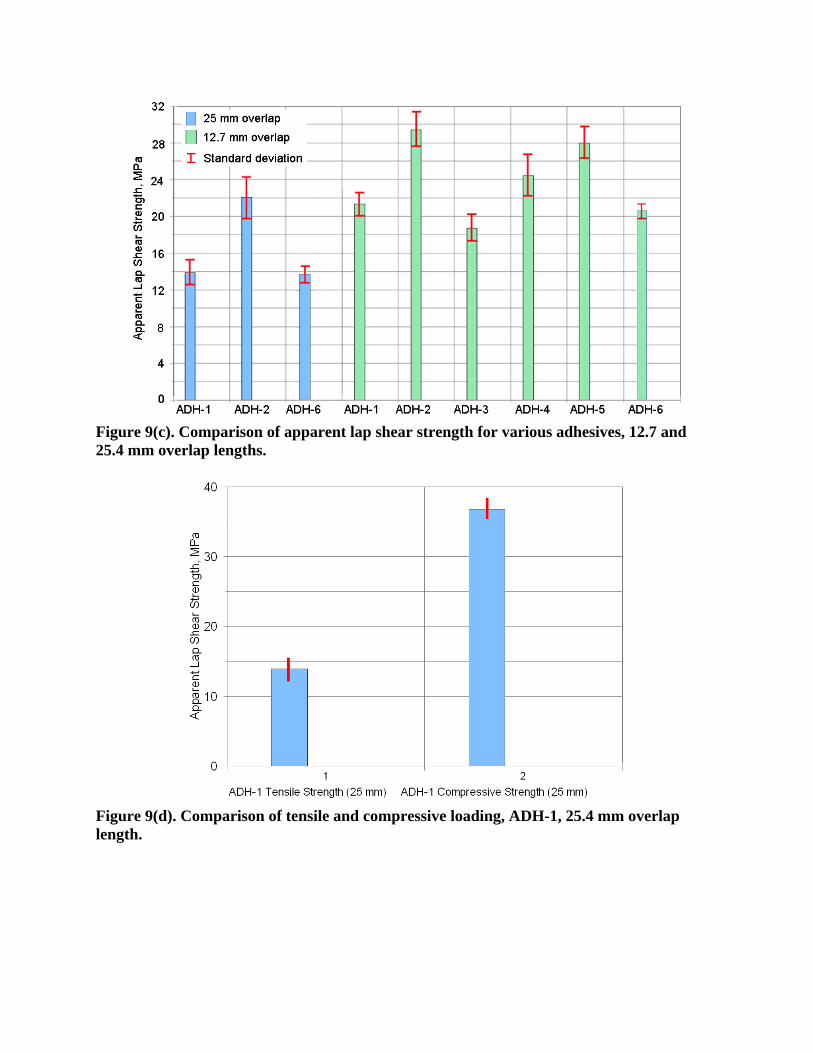
Figure 9(c). Comparison of apparent lap shear strength for various adhesives, 12.7 and 25.4 mm overlap lengths.
Figure 9(d). Comparison of tensile and compressive loading, ADH-1, 25.4 mm overlap length.
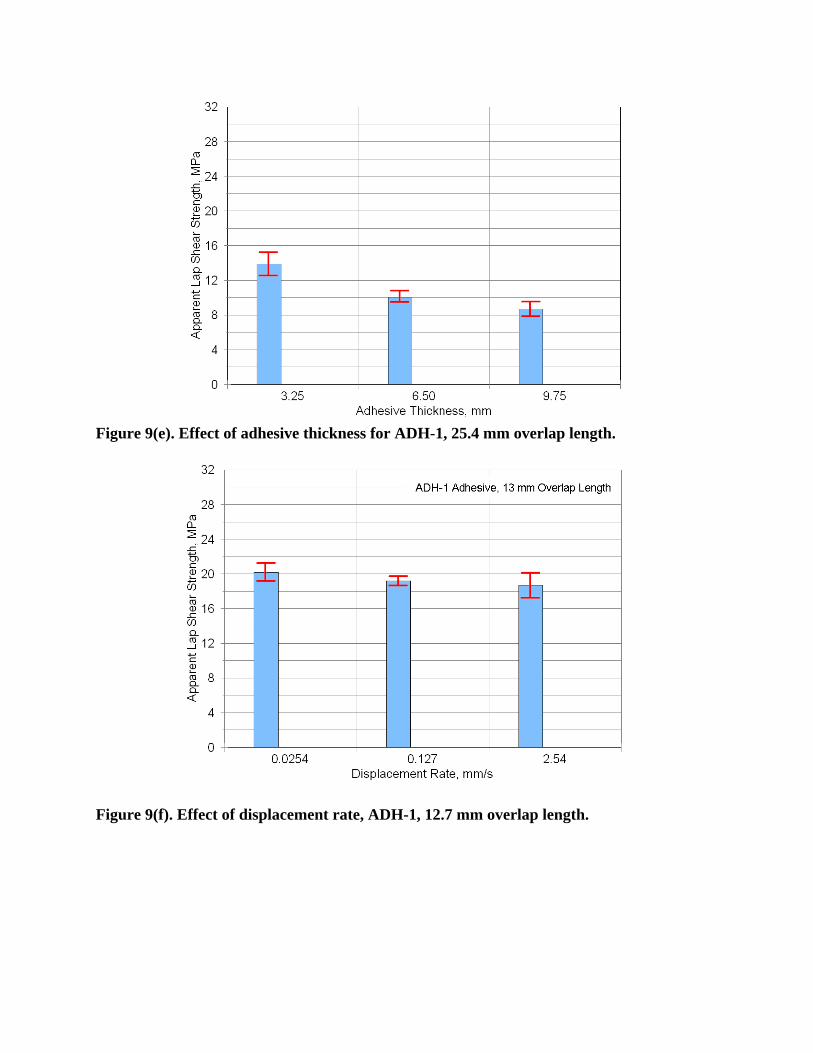
Figure 9(e). Effect of adhesive thickness for ADH-1, 25.4 mm overlap length.
Figure 9(f). Effect of displacement rate, ADH-1, 12.7 mm overlap length.

Figure 10. Failed specimens under tension (right) and compression loading, ADH-1, 25.4 mm overlap length.
Figure 11. Failed coupons with 3.25, 6.50 and 9.75 mm thick adhesive layers, ADH-1, 25.4 mm overlap length.
Fatigue Loading. The lap shear test specimen was designed with adequate stiffness to be used over a range of R-values including tension, reversed loading and compression, using hydraulic grips with lateral constraint [1]. The static results indicate a significantly different behavior in compression, where root peeling stresses become compressive, than under tensile loading. Reversed loading and compression data for adhesives have been very scarce in the literature, but are likely to be important for wind blades. In the linear range, at low loads, reversed loading

produces reversed shear direction, but similar distribution, in the tensile and compressive parts of the cycle. Tensile (peel) stresses are high during the tensile load part, but mostly compression except for secondary areas, under the compressive part of the cycle. Figure 12 provides a comparison of tensile, reversed and compressive (R = 0.1, -1 and10) fatigue life data for the ADH-1 adhesive with the EP-1 resin unidirectional laminate adherends and 25.4 mm overlap length. The three loading conditions result in strongly differing fatigue response, with reversed loading the most fatigue sensitive. Compressive loading response is very fatigue resistant for this geometry and adhesive. The fatigue failure modes are similar to those under static loading, with reversed loading cracks initiating at the notch root (in the adhesive), similar in appearance to tension (Figure 3). The mean curve fits are fit to the fatigue data only. The fatigue sensitivity in terms of approximate lifetime range at about 50% of the static strength are similar to a 4 mm thick general aviation paste adhesive under room temperature dry conditions, Figure 4-19 in Ref. 6. Little effect of test frequency in the 2 to 10 Hz range was reported in that study; the frequency for the tests in Figure 12 varied from 1-6 Hz. The fatigue trends given in Figure 12 are steeper (higher absolute value of the exponent) compared to the simulated blade web joints in Reference 2. The two adhesives ADH-1 and ADH-6 are compared in Figure 13 under tensile and reversed loading fatigue (R = 0.1 and -1). Although the two adhesives differ significantly in terms of toughness as discussed later, the fatigue S-N results are similar. The more brittle adhesive, ADH-1, failed quickly after crack initiation (Figure 2), while crack growth was slow for ADH-6, eventually involving stable cracks from both notches.
Figure 12. Lap shear fatigue data and curve fits for tensile, reversed and compressive loading (R = 0.1, -1 and 10), adhesive ADH-1, 3.25 mm adhesive thickness, 25.4 mm overlap length.

Figure 13. Lap shear fatigue data and curve fits for tensile and reversed loading (R = 0.1 and -1), adhesives ADH-1 and ADH-6, 3.25 mm adhesive thickness, 25.4 mm overlap length. FEA of Notched Lap Shear Test. A finite element study was carried out in parallel with the experimental work to assist in test development and the interpretation of results. The general character of the strain distribution is similar to that in other joint geometries, with an elastic stress concentration area in the notch root, and more uniform stresses and strains away from the adhesive edge. Figure 14 gives typical mesh details near the notch root, and Table 2 gives analysis details and (measured) adhesive properties. Most structural paste adhesives show significant nonlinear response prior to failure. Tomblin, et al, have reported on the in-situ shear response of several paste adhesives [13]. Adhesive properties for this FEA study were determined from tensile tests on 3.25 mm thick bulk adhesive cast sheets. Figure 15 gives typical tensile and compressive stress-strain curves for the neat ADH-1 adhesive, and Figure 16 gives the multi-linear representation used in the nonlinear FEA runs. The actual tensile failure strains in the tensile tests varied significantly from specimen to specimen (Figure 15), with cracks initiating at pores as was also observed in the lap shear tests. The adhesive is stronger and more ductile in compression. FEA results for maximum principal (tensile) strain similar to Figure 2 show the maximum tensile strain in the notch root area is 58% higher for the 12.7 mm overlap geometry than for the 25.4 mm overlap, for the same applied force of 4.45 kN. This would suggest lower apparent shear strength, τapp at failure, for the longer overlap, as reported in Figure 9(c). The force at failure should be significantly higher for the longer overlap since the overlap length, L, is twice

as long. Similarly, for the same force (and the same τapp due to the same 25.4 mm length), the maximum elastic tensile strain increases as the adhesive thickness increases. To predict joint strength trends from FEA analysis, it is assumed that failure occurs at a local value of the maximum tensile strain at the notch root (not including porosity). The average static apparent shear strength of the standard 3.25 mm thick, 25.4 mm overlap length, ADH-1 case was 13.6 MPa, yielding an applied force of 8.95 kN. At this applied force, the maximum calculated local tensile strain at failure, ε1, was 0.01428 for the elastic analysis, and 0.01524 for the nonlinear analysis. These calculated strains are consistent with the tensile stress-strain data (ultimate tensile strains) in Figure 15. The FEA runs were then redone for the other length and thicknesses (assuming the same local maximum tensile strain component at failure as for the standard case), to back-calculate a predicted load and apparent shear stress at failure for these cases. Table 3 indicates good agreement between predicted and experimental strengths for the 12.7 mm long and 6.50 and 9.75 mm thick adhesive joint cases. Figure 17 compares the experimental thickness data with the FEA predictions. The consistency of the neat adhesive stress-strain data, fracture surfaces (crack origin at the predicted location and normal to the maximum tensile stress), and agreement between predicted and experimental trends suggest that the local maximum tensile strain is a suitable failure criterion for this adhesive and geometry. The calculated joint stiffness variation indicates that significant deflections will occur as adhesive thickness increases, for the same load.
Table 2. Notched lap shear adhesive joint finite element analysis details
Element description
ANSYS Plane 183, 8-node quadrilateral (large deflections, nonlinear material options)
Material Properties
Laminate: Ex = 41.7 GPa; Ey = 14.1 GPa; Gxy = 4.7 GPa; xy = 0.263 Adhesive: E = 2.62 GPa, = 0.35 (nonlinear follows stress-strain curve)
Mesh 25 elements through adhesive thickness, more with pores Boundary Conditions
Imposed displacement on grip area to top of notch
If the adhesive behaved in a more ductile fashion, and the local strain could achieve higher levels, the problem would become strongly nonlinear. These effects as well as the influence of pore size and location will be explored further in the full paper.

Figure 14. Typical finite element mesh near notch radius.
Figure 15. Tension and compression stress-strain test results for adhesive ADH-1, neat adhesive cast samples.

Figure 16. Nonlinear tensile stress-strain representation
Figure 17. Experimental vs. FEA predicted apparent shear strength as a function of adhesive thickness, 25.4 mm overlap length.

Table 3. Experimental and FEA predicted apparent shear strength as a function of overlap length and adhesive thickness (FEA based on 25.4 mm long, 3.25 mm thick case).
Apparent shear strength, MPa Loading
Overlap length,
mm
Thickness, mm Experimental
data Linear
prediction* Nonlinear
prediction**tension 25.4 3.25 14.1 14.1 14.1 tension 25.4 6.50 10.2 11.0 11.0 tension 25.4 9.75 8.81 8.76 8.79 tension 12.7 3.25 21.6 17.8 17.9
compression 25.4 3.25 37.3 50.9 - - * failure strain = 0.01428 ** failure strain = 0.01524 B. Cracked Lap Shear Tests Reversed loading fatigue crack growth data for adhesives ADH-1 and ADH-6 are given in Figure 17. Data are in four groups in different GTot ranges, reflecting the four load levels applied; GTot values were calculated from Figure 5 using the (blue) adhesive crack curve. The data are separated into three groups according to GI/GII ratio, which varies with crack length (Figure 5). Crack growth rates were higher for both adhesives at higher GI/GII ratios, representing shorter cracks. Crack growth exponents were between 4.0 and 4.6 in all cases, similar to those reported in the literature for cracked lap specimens with thin epoxy adhesive layers [14]. The fatigue fracture surface in Figure 18 shows crack growth inside the laminate surface, along the top of the reinforcement for ADH-1; cracks for ADH-6 were similar at low crack growth rates, with more cohesive growth near the interface at higher growth rates.

Figure 17. Reversed loading fatigue crack growth data from cracked lap shear specimen separated by GI/GII ratio: ADH-1 (top) and ADH-6.

Figure 18. Fracture surface for cracked lap shear test, ADH-1(Left) and ADH-6 (Right). C. Mode I DCB Tests Static Mode I DCB tests (Figure 6) were carried out for adhesives ADH 1, 5 and 6. This type of test has also been shown to work well for mode I fatigue crack growth [5], which is planned for the future in this program. Matching fracture surfaces for typical specimens of the three adhesives are shown in Figure 19. Crack growth was brittle and unstable in nature for the ADH-1 and ADH-5 adhesives, but stable in all cases for ADH-6. The crack generally grew along the mid-thickness of the adhesive layer for ADH-1 and ADH-6, but undulated from top to bottom for ADH-5, remaining mostly within the adhesive. The crack tip was near the mid adhesive thickness for all data reported. As evident in Figure 19, ADH-6 showed some effects of the starter crack insertion process; as a result, data were used only for crack lengths exceeding 75 mm for ADH-6. (Eq. (1) accounts for crack length effects on the calculated GIc.) The results summary is given in Table 4. The GIc average values ranged from a low of 581 J/m2 for ADH-1 to 1626 J/m2 for ADH-6, with ADH-5 intermediate at 938 J/m2. Standard deviations were typical for this type of testing.

Figure 19. Matching DCB fracture surface comparison for the three adhesives
Table 4. DCB adhesive GIc results
Adhesive Average GIC (Std. Dev.), J/m2 ADH-1 581 (81) ADH-5 938 (119) ADH-6 1626 (125)
IV. Conclusions
The three test methods described in this report, all adaptations from studies reported in the adhesives literature, can provide important data for thick paste adhesive joints under a full range of loading conditions experienced in the wind turbine blade application. The notched lap shear and cracked lap shear geometries are sufficiently stiff to accommodate compressive loads without excessive out-of-plane deflection; further FEA study of boundary condition interactions is needed to improve the analysis for the non-symmetric geometries with laterally constrained grips.

The notched lap shear test results for static loading explore a variety of parameters. Little effect is shown for different material batches (although significant porosity is introduced by the hand mixing), loading rates or laminate peel plies. Significant effects of overlap length, adhesive thickness and applied load direction (tension vs. compression) are shown, largely resolved by finite element analysis using a maximum local tensile strain failure criterion based on neat adhesive tests. The six paste adhesives tested show a range of notched lap shear strength. Fatigue data were obtained for three loading conditions (tension, reversed loading and compression) with two blade adhesives, one relatively brittle (ADH-1) and the other relatively tough (ADH-6). Fatigue results were similar for the two adhesives despite their toughness difference, which was evident in the crack propagation phase of the lifetime. The fracture mechanics based test methods with artificial starter cracks use the strain energy release rate as a metric for static fracture and fatigue crack growth. The mixed mode cracked lap shear test was run under reversed loading to obtain fatigue crack growth data for the two adhesives ADH-1 and ADH-6; the data were separated by the GI/GII ratio, which varies with crack length for this geometry. Crack growth rates were higher for higher GI/GII ratios. The cracks for both adhesives propagated inside the laminate surface, along the top of the reinforcement, with the exception at higher growth rates of some growth inside the adhesive, next to the interface, for ADH-6. The two adhesives performed similarly in these tests. The mode I DCB test produced crack growth down the adhesive mid-thickness for the three adhesives tested. The static GIc average values ranged from a low of 581 J/m2 for ADH-1 to 1626 J/m2 for ADH-6, with ADH-5 intermediate at 938 J/m2. Acknowledgements This research was supported by Sandia National Laboratories, Tom Ashwill, technical manager. The support and encouragement of the many industry materials suppliers is greatly appreciated. References 1. Mandell, J. F., Samborsky, D.D., Agastra, P., Sears, A.T. and Wilson, T.J., “Analysis of SNL/MSU/DOE Fatigue Database Trends for Wind Turbine Blade Materials,” Sandia Contractor Report, To Be Published (draft available on www.coe.montana.edu/composites/). 2. Samborsky, D.D., Sears, A., Mandell, J.F. and Kils, O., “Static and Fatigue Testing of Thick Adhesive Joints for Wind Turbine Blades,” paper AIAA-2009-1550, AIAA/ASME, Orlando, 2009. 3. Nuin, I., et. al., “Fracture mechanics techniques for the design of structural components with adhesive joints for wind turbines,” F M Paper 461, EWEC, 2009. 4. Petrie, E.M., “Handbook of Adhesives and Sealants, Second Edition,” McGraw-Hill, New York, 2007. 5. Kinloch, A.J. and Osiyemi, S.O., J. Adhesion, vol. 43, 1993, pp.79-90. 6. Tomblin, J., Seneviratne, W., Escobar, P. and Yap, Y., “Fatigue and Stress Relaxation of Adhesives in Bonded Joints,” FAA Report DOE/FAA/AR-03/56, October, 2003. 7. Nijssen, R.P.L., "Fatigue Life Prediction and Strength Degradation of Wind Turbine Rotor Blade Composites," Contractor Report SAND2006-7810P, Sandia National Laboratories, Albuquerque, NM, 2006.

8. Sutherland, H. J. and Mandell, J. F., “Optimized Goodman Diagram for the analysis of Fiberglass Composites Used in Wind Turbine Blades,” ASME J. Solar Energy Engineering, 127:563-569, 2005. 9. Agastra, P. and Mandell, J. F., “Testing and simulation of damage growth at ply drops in wind turbine blade materials,” SAMPE 2010, Seattle, May, 2010. 10. Flinn, B. and Phariss, M., “The effect of peel ply surface preparation variables on bond quality,” DOT/FAA/AR-06/28, U.S. DOT/FAA, Wash. D.C., August, 2006. 11. Tomblin, J., Harter, P., Seneviratne, W., and Yang, C., “Characterization of Bondline Thickness Effects in Adhesive Joints,” J. Composites Tech. and Res., 24:80-92, 2002. 12. Wetzel, K.K., “Defect tolerant design of wind turbine blades,” EWEC, 2009 13. Tomblin, J., Seneviratne, W., Escobar, P. and Yap, Y., “Shear Stress-Strain Data for Structural Adhesives,” FAA Report DOE/FAA/AR-02/97, November, 2002. 14. Johnson, W.S. and Mall, S., “A Fracture Mechanics Approach to Designing Adhesively Bonded Joints,” NASA Technical Memorandum 85694, NTIS, Springfield, VA, 1983.