fatigue: total life approaches - materials engineering @ iisc
TRANSCRIPT

Fatigue:
Total Life Approaches
1

Fatigue Design ApproachesStress-Life/Strain-Life
Long before the LEFM-based approaches (e.g. Paris Law, 1963) to characterize fatigue failure were developed, the importance of cyclic loading in causing failures (e.g. raiload axles) was recognized. Starting
2
failures (e.g. raiload axles) was recognized. Starting with the work of A. Wöhler (1860), who did rotating bend tests on various alloys, empirical methods have been developed. In this lecture we present two empirically-based design approaches, the stress-lifeapproach and the strain-life approach.
Cyclic LoadingDefinitions
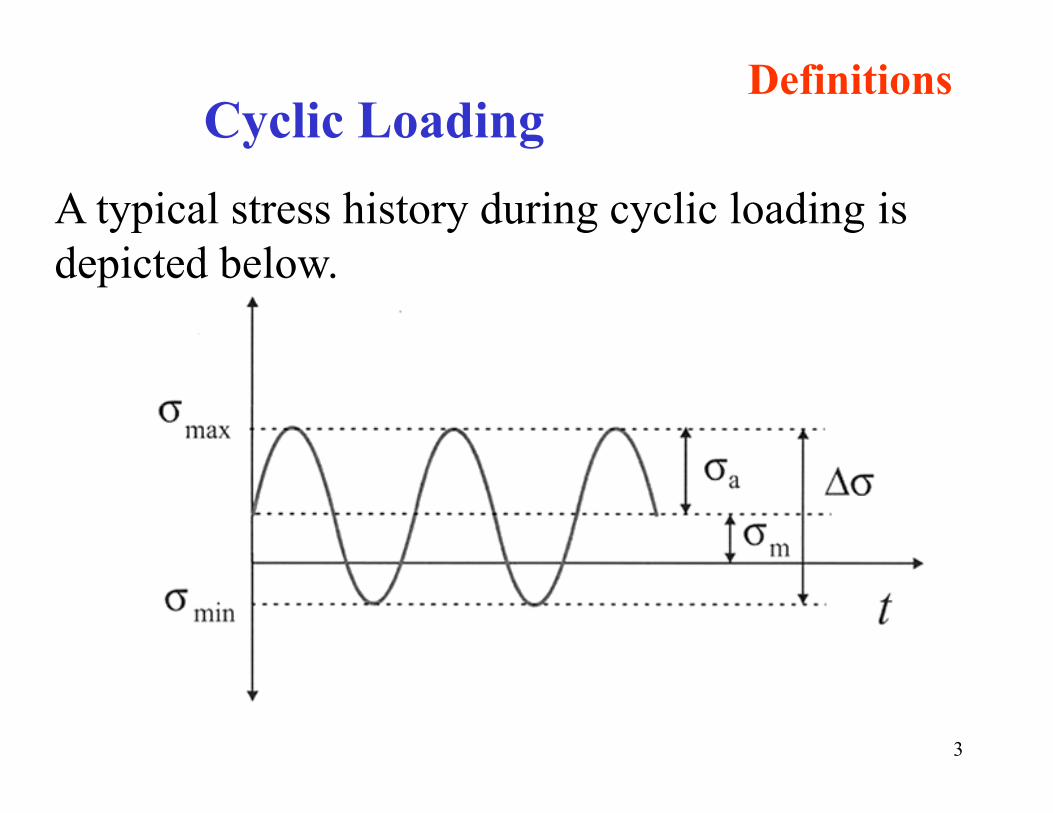
A typical stress history during cyclic loading is depicted below.
3

What are the important parameters to characterize a given cyclic loading history?
• Stress Range: minmax
• Stress amplitude: minmax2
1 a
4
• Stress amplitude: minmax2a
• Mean stress: minmax2
1 m
• Load ratio:max
min
R

• Frequency: ν or f in units of Hz. For rotating machinery at 3000 rpm, f = 50 Hz. In general only influences fatigue if there are environmental effects present, such as humidity or elevated temperatures.
• Waveform: Is the stress history a sine wave,
5
• Waveform: Is the stress history a sine wave, square wave, or some other waveform? As with frequency, generally only influences fatigue if there are environmental effects.

S - N CurveIf a plot is made of the applied stress amplitude versus the number of reversals to failure (S-N curve) the following behavior is typically observed:
6

S - N Curve Endurance Limit
If the stress is below σe (the endurance limit or fatigue limit), the component has effectively infinite life.
σe≈ 0.35σTS - 0.50σTS for most steels and
7
σe≈ 0.35σTS - 0.50σTS for most steels and copper alloys.
If the material does not have a well defined σe, often σe is arbitrarily defined as the stress that gives Nf=107.

Fatigue Design Approaches
Stress-Life Approach
If a plot is prepared of log(σa ) versus log (2Nf ) (where 2Nf represents the number of reversals to failure, one cycle equals two reversals) a linear relationship is commonly observed. The following relationship
8
commonly observed. The following relationship between stress amplitude and lifetime (Basquin, 1910) has been proposed:
bffa N22

In the previous expression σf′ is the fatigue strength
coefficient (for most metals ≈ σf , the true fracture strength), b is the fatigue strength exponent orBasquin’s exponent (≈ -0.05 to -0.12), and 2Nf is the
9
Basquin’s exponent (≈ -0.05 to -0.12), and 2Nf is thenumber of reversals to failure.

The total fatigue life of a component can be considered to have two parts, the initiation life and the propagation life, as depicted below.
10
Fatigue Design ApproachesMean Stress Effects
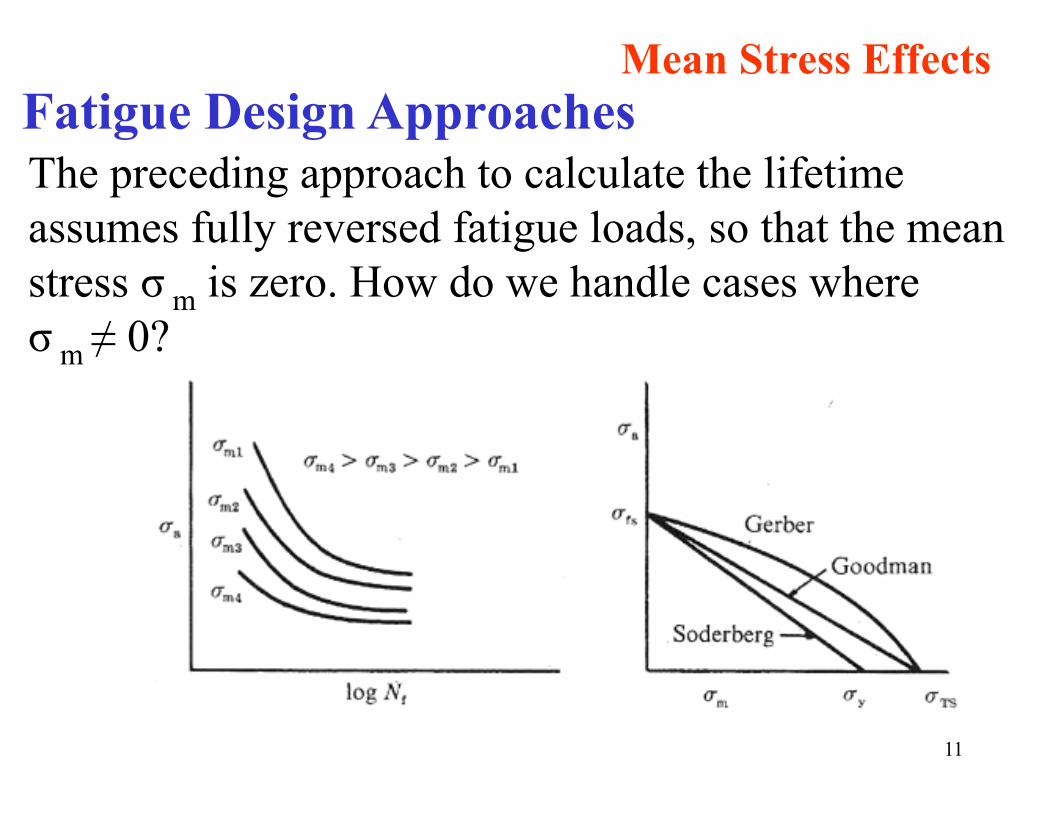
The preceding approach to calculate the lifetime assumes fully reversed fatigue loads, so that the mean stress σ m is zero. How do we handle cases where σ m ≠ 0?
11

Soderbergy
maa
m
10
Goodmanmaa
m
10
12
GoodmanTS
aam
1
0
GerberTS
maa
m
2
01

In the previous expressions, σ a is the stress amplitude denoting the fatigue strength for a nonzero mean stress,
is the stress amplitude (for a fixed life) for fully reversed loading (σ m = 0 and R = -1), and σ y and σTS are the yield strength and the tensile strength, respectively.
0ma
13
Soderberg gives a conservative estimate of the fatigue life.
Gerber gives good predictions for ductile alloys fortensile mean stresses. Note that it cannot distinguish between tensile and compressive mean stresses.
Fatigue Design ApproachesDifferent Amplitudes
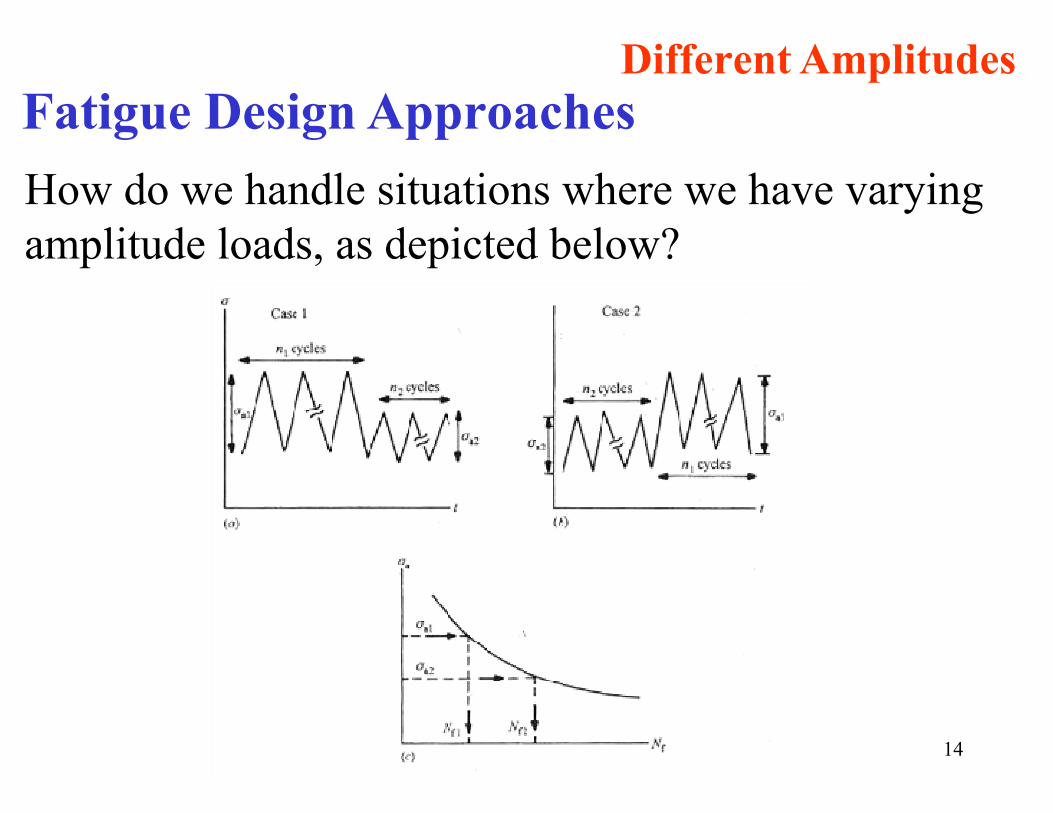
How do we handle situations where we have varying amplitude loads, as depicted below?
14
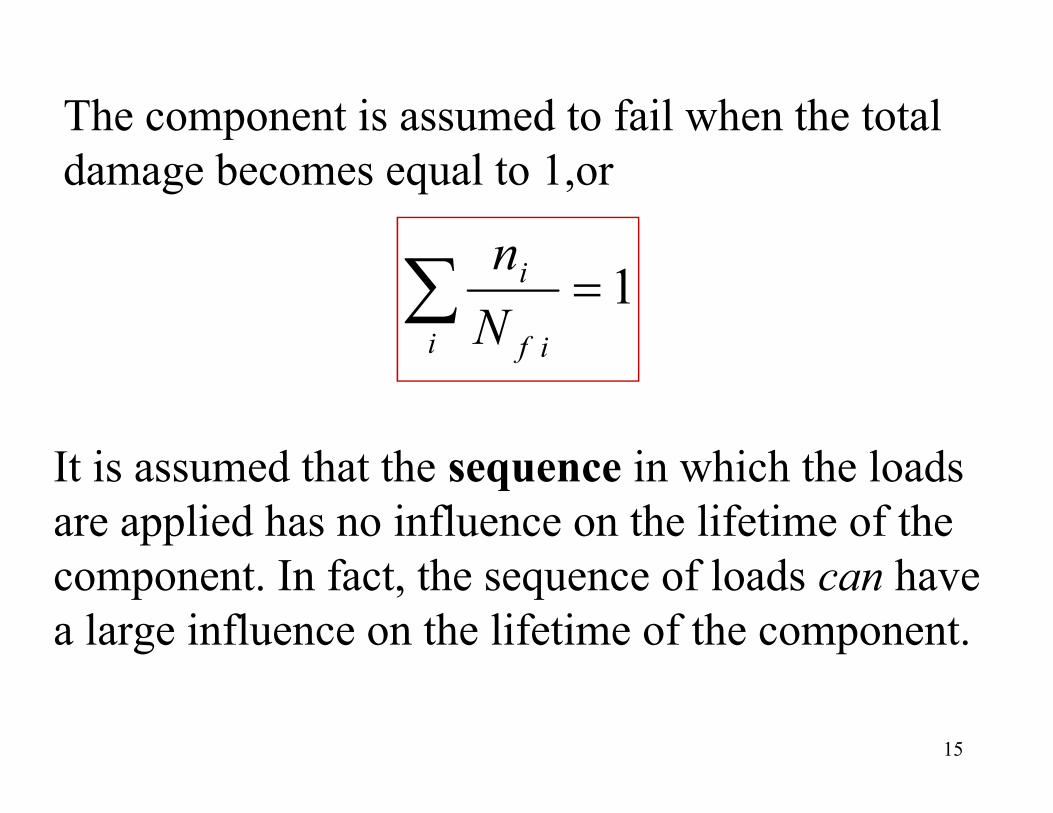
The component is assumed to fail when the total damage becomes equal to 1,or
1i if
i
N
n
15
It is assumed that the sequence in which the loads are applied has no influence on the lifetime of the component. In fact, the sequence of loads can have a large influence on the lifetime of the component.

A very common approach is the Palmgren-Miner linear damage summation rule.
If we define 2Nf i as the number of reversals to failure at σ ai , then the partial damage d for each different loading σ ai is
16
different loading σ ai is
ai
ai
fi
i
N
nd
atfailuretoReversals
atReversals
2
2

Consider a sequence of two different cyclic loads, σa1 and σa2. Let σa1 > σa2 .
Case 1: Apply σa1 then σa2 .
In this case, can be less than 1. During the i
i
N
n
17
In this case, can be less than 1. During the first loading (σa1 ) numerous microcracks can be initiated, which can be further propagated by the second loading (σa2 ).
iifN

Case 2: Apply σa2 then σa1 .
iif
i
N
nIn this case can be greater than 1. The first loading (σa2) is not high enough to cause any microcracks, but it is high enough to strain harden the material. Then in the second loading
18
harden the material. Then in the second loading (σa1), since the material has been hardened it is more difficult to initiate any damage in the material.
Fatigue Design Approaches
Strain-Life Approach
The stress-life approach just described is applicable for situations involving primarily elastic deformation. Under these conditions the component is expected to have a long lifetime. For situations involving high
19
have a long lifetime. For situations involving high stresses, high temperatures, or stress concentrations such as notches, where significant plasticity can be involved, the approach is not appropriate. How do we handle these situations?

Rather than the stress amplitude σa, the loading is characterized by the plastic strain amplitude Under these conditions, if a plot is made of versus log(2Nf ), the following linear behavior is generally observed:
.2/p
2log p
20

To represent this behavior, the following relationship (Coffin-Manson, 1955) has been proposed:
cffp N2
2
21
2where is the plastic strain amplitude, is the fatigue ductility coefficient (for most metals ≈ ,the true fracture ductility) and c is the fatigue ductility exponent (-0.5 to -0.7 for many metals).
2/p ff

Fatigue Design ApproachesGeneral Approach
In general, how does one know which equation to apply (stress-life or strain-life approach)? Consider a fully reversed, strain-controlled loading. The total strain is composed of an elastic and plastic part, i.e.
22
222pe
The Coffin-Manson expression may used to express the term . What about ?2/p 2/e

From the Basquin Law (stress-life approach):
bff N22
For 1-D, elastic loading and thus
EE ae /2/2/
23
and thus
bffe N
E2
2
and we may write that:
cffb
ff NN
E22
2

Fatigue Design Approaches
A plot of this is depicted below:
24

Fatigue Design Approaches HCF/LCF
If the amplitude of the total strain is such that we have significant plasticity, the lifetime is likely to be short (Low Cycle Fatigue or LCF; strain life approach). Ifthe stresses are low enough that the strains are elastic, the lifetime is likely to be long (High Cycle Fatigue
25
the lifetime is likely to be long (High Cycle Fatigue or HCF; stress-life approach).
The transition life (at 2Nt) is found by setting the plastic strain amplitude equal to the elastic strain amplitude.
ctf
bt
f NNE
22

cb
f
ft
EN
1
2
At long component lifetimes (N >> Nt), the elastic strain is more dominant and strength will control performance. At short component lifetimes (N << Nt ),
26
performance. At short component lifetimes (N << Nt ),plastic strain dominates, and ductility will control performance. Unfortunately, in most materials improvements in strength lead to reductions in ductility, and vice-versa.

Important: These total life approaches represent crack initiation life in smooth specimens. However, engineering materials contain inherent defects.Therefore, these approaches can lead to overestimation of useful life.
27
overestimation of useful life.

Fatigue Crack InhibitionShot-Peening
Shot peening is a cold working process in which the surface of a part is bombarded with small spherical media called shot. Each piece of shot striking the surface acts as a tiny peening hammer, imparting to the
28
surface acts as a tiny peening hammer, imparting to the surface a small indentation or dimple. The net result is a layer of material in a state of residual compression. It is well established that cracks will not initiate or propagate in a compressively stressed zone.

Since nearly all fatigue and stress corrosion failures originate at the surface of a part, compressive stresses induced by shot peening provide considerable increases in part life. Typically the residual stress produced is at least half the yield strength of the material being peened.
29
material being peened.
The benefits of shot peening are a result of the residual compressive stress and the cold working of the surface.

Residual stress: Increases resistance to fatigue crack growth, corrosion fatigue, stress corrosion cracking, hydrogen assisted cracking, fretting, galling and erosion caused by cavitation.
Cold Working: Benefits include work hardening
30
(strengthening), intergranular corrosion resistance, surface texturing, closing of porosity and testing the bond of coatings.

Fatigue Crack InhibitionShot-Peening
Applications
• Blades, buckets, disks and shafts for aircraft jet engines; (e.g., blade roots are peened to prevent fretting, galling and fatigue).
• Crank shafts used in ground vehicles.• Shot peening of plasma-spray-coated components
31
• Shot peening of plasma-spray-coated components before and after spraying.
• Shot peening of gears used in automotive and heavy vehicle components, marine transmissions, small power tools and large mining equipment.
• Compression coil springs in automobiles.• Peening and peen forming of wing skin for aircraft.

Residual stresses are those stresses remaining in a part after all manufacturing operations are completed, and with no external load applied. In most applications for shot peening, the benefit obtained is the direct result of the residual compressive stress produced.
Fatigue Crack InhibitionShot-Peening
32
the residual compressive stress produced.

A typical residual stress profile created by shot peening is shown below:
33

The beneficial effect of shot peening in improving the endurance limit is depicted below:
34