fault analysis and evaluation module for power system ... · pdf filefault analysis and...
TRANSCRIPT

Page 1
Fault Analysis and Evaluation Module for Power System Monitoring
E_wineve
1MRB520153-Ben
Issued: August 2003Changed since March 2003
Data subject to change without notice
Introduction High-voltage transmission and distribution networks are the backbone of modern power generation and distribution systems. Faults on the transmission system can lead to severe economic losses. Rapid information about the type and the location of the fault can assist the task of repair and maintenance, thereby minimizing the economic effects of power interruption.
The E_wineve fault analysis and evaluation module belongs to the software suite "Power System Monitoring”, abbreviated PSM. After a line fault, it supports quickly the oper-ator in the control centre with the localisation of the fault. This is the most relevant informa-
tion directly after a line trip. Proper actions can immediately be arranged to shorten the outage time and restore electricity and full network availability.
In addition, protection engineers are using E_wineve to analyze all generated distur-bance records, making good use of the highly flexible evaluation and calculation features. This leads to a better understanding of com-plex effects in the network, weak spots in the network are detected and settings are accu-rately adjusted or protection schemas are improved, which in the long-term results in a decreasing number of faults. Therefore higher reliability of the network is achieved.
User benefits The E_wineve fault analysis and evaluation module reduces down time of the transmis-sion or distribution lines and supports the quick restoration of power.
E_wineve assists the operator by generating automatically a “short fault report” in case of a line fault. It can be configured to print these reports dependent on different configurable conditions. Only relevant reports are gener-ated and irrelevant reports are suppressed. This supplies the operator with the right information at the right time during demand-ing situation after a line trips.
The short report, generated by E_wineve contains precise fault location and informa-tion about the fault type. This reduces eco-nomic impact of outages since the repair team can reach the faulted section of line faster. This reduces the time to put the line back into service.
Seen in the long-term, E_wineve increases the reliability of the power network and mini-mises the damage resulting from faults in transmission and distribution systems and in power generation systems. This can be achieved using the strong and user-friendly analyzing functions of E_wineve. Calcula-tions can easily be programmed using the point and click icons. Related disturbance

Fault Analysis and Evaluation Module for Power System Monitoring
ABB Switzerland LtdUtility Automation Systems
E_wineve1MRB520153-Ben
Page 2
User benefits (cont’d) records can be merged and many other func-tions can be applied to analyze disturbance records. Using this information the protection engineer will uncover secondary effects in the
power system and might optimize the settings of his assets, which results in a more robust power network.
Application The E_wineve fault analysis and evaluation system can be used to evaluate disturbances recorded in the following devices:
• Dedicated disturbance recorders - ABB INDACTIC 650
• Integrated disturbance recorders - ABB protection devices
• 3rd party dedicated disturbance recorders• 3rd party integrated disturbance recorders
- protection devices.
E_wineve can handle various standard and proprietary file formats of the disturbance recording, for example:
• COMTRADE IEEE C 37.111 - 1991• ABB proprietary formats
- INDACTIC format- EVE format- REVAL format.
The E_wineve system can run on Microsoft Windows 2000 or Windows NT computer for evaluation and analysis of faults in the fol-lowing areas:
• Distribution, transmission and sub-trans-mission levels
• Power supply of industrial plants and the auxiliary supply of power plants
• Power generation systems, generator, transformer and transmission protection systems.
Functions E_wineve has a number of functions and fea-tures tailored to the needs and requirements of the user:
• Visualization/display• Merging of two disturbance record files• Automatic fault location with automatic
printout of the "short fault report"• Manual fault location• Display and printout of the signal vectors• Application-specific mathematical calcu-
lation of the waveforms• Information regarding pre-fault, fault and
post-fault conditions• Time calculation based on the values of the
digital signals• Selective printing of fault reports• Data base and statistical analysis of the
fault location, fault types.
Visualization/display• In the file open menu selection of the dis-
turbance files to be displayed as per spe-cific period of day, month or year
• On-screen analysis support by means of:- simultaneous display of several distur-
bance record files
- cursor lines that can be positioned to a numeric time value
- zooming in/zooming out the interesting part of a display by expanding the ampli-tude and/or time axis
- display of individual signals or grouping of several signals on one time axis, e.g. all voltages on the same horizontal axis
• Selection of the colors for each of the ana-log and digital signals from the standard MS office color palette
• User-customized view settings, for exam-ple amplitude size, axis height, signal col-ors, time axis zoom, can be stored into 10 so-called user profile layouts
• Opening the disturbance record file in the- ABB Indactic EVE format- COMTRADE file format IEEE C37.111-
1991- REVAL format
• Saving the disturbance record file in- the Indactic EVE format- the COMTRADE file format IEEE
C37.111-1991• Printout of the disturbance record file on
commercially available color printers or plotters
Fault Analysis and Evaluation Module for Power System Monitoring
E_wineve1MRB520153-Ben
Page 3
ABB Switzerland LtdUtility Automation Systems
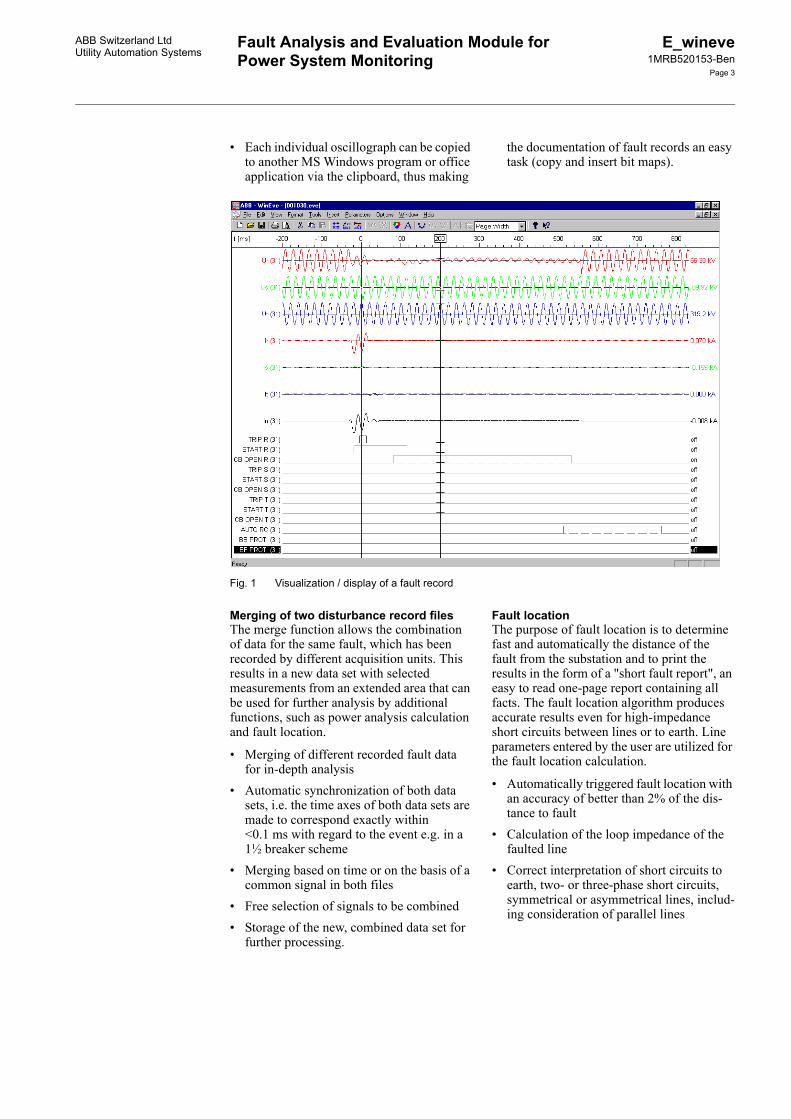
• Each individual oscillograph can be copied to another MS Windows program or office application via the clipboard, thus making
the documentation of fault records an easy task (copy and insert bit maps).
Fig. 1 Visualization / display of a fault record
Merging of two disturbance record filesThe merge function allows the combination of data for the same fault, which has been recorded by different acquisition units. This results in a new data set with selected measurements from an extended area that can be used for further analysis by additional functions, such as power analysis calculation and fault location.
• Merging of different recorded fault data for in-depth analysis
• Automatic synchronization of both data sets, i.e. the time axes of both data sets are made to correspond exactly within <0.1 ms with regard to the event e.g. in a 1½ breaker scheme
• Merging based on time or on the basis of a common signal in both files
• Free selection of signals to be combined• Storage of the new, combined data set for
further processing.
Fault locationThe purpose of fault location is to determine fast and automatically the distance of the fault from the substation and to print the results in the form of a "short fault report", an easy to read one-page report containing all facts. The fault location algorithm produces accurate results even for high-impedance short circuits between lines or to earth. Line parameters entered by the user are utilized for the fault location calculation.
• Automatically triggered fault location with an accuracy of better than 2% of the dis-tance to fault
• Calculation of the loop impedance of the faulted line
• Correct interpretation of short circuits to earth, two- or three-phase short circuits, symmetrical or asymmetrical lines, includ-ing consideration of parallel lines

Fault Analysis and Evaluation Module for Power System Monitoring
E_wineve1MRB520153-Ben
Page 4
ABB Switzerland LtdUtility Automation Systems
Functions (cont´d)Functions (cont´d) • Better accuracy of the results by means of individual matching of input circuits, con-sideration of mutual coupling impedance and zero impedance, elimination of source impedance and fault resistance influence, and by multiple fault location calculations using different parameters (summer/winter etc.)
• Printout of fault history in tabular form for use in graphical displays with typical spreadsheet programs such as Excel; dis-play of time, distance to fault and imped-ance vector of the line loop.
The information printed out in the "short report" (see Fig. 2) is the following:
• Information about the fault record- Name of the acquisition unit recording
the disturbance
- Number of the acquisition device- Date and time on the disturbance record- Information of the line name and line
length- The complete directory path and name
of the disturbance fault record- Duration of the fault record
• Information regarding the trigger of the recording
• Information regarding the disturbance and location of the fault- Fault type- Fault duration- Impedance at the fault in polar and carte-
sian format- Distance to the fault.
Fig. 2 "Short Fault Report"

Fault Analysis and Evaluation Module for Power System Monitoring
E_wineve1MRB520153-Ben
Page 5
ABB Switzerland LtdUtility Automation Systems
Power analysis calculationThe power analysis calculation can be used to derive useful data for in-depth fault analysis by means of additional calculations and com-bining of recorded signals. For example, the analysis of harmonics provides a measure of the quality of a voltage. It also permits the calculation of the effective short-circuit pow-er which has led to a damage of switching elements, using the measured short-circuit currents and voltages. The loop impedance as a function of time (impedance and phase an-gle) derived from the sequence of the voltage and current is another possible calculation.
• Sum, difference, multiplication and divi-sion, average of input signals
• Pre-programmed function for calculation- RMS values - impedance and power vectors - harmonic contents- frequency deviation
• Formula editor, on-line syntax check, and test execution of the calculation program
• Linking the stored calculation for auto-matic execution.
Fig. 3 Power analysis calculation functions

Fault Analysis and Evaluation Module for Power System Monitoring
E_wineve1MRB520153-Ben
Page 6
ABB Switzerland LtdUtility Automation Systems
Functions (cont´d)Functions (cont´d) The power analysis calculation can be utili-zed to calculate the polar impedance value and the angle, and thereby to further calculate the cartesian impedance values - the real and imaginary values - R and jX. These values can be exported to an Excel spreadsheet and
plotted as an impedance chart, whereby the trajectory of the fault impedance can be plot-ted and coordinated with the setting of the protection relay.
Fig. 4 Fault history in tabular form - exported to Excel
Expert fault reporting and time calculation functionThe expert function is an extension of the automatic fault location system. The expert function helps in executing additional calcu-lations for working out the short-circuit dura-tion as well as the line voltage and current signal vectors. The results of such a calcula-tion take the form of printed summaries and text files. (See Fig. 5: Expert fault location report).
• Fast fault summary "short fault report" - automatically printed out and stored as a text file
• A typical recording contains the short cir-cuit time, type of fault, distance to the fault, duration of the fault, short circuit impedance
• Pre-fault, fault and post-fault values of the voltages and currents, phase and angle val-ues for the time before and after the fault occurred, as well as after a return to nor-mal conditions
• Application-specific analysis of digital signals using the formula editor, e.g. ana-lysis of digital signals taking chronological interdependence into consideration
• Formula editor with BASIC-like syntax• Selective printout of the fault report (see
Fig. 6).

Fault Analysis and Evaluation Module for Power System Monitoring
E_wineve1MRB520153-Ben
Page 7
ABB Switzerland LtdUtility Automation Systems
Fig. 5 Expert fault location report

Fault Analysis and Evaluation Module for Power System Monitoring
E_wineve1MRB520153-Ben
Page 8
ABB Switzerland LtdUtility Automation Systems
Functions (cont´d)Functions (cont´d)
Fig. 6 Selective printing of fault report and time calculation formula editor
Data base and statistical analysisIndBase is a data base for the management and statistical analysis of fault location results and expert analysis. Each fault that occurs is managed as a data set, in which the most im-portant values are stored.
• A typical recording contains the station number and name, event number and date, trigger type and criterion, line name, type of fault, distance to fault and fault duration
• The records in the data base can be sorted out in ascending or descending order based on 4 priority levels of sorting keys. The keys can be selected from any of the fol-lowing attributes (see Fig. 7):- Disturbance record, fault location report,
directory path and file names - Station number, station name and line
name
- Event number, event date and time- Trigger type- Fault distance, fault duration, fault type
• Extended search functions in data base, query on the following (see Fig. 8):- Station- Line- Fault type- Date from - to- Fault distance- Fault duration- Fault trigger types
• File administration with editing function for adding/deleting records, and storing the configuration data for output of the records of the data base on screen (see Fig. 9)
• Data export as text file.

Fault Analysis and Evaluation Module for Power System Monitoring
E_wineve1MRB520153-Ben
Page 9
ABB Switzerland LtdUtility Automation Systems
Fig. 7 Sort function of the expert data base
Fig. 8 Search function of the records in the data base

Fault Analysis and Evaluation Module for Power System Monitoring
ABB Switzerland LtdUtility Automation Systems
E_wineve1MRB520153-Ben
Page 10
Functions (cont’d)
Fig. 9 Configuration of the on-screen output of the disturbance records
Variants / packages
The E_wineve evaluation system is available in the following variants:
Fig. 10 Variants / Packages of E_wineve
RelViewThe RelView variant is the basic entry level of the E_wineve. The functionality comprises the display/view of the fault records, analog and digital signals.
ProfessionalThe Professional variant provides advanced functionality in addition to the features avail-able with the RelView variant.
Visualization/Display
RelView
Visualization/Display Merge
FaultLocation
PowerAnalysis
Calculation
Professional
Visualization/Display Merge
FaultLocation
PowerAnalysis
Calculation
ExpertFault
Reporting
TimeCalculation
StatisticalAnalysis
Expert1. RelView2. Professional3. Expert

Fault Analysis and Evaluation Module for Power System Monitoring
E_wineve1MRB520153-Ben
Page 11
ABB Switzerland LtdUtility Automation Systems
The advanced functionalities are:
• automatic or manual fault location - "short fault report"
• merge of two or more fault recorders into a new file
• batch-mode: disturbance record file oscil-lography - analog and digital signals - is automatically printed out
• power analysis calculation.
Any desired power analysis calculation can be programmed and the values can be dis-played as a function of time, along with the original analog and digital signals. The calcu-lated signals are stored along with the origi-nal signals.
ExpertThe Expert variant is an advanced extension of the Professional variant, and provides functionality for quick overview and analysis, and statistical information of system-wide faults in the transmission and distribution net-work.
The additional functionality comprises the selective printout of the fault location report, calculation of the operating times of the switchgear and the protection equipment.
In addition all the system-wide fault reports can be stored in the data base and evaluated as per user-specific search and sort criteria.
Ordering information
Remarks:• This data sheet considers E_wineve version 1.0 to 1.4 of software suite Power System Moni-
toring PSM V1.0 to PSM V1.4.
• The successor of the software described here is PSM 505, V1.5. See Chapter “Other relevant documents”.
Description SW variant License type Ordering numberSoftware installation CD all all 1MRB260034R0099License key RelView Single-user 1MRB260034R0001
Professional Single-user 1MRB260034R0011Professional Multi-user license 1MRB260034R0012Expert Single-user license 1MRB260034R0021Expert Multi-user license 1MRB260034R0022
30-day Trial license key Expert Single-user On request:[email protected]
User manual ENGLISH 1MRB520290-UenGERMAN 1MRB520290-Ude
Fault Analysis and Evaluation Module for Power System Monitoring
ABB Switzerland LtdUtility Automation Systems
E_wineve1MRB520153-Ben
Page 12
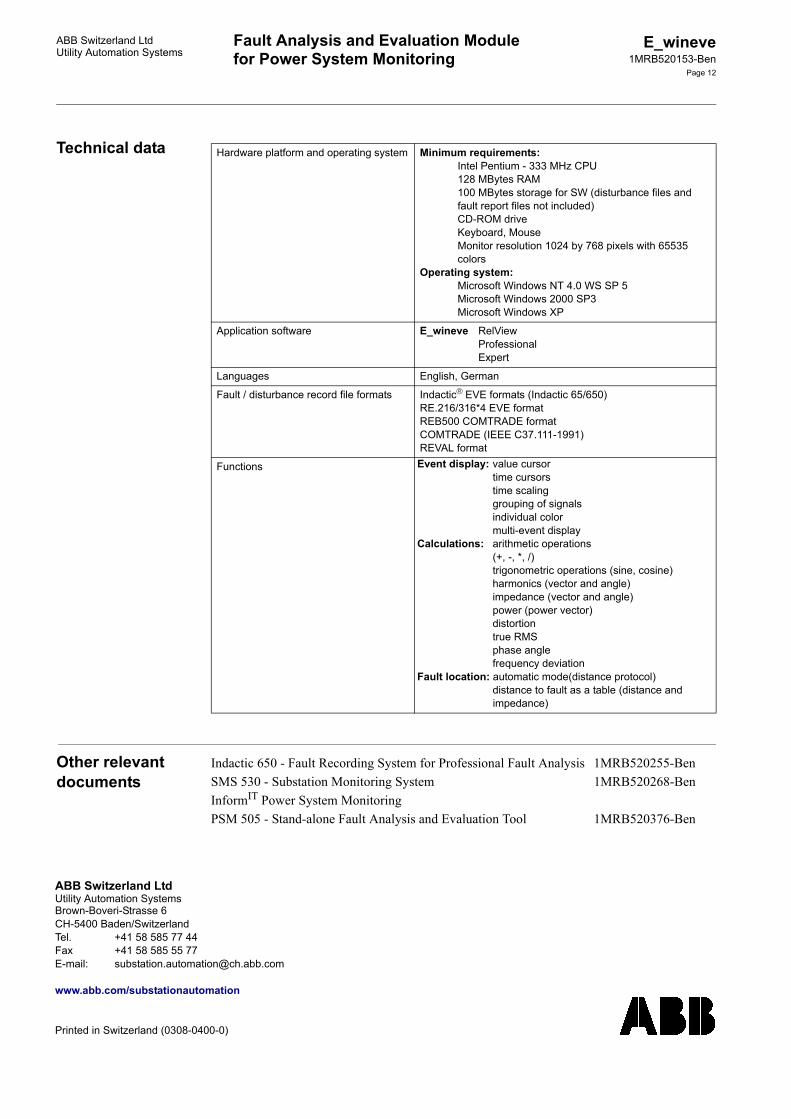
Technical data
Other relevant documents
Indactic 650 - Fault Recording System for Professional Fault Analysis 1MRB520255-BenSMS 530 - Substation Monitoring System 1MRB520268-BenInformIT Power System MonitoringPSM 505 - Stand-alone Fault Analysis and Evaluation Tool 1MRB520376-Ben
Hardware platform and operating system Minimum requirements:Intel Pentium - 333 MHz CPU128 MBytes RAM100 MBytes storage for SW (disturbance files and fault report files not included)CD-ROM driveKeyboard, MouseMonitor resolution 1024 by 768 pixels with 65535 colors
Operating system:Microsoft Windows NT 4.0 WS SP 5Microsoft Windows 2000 SP3Microsoft Windows XP
Application software E_wineve RelViewProfessionalExpert
Languages English, German
Fault / disturbance record file formats Indactic EVE formats (Indactic 65/650)RE.216/316*4 EVE formatREB500 COMTRADE formatCOMTRADE (IEEE C37.111-1991)REVAL format
Functions Event display: value cursor time cursors
time scalinggrouping of signalsindividual colormulti-event display
Calculations: arithmetic operations (+, -, *, /)trigonometric operations (sine, cosine)harmonics (vector and angle)impedance (vector and angle)power (power vector)distortiontrue RMSphase anglefrequency deviation
Fault location: automatic mode(distance protocol)distance to fault as a table (distance and impedance)
ABB Switzerland LtdUtility Automation SystemsBrown-Boveri-Strasse 6CH-5400 Baden/SwitzerlandTel. +41 58 585 77 44Fax +41 58 585 55 77E-mail: [email protected]
www.abb.com/substationautomation
Printed in Switzerland (0308-0400-0)