fault location in distribution systems based on smart feeder meters
DESCRIPTION
holaTRANSCRIPT
IEEE TRANSACTIONS ON POWER DELIVERY, VOL. 29, NO. 1, FEBRUARY 2014 251
Fault Location in Distribution SystemsBased on Smart Feeder Meters
Fernanda C. L. Trindade, Student Member, IEEE, Walmir Freitas, Member, IEEE, andJosé C. M. Vieira, Member, IEEE
Abstract—This paper proposes a fault-location method basedon smart feeder meters with voltage sag monitoring capability.The main idea is to explore voltage measurements from monitorsplaced in different buses of distribution systems to estimate thefault location. The estimation is achieved by relating the voltagedeviation measured by each meter to the fault current calculatedbased on the bus impedance matrix, considering the fault indifferent points. In order to improve the method accuracy, theloads are represented by constant impedance models and includedinto the bus impedance matrix. The performance of the proposedmethod is demonstrated by using a real distribution system.Sensitivity studies results show that the method is robust sinceit has good performance for different values of fault resistance,quantity, and location of the smart meters.
Index Terms—Fault location, power distribution, smart feedermeter, voltage measurement.
I. INTRODUCTION
M OTIVATED by the recent advances in communica-tion and measurement systems, utilities have been
seeking efficient solutions for improving distribution systemsmonitoring and automation. These advances include two-waycommunication of the meter, data-management system, andreal-time access to information, such as consumption, voltagesags, power outages, etc. [1], [2]. As a result, smart feeder andconsumer meters can achieve potential applications beyondmeter reading for billing purposes. For example, in [3], theusage of feeder meters, which are installed in primary net-works, is discussed as a cost-effective solution for distributionmonitoring and automation.An important potential application of those meters is related
to fault management, since faults result in outages and lead toreliability and power-quality (PQ) problems such as voltagesags, temporary and sustained interruptions, and high opera-tional costs. In this context, one of the main issues related to
Manuscript received January 28, 2013; revised May 17, 2013; accepted June25, 2013. Date of publication July 16, 2013; date of current version January21, 2014. This work was supported by FAPESP, CAPES, Brazil, and CAPES,Brazil. Paper no. TPWRD-00127-2013.F. C. L. Trindade andW. Freitas are with the Department of Electrical Energy
Systems, University of Campinas (UNICAMP), Campinas 13083-852, Brazil(e-mail: [email protected]; [email protected]).J. C. M. Vieira is with the Department of Electrical and Computer Engi-
neering, Sao Carlos School of Engineering/USP, São Carlos 13566-590, Brazil(e-mail: [email protected]).Color versions of one or more of the figures in this paper are available online
at http://ieeexplore.ieee.org.Digital Object Identifier 10.1109/TPWRD.2013.2272057
fault management are fault-location techniques [4] since rea-sonably high-accuracy fault-location schemes enable reducingcosts and time for energy supply restoration.Traditionally, in distribution systems, fault-location tech-
niques are based on manual outage mapping using consumerscalls, fundamental voltage, and current components measuredonly at the substation and network electrical parameters. How-ever, several methods have been recently proposed to takeadvantage of advanced metering systems. There are methodsbased on automated outage mapping [5], [6] or voltage sagsource detection [7]–[10], which indicate a probable area(region) that may contain the faulted bus instead of pointingout a strict fault location. There are also invasive methods.For instance, in [11], the fault-location method requires theinjection of sinusoidal signals with two different frequenciesinto the faulted distribution line. Thus, by using signal ex-traction techniques and mathematical processing, permanentsingle-phase-to-ground faults can be located.Another class of methods uses the voltage and current
measured at the substation, sparse voltage measurements, andthe network electrical parameters to estimate the fault location[12]–[14]. Their performance can be considerably affected bythe fault resistance, and additional solutions are necessary inorder to deal with this uncertainty. For instance, an iterativeprocess dedicated to fault resistance estimation is used in [13].These additional techniques can increase the complexity of thefault-location methods.In order to overcome some of the drawbacks observed in pre-
vious fault-location methods and aggregate value to the smartfeeder meters, this work proposes a robust fault-location tech-nique that explores the voltage sag measurement capability ofthese devices and fundamentals of the short-circuit theory. Oncea fault is detected and classified, the proposed method can beused to locate faults at the distribution system by using mea-surements from smart meters installed at the primary network.These smart feeder meters, which will be referred to simply as“feeder meters” in this paper, can be polled (triggered) every-time a fault is detected to provide the information demanded bythe proposed method under request [15]. Sensitivity study re-sults have shown that the proposed method presents good per-formance for different values of fault resistance, quantity, andlocation of the feeder meters as well as measurement and loadestimation errors.This paper is organized as follows. Section II presents the
proposed method as well as a general view of how the feedermeters can be used to improve the fault-location methods.Sections III–V provide simulation results and sensitivity
0885-8977 © 2013 IEEE. Personal use is permitted, but republication/redistribution requires IEEE permission.See http://www.ieee.org/publications_standards/publications/rights/index.html for more information.

252 IEEE TRANSACTIONS ON POWER DELIVERY, VOL. 29, NO. 1, FEBRUARY 2014
analyses, respectively, to evaluate the performance of theproposed method. The method performance considering thepresence of dynamic loads is presented in Section VI. Discus-sions about the proposed method compared to other methods areshown in Section VII. Conclusions are given in Section VIII.
II. PROPOSED FAULT-LOCATION METHOD
The proposed fault-location method is based on the moni-toring capability of feeder meters and on short-circuit theory.According to [15], several smart meter models are able to reportoutages and measure voltage with an accuracy class that typi-cally ranges from 0.1 to 0.5%. The main idea of the proposedmethod for fault location is to exploit such capability, so that thevoltage sag information can be processed to calculate a fault-lo-cation index, which indicates the bus closest to the fault point.Everytime a fault is detected, themeters are polled to provide thevoltage rms value just before and during the fault occurrence. Inaddition, in the results presented here, the voltage rms value wascalculated by using a sampling rate of 64 samples/cycle. Thetheoretical background of the method is presented as follows.By using the voltage magnitude measured by a feeder meter,
it is possible to obtain the voltage deviation as follows:
(1)
where the subscript is related to a feeder meter installed atbus ; and are the voltage magnitudes measuredduring and before the fault (prefault), respectively; and super-script represents each phase, so that one has the voltage de-viation on phase , , and . If the bus is under fault, onecan estimate the fault current at each phase by using the voltagedeviation determined by meter based on the following expres-sion:
for (2)
where is the 3 3 submatrix from the systemthree-phase bus impedance matrix , as discussed inAppendix A, and is the fault current calculated byusing the voltage measurement from meter and consideringa fault at bus . Note that the loads, represented by constantimpedance models, must be included into the bus impedancematrix to improve the method accuracy. In order to includethe loads in the bus impedance matrix, all of the loads are rep-resented by constant impedance models. Then, the equivalentshunt impedances associated with the bus are included at thematrix elements [16]. The load estimation can be done by usingtypical load curves or based on the information provided bysmart consumer meters. The influence of the loads in methodperformance is analyzed in Section IV-A. and in Appendix A.Therefore, if one has meters, there are estimated
fault currents based on the assumption that the bus under faultis bus . If the fault really occurred at bus , all of the estimatedcurrents must have practically the same value, which is close tothe real value. On the other hand, if the fault occurred at anyother bus, there will be an error on the fault current estimatedbased on measurements from each meter . In addition, the error
Fig. 1. Illustration of the index meaning .
obtained based on different meters will be distinct from eachother.Based on the aforementioned explanation, a fault-location
index can be used to identify the actual bus under fault. Thisindex is given by the sum of the differences between theestimated fault current values taking into consideration that busis under fault and their average value (each difference is re-
ferred to as ), as shown in (3) and Fig. 1
(3)
where is the fault current calculated for phase withmeasurements from the feeder meter at bus using (2), and
is the average of all the fault current values calculatedusing the voltage measured at each feeder meter for bus . Asmentioned before, if the bus under analysis is the faulted bus, allof the estimated currents will be practically the same. Thus, thebus associated with the minimum is selected as the faultedbus.Typically, feeder meters supply only voltage magnitudes;
however, in (2) and (3), currents are written as phasor quanti-ties. In order to numerically calculate these expressions, it wasassumed that phases , , and are simply shifted by 120 ,although distribution systems are unbalanced. Note that suchan assumption was used only for calculation purposes. In theresults presented in this paper, the system was unbalanced sothat the phase currents are not really shifted by 120 ; even so,the proposed method shows good performance. The influenceof this assumption is investigated in Section V. When onlyvoltage magnitude is used, there is no need for synchronization;since all meters are simultaneously polled by the same faultevent, decreasing the costs and complexity.For certain situations, numerically, the minimum may be
associated with more than one bus , indicating multiple esti-mation. In order to deal with such cases and improve the methodperformance, automated outage mapping can be used, as de-scribed in the following section.
A. Automated Outage Mapping
The communication among the feeder and consumer metersand the control center allows monitoring de-energized metersand, consequently, determining the part of the network that is
TRINDADE et al.: FAULT LOCATION IN DISTRIBUTION SYSTEMS 253
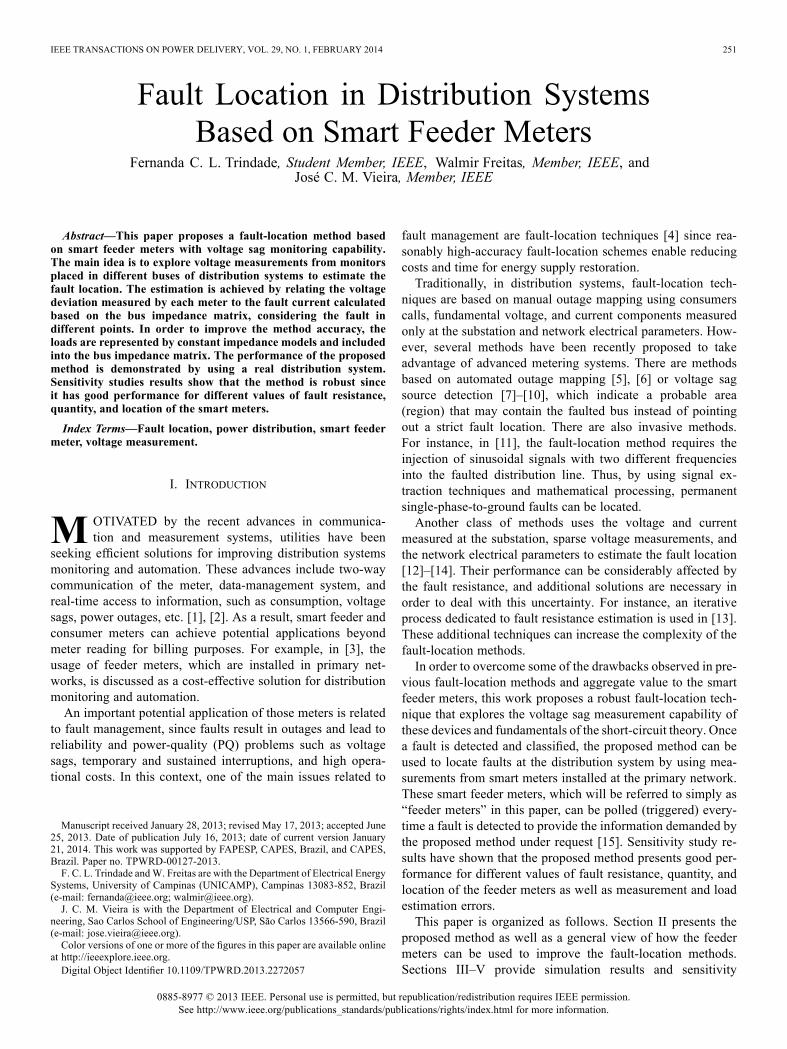
Fig. 2. Distribution feeder outage mapping.
de-energized. By incorporating data from the geographic infor-mation system (GIS), the outage mapping can speed up and au-tomate the typical manual process of fault location, which de-pends on consumer calls.With smart meters, one can automatically build the outage
mapping by monitoring the de-energized transponders. As a re-sult, the chances of indicating a wrong bus as the faulted busand multiple estimation occurrences can be minimized or eveneliminated. An example of such an application can be observedin the feeder of Fig. 2. In this system, if a fault occurs down-stream the recloser R1 (fault 1), it will cause its opening, andthe feeder meters M3 to M6 would report the outage in Zone1. Therefore, the fault-location method could consider this in-formation in order to decrease the search space as well as thechances of indicating the wrong bus as the faulted bus. In caseof fault 2, if the fuse F3 blows, outage mapping would indicatea fault occurrence in an even reduced zone (Zone 2), since M3would be the only meter to report the outage.The outage mapping can be combined with the proposed
fault-location method using two different approaches asfollows.• The first option consists in exploring the outage mappingto decrease the search space in the fault-location process.In this case, the computing demand is reduced. However,this alternative requires polling several meters in order toidentify the affected zone, increasing the data traffic.
• The second option is based on applying outage mappingonly in cases of multiple estimation, so that specific metersare polled in order to support the decision of which localrefers to the affected one. In comparison to the first option,even though the entire feeder is used as the search spaceof the fault-location method (increasing the computationaleffort), the data traffic is reduced.
Regardless of computational effort and data traffic, both op-tions give the same results, and, in the following sections, thefirst option will be employed.
B. Method Guidelines
The steps below summarize the method application after afault has been detected:Step 1) Construct the bus impedance matrix (this step
can be done offline).
Step 2) Read the voltage deviation measurements from thefeeder meters.
Step 3) Estimate the fault current of every bus in thesystem by using the feeder meters measurements,the matrix and (2).
Step 4) Calculate the average fault current .Step 5) Calculate the fault current index for each bus in
the system by using (3).Step 6) Indicate the bus associated with the lowest value
as the faulted bus.Step 7) If more than one bus (region) is pointed as the faulted
bus, automated outage mapping can be used to solvethe problem of multiple estimation.
In Step 1), as discussed previously, it is necessary to includethe loads represented by constant impedance models in thebus impedance matrix. This can be done by using typical loadcurves, which give information about the load behavior inthe time, or smart costumer meters, which report active andreactive powers each time interval. The bus impedance matrixcan be built offline taking into consideration the interval of loadupdate, for example, each 1 hour, or online each time a fault isdetected by using the correspondent information.
III. SIMULATION RESULTS
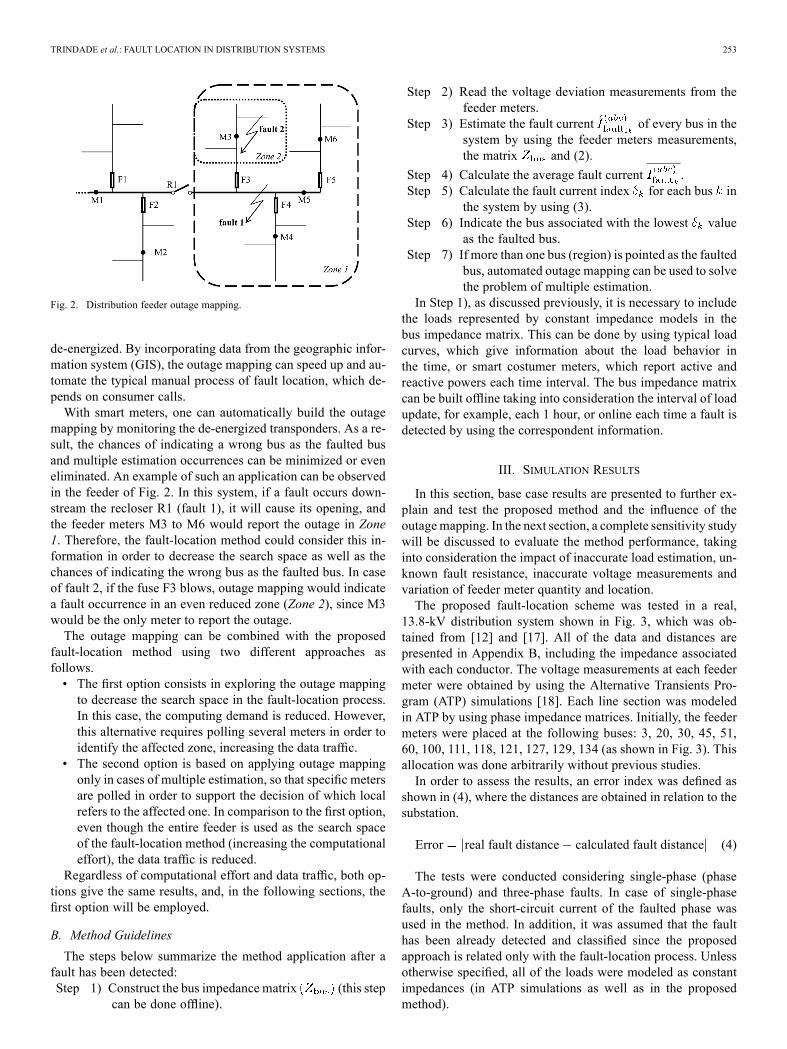
In this section, base case results are presented to further ex-plain and test the proposed method and the influence of theoutagemapping. In the next section, a complete sensitivity studywill be discussed to evaluate the method performance, takinginto consideration the impact of inaccurate load estimation, un-known fault resistance, inaccurate voltage measurements andvariation of feeder meter quantity and location.The proposed fault-location scheme was tested in a real,
13.8-kV distribution system shown in Fig. 3, which was ob-tained from [12] and [17]. All of the data and distances arepresented in Appendix B, including the impedance associatedwith each conductor. The voltage measurements at each feedermeter were obtained by using the Alternative Transients Pro-gram (ATP) simulations [18]. Each line section was modeledin ATP by using phase impedance matrices. Initially, the feedermeters were placed at the following buses: 3, 20, 30, 45, 51,60, 100, 111, 118, 121, 127, 129, 134 (as shown in Fig. 3). Thisallocation was done arbitrarily without previous studies.In order to assess the results, an error index was defined as
shown in (4), where the distances are obtained in relation to thesubstation.
Error real fault distance calculated fault distance (4)
The tests were conducted considering single-phase (phaseA-to-ground) and three-phase faults. In case of single-phasefaults, only the short-circuit current of the faulted phase wasused in the method. In addition, it was assumed that the faulthas been already detected and classified since the proposedapproach is related only with the fault-location process. Unlessotherwise specified, all of the loads were modeled as constantimpedances (in ATP simulations as well as in the proposedmethod).
254 IEEE TRANSACTIONS ON POWER DELIVERY, VOL. 29, NO. 1, FEBRUARY 2014
Fig. 3. Distribution test feeder used for evaluating the fault-location algorithm (data are given in Appendix B).
The faults were applied at each bus of the circuit, and theerrors were calculated and grouped into classes, in order to sim-plify the results analyses. These error classes were divided from0 to 400 m into intervals of 100 m, resulting in four classes. Inaddition, if the distance error is higher than 400 m, it is consid-ered that the method has failed to locate the fault region.
A. Results Without Outage Mapping
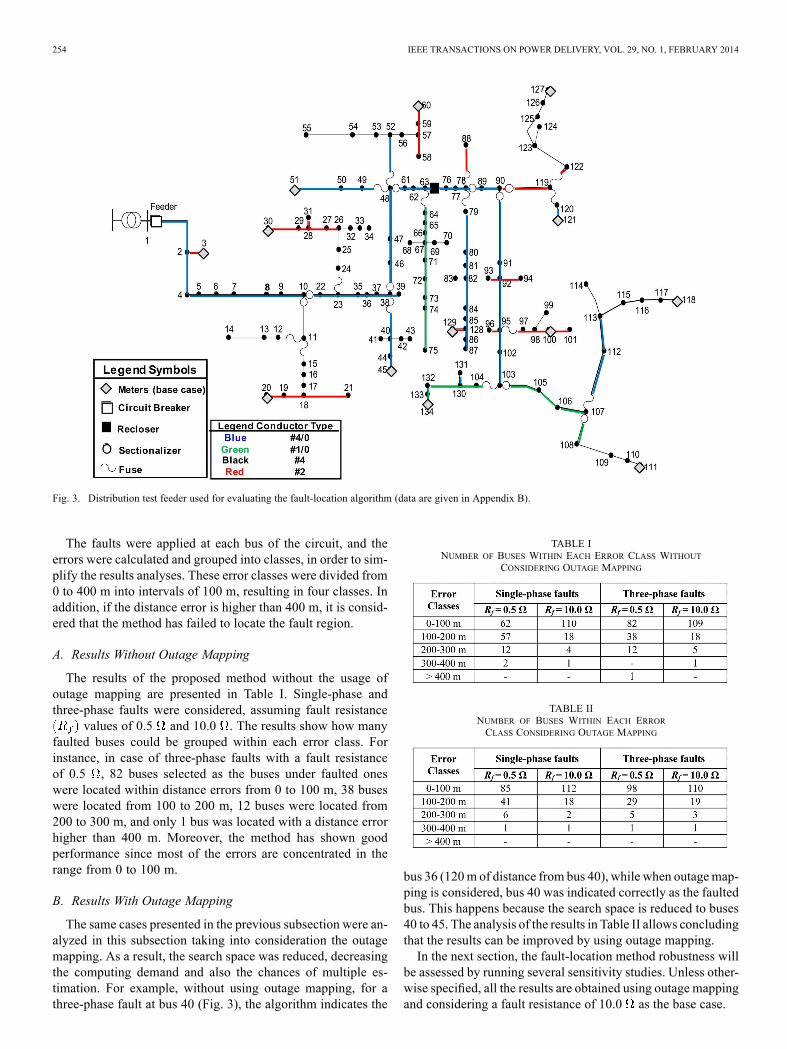
The results of the proposed method without the usage ofoutage mapping are presented in Table I. Single-phase andthree-phase faults were considered, assuming fault resistance
values of 0.5 and 10.0 . The results show how manyfaulted buses could be grouped within each error class. Forinstance, in case of three-phase faults with a fault resistanceof 0.5 , 82 buses selected as the buses under faulted oneswere located within distance errors from 0 to 100 m, 38 buseswere located from 100 to 200 m, 12 buses were located from200 to 300 m, and only 1 bus was located with a distance errorhigher than 400 m. Moreover, the method has shown goodperformance since most of the errors are concentrated in therange from 0 to 100 m.
B. Results With Outage Mapping
The same cases presented in the previous subsection were an-alyzed in this subsection taking into consideration the outagemapping. As a result, the search space was reduced, decreasingthe computing demand and also the chances of multiple es-timation. For example, without using outage mapping, for athree-phase fault at bus 40 (Fig. 3), the algorithm indicates the
TABLE INUMBER OF BUSES WITHIN EACH ERROR CLASS WITHOUT
CONSIDERING OUTAGE MAPPING
TABLE IINUMBER OF BUSES WITHIN EACH ERRORCLASS CONSIDERING OUTAGE MAPPING
bus 36 (120m of distance from bus 40), while when outagemap-ping is considered, bus 40 was indicated correctly as the faultedbus. This happens because the search space is reduced to buses40 to 45. The analysis of the results in Table II allows concludingthat the results can be improved by using outage mapping.In the next section, the fault-location method robustness will
be assessed by running several sensitivity studies. Unless other-wise specified, all the results are obtained using outage mappingand considering a fault resistance of 10.0 as the base case.
TRINDADE et al.: FAULT LOCATION IN DISTRIBUTION SYSTEMS 255
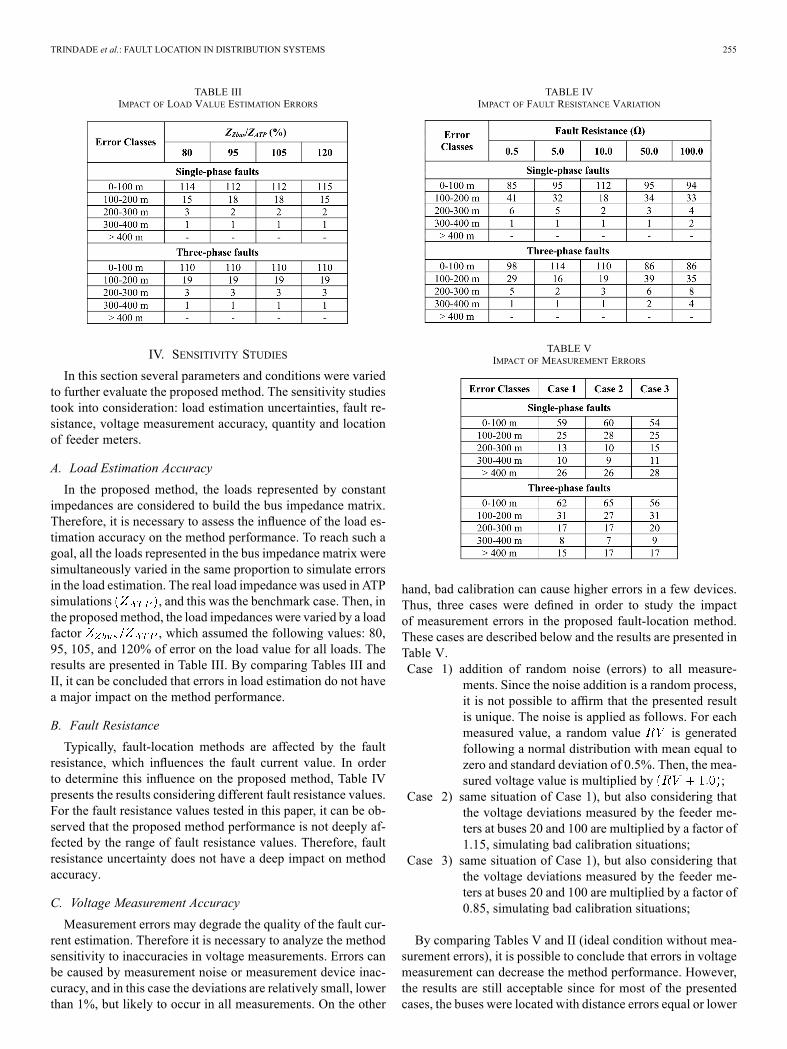
TABLE IIIIMPACT OF LOAD VALUE ESTIMATION ERRORS
IV. SENSITIVITY STUDIES
In this section several parameters and conditions were variedto further evaluate the proposed method. The sensitivity studiestook into consideration: load estimation uncertainties, fault re-sistance, voltage measurement accuracy, quantity and locationof feeder meters.
A. Load Estimation Accuracy
In the proposed method, the loads represented by constantimpedances are considered to build the bus impedance matrix.Therefore, it is necessary to assess the influence of the load es-timation accuracy on the method performance. To reach such agoal, all the loads represented in the bus impedance matrix weresimultaneously varied in the same proportion to simulate errorsin the load estimation. The real load impedance was used in ATPsimulations , and this was the benchmark case. Then, inthe proposedmethod, the load impedances were varied by a loadfactor , which assumed the following values: 80,95, 105, and 120% of error on the load value for all loads. Theresults are presented in Table III. By comparing Tables III andII, it can be concluded that errors in load estimation do not havea major impact on the method performance.
B. Fault Resistance
Typically, fault-location methods are affected by the faultresistance, which influences the fault current value. In orderto determine this influence on the proposed method, Table IVpresents the results considering different fault resistance values.For the fault resistance values tested in this paper, it can be ob-served that the proposed method performance is not deeply af-fected by the range of fault resistance values. Therefore, faultresistance uncertainty does not have a deep impact on methodaccuracy.
C. Voltage Measurement Accuracy
Measurement errors may degrade the quality of the fault cur-rent estimation. Therefore it is necessary to analyze the methodsensitivity to inaccuracies in voltage measurements. Errors canbe caused by measurement noise or measurement device inac-curacy, and in this case the deviations are relatively small, lowerthan 1%, but likely to occur in all measurements. On the other
TABLE IVIMPACT OF FAULT RESISTANCE VARIATION
TABLE VIMPACT OF MEASUREMENT ERRORS
hand, bad calibration can cause higher errors in a few devices.Thus, three cases were defined in order to study the impactof measurement errors in the proposed fault-location method.These cases are described below and the results are presented inTable V.Case 1) addition of random noise (errors) to all measure-
ments. Since the noise addition is a random process,it is not possible to affirm that the presented resultis unique. The noise is applied as follows. For eachmeasured value, a random value is generatedfollowing a normal distribution with mean equal tozero and standard deviation of 0.5%. Then, the mea-sured voltage value is multiplied by ;
Case 2) same situation of Case 1), but also considering thatthe voltage deviations measured by the feeder me-ters at buses 20 and 100 are multiplied by a factor of1.15, simulating bad calibration situations;
Case 3) same situation of Case 1), but also considering thatthe voltage deviations measured by the feeder me-ters at buses 20 and 100 are multiplied by a factor of0.85, simulating bad calibration situations;
By comparing Tables V and II (ideal condition without mea-surement errors), it is possible to conclude that errors in voltagemeasurement can decrease the method performance. However,the results are still acceptable since for most of the presentedcases, the buses were located with distance errors equal or lower
256 IEEE TRANSACTIONS ON POWER DELIVERY, VOL. 29, NO. 1, FEBRUARY 2014
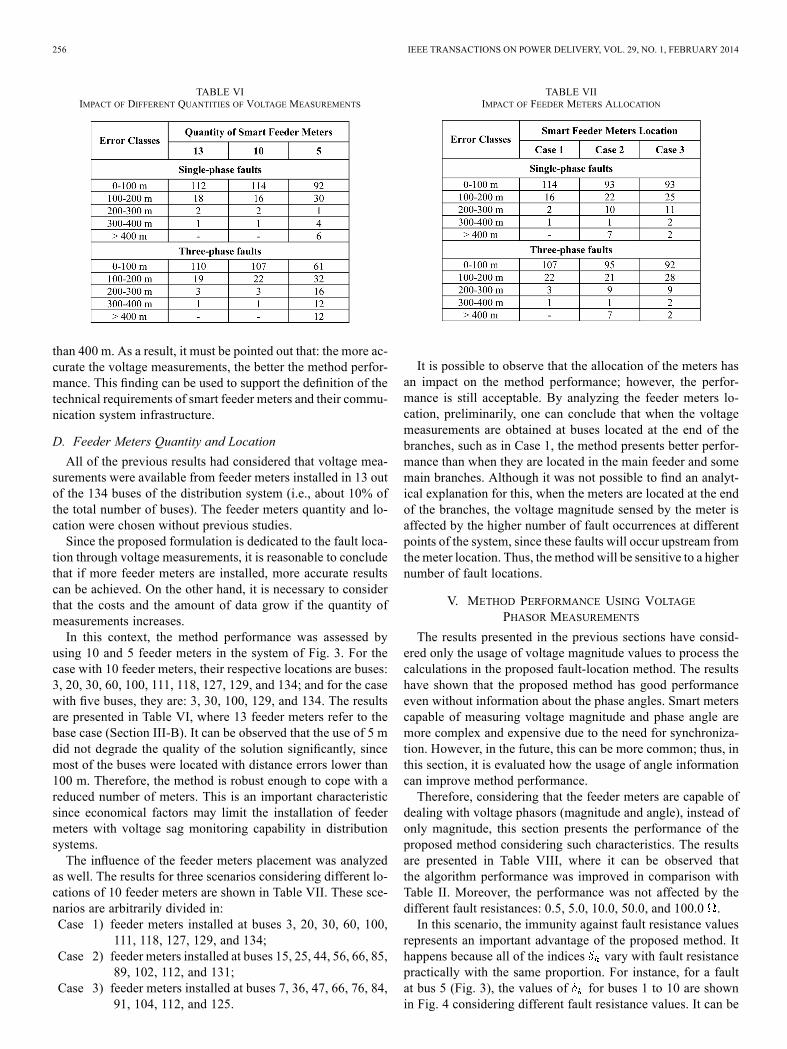
TABLE VIIMPACT OF DIFFERENT QUANTITIES OF VOLTAGE MEASUREMENTS
than 400 m. As a result, it must be pointed out that: the more ac-curate the voltage measurements, the better the method perfor-mance. This finding can be used to support the definition of thetechnical requirements of smart feeder meters and their commu-nication system infrastructure.
D. Feeder Meters Quantity and Location
All of the previous results had considered that voltage mea-surements were available from feeder meters installed in 13 outof the 134 buses of the distribution system (i.e., about 10% ofthe total number of buses). The feeder meters quantity and lo-cation were chosen without previous studies.Since the proposed formulation is dedicated to the fault loca-
tion through voltage measurements, it is reasonable to concludethat if more feeder meters are installed, more accurate resultscan be achieved. On the other hand, it is necessary to considerthat the costs and the amount of data grow if the quantity ofmeasurements increases.In this context, the method performance was assessed by
using 10 and 5 feeder meters in the system of Fig. 3. For thecase with 10 feeder meters, their respective locations are buses:3, 20, 30, 60, 100, 111, 118, 127, 129, and 134; and for the casewith five buses, they are: 3, 30, 100, 129, and 134. The resultsare presented in Table VI, where 13 feeder meters refer to thebase case (Section III-B). It can be observed that the use of 5 mdid not degrade the quality of the solution significantly, sincemost of the buses were located with distance errors lower than100 m. Therefore, the method is robust enough to cope with areduced number of meters. This is an important characteristicsince economical factors may limit the installation of feedermeters with voltage sag monitoring capability in distributionsystems.The influence of the feeder meters placement was analyzed
as well. The results for three scenarios considering different lo-cations of 10 feeder meters are shown in Table VII. These sce-narios are arbitrarily divided in:Case 1) feeder meters installed at buses 3, 20, 30, 60, 100,
111, 118, 127, 129, and 134;Case 2) feeder meters installed at buses 15, 25, 44, 56, 66, 85,
89, 102, 112, and 131;Case 3) feeder meters installed at buses 7, 36, 47, 66, 76, 84,
91, 104, 112, and 125.
TABLE VIIIMPACT OF FEEDER METERS ALLOCATION
It is possible to observe that the allocation of the meters hasan impact on the method performance; however, the perfor-mance is still acceptable. By analyzing the feeder meters lo-cation, preliminarily, one can conclude that when the voltagemeasurements are obtained at buses located at the end of thebranches, such as in Case 1, the method presents better perfor-mance than when they are located in the main feeder and somemain branches. Although it was not possible to find an analyt-ical explanation for this, when the meters are located at the endof the branches, the voltage magnitude sensed by the meter isaffected by the higher number of fault occurrences at differentpoints of the system, since these faults will occur upstream fromthe meter location. Thus, the method will be sensitive to a highernumber of fault locations.
V. METHOD PERFORMANCE USING VOLTAGEPHASOR MEASUREMENTS
The results presented in the previous sections have consid-ered only the usage of voltage magnitude values to process thecalculations in the proposed fault-location method. The resultshave shown that the proposed method has good performanceeven without information about the phase angles. Smart meterscapable of measuring voltage magnitude and phase angle aremore complex and expensive due to the need for synchroniza-tion. However, in the future, this can be more common; thus, inthis section, it is evaluated how the usage of angle informationcan improve method performance.Therefore, considering that the feeder meters are capable of
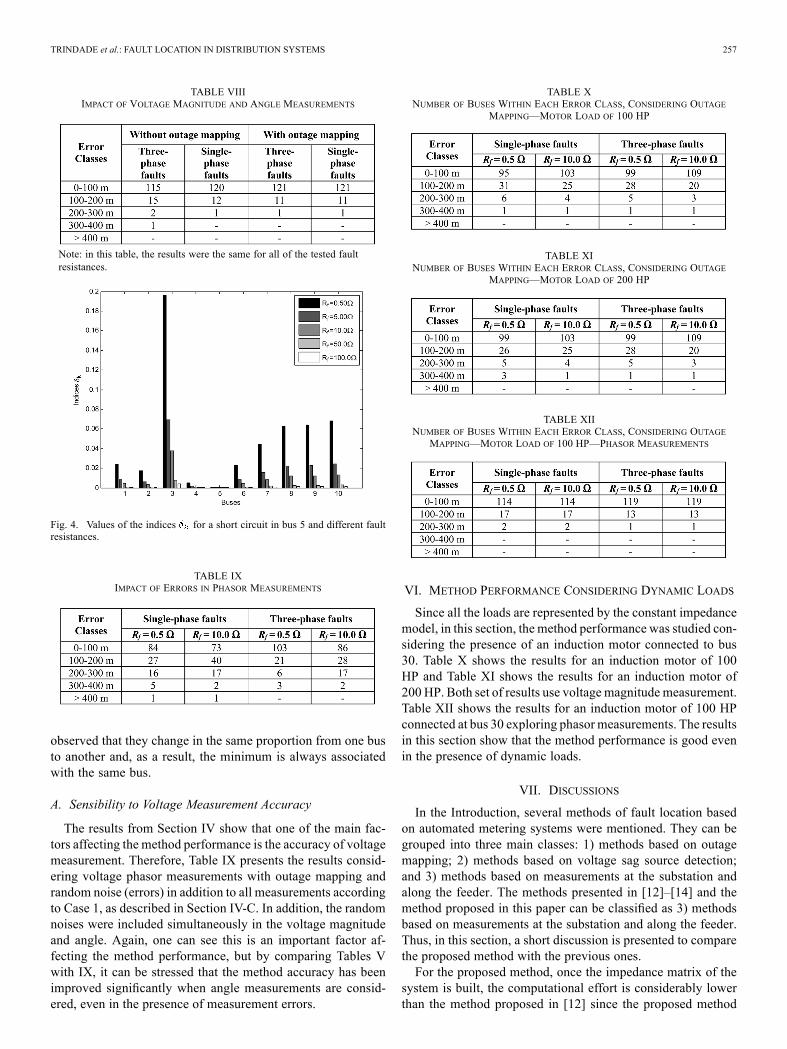
dealing with voltage phasors (magnitude and angle), instead ofonly magnitude, this section presents the performance of theproposed method considering such characteristics. The resultsare presented in Table VIII, where it can be observed thatthe algorithm performance was improved in comparison withTable II. Moreover, the performance was not affected by thedifferent fault resistances: 0.5, 5.0, 10.0, 50.0, and 100.0 .In this scenario, the immunity against fault resistance values
represents an important advantage of the proposed method. Ithappens because all of the indices vary with fault resistancepractically with the same proportion. For instance, for a faultat bus 5 (Fig. 3), the values of for buses 1 to 10 are shownin Fig. 4 considering different fault resistance values. It can be
TRINDADE et al.: FAULT LOCATION IN DISTRIBUTION SYSTEMS 257
TABLE VIIIIMPACT OF VOLTAGE MAGNITUDE AND ANGLE MEASUREMENTS
Note: in this table, the results were the same for all of the tested faultresistances.
Fig. 4. Values of the indices for a short circuit in bus 5 and different faultresistances.
TABLE IXIMPACT OF ERRORS IN PHASOR MEASUREMENTS
observed that they change in the same proportion from one busto another and, as a result, the minimum is always associatedwith the same bus.
A. Sensibility to Voltage Measurement Accuracy
The results from Section IV show that one of the main fac-tors affecting the method performance is the accuracy of voltagemeasurement. Therefore, Table IX presents the results consid-ering voltage phasor measurements with outage mapping andrandom noise (errors) in addition to all measurements accordingto Case 1, as described in Section IV-C. In addition, the randomnoises were included simultaneously in the voltage magnitudeand angle. Again, one can see this is an important factor af-fecting the method performance, but by comparing Tables Vwith IX, it can be stressed that the method accuracy has beenimproved significantly when angle measurements are consid-ered, even in the presence of measurement errors.
TABLE XNUMBER OF BUSES WITHIN EACH ERROR CLASS, CONSIDERING OUTAGE
MAPPING—MOTOR LOAD OF 100 HP
TABLE XINUMBER OF BUSES WITHIN EACH ERROR CLASS, CONSIDERING OUTAGE
MAPPING—MOTOR LOAD OF 200 HP
TABLE XIINUMBER OF BUSES WITHIN EACH ERROR CLASS, CONSIDERING OUTAGE
MAPPING—MOTOR LOAD OF 100 HP—PHASOR MEASUREMENTS
VI. METHOD PERFORMANCE CONSIDERING DYNAMIC LOADS
Since all the loads are represented by the constant impedancemodel, in this section, the method performance was studied con-sidering the presence of an induction motor connected to bus30. Table X shows the results for an induction motor of 100HP and Table XI shows the results for an induction motor of200 HP. Both set of results use voltage magnitude measurement.Table XII shows the results for an induction motor of 100 HPconnected at bus 30 exploring phasormeasurements. The resultsin this section show that the method performance is good evenin the presence of dynamic loads.
VII. DISCUSSIONS
In the Introduction, several methods of fault location basedon automated metering systems were mentioned. They can begrouped into three main classes: 1) methods based on outagemapping; 2) methods based on voltage sag source detection;and 3) methods based on measurements at the substation andalong the feeder. The methods presented in [12]–[14] and themethod proposed in this paper can be classified as 3) methodsbased on measurements at the substation and along the feeder.Thus, in this section, a short discussion is presented to comparethe proposed method with the previous ones.For the proposed method, once the impedance matrix of the
system is built, the computational effort is considerably lowerthan the method proposed in [12] since the proposed method

258 IEEE TRANSACTIONS ON POWER DELIVERY, VOL. 29, NO. 1, FEBRUARY 2014
is not iterative. Both methods require system parameters; how-ever, the method proposed in [12] runs several load flows whilethe proposed one applies a simple equation. On the other hand,the advantage of the method proposed in [12] is that typicallyfewer meters are needed.The fault-location method from [13] uses voltage phasors
from sparse measurements along the feeder to locate the faultin distribution systems. The fault-location process explores ashort-circuit program, a technique for fault resistance estima-tion and another for load estimation. According to the authors,the method can precisely indicate the fault location and doesnot suffer from multiple fault-location estimation imprecision.Since this method needs a stage for the estimation of fault resis-tance before its application, it is expected that the computationaleffort be higher and that the fault resistance values have moreinfluence on the results than the proposed method. In addition,the method presented in [13] demands the usage of global posi-tioning system (GPS) information, which is not typically avail-able in distribution systems.Finally, the method from [14] uses a formulation similar to
the method proposed here; however, in [14], estimating the faultcurrent bymeasuring all of the phasors of the currents injected inthe system (substation and distributed generation, for example)is proposed and the total sum of the measured currents is as-sumed to be the fault current. After the estimation of the faultcurrent value, the voltage deviation measured is compared to thecalculated voltage deviation. The disadvantage of this method isthat it needs synchronized measurements of voltage and currentphasors at every distributed generator and substation, increasingthe costs and complexities.
VIII. CONCLUSION
In this paper, the voltage measurement capability of feedermeters and the system bus impedance matrix were used to de-velop a robust fault-location method. The main findings of thisresearch are summarized as follows.• If feeder meters with voltage sag measurement capabilityare available, the proposed fault-location method can beeasily applied due to its simplicity, increasing the aggre-gated value of such devices.
• The results have shown that the method is robust sinceit presented good performance when several parameterswere varied, even for different fault resistance values.
• Automated outage mapping can improve the method per-formance by reducing the search space and the possibilityof multiple estimation.
Fig. 5. Example of the distribution system without representing the loads.
• The sensitivity studies showed that the method perfor-mance was satisfactory even with a reduced number ofmeters. This is an important finding since it may not beeconomically feasible to install many feeder meters in thedistribution system.
Some topics related to the proposed method require furtherinvestigation, such as the possibility of optimal placement of thefeeder meters dedicated to the proposed fault-location method,and the possibility of considering distributed generators, basedon their representation in the bus impedance matrix.
APPENDIX A
Different from traditional short-circuit analysis, the proposedfault-location method considers the loads in the construction ofthe bus impedance matrix. If the load is ignored in the proposedfault-location method, the fault-location index , calculatedfor many different buses, could assume the same value. Con-sequently, it would be challenging to identify the faulted bus.One illustrative example of this multiple estimation problem isshown, based on a simple single-phase distribution system pre-sented in Fig. 5.The bus impedance matrix , without considering the load
impedances of the circuit shown in Fig. 5 is given by the equa-tion shown at the bottom of the page.Considering the illustrative case with two feeder meters: one
at bus 3 and another at bus 5, and a fault at bus 1, the indicesand are the same if the loads impedances are neglected,
as shown. Therefore, the algorithm would not be able to distin-guish the actual bus under fault.Following the proposed algorithm, the bus associated with
the minimum is selected as the faulted bus. And is givenby the total sum of [as shown in (3)], where is associatedwith the feeder meters and with the candidate bus. The indicescalculated using voltage measurements from the feeder metersat buses 3 and 5 for a short circuit at buses 1 and 2 (not simul-taneously) are given by the following equations of and .
TRINDADE et al.: FAULT LOCATION IN DISTRIBUTION SYSTEMS 259
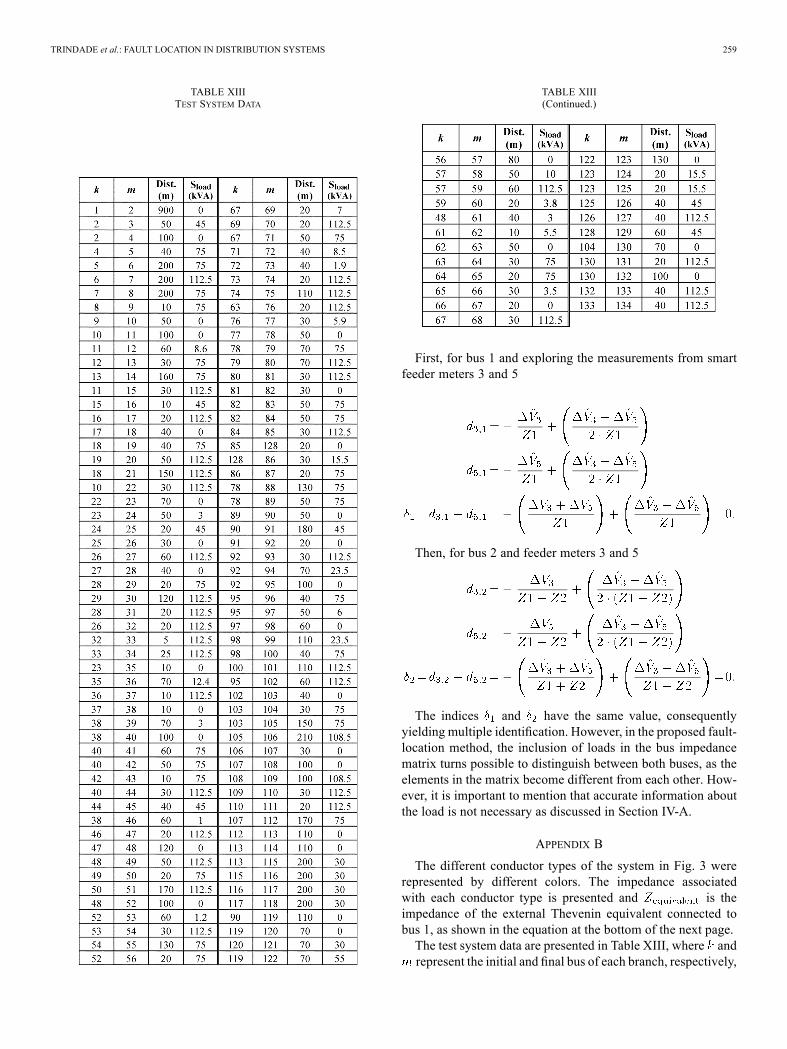
TABLE XIIITEST SYSTEM DATA
TABLE XIII(Continued.)
First, for bus 1 and exploring the measurements from smartfeeder meters 3 and 5
Then, for bus 2 and feeder meters 3 and 5
The indices and have the same value, consequentlyyielding multiple identification. However, in the proposed fault-location method, the inclusion of loads in the bus impedancematrix turns possible to distinguish between both buses, as theelements in the matrix become different from each other. How-ever, it is important to mention that accurate information aboutthe load is not necessary as discussed in Section IV-A.
APPENDIX B
The different conductor types of the system in Fig. 3 wererepresented by different colors. The impedance associatedwith each conductor type is presented and is theimpedance of the external Thevenin equivalent connected tobus 1, as shown in the equation at the bottom of the next page.The test system data are presented in Table XIII, where andrepresent the initial and final bus of each branch, respectively,

260 IEEE TRANSACTIONS ON POWER DELIVERY, VOL. 29, NO. 1, FEBRUARY 2014
and the loads are always connected to the final bus and the loadspower factor is 0.92.
REFERENCES[1] V. C. Güngör, D. Sahin, T. Kocak, S. Ergüt, C. Buccella, C. Cecati, and
G. P. Hancke, “Smart grid technologies: Communication technologiesand standards,” IEEE Trans. Ind. Inf., vol. 7, no. 4, pp. 529–539, Nov.2011.
[2] M. Popa, “Data collecting from smart meters in an advanced meteringInfrastructure,” in Proc. 15th IEEE Int. Conf. Intell. Eng. Syst., 2011,pp. 137–142.
[3] W. Luan, “Low cost feeder monitoring solution in support of utility op-erations,” in Proc. CIGRE Conf. Power Syst., Vancouver, BC, Canada,2010.
[4] M. Kezunovic, “Smart fault location for smart grids,” IEEE Trans.Smart Grid, vol. 2, no. 1, pp. 11–22, Mar. 2011.
[5] P. Deepal Rodrigo, A. Pahwa, and J. E. Boyer, “Location of outagesin distribution systems based on statistical hypotheses testing,” IEEETrans. Power Del., vol. 11, no. 1, pp. 546–551, Jan. 1996.
[6] S. T. Mak, “A synergistic approach to using AMR and intelligent elec-tronic devices to determine outages in a distribution network,” in Proc.Power Systems Conf.e: Advanced Meter., Protect., Control, Commun.,Distrib. Resources, Clemson, SC, 2006, pp. 447–453.
[7] A. K. Pradhan andA. Routray, “Applying distance relay for voltage sagsource detection,” IEEE Trans. Power Del., vol. 20, no. 1, pp. 529–531,Jan. 2005.
[8] T. Tayjasanant, C. Li, and W. Xu, “A resistance sign-based method forvoltage sag source detection,” IEEE Trans. Power Del., vol. 20, no. 4,pp. 2544–2551, Oct. 2005.
[9] A. C. Parsons, W. M. Grady, E. J. Powers, and J. C. Soward, “Adirection finder for power quality disturbances based upon disturbancepower and energy,” IEEE Trans. Power Del., vol. 15, no. 3, pp.1081–1086, Jul. 2000.
[10] B. Wang, W. Xu, and Z. Pan, “Voltage sag state estimation for powerdistribution systems,” IEEE Trans. Power Syst., vol. 20, no. 2, pp.806–812, May 2005.
[11] F. Han, X. Yu, M. Al-Dabbagh, and Y. Wang, “Locating phase-to-ground short-circuit faults on radial distribution lines,” IEEE Trans.Ind. Electron., vol. 54, no. 3, pp. 1581–1589, Jun. 2007.
[12] R. A. F. Pereira, L. G. W. da Silva, M. Kezunovic, and J. R. S.Mantovani, “Improved fault location on distribution feeders based onmatching during-fault voltage sags,” IEEE Trans. Power Del., vol. 24,no. 2, pp. 852–862, Apr. 2009.
[13] S. Lotfifard, M. Kezunovic, and M. J. Mousavi, “Voltage sag data uti-lization for distribution fault location,” IEEE Trans. Power Del., vol.26, no. 2, pp. 1239–1246, Apr. 2011.
[14] S. M. Brahma, “Fault location in power distribution system with pene-tration of distributed generation,” IEEE Trans. Power Del., vol. 26, no.3, pp. 1545–1553, Jul. 2011.
[15] T. Solvang, L. Aleixo, and H. Seljeseth, “Power quality measurementcapabilities of “Smart” Energy Meters,” presented at the Int. Conf.Renew. Energies Power Qual., Granada, Spain, Mar. 2010.
[16] H. E. Brown, Solution of Large Networks by Matrix Methods. NewYork: Wiley, 1975.
[17] R. A. F. Pereira, “Localização de faltas em alimentadoresde distribuição de energia elétrica usando medições esparsasde tensões” (in Portuguese) Ph. D. dissertation, Univ. Es-tadual Paulista, São Paulo, Brazil, 2007. [Online]. Available:http://www.dee.feis.unesp.br/pos/teses/arquivos/031-tese_ro-drigo_aparecido_fernandes_pereira.pdf
[18] Alternative Transients Program (ATP). Portland, OR: Rule Book,1992, Canadian/American EMTP users Group.
Fernanda C. L. Trindade (S’09) received the M.Sc. degree in electrical engi-neering from the University of Campinas, Campinas, Brazil, in 2009, where sheis currently pursuing the Ph.D. degree in electrical engineering.Her research interests are power system automation, monitoring, and
protection.
Walmir Freitas (M’02) received the Ph.D. degree in electrical engineering fromthe University of Campinas, Campinas, Brazil, in 2001.Currently, he is an Associate Professor with the University of Campinas,
Campinas, Brazil. His research interests are the analysis of distribution systems,distributed generation, and power quality.
José C. M. Vieira (S’98–M’07) received the M.Sc. and Ph.D. degrees in elec-trical engineering from the University of Campinas, Campinas, Brazil, in 1999and 2006, respectively.Currently, he is an Assistant Professor at the São Carlos School of Engi-
neering, São Carlos, Brazil. His research interests are distributed generation,power system control, dynamics, and protection.
in black
in red