fault slip source models for the 2014 mw 6.9...
TRANSCRIPT
Fault slip source models for the 2014 Mw 6.9 Samothraki-Gökçeada earthquake (North Aegean Trough) combininggeodetic and seismological observationsVasso Saltogianni1, Michail Gianniou2, Tuncay Taymaz3, Seda Yolsal-Çevikbilen3, and Stathis Stiros1
1Department of Civil Engineering, University of Patras, Patras, Greece, 2National Cadastre and Mapping Agency SA, Athens,Greece, 3Department of Geophysical Engineering, Faculty of Mines, İstanbul Technical University, İstanbul, Turkey
Abstract The 24 May 2014, Mw 6.9, Samothraki-Gökçeada shallow (depth: 11 km) earthquake along theNorth Aegean Trough (NAT), at the westward extension of the North Anatolian Fault Zone (NAFZ), isinvestigated using constraints from seismological and geodetic data. A point source solution based onteleseismic long-period P and SHwaveforms suggests an essentially strike-slip faulting mechanism consistingof two subevents, while from a finite fault inversion of broadband data the rupture area and slip history wereestimated. Analysis of data from 11 permanent GPS stations indicated significant coseismic horizontaldisplacement but no significant vertical or postseismic slip. Okada-type inversion of horizontal slip vectors,using the new TOPological INVersion algorithm, allowed precise modeling of the fault rupture both as singleand preferably as double strike-slip faulting reaching the surface. Variable slip models were also computed.The independent seismological and geodetic fault rupture models are broadly consistent with each otherand with structural and seismological data and indicate reactivation of two adjacent fault segmentsseparated by a bend of the NAT. The 2014 earthquake was associated with remote clusters of low-magnitudeaftershocks, produced low accelerations, and filled a gap in seismicity along the NAT in the last 50 years;faulting in the NAT seems not directly related to the sequence of recent faulting farther east, along the NAFZand the seismic gap in the Marmara Sea near Istanbul.
1. Introduction
The 24 May 2014, Mw 6.9, Samothraki-Gökceada earthquake was a shallow (depth = 11 km) strike-slip event[European-Mediterranean Seismological Centre (EMSC), 2014] and also the most recent of six earthquakes ofmagnitude 5.7–6.9 with essentially strike-slip mechanisms along the North Aegean Trough (NAT) duringthe last 50 years (Figure 1 and Table S1 in the supporting information) [Taymaz et al., 1991; Karabulutet al., 2006].
The NAT corresponds to an approximately 300 km long system of tectonically active marine basins, up to1000m deep, representing the extension of the North Anatolian Fault Zone (NAFZ) into the Aegean Sea(Figure 1) [Le Pichon et al., 1987; Taymaz et al., 1991; Kreemer et al., 2004]. The eastern part of the NAT, westof the NAFZ Ganos Fault (associated with an earthquake in 1912) [Aksoy et al., 2010], consists of a singlenarrow basin [Roussos and Lyssimachou, 1991], but its central and the western part consists of a system oftranstensional basins [Pavlides et al., 1990; Koukouvelas and Aydin, 2002; Mouslopoulou et al., 2014].Geodetic data reveal that the NAT is a major, fast-moving (~20mm/yr) strike-slip fault [Reilinger et al., 2010;Floyd et al., 2010; Müller et al., 2013; Mouslopoulou et al., 2014].
Analysis of strong motion records indicated that the 2014 earthquake consisted of two subevents [Institute ofEngineering Seismology and Earthquake Engineering (ITSAK), 2014] and was characterized by supershearrupture [Evangelidis, 2014]. Another characteristic of this earthquake is that it was followed by low-levelaftershock activity confined to five clusters (Figure 1b and Table S2). These clusters cover a zone too longfor aMw 6.9 earthquake, even if the distant cluster 4 to the east, the only one containing an event withmagnitudeslightly above 5, is ignored (Figure 1b).
In addition, this earthquake produced low accelerations (maximum peak 0.11 g) [ITSAK, 2014; KandilliObservatory and Earthquake Research Institute (KOERI), 2014] and little damage, although its epicenter wasclose to inhabited areas, the islands of Samothraki (Samothrace), Gökceada (Imbroz, Imvros), and Limnos(Lemnos) (see Figure 1). Still, the earthquake produced some panic in the Çanakkale and Istanbul areas,
SALTOGIANNI ET AL. 2014 NORTH AEGEAN TROUGH EARTHQUAKE 8610
PUBLICATIONSJournal of Geophysical Research: Solid Earth
RESEARCH ARTICLE10.1002/2015JB012052
Key Points:• Earthquake source parameters andfinite fault slip history
• Fault modeling using GPS data andthe TOPological INVersion algorithm
• The 2014 North Aegean Troughearthquake filling a seismic gap
Supporting Information:• Texts S1 and S2, Figures S1–S7, TablesS1–S3, and Caption for Movie S1
• Movie S1
Correspondence to:S. Stiros,[email protected]
Citation:Saltogianni, V., M. Gianniou, T. Taymaz,S. Yolsal-Çevikbilen, and S. Stiros (2015),Fault slip source models for the 2014Mw
6.9 Samothraki-Gökçeada earthquake(North Aegean Trough) combininggeodetic and seismological observa-tions, J. Geophys. Res. Solid Earth, 120,8610–8622, doi:10.1002/2015JB012052.
Received 19 MAR 2015Accepted 1 NOV 2015Accepted article online 11 NOV 2015Published online 11 DEC 2015
©2015. American Geophysical Union.All Rights Reserved.

because of the threat of an incoming earthquake to fill a seismic gap in the Sea of Marmara, west of the faultof the destructive 1999 Izmit earthquake, corresponding to the last event of the progressive westward reac-tivation of the NAFZ since 1939 (Figure 1a) [Bulut et al., 2009; Ergintav et al., 2009; Bohnhoff et al., 2013].
In this article we undertake inversion of teleseismic waveforms (section 2) and high-accuracy GPS coseismicdeformation vectors (section 3) in order to understand the geometry and rupture dynamics of the 2014Samothraki-Gokceada earthquake. The results of the seismological and geodetic inversions are then jointlyevaluated in order to constrain the rupture model of the 2014 earthquake and provide new insights intothe active deformation and tectonics in the NAT region. We also aim to answer two basic questions: (1)What are the geometric and dynamic characteristics of this double-event strike-slip earthquake and do theyhelp to explain postulated supershear rupture [Evangelidis, 2014] and low observed ground accelerations?and (2) Is there any relationship between the 2014 earthquake and the sequence of gradually progressingfaulting along the NAFZ since 1939?
2. Seismological Data and Analysis
Analysis of teleseismic P and SH waveforms was performed to estimate the earthquake source. At first, aninversion for a single source was made, and the mechanism was tested with a conventional first-motion focalmechanism. In combination with evidence for a two-event main shock derived from strong motion data[ITSAK, 2014; Evangelidis, 2014], waveform complexities were assigned to a second subevent with a some-what similar mechanism. The second event was modeled by inversion of misfits between observations and
Figure 1. (a) Location map: The epicenter of the 2014 earthquake (large yellow star) is located in the North Aegean Trough (NAT), marked by bathymetry, at thecontinuation of the North Anatolian Fault Zone (NAFZ). Surface faulting associated with the 1912 and 1999 earthquakes along the NAFZ is schematically shown[Taymaz et al., 1991]. Yellow circles with year indicate large events (M> 5.5; Table S1) along the NAT the last 50 years after Taymaz et al. [1991] and Taymaz andYolsal-Çevikbilen [2015] and red circles main historical events after Papazachos and Papazachou [1997] and Ambraseys and Finkel [1991]. (b) Clusters 1–5 of epicentersof earthquakes in the NAT from 24 May to 5 September 2014. Green circles correspond to relocated events by Evangelidis [2014] and red circles to events retrievedfrom the National Observatory of Athens (NOA) database. Yellow/red stars indicate main events in each cluster. GPS stations are shown as black triangles with stationcode. AE: Agios Efstratios, C: Çanakkale, CP: Chalkidiki Peninsula, G: Gökceada (Imvros), Le: Lesvos (Mytilini), Li: Limnos (Lemnos), Sa: Samothraki, SG: Saros Gulf, SR:Strymon River, and T: Thasos.
Journal of Geophysical Research: Solid Earth 10.1002/2015JB012052
SALTOGIANNI ET AL. 2014 NORTH AEGEAN TROUGH EARTHQUAKE 8611

synthetic seismograms used to derive the first subevent. In addition, assuming a rectangular fault withconstant rake, a model of variable slip distribution was computed using waveform inversion.
2.1. Seismic Waveform Inversion for Source Parameters
The mechanism of a single point source event was computed on the basis of the inversion of teleseismic(30° ≤Δ ≤ 90°) long-period 24 P and 13 SH waveforms, obtained from the Federation of DigitalSeismograph Networks (FDSN) and the Global Digital Seismograph Network (GDSN) (Figure S1).Observations were spread in all quadrants of the focal sphere, especially for the SH focal sphere; still, thenumber of stations to the north is larger than that to the south (Figures S1 and S2).
The analysis was based on theMoment Tensor 5 (MT5) body waveform inversion algorithm [Zwick et al., 1994]which compares the shape and amplitude of long-period P and SHwaveforms with synthetic ones until mini-mum misfit is obtained. The epicenter location was fixed to that of USGS-National Earthquake InformationCenter (Table 1), while receiver structures and the medium below were assumed to correspond to homoge-neous half spaces. The obtained minimum misfit solution corresponds to a right-lateral strike-slip fault at adepth of 11 km, with strike = 75°, dip = 85°, rake =�178°, source duration = 30 s, and M0 = 1.55 × 10¹⁹ Nm(Figure 2a and Table 1).
This minimum misfit solution is consistent, within a few degrees, with practically all first-motion polarities(Figure S2). A few inconsistencies observed correspond to rather nearby stations for which the takeoff angleof the raypath leaving the source is uncertain.
However, this single-source model corresponds to an R/D ratio (percent ratio of residual to data variance forPhase Data in the MT5 algorithm) higher than 50%, and it cannot adequately model the later parts of theP and SH seismograms. In particular, complexities and pulses observed at about 13 s after the P and SH arrivalsat all azimuths are likely to indicate a second subevent/source (Figures 2a and S3) [Eberhart-Phillips et al.,2003; Hayes et al., 2010; Evangelidis, 2014].
In order to model the second subevent 13 s after the main shock, the mechanism of the first event was con-sidered fixed, equal to that derived from the single-source inversion. The outcome was that the source of thesecond event is located 50 km eastward and at 20° (~18 km) northward of the main shock, with a nearly simi-lar mechanism (Figure 2b and Table 1; for location, see Figure 5), which is realistically well resolved because ofclear P pulses. Besides, the nodal character of SH waveforms at all azimuths provides additional constraint onthe source mechanismwith the addition of a second source, the R/D value decreased to about 40–45%, whilethe match of P and SH waveforms is prominently superior to that in the single-source model (Figure 2).
Table 1. Fault Slip Source Models for the 2014 Earthquake Obtained From Inversion of Point Sources and Finite Fault Modeling in This Study
Point Source Models; Long-Period P and SH Waveforms Finite Fault Model; Broadband (P)
Source 1 Source 2 Source 1
Epicenter (deg) 40.29°N × 25.45°E 40.44°N × 25.87°E 40.29°N × 25.45°Ea
Centroid depth (km) 11 ± 2 11 11a
Strike/dip/rake (deg) Nodal plane 1 75 ± 5/85 ± 5/�178 ± 5 242/80/�176 75/85/�178a
Nodal plane 2 345/88/�5 151/86/�10 -Slip vector (deg) Azimuth 75 (or 255) 61 (or 241) 75 (or 255)a
Plunge 2 4 2Length (km) - - 62.5Width (km) - - 25Average slip (cm) - - 63Maximum slip (cm) - - ~180 (260?)Eastward distance from source 1 (km) - 50 -Azimuth from source 1 (deg) - 70°E (20°N) -Time offset from source 1 (s) - 13 -Δσ (bars) - - 12Seismic moment (M0) 1.55 × 10¹⁹ Nm 6.77 × 10¹⁸ Nm 2.97 × 10¹⁹ Nm
Total moment (M0) = 2.23 × 10¹⁹ NmMw 6.8 6.9
aA constraint obtained from a single point source mechanism solution.
Journal of Geophysical Research: Solid Earth 10.1002/2015JB012052
SALTOGIANNI ET AL. 2014 NORTH AEGEAN TROUGH EARTHQUAKE 8612

The total seismic moment involving a double source isM0 = 2.23 × 10¹⁹ Nm and yields to an event ofMw= 6.8magnitude. Additional sensitivity tests assessing our solution are discussed in Text S1.
In summary, our best fitting waveform point source solution indicates dominantly right-lateral strike-slipfaulting mechanism with a shallow (centroid) depth at 11 ± 2 km and relatively long source duration(~30 s). The above results are consistent with the morphology of the NAT (Table 1 and Figure 1).
2.2. Finite Fault Slip Modeling
Finite fault slip distributions were obtained from inversion of 30 teleseismic broadband P waveforms(Figure S1) using Green’s functions and the method of Kikuchi and Kanamori [1991] and Yagi andKikuchi [2000].
The rake angle was fixed at �178° as obtained from the point source solution, and the rupture front velocitywas set at 3.2 km/s. Finite fault slip modeling solutions are not unique, and for this reason we tested differentcombinations of the overall fault dimensions to select the optimal one on the basis of the fitting of minimummisfit of observed and synthetic seismograms and of the stability of the slip pattern. In particular, we testedfaults with patches (cells) of the size of 2.5 × 2.5 km2 and 3.0 × 3.0 km2 and faults with dimensions 20 × 8 to30× 10 and 26 × 12 patches, each around the hypocenter location, as well as 12–16 triangles of source timefunctions (STF). The optimal solution is shown in Figure 3 and was obtained for 25 × 10 cells of 2.5 × 2.5 km2
size and 15 triangles of STF. The misfits between the observed and synthetic seismograms are shown in
Figure 2. The radiation patterns and synthetic waveform fits for the minimummisfit solution obtained for the 2014 earthquake, (a) for a single event and (b) for twosubevents (see section 3). Dashed lines, fits to all long-period 24 P and 13 SHwaveforms; solid lines, used in the inversion. The source time function (STF) is shown in themiddle of each figure, and beneath it is shown the time scale used for the waveforms. Focal spheres are shown with P (top) and SH (bottom) nodal planes in lowerhemisphere projections. P and T axes are marked by solid and open circles, respectively. The obvious complexities of a multiple event (a second event is marked byarrows 13 s after the onset of the first event) is clearly observed at P and SHwaveforms along the strike direction (NE-SW trending nodal plane) in which “the Dopplereffect” is also seen. The readers are advised to compare simultaneously single- anddouble-sourcefigures to see the superimpositionofwaveformsof the second source(e.g., compare Pwaveforms at stations INU and GOGA, and SH waveforms at INU, ATD, and MBO of Figures 2a and 2b).
Journal of Geophysical Research: Solid Earth 10.1002/2015JB012052
SALTOGIANNI ET AL. 2014 NORTH AEGEAN TROUGH EARTHQUAKE 8613

Figure S4. For nearly all tested models three areas of high slip in the central part of the fault appeared(hence representing invariant characteristics of the image pattern).
Figure 3 indicates that slip initiated near the hypocenter and then major slip release events occurred 8–16 slater in the two other high-slip (~100–150 cm) areas. High-slip areas observed at the SE of the fault may reflectan artifact, because they did not appear in all solutions, and the apparent peak slip corresponds to a relativelylow rate of seismic moment release (Figure 3). Source time function reveals that the earthquake duration was~35 s and that the rupture propagated mainly along the direction of strike from SW to NE with a slip vector of75°. The total moment of the finite fault model is M0 = 2.97 × 10¹⁹ Nm with magnitudeMw=6.9; the effectiverupture area is A=1562 km2 wide, the apparent average slip (Dav) is 63 cm, and the stress drop (Δσ) wasestimated at 12 bars. The details of the analysis and the methodology are discussed in Text S1 and inYolsal-Çevikbilen and Taymaz [2012] and Fielding et al. [2013].
3. Geodetic Data and Analysis
The geodetic analysis involved inversion of GPS-derived coseismic slip vectors for one and for two faultsusing the Okada [1985] model and the TOPological INVersion algorithm [Saltogianni and Stiros, 2015].
Figure 3. (right) Seismic moment release of source time function along with (left) slip distribution of finite fault rupture model-ing (color coded in meters) clearly displays late moment release at ~ 8 s intervals. Slip model is derived on NP1 of the estimatedmain shock (Table 1 and Figure 2); a star in position (0,0) indicates the focal depth obtained from minimum misfit solution.
Journal of Geophysical Research: Solid Earth 10.1002/2015JB012052
SALTOGIANNI ET AL. 2014 NORTH AEGEAN TROUGH EARTHQUAKE 8614

3.1. Data
Data from11 permanent (continuously recording) GPS stationswere analyzed. These stations are around the directinfluence area of the earthquake and cover a period of 3weeks before and after the earthquake (3 May 2014 to 14June 2014; Table S3 and Figure 1b). Nine of these stations operated in the framework of the HellenicPositioning System (HEPOS), the official real-time GPS positioning network in Greece, and two stations(CANA and IPSA) that belong to the permanent GPS network of the Turkish National Fundamental GPSNetwork (TUTGA). The distribution of the GPS stations is uniform and bounds the area of earthquakeepicenters, with the potential to cover both near-field (station 018B) and far-field effects (station 076A).
The sampling interval was 30 s, and the data were collected on a 24 h basis. All station records were complete,except for stations IPSA and CANA which contain gaps but provide substantial information for fault modeling(see supporting information Text S2) and were included in our analysis.
3.2. Computation of Displacement Vectors
Each station has been analyzed independently using the Precise Point Positioning (PPP) method whichcomputes coordinates of each station separately [Zumberge et al., 1997; Héroux and Kouba, 2001] and theGrafNav software ver. 8.40. Details and parameters of analysis are provided in supporting information Text S2.
For each station mean daily geographic coordinates were then computed (ϕ, λ, and ellipsoidal heights at aresolution of 10–5 arcsec, plus their standard errors). These daily solutions for 21 days before and after theearthquake are shown in Figure 4a and indicate no significant postseismic signal. Because of the lack ofdata in IPSA station and for reasons of uniformity, we chose to compute mean preseismic and coseismiccoordinates for 14 days before and after the day of the earthquake, respectively. Computed horizontaldisplacements were found to have a consistent pattern and are shown in Table S3 and Figure 4.
Mean daily computed displacements may not be strictly coseismic and may contain a small postseismicsignal [cf. Fielding et al., 2013]. To exclude this possibility, the whole day of 24 May has been analyzed usinginstantaneous station coordinate changes sampled with 30 s period, but we did not detect any sign ofsignificant postseismic motion. The difference between the instantaneous offset in coordinates and the offsetderived from the 14 day long intervals is within the margins of uncertainty of the instantaneous solutions.This is clearly shown for station 018B, characterized by the largest displacements (Figure 4b). Hence, the
Figure 4. Variations of coordinates of representative stations (E: Easting and N: Northing). (a) Variations of daily coordinates for four representative stations for aninterval of 21 days before and after the day of the earthquake (dashed line). The 2 σ uncertainty intervals are shown. (b) Variation of instantaneous coordinates ofstation 018B in Samothraki for the day of the earthquake (24 May, sampling rate 30 s) and their 1 σ uncertainties (yellow area). Seismic slip (offsets) from instanta-neous coordinates, shown as red double arrows, is statistically not different from that derived from comparison of two preseismic and postseismic intervals, each14 days long. No evidence of significant postseismic displacement on this day is observed.
Journal of Geophysical Research: Solid Earth 10.1002/2015JB012052
SALTOGIANNI ET AL. 2014 NORTH AEGEAN TROUGH EARTHQUAKE 8615

coseismic displacements derived from two 14day long intervals are reliable, precise, and free of postseismiceffects [cf. Barnhart and Lohman, 2013].
Computed vertical coseismic displacements were noisy even in near-field stations (Figure S5). Only forSamothraki (station 018B) a reliable vertical coseismic displacement of ~�10mm was calculated. In orderto exclude the possibility that noise in vertical PPP coordinates masks small signals which can constrainthe fault dip, especially for stations close to the epicentral area, part of the data have been processed usingthe baseline adjustment technique (see supporting information Text S2); the results of this adjustment vali-dated the PPP estimates and indicated that within the limits of accuracy of elevation changes, equal to a fewmillimeters, GPS stations recorded only horizontal crustal deformation.
3.3. Inversion of Geodetic Data
GPS-derived coseismic slip vectors were analyzed assuming both a single and a double uniform slip model ofrectangular faults in an elastic half-space medium based on Okada, [1985] equations and using the newTOPological INVersion (TOPINV) algorithm [Saltogianni and Stiros, 2015]. The TOPINV algorithm is different fromother inversion algorithms [e.g., Cervelli et al., 2001; Sambridge and Mosegaard, 2002; Menke, 2012] because itdoes not search for minimummisfits and point solutions but for one or more sets of points satisfying a systemof conditions. The latter derives from a typical observation equation (1) with n unknown variables x
f xð Þ ¼ l þ υ (1)
which are transformed into a system of inequalities of the form
f xð Þ � lj j < kσ (2)
where l is an observation vector with standard deviation σ and an unknown error υ, and k an optimizationfactor. Vector x contains the parameters describing a rectangular fault based on Okada equations f; i.e., thecoordinates of the center and the upper depth of the fault; the dip, strike, and rake angles; and the length,width, and the amount of slip of the fault.
On the basis of the results of the seismological analysis presented above, in combination with the results ofpreliminary focal mechanisms and based on the evidence for a double-event seismic sequence[Evangelidis, 2014], all possible ranges of values of variables x were adopted to derive the search space.These ranges were discretized and used to define a hypergrid G (in the Rn space) representing all possiblecombinations (hypergrid points) of values of the unknown variables (search space). For a selected value ofk all points in the hypergrid G were tested (deterministic, exhaustive search) using a Boolean logic whetherthey satisfy inequalities of equation (2), and successful points were identified. After repeated trials for differ-ent values of k, its optimal value was computed. The latter corresponds to the minimum kwhich defines a setof grid points which satisfy all observation equations and correspond to at least two points in the projectionof the hypergrid G in all possible 2-D planes [see Saltogianni and Stiros, 2015, Figure S1]. From this set, theoptimal solution and its variance-covariance matrix were computed as first and second statistical moments[cf. Mikhail, 1976]. The values of all variables were not fixed at any step of the algorithm, and for this reasonthe results of the geodetic inversion are independent of the seismological solutions, which were only used todefine broad search spaces for each variable (practically to exclude improbable values).
This method of inversion is not based on sampling or/and minimum misfits; hence, it is not focusing onsingle-point solutions, is not trapped on local minima, and can identify multiple solutions, if any exist. Forcomputational reasons, the number of grid points in G is typically limited to 1010, and once possible solutionsare identified, the algorithm is repeated adopting finer, nested grids around the possible solutions. Thedetails of this algorithm and its assessment using synthetic data are analyzed in Saltogianni and Stiros[2012, 2015] and in Saltogianni et al. [2014].3.3.1. Inversion for a Single FaultThe first stepwas to define a GridG in a discretized R9 space summarized in Figure 5a and Table 2. The grid selec-tion only excludes the possibility of physically improbable solutions. In addition, a constraint for fault aspect, inthe form: length/width>1, was added in the observation inequalities of equation (2) in order to discard unrea-sonable solutions in terms of geometry. Concerning weights for GPS observations, based on the results ofTable S2, a flat weight of 0.6mm and 0.8mm was adopted for Easting and Northing, respectively.
Tests with various values of kwere made, and it was found that the value of k= 12 corresponds to a cluster ofpoints S1 consisting of ~100 grid points in total. This cluster of points was found to correspond to a closed
Journal of Geophysical Research: Solid Earth 10.1002/2015JB012052
SALTOGIANNI ET AL. 2014 NORTH AEGEAN TROUGH EARTHQUAKE 8616
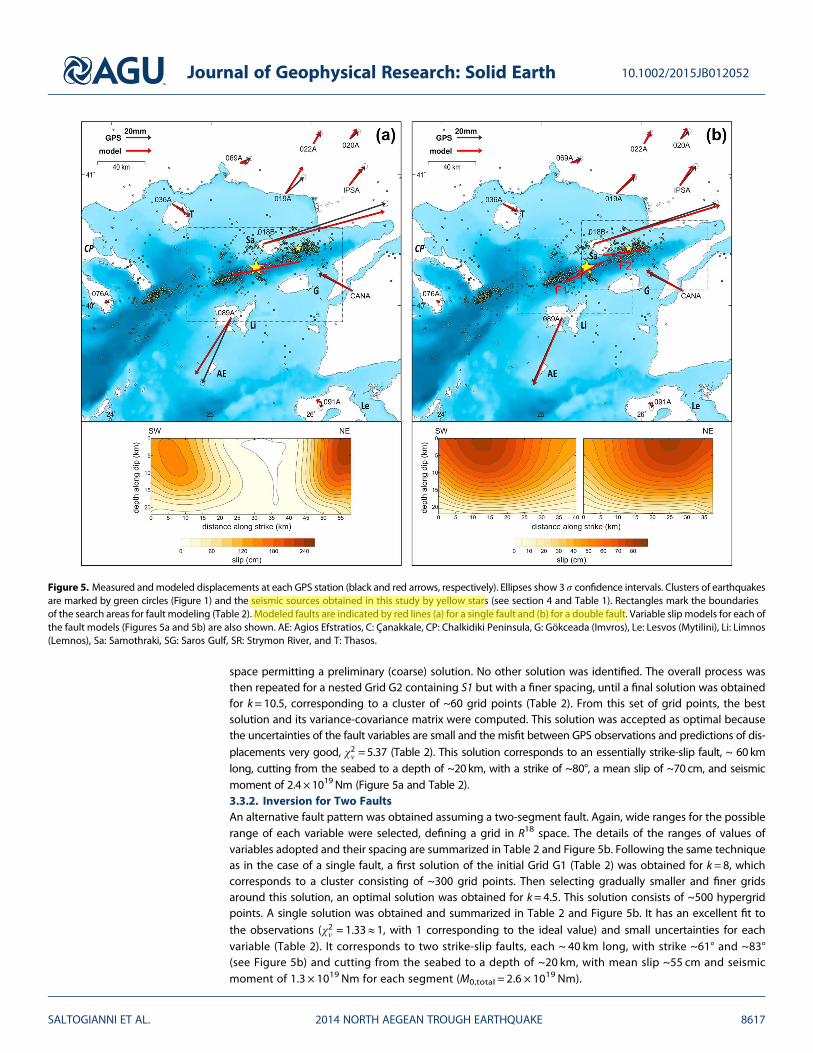
space permitting a preliminary (coarse) solution. No other solution was identified. The overall process wasthen repeated for a nested Grid G2 containing S1 but with a finer spacing, until a final solution was obtainedfor k= 10.5, corresponding to a cluster of ~60 grid points (Table 2). From this set of grid points, the bestsolution and its variance-covariance matrix were computed. This solution was accepted as optimal becausethe uncertainties of the fault variables are small and the misfit between GPS observations and predictions of dis-placements very good, χ2ν =5.37 (Table 2). This solution corresponds to an essentially strike-slip fault, ~ 60 kmlong, cutting from the seabed to a depth of ~20 km, with a strike of ~80°, a mean slip of ~70 cm, and seismicmoment of 2.4×10¹⁹Nm (Figure 5a and Table 2).3.3.2. Inversion for Two FaultsAn alternative fault pattern was obtained assuming a two-segment fault. Again, wide ranges for the possiblerange of each variable were selected, defining a grid in R18 space. The details of the ranges of values ofvariables adopted and their spacing are summarized in Table 2 and Figure 5b. Following the same techniqueas in the case of a single fault, a first solution of the initial Grid G1 (Table 2) was obtained for k=8, whichcorresponds to a cluster consisting of ~300 grid points. Then selecting gradually smaller and finer gridsaround this solution, an optimal solution was obtained for k= 4.5. This solution consists of ~500 hypergridpoints. A single solution was obtained and summarized in Table 2 and Figure 5b. It has an excellent fit tothe observations (χ2ν = 1.33≈ 1, with 1 corresponding to the ideal value) and small uncertainties for eachvariable (Table 2). It corresponds to two strike-slip faults, each ~ 40 km long, with strike ~61° and ~83°(see Figure 5b) and cutting from the seabed to a depth of ~20 km, with mean slip ~55 cm and seismicmoment of 1.3 × 10¹⁹ Nm for each segment (M0,total = 2.6 × 10¹⁹ Nm).
Figure 5. Measured andmodeled displacements at each GPS station (black and red arrows, respectively). Ellipses show 3 σ confidence intervals. Clusters of earthquakesare marked by green circles (Figure 1) and the seismic sources obtained in this study by yellow stars (see section 4 and Table 1). Rectangles mark the boundariesof the search areas for fault modeling (Table 2). Modeled faults are indicated by red lines (a) for a single fault and (b) for a double fault. Variable slip models for each ofthe fault models (Figures 5a and 5b) are also shown. AE: Agios Efstratios, C: Çanakkale, CP: Chalkidiki Peninsula, G: Gökceada (Imvros), Le: Lesvos (Mytilini), Li: Limnos(Lemnos), Sa: Samothraki, SG: Saros Gulf, SR: Strymon River, and T: Thasos.
Journal of Geophysical Research: Solid Earth 10.1002/2015JB012052
SALTOGIANNI ET AL. 2014 NORTH AEGEAN TROUGH EARTHQUAKE 8617

3.3.3. Variable Slip ModelsAdopting the geometry of faulting of the two uniform slip models and the GPS slip vectors, variable slip modelsfor a single fault and a double fault were computed using the SDM software [Wang et al., 2012], assuming ahomogeneous earth model. Rectangular faults were discretized with a patch of the size of 2×2 km2 with upperlimit of slip at 3m. Obtained solutions are characterized by high correlation coefficients, 0.9930 and 0.9981 for thesingle and the double faults, respectively, indicating excellent consistency between data and models, while theirmean slip is consistent with that obtained from the uniform slip models (Table 2). Results are shown in Figure 5and indicate that in both cases maximum slip is observed near the two edges of the rupture area (Table 2).
4. Discussion4.1. Comparison Between Seismological and Geodetic Results
Inversion of independent data sets, teleseismic waveforms, and geodetic slip vectors led to consistent results,indicating that the 2014 earthquake corresponds either to a single or preferably to two strike-slip faults withsimilar characteristics.
More specifically, as can be derived from the comparison of Tables 1 and 2, the independent seismological (S)and geodetic (G) estimates of fault slip patterns and geometry are very similar and within their uncertainty limitsfor a single fault: strike S=75±5° andG=79±1°; dip: S=85±5° andG=90±0.5°; rake: S=�178 (or 182) ± 5° andG=182±2°; and seismic moment: S=2.23×10¹⁹Nm and G=2.40×10¹⁹Nm (Tables 1 and 2).
However, there appears to exist a difference of ~20° in the strike and of ~10° in the dip of the secondsubevent/fault F2 (Tables 1 and 2). While this difference seems significant, it may only reflect the a prioriassumption for two fault mechanisms essentially similar in the seismological inversion (section 3.1), as wellas uncertainties in the output of the misfit minimization process, on which the computation of the sourceparameters are based. This is because of the suboptimal distribution of the available teleseismic data(Figure S1) and because the computed strike of the first subevent definitely containing some noise is
Table 2. A Priori Conditions (Grid G1) and Modeled Parameters for Both of a Single and a Double Fault Based on Inversion of GPS Data
Double Fault
Single Fault Grid G1 (Range/Spacing) Geodetic Estimates
Grid G1(Range/Spacing) Geodetic Estimates F1 F2 F1 F2
Epicenter N (deg) - - - - - -Fault center N (deg) (40.117–40.475)/0.022 40.292 ± 0.012 (40.075–40.388)/0.088 (40.256–40.519)/0.088 40.254 ± 0.009 40.406 ± 0.012Fault center N (km)a (130–170)/2.5 149 ± 0.4 (120–160)/10 (145–175)/10 145 ± 1.0 162 ± 1.4Epicenter E (deg) - - - - - -Fault center E (deg) (25.208–25.968)/0.024 25.552 ± 0.028 (25.083–25.557)/0.096 (25.730–26.303)/0.096 25.415 ± 0.026 25.818 ± 0.026Fault center E (km)a (130–195)/2.5 159 ± 1.6 (120–160)/10 (175–225)/10 148 ± 2.7 183 ± 2.7Depth, source (km) - - - - - -Depth, upper tip (km) (0–15)/2.5 0.2 ± 0.7 (0–10)/5 (0–10)/5 0.4 ± 0.9 0.1 ± 1.1Strike (deg) (60–90)/5 79 ± 1.1 (60–90)/10 (60–90)/10 61 ± 1.7 83 ± 2.4Dip (deg) (75–90)/5 90 ± 0.4 (70–90)/10 (70–90)/10 90 ± 0.5 90 ± 0.5Rake (deg) (170–190)/5 182 ± 2.1 (170–190)/10 (170–190)/10 184 ± 3.4 173 ± 3.3Length (km) (30–70)/2.5 58 ± 4.6 (30–50)/10 (30–50)/10 40 ± 5.0 37.5 ± 3.5Width (km) (10–40)/2.5 20 ± 1.6 (10–30)/10 (10–30)/10 20 ± 3.3 21 ± 3.6Average slip (cm) (20–90)/2.5 69 ± 8.0 (30–60)/10 (30–60)/10 56 ± 4.6 55 ± 5.2
68b 48b 49b
Maximum Slip (cm) - 232b - 184b 173b
Δσ (bars) - 15 - 14 15M0 (×10
19 Nm) - 2.4 ± 0.5 - 1.34 ± 0.3 1.30 ± 0.3M0,total = 2.64
Mw - 6.9 ± 0.1 - 6.8 ± 0.1 6.7 ± 0.1Mw,total = 6.9
Mean weighted misfit - χ2ν = 5.37 - χ2ν = 1.33Number of grid points ~3 × 10⁹ ~60 ~4 × 10⁹ ~500
aFault center in kilometers relative to an arbitrary origin point (E23.7°, N38.9°).bSlip estimations for variable slip model.
Journal of Geophysical Research: Solid Earth 10.1002/2015JB012052
SALTOGIANNI ET AL. 2014 NORTH AEGEAN TROUGH EARTHQUAKE 8618

assumed fixed in the second inversion. In contrast, the strike of the two faults derived from geodetic data isallowed to take any value within a certain reasonable range (see section 2). As explained below, fault F2 isfully consistent with the local morphology of the NAT fault, as well as with the distribution of aftershocks,which revealed a change in fault orientation (Figure 1).
Differences exist also in the pattern of the corresponding variable slip models, although both seismologicaland geodetic models consistently show maximum slip in two areas east and west of the middle of thewhole fault (Figures 3 and 5). Such models, however, are not unique; their precision is not easily documented,while computed results may be affected by propagation of errors in the input parameters (fault geometry)[cf. Mikhail, 1976].
4.2. Fault Model Assessment
The single- and the two-fault model are in agreement with preliminary solutions of the focal mechanisms[EMSC, 2014], while the double-fault solution is consistent with the results of Evangelidis [2014].
The difference in the strike of the two faults derived from geodetic data (F1 and F2) is consistent with achange in the strike of the NAT derived from bathymetry, as well as with the overall distribution of after-shocks (Figure 1). However, while fault segment F1 correlates with the fault marking the south flank of theNAT (Figure 5) [Caputo et al., 2012], it is modeled a few kilometers south of the lineament of epicenters ofcluster 1 (Figure 1). A possibility is that because of the poor distribution of near-field seismographic stations,this offset may reflect uncertainty in this cluster of epicenters of aftershocks withM< 3.5. Another possibilityis that cluster 1 of microearthquakes reflects a combination of postearthquake quiescence of the rupturedfault and of activation of off-fault structures due to supershear [cf. Bouchon and Karabulut, 2008;Evangelidis, 2014].
Fault models do not predict substantial seafloor deformation necessary for tsunami generation during a faultoffshore; hence, they are consistent with absence of observations of unusual sea level oscillations. Minorfluctuations recorded at the Gökçeada tide gauge just after the earthquake [KOERI, 2014] may indicate a smalltsunami associated with a local effect (failure of sediments offshore, etc.).
4.3. Relationship Between Faulting Along the NAT and the NAFZ
Figure 6 and Table S1 summarize the focal mechanisms and locations of major earthquakes having occurredin the North Aegean since 1965. The maximum length of these faults was probably of the order of magnitudeof the 2014 earthquake, approximately 60–70 km. On this evidence, this figure indicates that the time-spacesequence of faulting along the NAT is rather random, not characterized by the gradual progression in onedirection characterizing the NAFZ to the east (see section 1) [Bulut et al., 2009; Ergintav et al., 2009]. It alsogives the impression that the 2014 earthquake filled a gap in the seismic faulting produced in the last50 years in the NAT. This apparently random pattern in the timing of faulting may be related to the changesof the morphology of the NAT along strike (Figure 1). The NAT is very narrow to the east [Roussos andLyssimachou, 1991], near the epicenter of the 2014 earthquake, but becomes broader and more diffuse tothe west, partly due to interference with other faults [Pavlides et al., 1990; Mouslopoulou et al., 2014] till itabuts to the Greek mainland. Hence, faulting along the NAT, west of the 1912 seismic rupture, marking thewest edge of the NAFZ, seems not directly related to the sequence of progressive faulting along the NAFZand the important seismic gap in the Sea of Marmara [Bulut et al., 2009; Bohnhoff et al., 2013].
Whether the seismic history of the NAT in the last 50 years is representative of longer intervals is not easy toknow, because the record of earthquakes in this region in the last few thousand years [Ambraseys andFinkel, 1991; Papazachos and Papazachou, 1997; Mouslopoulou et al., 2014] may not be complete. A reasonfor this is that other relatively large (M> 6.5) shallow earthquakes also associated with low accelerationmay have occurred along the NAT, but they remained unnoticed, because of their “low damaging” effects[cf. Showstack, 2015].
4.4. Fault Segmentation and Rupture Dynamics
Evidence presented above highlights certain characteristics of the 2014 earthquake rupture: (1) it involvedtwo subevents most probably corresponding to two different fault segments and (2) it was followed by afew aftershocks in clusters spread along a distance of 180–250 km, too long for a magnitude 6.9 earthquake.
Journal of Geophysical Research: Solid Earth 10.1002/2015JB012052
SALTOGIANNI ET AL. 2014 NORTH AEGEAN TROUGH EARTHQUAKE 8619

Various major seismic sequences in the past involved reactivation of two or more segments (2002 Denali,Alaska, earthquake [Eberhart-Phillips et al., 2003]; 2010 Haiti earthquake [Hayes et al., 2010]; and 2010Canterbury, New Zealand, earthquake [Gledhill et al., 2011]). In the wider Aegean region, the most well-studied case of a predominantly strike-slip earthquake associated with two segments is the Leucas, westernHellenic Arc, 2003Mw 6.3 event. This earthquake ruptured a highly fragmented crust and was recorded as twosubevents separated by 14 s and by two clusters of aftershocks corresponding to two stepping faultsegments separated by a distance of ~10 km [Benetatos et al., 2005; Zahradník et al., 2005; Saltogianni andStiros, 2015]. In the case of the 2014 Samothraki-Gökçeada earthquake, a change in the strike of the NATseems to have forced the rupture to jump to another, slightly offset fault segment (Figure 5).
The 2014 rupture was preceded and possibly facilitated by a ~10 year long interval of increased microearth-quake activity which perhaps prepared the failure [Bulut, 2015] and permitted the release nearly of the wholeof the cumulated elastic strain during themain shock, by one or preferably two nearly planar strike-slip rupturesand supershear fracture according to Evangelidis [2014]. Interestingly, increasedmicroseismic activity precedinga supershear rupture was also observed during the Izmit 1999 earthquake, the last event along the NAFZ[Bouchon et al., 2001; Bulut, 2015].
After the 2014 main shock, clusters of low-level aftershock activity were recorded along the NAT for severalmonths. These clusters cover a zone up to 150–180 km, possibly 250 km long if cluster 4 is included in the seismicsequence (Figure 1b and Table S2). Such a length for an aftershock zone is too long for a magnitude 6.9 earth-quake [cf. Wells and Coppersmith, 1994] and is reminiscent of much larger earthquakes [Stein and Toda, 2013].In addition, some of the clusters of Figure 1b are beyond the zones of influence of significant Coulomb staticstress changes (Figure S7) and too much delayed to reflect dynamic Coulomb stress changes (Table S2). Still,they may be directly related to the studied earthquake, because they correlate with the NAT (Figure 1b) andbecause evidence from various other regions indicates postearthquake activity along remote fault segments
Figure 6. Earthquake source mechanisms NAT region obtained by using teleseismic waveform inversion of P and SH body waves reported by Taymaz et al. [1991]and Taymaz and Yolsal-Çevikbilen [2015]. Large yellow arrows show slip vectors of earthquakes acquired (Table S1). The 24 May 2014 earthquake sequence seems tofill a gap in seismicity in the NAT between 1965 and 2014.
Journal of Geophysical Research: Solid Earth 10.1002/2015JB012052
SALTOGIANNI ET AL. 2014 NORTH AEGEAN TROUGH EARTHQUAKE 8620

that are particularly susceptible to triggering effects, especially if they are close to, or are undergoing failure[Rubinstein et al., 2009; Shelly et al., 2011].
5. Conclusions
Inversion of teleseismic long-period P and SH waveforms and of GPS displacement vectors permitted tomodel the fault geometry and rupture process of the 2014 NAT earthquake of Mw 6.9. Faulting correspondsto shallow strike slip, likely to a fault consisting of two segments. The 2014 earthquake seems to fill a gap inseismicity along the NAT in the last 50 years, but there is no evidence that it has a direct relationship with thesequence of recent faulting farther east, along the NAFZ.
ReferencesAksoy, M. E., M. Meghraoui, M. Vallée, and Z. Çakır (2010), Rupture characteristics of the A.D. 1912 Mürefte (Ganos) earthquake segment of
the North Anatolian fault (western Turkey), Geology, 38(11), 991–994, doi:10.1130/G31447.1.Ambraseys, N. N., and C. F. Finkel (1991), Long-term seismicity of Istanbul and of the Marmara Sea region, Terra Nova, 3(5), 527–539,
doi:10.1111/j.1365-3121.1991.tb00188.x.Barnhart, W. D., and R. B. Lohman (2013), Phantom earthquakes and triggered aseismic creep: Vertical partitioning of strain during earthquake
sequences in Iran, Geophys. Res. Lett., 40, 819–823, doi:10.1002/grl.50201.Benetatos, C., A. Kiratzi, Z. Roumelioti, G. Stavrakakis, G. Drakatos, and I. Latoussakis (2005), The 14 August 2003 Lefkada Island (Greece)
earthquake: Focalmechanismsof themainshock andof the aftershock sequence, J. Seismol., 9(2), 171–190, doi:10.1007/s10950-005-7092-1.Bohnhoff, M., F. Bulut, G. Dresen, T. Eken, P. E. Malin, and M. Aktar (2013), An earthquake gap south of Istanbul, Nat. Commun., 4, 1999,
doi:10.1038/ncomms2999.Bouchon, M., and H. Karabulut (2008), The aftershock signature of supershear earthquakes, Science, 320(5881), 1323–1325.Bouchon, M., M.-P. Bouin, H. Karabulut, M. N. Toksoz, M. Dietrich, and A. J. Rosakis (2001), How fast is rupture during an earthquake? New
insights from the 1999 Turkey earthquakes, Geophys. Res. Lett., 28(14), 2723–2726, doi:10.1029/2001GL013112.Bulut, F. (2015), Different phases of the earthquake cycle captured by seismicity along the North Anatolian Fault, Geophys. Res. Lett., 42,
2219–2227, doi:10.1002/2015GL063721.Bulut, F., M. Bohnhoff, W. L. Ellsworth, M. Aktar, and G. Dresen (2009), Microseismicity at the North Anatolian Fault in the Sea of Marmara
offshore Istanbul, NW Turkey, J. Geophys. Res., 114, B09302, doi:10.1029/2008JB006244.Caputo, R., A. Chatzipetros, S. Pavlides, and S. Sboras (2012), The Greek Database of Seismogenic Sources (GreDaSS): State-of-the-art for
northern Greece, Ann. Geophys., 55(5), 338–358, doi:10.4401/ag-5168.Cervelli, P., M. H. Murray, P. Segall, Y. Aoki, and T. Kato (2001), Estimating source parameters from deformation data, with an application to
the March 1997 earthquake swarm off the Izu Peninsula, Japan, J. Geophys. Res., 106(6), 11,217–11,237, doi:10.1029/2000JB900399.Eberhart-Phillips, D., et al. (2003), The 2002 Denali fault earthquake, Alaska: A large magnitude slip-partitioned event, Science, 300(5622),
1113–1118, doi:10.1126/science.1082703.European-Mediterranean Seismological Centre (EMSC) (2014), European-Mediterranean Seismological Centre. [Available at http://www.
emsc-csem.org/Earthquake/earthquake.php?id=379935.]Ergintav, S., S. McClusky, E. Hearn, R. Reilinger, R. Cakmak, T. Herring, H. Ozener, O. Lenk, and E. Tari (2009), Seven years of postseismic
deformation following the 1999, M = 7.4 and M = 7.2, Izmit-Duzce, Turkey earthquake sequence, J. Geophys. Res., 114, B07403,doi:10.1029/2008JB006021.
Evangelidis, C. P. (2014), Imaging supershear rupture for the 2014 Mw 6.9 Northern Aegean earthquake by backprojection of strong motionwaveforms, Geophys. Res. Lett., 42, 307–315, doi:10.1002/2014GL062513.
Fielding, E. J., P. R. Lundgren, T. Taymaz, S. Yolsal-Çevikbilen, and S. E. Owen (2013), Fault-slip source models for the 2011 M7.1 Vanearthquake in Turkey from SAR interferometry, pixel offset tracking, GPS and seismic waveform analysis, Seismol. Res. Lett., 84(4),579–593, doi:10.1785/0220120164.
Floyd, M. A., et al. (2010), A new velocity field for Greece: Implications for the kinematics and dynamics of the Aegean, J. Geophys. Res., 115,B10403, doi:10.1029/2009JB007040.
Gledhill, K., J. Ristau, M. Reyners, B. Fry, and C. Holden (2011), The Darfield (Canterbury, New Zealand)Mw 7.1 earthquake of September 2010:A preliminary seismological report, Seismol. Res. Lett., 82, 378–386, doi:10.1785/gssrl.82.3.378.
Goldstein, P., D. Dodge, M. Firpo, and L. Minner (2003), 85.5 SAC2000: Signal processing and analysis tools for seismologists and engineers, inInternational Geophysics, International Handbook of Earthquake and Engineering Seismology, vol. 81, Part B, edited by H. K., P. C. Jenningsand C. K. W. H. K. Lee, pp. 1613–1614, Academic Press, London.
Hayes, G. P., et al. (2010), Complex rupture during the 12 January 2010 Haiti earthquake, Nat. Geosci., 3, 800–805, doi:10.1038/NGEO977.Héroux, P., and J. Kouba (2001), GPS precise point positioning using IGS orbit products, Phys. Chem. Earth Part A, 26(6–8), 573–578,
doi:10.1016/S1464-1895(01)00103-X.Institute of Engineering Seismology and Earthquake Engineering (ITSAK) (2014), Institute of Engineering Seismology and Earthquake
Engineering of Greece. [Available at http://www.itsak.gr/db/data/sm/after2000.]Karabulut, H., Z. Roumelioti, C. Benetatos, A. K. Multu, S. Özalaybey, M. Aktar, and A. Kiratzi (2006), A source study of the 6 July 2003 (Mw 5.7)
earthquake sequence in the Gulf of Saros (Northern Aegean Sea): Seismological evidence for the western continuation of the Ganos fault,Tectonophysics, 412(3–4), 195–216, doi:10.1016/j.tecto.2005.09.009.
Kikuchi, M., and H. Kanamori (1991), Inversion of complex body waves—III, Bull. Seismol. Soc. Am., 81, 2335–2350.Kandilli Observatory and Earthquake Research Institute (KOERI) (2014), Earthquake report of 24 May 2014 Northern Aegean Sea Tech. Rep.,
Boğaziçi Univ., Istanbul, Turkey.Koukouvelas, I. K., and A. Aydin (2002), Fault structure and related basins of the North Aegean Sea and its surroundings, Tectonics, 21(5), 1046,
doi:10.1029/2001TC901037.Kreemer, C., N. Chamot-Rooke, and X. Le Pichon (2004), Constraints on the evolution and vertical coherency of deformation in the Northern
Aegean from a comparison of geodetic, geologic and seismologic data, Earth Planet. Sci. Lett., 225(3–4), 329–346, doi:10.1016/j.epsl.2004.06.018.
Journal of Geophysical Research: Solid Earth 10.1002/2015JB012052
SALTOGIANNI ET AL. 2014 NORTH AEGEAN TROUGH EARTHQUAKE 8621
AcknowledgmentsWe thank Editor P. Tregoning, ananonymous Associate Editor, J. Ristau,and an anonymous reviewer for theirdetailed and constructive comments.We thank the National Cadastre andMapping Agency of Greece for grantingpermission to publish results of theanalysis of data from the HEPOS net-work. The teleseismic body waves usedin this study are from the InternationalFederation of Digital SeismographNetworks (FDSN) and the Global DigitalSeismograph Network (GDSN) stationsand archived at the IRIS-DMC, http://ds.iris.edu/wilber3/find_event. The GPSdata of CANA and IPSA stations belongto the Turkish National FundamentalGPS Network (TUTGA; http://www.hgk.msb.gov.tr/english/u-10-turkish-national-fundamental-gps-network.html) and are available at http://www.hgk.msb.gov.tr/egedenizi_depremi_-metin.htm (last accessed in August2014). Relocated hypocenters wereprovided by C. Evangelidis, and part ofthe earthquake list used in Figure 1 wasderived from the NOA database http://bbnet.gein.noa.gr/HL/. Softwarepackages of Generic Mapping Tools(GMT) [Wessel and Smith, 1998] wereused to prepare some of the figures andSAC2000 [Goldstein et al., 2003] toprocess conventional earthquake data.The GPS data were analyzed using theGrafNav ver. 8.40 software of NovAtelInc. and Trimble Business Center, Ver.1.12. V.S. was partly supported by theGreek Secretariat of Research andTechnology, Greece, in the framework ofthe PLATON program. T.T. thanksİstanbul Technical University ResearchFund (İTÜ-BAP), Turkish NationalScientific, Technological Foundation(TÜBİTAK), Turkish Academy of Sciences(TÜBA) in the framework for YoungScientist Award Program (TT-TÜBA-GEBIP 2001-2-17), and Alexander vonHumboldt Foundation (AvH). Weappreciate Yuji Yagi’s generous andunselfish offer to let us use his rupturehistory and slip distribution code.We arethankful to Yeşim Çubuk for her help ingenerating Figure 6.

Le Pichon, X., N. Lybéris, and F. Alvarez (1987), Discussion on the subsidence of the North Aegean Trough: An alternative view, J. Geol. Soc.,144(2), 349–351, doi:10.1144/gsjgs.144.2.0349.
Menke, W. (2012), Geophysical Data Analysis: Discrete Inverse Theory, MATLAB Edition, 3rd ed., Elsevier, Amsterdam.Mikhail, E. M. (1976), Observations and Least Squares, IEP – A Dun-Donnelley Publisher, New York.Mouslopoulou, V., V. Saltogianni, M. Gianniou, and S. Stiros (2014), Geodetic evidence for tectonic activity on the Strymon Fault System,
northeast Greece, Tectonophysics, 633(1), 246–255.Müller, M. D., A. Geiger, H.-G. Kahle, G. Veis, H. Billiris, D. Paradissis, and S. Felekis (2013), Velocity and deformation fields in the North Aegean
domain, Greece, and implications for fault kinematics, derived from GPS data 1993–2009, Tectonophysics, 597–598, 34–49, doi:10.1016/j.tecto.2012.08.003.
Okada, Y. (1985), Surface deformation due to shear and tensile faults in a half-space, Bull. Seismol. Soc. Am., 75(4), 1135–1154.Papazachos, B., and C. Papazachou (1997), The Earthquakes of Greece, pp. 304, P. Ziti and Co, Thessaloniki, Greece.Pavlides, S., D. Mountrakis, A. Kilias, and M. Tranos (1990), The role of strike-slip movements in the extensional area of Northern Aegean
(Greece): A case of transtensional tectonics, Annales Tectonicae, 4, 196–211.Reilinger, R., S. McClusky, D. Paradissis, S. Ergintav, and P. Vernant (2010), Geodetic constraints on the tectonic evolution of the Aegean
region and strain accumulation along the Hellenic subduction zone, Tectonophysics, 488(1–4), 22–30, doi:10.1016/j.tecto.2009.05.027.Roussos, N., and T. Lyssimachou (1991), Structure of the Central North Aegean Trough: An active strike-slip deformation zone, Basin Res., 3(1),
39–48.Rubinstein, J. L., J. Gomberg, J. E. Vidale, A. G. Wech, H. Kao, K. C. Creager, and G. Rogers (2009), Seismic wave triggering of nonvolcanic
tremor, episodic tremor and slip, and earthquakes on Vancouver Island, J. Geophys. Res., 114, B00A01, doi:10.1029/2008JB005875.Saltogianni, V., and S. Stiros (2012), Adjustment of highly non-linear redundant systems of equations using a numerical, topology-based
approach, J. Appl. Geod., 6(3–4), 125–134, doi:10.1515/jag-2012-0018.Saltogianni, V., and S. Stiros (2015), A two-fault model of the 2003 Leucas (Aegean Arc) earthquake based on topological inversion of GPS
data, BSSA, 105(5), 2510–2520, doi:10.1785/0120140355.Saltogianni, V., S. C. Stiros, A. V. Newman, K. Flanagan, and F. Moschas (2014), Time-space modeling of the dynamics of Santorini volcano
(Greece) during the 2011–2012 unrest, J. Geophys. Res. Solid Earth, 119, 8517–8537, doi:10.1002/2014JB011409.Sambridge, M., and K. Mosegaard (2002), Monte Carlo methods in geophysical inverse problems, Rev. Geophys., 40(3), 1009, doi:10.1029/
2000RG000089.Shelly, D. R., Z. Peng, D. P. Hill, and C. Aiken (2011), Triggered creep as a possible mechanism for delayed dynamic triggering of tremor and
earthquakes, Nat. Geosci., 4, 384–388, doi:10.1038/ngeo1141.Showstack, R. (2015), Weak shaking lessened Nepal earthquake impact, Eos, 96, 2015EO032443.Stein, R. S., and S. Toda (2013), Megacity megaquakes—Two near misses, Science, 341(6148), 850–852.Taymaz, T., and S. Yolsal-Çevikbilen (2015), Source parameters of major earthquakes in the Aegean during 2013–2014: Implications on recent
tectonics and deformations Geophysical Research Abstracts, vol. 17, EGU2015-4744, 12–17 April 2015, Vienna, Austria.Taymaz, T., J. Jackson, and D. McKenzie (1991), Active tectonics of the north and central Aegean Sea, Geophys. J. Int., 106(2), 433–490,
doi:10.1111/j.1365-246X.1991.tb03906.x.Wang, R., S. Parolai, M. Ge, M. Jin, T. R. Walter, and J. Zschau (2012), The 2011Mw 9.0 Tohoku earthquake: Comparison of GPS and strong-motion
data, Bull. Seismol. Soc. Am., doi:10.1785/0120110264.Wells, D. L., and K. J. Coppersmith (1994), New empirical relationships among magnitude, rupture length, rupture width, rupture area, and
surface displacement, Bull. Seismol. Soc. Am., 84(4), 974–1002.Wessel, P., andW. H. F. Smith (1998), New, improved version of generic mapping tools released, Eos Trans. AGU, 79(47), 579–579, doi:10.1029/
98EO00426.Yagi, Y., and M. Kikuchi (2000), Source rupture process of the Kocaeli, Turkey, earthquake of August 17, 1999, obtained by joint inversion of
near-field data and teleseismic data, Geophys. Res. Lett., 27(13), 1969–1972, doi:10.1029/1999GL011208.Yolsal-Çevikbilen, S., and T. Taymaz (2012), Earthquake source parameters along the Hellenic subduction zone and numerical simulations of
historical tsunamis in the Eastern Mediterranean, Tectonophysics, 536–537, 61–100, doi:10.1016/j.tecto.2012.02.019.Zahradník, J., A. Serpetsidaki, E. Sokos, and G.-A. Tselentis (2005), Iterative deconvolution of regional waveforms and a double-event
interpretation of the 2003 Lefkada earthquake, Greece, Bull. Seismol. Soc. Am., 95(1), 159–172.Zumberge, J. F., M. B. Heflin, D. C. Jefferson, M. M. Watkins, and F. H. Webb (1997), Precise point positioning for the efficient and robust
analysis of GPS data from large networks, J. Geophys. Res., 102(B3), 5005–5017, doi:10.1029/96JB03860.Zwick, P., R. McCaffrey, and G. Abers (1994), MT5 program, in IASPEI software library number 4, IASPEI.
Journal of Geophysical Research: Solid Earth 10.1002/2015JB012052
SALTOGIANNI ET AL. 2014 NORTH AEGEAN TROUGH EARTHQUAKE 8622