faunal diversity and water quality of the beeshazar …
TRANSCRIPT

FAUNAL DIVERSITY AND WATER QUALITY OF THE
BEESHAZAR LAKE, CHITWAN, NEPAL
NAMRATA SHRESTHA
T.U. Registration No: 5-2-19-827-99
T.U. Examination Roll No: 1371
Batch: 2059/2060
A thesis submitted in partial fulfillment of the requirements for the degree
of Master of Science in Zoology with special paper Ecology and
Environment
Submitted To
Central Department of Zoology
Institute of Science and Technology
Tribhuvan University
Kritipur, Kathmandu
Nepal
April, 2017

i
DECLARATION
I hereby declare that the work presented in this thesis entitled “Faunal Diversity and
Water Quality of the Beeshazar Lake, Chitwan, Nepal” has been done by myself, and
has not been submitted elsewhere for the award of any degree. All Sources of information
have been specifically acknowledged by reference to the author(s) and information(s).
Date………………………………. ...........................................
Namrata Shrestha
ii
TRIBHUVAN UNIVERSITY
CENTRAL DEPARTMENT OF ZOOLOGY
Kirtipur, Kathmandu, Nepal
Ref. No.
RECOMMENDATION
This is to inform that the thesis entitled “Faunal Diversity and Water Quality of the
Beeshazar Lake, Chitwan, Nepal” has been carried out by Ms Namrata Shrestha for the
partial fulfillment of the requirements for the Degree of Master of Science in Zoology
with special paper Ecology and Environment. This is her original work and has been
carried out under my supervision. To the best of my knowledge, this thesis has not been
submitted for any other degree in any institutions.
Date : ............................................... …………………………………
Khadga Basnet, Ph.D.
Professor and Supervisor
Central Department of Zoology
Tribhuvan University
Kirtipur, Kathmandu, Nepal

iii
TRIBHUVAN UNIVERSITY
CENTRAL DEPARTMENT OF ZOOLOGY
Kirtipur, Kathmandu, Nepal
Ref. No.
LETTER OF APPROVAL
On the recommendation of professor and supervisor Khadga Basnet, Ph.D., this thesis
submitted by Namrata Shrestha entitled “Faunal Diversity and Water Quality of the
Beeshazar Lake, Chitwan, Nepal” is approved for the examination and submitted to the
Tribhuvan University in partial fulfillment of the requirements for the Degree of Master
of Science in Zoology with special paper Ecology and Environment.
Date: …………………. ………………………………
Ranjana Gupta, Ph.D.
Professor and Head

iv
TRIBHUVAN UNIVERSITY
CENTRAL DEPARTMENT OF ZOOLOGY
Kirtipur, Kathmandu, Nepal
Ref. No.
CERTIFICATE OF ACCEPTANCE
This thesis work was submitted by Ms Namrata Shrestha entitled “Faunal Diversity and
Water Quality of the Beeshazar Lake, Chitwan, Nepal” has been accepted as a partial
fulfillment of the requirements for the Degree of Master of Science in Zoology with
special paper Ecology and Environment.
EVALUATION COMMITEE
………………………….
Khadga Basnet, Ph.D.
Professor and Supervisor
…………………………
Ranjana Gupta, Ph.D.
Professor and Head
…………………………...
External Examiner
…………………………......
Internal Examiner
Date : .....................................

v
ACKNOWLEDGEMENTS
I am truly grateful to Prof. Dr. Khadga Basnet, Central Department of Zoology,
Tribhuvan University, Kirtipur for his supervision, guidance valuable suggestion and kind
co-operation. I am indebted to Prof. Dr. Ranjana Gupta, Head of Department of Zoology
for her kind support.
I would like to express special thanks to all the teaching and administrative staff in the
Central Department of Zoology for their Support. I would like to acknowledge Central
Library of Tribhuvan University (T.U.), Laboratory of Central Department of Zoology,
Department of Nationals Parks and wildlife Conservation (DNPWC), Natural History
Museum and National Trust for Nature Conservation (NTNC) for providing me required
information. I am also thankful to Meteorological station, Bharatpur, Nepal providing
Climate data of the study area.
I would like to convey my thankfulness to all local villagers for helping me during the
period of my field work in the Beeshazar Lake. I am indebted to my colleagues
particularly Rina Shrestha, Mukunda Aryal and Brajesh Shrestha. I hereby love to
appreciate everyone who directly and indirectly helped and encouraged me for this study.
I am also thankful to my brothers Mr. Rupesh Shrestha and Saurav Shrestha for help in
the field work.
Finally, I am very much grateful to my parents and other family members for continuous
support during the whole period of my study and completion of this thesis work.
NAMRATA SHRESTHA
T.U. Registration No: 5-2-19-827-99
T.U. Examination Roll.No:1371
Batch: 2059/2060
vi
ABSTRACT
A survey of the Beeshazar Lake was conducted for the abundance and distribution of
macro-invertebrates and their relationship between physico-chemical factors at three
different sites (Outlet, Clear and Inlet channel). A total of 11 faunal species represented
by five groups were recorded during the investigation viz, Oligochaetes, Hirudins,
Insects, Gastropods and Bivalves. The overall macroinvertebrates recorded in the study
area are comprising dominant groups such as Oligochaetes (34%), Insects (26%),
Gastropods (24%), Bivalves (13%) and Hirudins (3%). The faunal density (ind.m2)
ranged from 63 to 106, 56 to 76 and 66 to 100 at sites 1-3 respectively, with highest value
in June at S1.The Shannon diversity and dominance index was ranged from 1.178-1.487
and 0.241-0.336. The species diversity and density were significant positive correlation
with temperature, pH, free Co2, and hardness but significant negative correlation with
dissolved oxygen and alkalinity. The result showed that the variations in physico-
chemical factors affects the distribution of the macroinvertebrates.

vii
CONTENTS
DECLARATION i
RECOMMENDATION ii
LETTER OF APPROVAL iii
CERTIFICATE OF ACCEPTANCE iv
ACKNOWLEDGEMENTS v
ABSTRACT vi
CONTENTS vii
LIST OF TABLES x
LIST OF FIGURES xi
LIST OF PHOTOGRAPHS xii
LIST OF ABBREVIATIONS xiii
1. INTRODUCTION 1-4
1.1 Background 1
1.2 Objectives 3
1.3 Justifications 3
1.4 Statement of the Problems 4
2. LITERATURE REVIEW 5-11
2.1 Abundance and distribution of macroinvertebrates 5
2.2 Physico-chemical parameters 7
2.3 Relationship between physical-chemical parameters and fauna 10
3. MATERIALS AND METHODS 12-
3.1 Study Area 12
3.1.1 Physical Features 12
3.1.1.1 Location 12
3.1.1.2 Climate 12
3.1.1.3 Hydrology 12
3.1.1.4 Geology 15
3.2 Biological Features 15
3.2.1 Flora 15
3.2.2 Fauna 15
viii
3.3 Socio-economic and Cultural features 16
3.4 Methods of Sampling 16
3.4.1 Sampling Sites 16
3.4.2 Biological characteristics 17
3.4.2.1 Sampling of Macro invertebrates 17
3.4.2.2 Collection of water Samples 17
3.5 Analysis methods of physico-chemical parameters 17
3.5.1 Temperature 17
3.5.2 pH 17
3.5.3 Dissolved Oxygen 18
3.5.4 Free Carbondioxide 18
3.5.5 Total Alkalinity 19
3.5.6 Total Hardness 20
3.6 Statistical Analysis 20
4. Results 21-35
4.1. Occurrence of macro invertebrates 21
4.1.1 Total numbers of animals 21
4.1.2 Species composition of Macro-invertebrates 21
4.1.3 Shannon index of diversity 24
4.1.4 Index of dominance 25
4.2 Physico-chemical Parameters of Lake Water 26
4.2.1 Physical parameters 26
4.2.2 Chemical parameters 27
4.2.3 Relationship between faunal diversity and physico-chemical parameters
30
4.3 Biodiversity and physico-chemical factors 31
5. Discussion 36-39
5.1 Abundance and distribution of macroinvertebrates 36
5.2 Analysis of physico-chemical factors 37
5.2.1 Temperature 37
5.2.2 pH 37
5.2.3 Free Carbondioxide 38

ix
5.2.4 Dissolved oxygen 38
5.2.5 Total alkalinity 39
5.2.6 Total Hardness 39
5.3 Relation between macro-invertebrates and physico-chemical factors 39
6. Conclusions and Recommendations 40
7. References 41-44
8. Appendices 45
I. PCA analysis data sheet (R Package 3.3.2) 46

x
LIST OF TABLES
Table Title of tables Pages
1. Sitewise occurrence of macro-invertebrates 23
2. Relationship between fauna and physical and chemical factors 30

xi
LIST OF FIGURES
Figure Title of figures Pages
1 Location map of the Beeshazar and associated Lake 13
2 Location of three sampling sites of the study Area 14
3 Total counting of fauna at three sites of the Beeshazar Lake during the
study period 21
4 Relative abundance of different faunal groups at three sites during the
study period 2
5 Monthly variations in Shannon diversity index (H) of macro-invertebrates
in the Beeshazar Lake during the study period 25
6 Monthly variations in index of dominance (D) of macro invertebrates in
the Beeshazar Lake during the study period 25
7 Monthly variations in temperature of water of three sites of the Beeshazar
Lake during the study period 26
8 Monthly variations in pH of water of three sites of the Beeshazar Lake
during the study period 27
9 Monthly variations in DO of water of three sites of the Beeshazar Lake
during the study period 28
10 Monthly variations in free Co2 of water of three sites of the Beeshazar
Lake during the study period 28
11 Monthly variations in total alkalinity of water of three sites of the
Beeshazar Lake during the study period 29
12 Monthly variations in total hardness of water of three sites of the
Beeshazar Lake during the study period 29
13 PCA biplot showing the relationship between the physico-chemical
parameters and species in S1 (outlet) during the study period 31
14 PCA biplot showing the relationship between the physico-chemical
parameters and species in S2 (clear) during the study period 32
15 PCA biplot showing the relationship between the physico-chemical
parameters and species in S3 (inlet) during the study period 33
16 PCA biplot showing the relationship between the species and months
during the study period 34
17 PCA biplot showing the relationship between the species, sites and
physico-chemical parameters during the study period 35

xii
LIST OF PHOTOGRAPHS
Photograph Title of photographs Pages
1 Study Area 45
2 Outlet Channel (S1) 45
3 Clear (S2) 45
4 Near inlet Channel (S3) 45

xiii
LIST OF ABBREVIATIONS
Abbreviated from Details of abbreviations
BOD Biological Oxygen Demand
BPP Biodiversity Profiles Project
CNP Chitwan National Park
DO Dissolved Oxygen
GoN Government of Nepal
GPS Global Positioning System
ICIMOD Integrated International Centre for integrated Mountain
Development
IUCN International Union for Conservation of Nature
KM Kilometer
MOFSC Ministry of Forests and Soil conservation
TDS Total Dissolved Solid
VDC Village Development Committee
WBC Wetlands and Biodiversity Conservation
WHO World Health Organization

1
1. INTRODUCTION
1.1 Background
Lakes and wetlands are important features of Earth's landscape. They provide valuable
habitats to plants and animals, moderate hydrological cycles, influence microclimates,
enhance the aesthetic beauty of landscape and extend many recreational opportunities to
human kind (Sharma et al., 2010). Nepal is home to a wide range of wetlands. The total
area of wetlands has been estimated to be 3827Km2 covering approximately 2.6% of total
area of Nepal (GoN/MFSC, 2010). Natural succession aggravated by over growth of
macrophytes like water hyacinth (Eicchornia crassipes) and water caltrop (Trapa sp.) is
commonly seen in many lakes of the Tarai and mid-hills. The excessive amounts of
nutrients favour the growth of algae and weeds leading to eutrophication (Thilaga et al.,
2005). Eutrophication is enriched nutrients condition in water body. Eutrophication is
driven by factors such as high nutrient concentration and stagnation for prolonged periods
with suitable temperature, oxygen concentration and proper light regime (Ginkel,
2011).The eutrophication results in direct and indirect biological changes. With increases
in nutrients levels, the algal species composition change. Noxious blooms of algae
become major problem (Jonge et al., 2002). The algal bloom use the oxygen and cause
decreased dissolved oxygen. Eutrophication threatens not only ecology and potential
recreational opportunities of the sensitive ecosystem of wetlands but also lifestyle and
livelihood of local community (Kairu, 2001).
Water quality refers to the physical, chemical and biological characteristics of water.
Water quality in wetland is important aspect for conservation and development, because it
determines spatio-temporal dynamics of aquatic organism. The physico-chemical
characteristics of the water are of great significances for any aquatic life. Each species has
certain tolerance level and reflex action towards particular type and content of physico-
chemical parameters. The floristic and faunal diversity of wetland is influenced by several
physico-chemical parameters such as water transparency, velocity depth, pH, nutrients etc
(Burlakoti, 2004).
The community of organisms that live on, or in, the bottom of a water body is known as
benthos. The benthic community is complex and includes a wide range of organisms from
bacteria to plants (Phytobenthos) and animals (zoobenthos) and forms the different levels

2
of the food web. Benthic animals are generally classified according to size; microbenthos
<0.063mm, meiobenthos 0.063 - 1.0 (or 0.5mm), macrobenthos >1.0 and sometimes
megabenthos >10.0 mm (Tagliapietra, 2010).
The composition of the benthic fauna has largely been considered as a good indicator of
water quality. The major macro invertebrates found in freshwater are flatworms, annelids,
mollusks, crustaceans and insects. In pattern of macro invertebrate community structure,
four types of environmental changes have been documented as increased inorganic
micronutrients, increased organic loading, substrate alteration and toxic chemical
pollution. In some cases severe organic pollution, siltation or toxic chemical pollution
may reduce or even eliminate the entire macro invertebrate community from an affected
area (APHA, 1998).
Macrobenthos are as an indicator organisms of an aquatic ecosystems (Ganesh and
Raman, 2007). Various kinds of macro-invertebrates like Oligochaeta, Diptera,
Orthoptera, Ephemetroptera, Neuroptera, Hemiptera etc. occur in lakes. A survey of the
Beeshazar Tal showed 37 species of aquatic insects found (IUCN, 1998).
The chemical analysis was used to determine the presence and concentration of most
inorganic and organic chemicals that pollute water. Temperature is an important factor to
consider when assessing water quality. Water temperature directly affects the metabolic
rates and biological activity of aquatic organisms.
Dissolved Oxygen (DO) refers to the level of free, non-compound oxygen present in
water or other liquids. It is an important parameter in assessing water quality because its
influence on the organisms living within a body of water. A DO level that is too high or
low can harm aquatic life and affect water quality. Oxygen concentration is important for
benthic animals and there are strong correlations between the occurrence of particular
species and the lowest oxygen concentration reached at the surface of the sediments in
summer (Moss, 1998).
pH is a measure of the concentration of hydrogen ions in a solution and thus expresses the
intensity of an acid or base. And increase in acidity results in a lower pH, where an
increase in alkalinity (base) raises the pH. The alkalinity of water also plays an important
role in daily pH levels. The process of photosynthesis by algae and plants uses hydrogen

3
thus increasing pH levels. Maintaining a stable, moderate pH is very important for
wetlands because they serve as fish and amphibian breeding grounds.
The Co2 concentration can influence pH levels. Carbondioxide is the most common cause
of acidity in water. Photosynthesis, respiration and decomposition all contribute to pH
fluctuations due to their influences on Co2 levels. pH also changes diurnally and
seasonally due to the variation in photosynthetic activity which increases the pH due to
consumption of Co2 in the process (Trivedy and Goel, 1984).
1.2 Objectives
The main objective of the study is to analyze the relationship between physico-chemical
factors and faunal diversity of the Beeshazar Lake at Chitwan. The Specific objectives
were:
To determine the abundance and distribution of macro-invertebrates.
To analyze the monthly variations of physical and chemical factors
To asses physico-chemical parameters that affect macro invertebrate and
their distribution.
1.3 Justification
These objectives are important for several reasons. Wetland area is the main water reserve
for the wildlife living in that area. The Beeshazar Lake and associated wetlands has been
recently listed as a Ramsar site in Nepal (13 August 2003), establishing its global
environmental significance. The aquatic vegetation is represented by mainly water
hyacinth (Eichhornia crassipes), water chestnut (Trapa bispinosa), water velvet (Azolla
imbricata), duckweed (Lemna spp.) etc. were spreading and seriously damaging most
parts of the lake. Information on physical, chemical and biological characteristics of water
is very important as these characteristics determine the Spatio-temporal dynamics of the
water quality, aquatic biodiversity, health quality and sustainable use of the lake. The
study will explore such information of the lake and make an important contribution to
understand the relationship between the benthic organisms and water quality.
4
1.4 Statement of the Problems
The Beeshazar and associated lakes provide excellent habitat as water hole and corridor
for globally threatened species of birds and endangered wildlife species (Kafle & Savillo,
2009; Siwakoti & Karki, 2009). Intense anthropogenic and natural factors have put
wetlands of Nepal under adverse pressure (Kafle & Savillo, 2009). It has degraded water
quality and its amenity value. Information on wetlands macro-invertebrates is useful to
their management. Realizing these facts, my research is intended to record the inventory
of aquatic fauna and to analyze the seasonal limnological parameters such as physico-
chemical components, composition and distribution pattern of macro-invertebrates
community of the Beeshazar Lake so as to identify the ecological status of Beeshazar
Lake. It establishes biota-environmental relationship, which very useful information for
conservation and sustainable management of the lake. The obtained data and analysis can
be further utilized for prosperous management of lake.

5
2. LITERATURE REVIEW
2.1 Abundance and distribution of macro invertebrates
Basaula (2000) studied low abundance of Tubificidae, Chironomidae, Ephemeroptera,
and Plecoptera showed that the water quality of the Baghmati River near the Baghdaur
was not polluted because of presence of May flies and caddis flies were indicated
unpolluted water condition of the Baghmati River near Baghdaur.
Dutta and Malhotra (1986) observed Oligochaetes in the Gadhigarh stream, which is free
of pollution. They were of the bottom was organically rich and the current was slow.
Highest number of Oligochaetes has been observed during April. In the course of present
investigation, peak period of aquatic vegetation recorded from February to April,
followed by a decline in the following months.
Gawad (2013) studied the spatial-temporal variations of macrobenthic fauna in Lake
Nasser Khors at four seasons. Annelida, Arthropoda and Mollusca were the most
dominant groups in the lake during the study period being 72.65%, 26.09% and 1.35%
respectively.
Ghosh (1993) studied that the physico-chemical parameters and benthic fauna of Bagmati
river. Several parameters in upstream of river were found within the range expected in a
clean running water system but it was not founding downstream. Altogether 10 taxa of
benthos were identified in the river.
Mahapatro et al. (2009) studied the abundance of macrobenthos in outer channel area of
Chilika lagoon in the East Coast of India. They found total 27 species of macrobenthos
organisms were collected during the study period. Crustacea was emerged as the most
dominate group representing 9 species followed by Polychaetes with 8 species while 5
species belonged to Bivalvia and 3 species to Gastropoda.
Thilagavathi et al. (2013) studied that the distribution and diversity of macrobenthos in
different Mangroove ecosystems of Tamil Nadu Coast, India. Among the three stations,
benthic macrofauna species comparatively higher in station I than Station II and III.
Benthic population density positively correlated with temperature, pH, salinity, dissolved
oxygen, nitrate, nitrite and inorganic phosphate.

6
Udash (1996) studied the ecological characteristics of Tamar Lake in Royal Chitwan
National Park and analyzed some physico-chemical parameters such as temperature, pH,
conductivity, total alkalinity, total hardness, dissolved oxygen, free carbon-dioxide,
calcium, magnesium, nitrate and orthophosphate. Do was found below permissible values
(WHO standard of water quality). The composition of benthic fauna and parameters of
lake indicated that the water of study sites was polluted.
Vaidya (1988) studied pollution of the Bagmati River in the Pashupati area on the basis of
diversity index macroinvertebrate fauna and found the level of pollution rising from low
at upstream sites to moderate and high at the downstream sites. The higher population of
pollution tolerant species in each sampling site during the month of May to August
indicated that the pollution level increased in summer.
Welch (1980) studied that benthos were those organisms, which were attached or resting
on the bottom or living under beneath the sediment. Zoobenthos includes micro and
macro-invertebrates. The macro invertebrate of running water was dominated by insects
and their diversity was the greatest.
Yadav (1989) in his dissertation work had found that the zooplankton in the lake was
contributed by five genera of protozoa, three genera of Rotifer, three genera of Ostracoda,
three genera of Copecoda and two genera of Cladocera. Among the five genera of major
groups of zooplankton, protozoa dominate over other group.
Yadav (1995) studied the physico-chemical parameters and benthos of Bagmati River.
The physico-chemical parameters and presence of macro-invertebrates showed that the
water quality of Bagmati river is unpolluted in upper streams. But the water qualities
gradually decrease in Pashupati area. Most of the physico-chemical parameters have been
exceeded the range of risk threshold value at downstream and created unfavorable
environment for the disappearance of various species Plecoptera, Ephemeroptera,
Trichoptera and favorable environment to the species like Chironomidae and Tubificidae.

7
2.2 Physico-chemical parameters
Bastakoti (2007) studied the physico-chemical characteristics of the Beeshazar Lake and
found the highest concentration of orthophosphate (0.094667±0.034443mg/lt) and total
nitrogen (2.026733±0.044049 mg/lt) in the monsoon season than other seasons. The study
concluded that high phosphorus concentrations was often associated with algal blooms,
cyanotoxin accumulation and reduced recreational use of freshwater lakes.
Bhattarai (1996) studied the physico-chemical environment and macro-invertebrates of
Lami Lake of Royal Chitwan National Park. Water temperature, pH, conductivity, Total
alkalinity, Total hardness, free carbon-dioxide, calcium, Magnesium, Nitrate etc of water
sample of lake were made monthly and these were found normal range necessary for
aquatic biota but most important parameter DO was found above the permissible level
throughout the study period.
Burlakoti (2004) studied the physico-chemical characteristics of the water are of great
significances for any aquatic life. Each species has certain tolerance level and reflex
action towards particular type and content of physico-chemical parameters. The floristic
and faunal diversity of wetland is influenced by several physico-chemical parameters
such as water transparency, velocity depth, pH, nutrients etc.
Chhetry et al. (2004) studied the physico-chemical parameters like air temperature, water
temperature pH, transparency, DO, free co2, alkalinity, chloride and BOD of the
Titrigachhi Daha. Transparency, pH, total hardness, DO and total alkalinity were
recorded maximum in winter season.
ICIMOD (2007) reported the Beeshazar Lake to have oligotrophic state in terms of the
low content of Chlorophyll-a due to the rich growth of macrophytes that prevents the
penetration of sunlight needed for photosynthesis.
Jayana (1997) studied on the physico-chemical analysis of water, riparian vegetation and
aquatic vegetation, primary productivity, benthic fauna, fish composition and
decomposition of macrophytes. The parameters like temperature, pH, conductivity, total
alkalinity, total hardness, free carbon-dioxide, calcium, Magnesium, Nitrate and
orthophosphate were analyzed. All these parameters meet WHO standard of water quality
but the value of dissolved oxygen was found below the permitted level of 5mg/lt in
8
January, May and June during study period indicates accumulation of organic materials in
the lake as well as Oligochaetes are least dominant groups.
Karmacharya (1990) studied that the Manohara, Dhobikhola and Vishnumati were found
polluted which was clearly indicated by the analysis of physico-chemical, biological and
bacteriological quality of the river water.
Karki and Chhetri (2007) identified various factors as threats to the Nepalese wetlands.
The threats identified were succession, pollution, dam construction, siltation, lack of
awareness, alarming rate of groundwater extraction, population pressure, inappropriate
wetland management and climate change.
Khopkar (2004) studied that the water temperature affects the physical, chemical and
biological environment of the lake directly or indirectly. The pH is the measures of
intensity of acidity or alkalinity and measures the concentration of hydrogen ions in water
Mc Eachern (1994) studied the physico-chemical characteristics of water in six sites in
Chitwan district. The study observed pH 7.2-7.5 and dissolved oxygen ranging from 0.5-
4.3 mg/lt in Devital. The value of dissolved oxygen was found below permitted level
indicates the lake tending to be polluted.
Niraula (2012) studied water quality in the Beeshazar Lake and found less favorable to
aquatic organisms with low pH and transparency, low dissolved oxygen and high nutrient
concentration (Nitrogen and Phosphorus) challenging the conservation of critically
endangered Gharial, a vulnerable marsh Crocodile and many species of fishes. The lake
was found eutrophic in nature by nitrogen concentration, transparency and hyper-
eutrophic condition based on phosphorus criteria. Lake sediments were high in organic
matter content and nutrient concentrations, signifying a potential internal source of
nutrient loading in the overlying water.
Pradhananga et al. (1987) studied some physico-chemical parameters of water quality of
the Bagmati River. They found parameters like pH, conductivity, orthophosphate and
ammonical nitrogen not exceeding permissible values and Do above permissible value
(Japanese, EEC and WHO standards). On the other hand parameters like suspended solids
and BOD exceeded the permissible values.

9
Sisodia et al. (2004) studied the water quality in reference to its physico-chemical
characteristics in Jamwa Ramgarh Lake, India. The constituents monitored included
temperature, pH, TDS, hardness, Do, alkalinity and chloride ion. A significant variation
in theses parameters were observed throughout the study period. And the study revealed
that if such marked variation in parameters prevailed then it will soon become an
ecologically inactive lake.
Sharma et al. (1979) studied that the physico-chemical characteristics of freshwater to be
increased in polluted than non-polluted ones. Conductivity was high and almost twice in
polluted water. Ammonia, nitrate, nitrite chloride, phosphate were also found high in
polluted water. In contrast, DO was high in unpolluted ones than in polluted. It was found
the maximum DO in summer and the lowest in winter in unpolluted water bodies. On the
other hand in polluted water bodies the oxygen was less in summer than in winter.
Thomas (1975) noted Chemical tests apply to the moment of Sampling. Both approaches
i.e. Physico-Chemical and biological Parameters are necessary to define water quality.
Trivedy and Goel (1884) noted that the increasing industrialization, Urbanization and
development activities and consequent pollution of water has brought a veritable water
crisis. Most of the rivers of the world receive mullions of liters of sewage, domestic
waste, industrial and agricultural effluents containing substances varying in
characteristics from simple nutrients to highly toxic substances.
Upadhaya and Rao (1980) reported Manohara to be less polluted than Dhobi Khola
Vishumati and Baghmati. They found Vishnumati and Baghmati had higher specific
conductivity and chlorine concentration among the six rivers in the Kathmandu valley.
The chemical parameters were found within the tolerable limits for domestic use and
could be classed as good quality for irrigation purposes. Dry months had higher values for
the chemical parameters than other seasons.
Wagh et al. (2012) studied that monitoring water quality of Nandur Madhmeswar
wetland. He observed the water quality of the wetland was found to be suitable to aquatic
and wildlife.
10
2.3 Relationship between physico-chemical parameters and fauna
Fouzia et al. (2013) studied aquatic biodiversity as ecological indicators for water quality
criteria for River Yamuna. The influences of physico-chemical parameters and its
biological diversity revealed that the quality of water has been slightly deteriorated
showing a fairly good diversity. The correlation of hydrological attributes and biological
diversity was good to some extent. However the condition of hydrological attributes had a
great effect on biotic diversity.
Mohammad et al. (2015) studied that the effect of physico-chemical factors of water on
the distribution of macrobenthic invertebrate fauna in the Hadejia-Nguru wetlands. They
found the altered physico-chemical properties of water together with growing occurrence
of the pollution indicator species, like Cryptochironomus sp. allows the wetland is
tending towards eutrophication.
Neku (1997) studied the effect of physico-chemical parameters and distribution of some
benthic macro-invertebrates of Vishumati river. The composition of macro-invertebrates
and physico-chemical parameters of the river indicates that the water of the Vishumati
river was polluted. During the study period group of animals such as Annelida, Mollusca
and Arthropoda phyla were recorded.
Pant et al. (1980) reported that the increase in eutrophication was accompanied by
increase in concentration of nitrogen, phosphorus and free carbon dioxide. These factors
greatly disturbed the ecological balance and biological life of the lake. The dominating
benthos was the members of Tubificidae and Chironomous species, which are the
indicators of organic pollution.
Tamrakar (1996) conducted a physico-chemical parameters, distribution and abundance
of zoobenthos in Manohara river for six months. The abundance and distribution of
zoobenthos in relation to different sites were determined by correlating them with
physico-chemical parameters of water.
Sharma (1997) studied the effect of physico-chemical factors on benthic fauna of
Bhagirathi River. He observed the lowest DO in August and the highest in January. The
highest value of benthic fauna was recorded in February and lowest in July and August.

11
He found insect population 96% of the total population. Among insects Coleoptera,
Diptera, Ephemeroptera, Hemiptera, Odonata, Plecoptera, and Trichoptera Contributing
12.18, 0.26, 47.93, 1.29, 11.14 and 22.02 respectively. The maximum in abundance of
lotic benthos was observed in winter and early summer phase of water current, riverine,
temperature, high content of DO and clarity of water during these months.
Shrestha (2004) studied the faunal diversity and water quality in the Trishuli river water
shed at Kurintaar in the study period, three stations (Pandure Khola of Thaguware VDC,
Dharapani and riverside spring) were taken for detection of water quality of spring water.
The physico-chemical parameters like temperature, pH, conductivity, total alkalinity, total
hardness, calcium, magnesium, nitrate and orthophosphate had no parameters of water
indicated that the spring water of the study sites was unpolluted.
Tamrakar (1996) conducted a physico-chemical parameters, distribution and abundance
of zoobenthos in Manohara River for six months. The abundance and distribution of
zoobenthos in relation to different sites were determined by correlating them with
physico-chemical parameters of water.

12
3. MATERIALS AND METHODS
3.1 Study Area
3.1.1 Physical features
3.1.1.1 Location
The Beeshazar Lake is located in the Chitwan district of Nepal and is the central Tarai of
a subtropical lowland region of Nepal. The geographical location of the lake is and 270
37' 04.6"' N Latitude 840 26' 11.3" E Longitude at an elevation of 286 m. The Beeshazar
Lake Complex occupies an area of about 3.2 km2 including mosaics of diverse habitat;
open water bodies, marshes, swamps, grasslands and forests. Lake has an open water area
of about 1 km2 and represents the second largest lake in Nepal (Niraula, 2012). The
Beeshazar just because it is about 20,000 feet away from the Tikauli Barrage (headwork
of Khageri Irrigation Canal) on the Mahendra Highway (Bhandari, 1996). The wetlands
lie 7.2 km south from the East West Highway following Khageri canal in Gitanagar and
Bachhauli VDC’s, Bharatpur and Ratnanagar municipalities; and 15 km from
Narayangarh Bazaar, Chitwan district, Narayani zone.
3.1.1.2 Climate
The lake area has a humid and subtropical monsoonal type of climate. Normally, January
is the peak of winter and May is the peak of summer in Nepal. The highest average
monthly maximum and minimum temperature recorded during the study period were
34oC in May and 5.5
oC in January. The highest precipitation was recorded 7.3 mm in
May and the lowest was 0.0 in January 2005 (Bharatpur municipality, Chitwan).
3.1.1.3 Hydrology
Water is received from direct precipitation during the monsoon and through inflow from
the Khageri irrigation canal. Lake water is supplied through the canal and the stream
during the dry season. The catchment area of the Lake helps control flooding in the
khageri Canal, and recharges the ground water and streams (GoN/MFSC/DNPWC/CNP,
2010). According to the survey of IUCN Nepal, shows that its depth in the center varies
from 3m in dry season to 5m in rainy season which is subjected to the flow of canal water
(Bhandari, 1996).

13
Figure 1. Location map of Beeshazar and associated Lakes

14
Figure 2. Location of three sampling sites of the study Area
S1 S1
S3 S2
S1
S3
S2
S1 = Outlet
S2 = Eastern Part
S3= Inlet Channel

15
3.1.1.4 Geology
The lake bed is situated on laterite soil. Its oligotrophic state is indicated by the low
content of Chlorophyll ‘A’ due to the rich growth of macrophytes; this prevents the
penetration of sunlight needed for photosynthesis. Land use patterns; 30% open forests,
40% dense forests, 15% grasslands and 15% pasturelands.
3.2 Biological Features
3.2.1 Flora
The terrestrial vegetation is dominated by Sal (Shorea robusta) forest. The prominent
associated species include Myrobalan (Terminalia alata), Slik Cotton (Bombax ceiba)
and Bot Dhainyaro (Lagerstroemia parviflora). The area records 37 vascular plants; 1
pteridophyte, 26 dicots and 10 monocots. The wetland vegetation consists of Sedge
(Cyperus spp.), Common Reed (Phargmites karka), Morning Glory (Lpomea carnea spp.
fistulosa) and Mikania (Mikania microrantha). The aquatic vegetation is represented by
extensive coverage of floating leafed species mainly Water Hyacinth (Eichhornia
crassipes), Water Chestnut (Trapa bispinosa) followed by Evening Primrose ( Ludwigia
adscendens). The free floating species include Water Velvet (Azolla imbricata) and Duck
Weed (Lemna spp.). The abundant submerged species include Hornwort (Ceratophyllum
demersum), Hydrilla ( Hydrilla verticillata) and Water Nymph (Najas minor). In general,
the vegetation is in floating leafed succession stage. Reed swamp formations are found in
backwaters in finger like projections, characteristic of an Ox-bow lake system
(GoN/MFSC, 2010).
3.2.2 Fauna
Altogether 26 species of mammals, 18 species of herpeto-fauna, 25 species of fishes, 37
species of aquatic insects, 273 species of birds ( 60 species being wetland dependent) and
131 species plants ( including 99 species are aquatic) have been identified in and around
the Beeshazar Tal (Bhandari, 1998). Some of the charismatic fauna and flora in the area is
the Royal Bengal Tiger (Panthera tigris tigris), one-horned rhino (Rhinoceros unicornis),
Gharial (Gavialis gangeticus), Mugger crocodile (Crocodylus palustris), Asiatic rock
python (Python molurus), vulnerable smooth-coated otter (Lutrogale perspicillata), sloth
bear (Melursus ursinus), Band-tailed Fishing Eagle (Haliaeetus leucoryphus) and lesser
adjutant stork (Leptoptilos javanicus) a globally threatened bird etc. (Himalayan Journal
16
of science, 2004). Due to its rich biodiversity value, especially with regards to the birds,
both local residents and migrants, the lake is designated as a Ramsar site (Ramsar site no.
1313) on 13th August, 2003.
3.3 Socio-economic and Cultural features
Socio-economic condition of the wetland area entirely depends upon the population and
their activities. Approximate population of the wetland area was 99,299. The major ethnic
groups were Brahmin, Chhetri, Damai, Kami, Newar, Tamang, Magar Tharu and other
indigenous people. The major crops grown in this area includes paddy during the
Monsoon followed by wheat and mustard during the winter in low land. Most of people
have farming as their primary occupation as well as farming of livestock includes cows,
buffaloes and goats (BPP, 1995).
3.4 Methods of Sampling
3.4.1 Sampling Sites
Sampling sites of the lake were selected on the basis of distance, easier to take water
samples, availability of light, human activities and flow of incoming and outgoing of
water.
On the basis of these reasons, three sampling sites were selected for the study of the
Beeshazar Lake by the help of Global positioning system (GPS).
Site S1: This site is situated near the outlet and is located at 270 37’ 03.5" N and 84
0 26
'16.5" E at an elevation of 111m on GPS. In this site, there is availability of light, human
disturbance is low.
Site S2: This site is situated in the eastern part of the lake (clear) and is located at 270 38'
50.2"N and 850
17' 03.4" E at an elevation of 183m on GPS. This site is clear and less
affected by vegetation. Bottom of this site was muddy.
Site S3: This site is situated near the inlet and is located at 270
36' 53.2" N and 840 26'
21.7" E at an elevation of 147m on GPS. This site is joined with Khageri irrigation canal
from where lake receives the runoff and shadow of the tree directly falls on the lake.

17
3.4.2 Biological Characteristics
3.4.2.1 Sampling of Macro invertebrates
The regular samplings of fauna were carried out from January to June 2005. The samples
were collected by using the Peterson’s Grab Sampler having an area of 0.025 m2. The
collected samples were first washed from the sediment and transferred with some water to
a coarse sieve with a mesh size of 0.5 mm. The macro invertebrates were treated with 5%
formalin and kept for further analysis. The identification of animals was carried out by
the publication of Standard Literature of Mullar (1774), Pennak (2001), Hickin (1945),
Lamarck (1822), Hutton(1849), Edmondson (1966), Brown (1980) etc. Population
density was made by individual counting of animals and their abundance was expressed
as ind. / m2.
3.4.2.2 Collection of water Samples
The physico-chemical parameters of the lake were studied from January to June 2005.
The surface water was collected from three sampling sites of wetland, once in every
month in pre-cleaned sample bottles. While collecting the water samples these bottles are
again rinsed with the water of same sites. The bottle was allowed to sink up to the desired
depth (5-10cm) and its mouth was opened and filled up and the cap locked underwater
before taken out of water. Immediately after collection the water samples, some
parameters such as temperature, pH, DO, free Co2 , alkalinity and total hardness of the
lake were analyzed in field by using methods of Trivedy and Goel (1984).
3.5 Analysis of physico-chemical parameters
3.5.1 Temperature
Water temperature was measured with the help of a Mercury thermometer. For the
measurement of water temperature, the bulb of the thermometer was dipped in a beaker
filled with water sample for about 2 minutes and reading was noted.
3.5.2 pH
pH of the water sample was measured by a digital pH meter (Hanna Instrument with an
accuracy of ±0.01). Before measuring the pH meter was first calibrated with standard
buffer solution of pH 4.0 and 9.2.The glass electrode was washed with distilled water and

18
dipped in a beaker containing fresh water sample until the reading stabilized at a certain
point. Then the reading was noted.
3.5.3 Dissolved Oxygen (DO)
DO was determined by Winkler's titration method by taking 300 ml sample of water with
2ml of Mnso4 and 2ml of alkaline potassium iodide (KI) in BOD bottle. The brown
precipitate was formed on the bottle which was shaken well and left to settle down
precipitate sufficiently. Then 2ml of concentrated sulphuric acid (H2So4) was added and
stopper was placed and inverted several times until the dissolution of precipitation was
completed. Then 100ml of sample from BOD bottle was taken in conical flask and
titrated against (0.025N) sodium thiosulphate (Na2S2O4) solution until a coffee brown
color appeared. At the moment a drop of a starch solution was added as indicator and
again titrated with sodium thiosulphate solution until blue color disappeared. The volume
of sodium thiosulphate solution consumed in getting the end point was noted. Three
readings were taken and mean was calculated out to determine the concentration of
dissolved oxygen as mg/lt by using the given formula,
Dissolved oxygen (mg/lt) = (ml ×N) of titrant ×1000 × 8
V2(V1-V)
V1
Where V1 =Volume of sample bottle after placing the stopper
V2=Volume of part of content titrated
V =Volume of MnSO4 and KI used
3.5.4 Free Carbondioxide
Free carbon dioxide was determined by taking the sample of 100 ml water in a clean
conical flask and a few drops of Phenolphthalein an indicator was added to it. If the
sample remains colorless, it was immediately titrated against 0.05N Sodium hydroxide
(NaoH) solution stirring with a glass rod until pink color appeared. The volume of sodium
hydroxide consumed in getting the end point was noted. Three readings were taken to get
mean reading for the determination of the free carbondioxide as mg/litre by using
following equation,

19
Free Co2 (mg/liter) = (ml × N) of NaOH × 1000 × 44
ml of sample used
Phenolphthalein acidity as Caco3 (mg/lt) = B ×N of NaoH ×1000 ×50
ml of sample used
Where, A= ml of NaoH used with methyl orange indicator
B = ml of NaoH used with Phenolphthalein indicator.
3.5.5 Total Alkalinity
Total alkalinity was determined by taking 100ml of sample in a conical flask and 2 drops
of Phenolphthalein indicator was added on it. The sample remains colorless which
indicated that the Phenolphthalein alkalinity zero. Immediately 2 or 3 drops of methyl
orange was added to the same sample and titrated against HCL (0.1 N) until the yellow
color changed to pink at the end. The volume of HCL consumed was noted which gave
the total alkalinity. Three readings were taken and the mean was taken out to convert total
alkalinity later as mg /liter by using the following equation,
TA as CaCo3 (mg/liter) = (B×Normality) of Hcl × 1000 × 50
ml of sample used
Where, B = ml of total Hcl used with Phenolphthalein and Methyl orange
TA =Total Alkalinity
Whenever the color changed to pink after addition of Phenolphthalein it was titrated with
0.1 Hcl until the color disappeared. PA alkalinity was calculated by the following
equation,
PA = (A×Normality) of Hcl × 1000×50
ml of sample used
Where, A = ml of Hcl used with Phenolphthalein
PA = Phenolphthalein Alkalinity
20
3.5.6 Total Hardness
Total hardness was determined by taking 50ml sample in a clean conical flask in which
2ml of ammonia buffer was added and 200mg of Erichrome Black as indicator was added
to it and shaken well. Then the sample was titrated against standard EDTA solution of
0.01 N till the color changed from wine red to blue. The volume of EDTA consumed was
noted. Three readings were taken and mean was carried out to convert total hardness as
mg/lt by following equation,
Total hardness as Caco3, mg/lt = ml of EDTA used × 1000
ml of sample used
3.6 Statistical Analysis
All the statistical analysis was carried out with the help of the Microsoft Excel. Diversity
indices such as Shannon’s index of diversity (H) and index of dominance (D) reflects the
occurrence of species within community. This helps to understand how the macro
invertebrates were distributed in the collected samples. Correlations between the fauna
and physico-chemical parameters of water were evaluated by using Pearson’s correlation
analysis. Multivariate analysis such as Principal component analysis (PCA) was based on
the macro faunal abundance, diversity indices and with physico-chemical parameters.
This was determined by using R package (version 3.3.2).

21
4. RESULTS
4.1. Occurrence of macro invertebrates
4.1.1 Total numbers of animals
All total of 1456 animals were recorded in six months from all three sampling sites of the
Beeshazar Lake during the study period from January to June 2005. By site, faunal
density (ind.m2) ranged from 63 to 106, 56 to 76 and 66 to 100 at sites 1-3 respectively,
with highest value in June at S1. Comparatively, S1 supported higher abundance 35.98%
and than 35.92% and 28.09% in S3 and S2 respectively.
Figure 3. Total counting of fauna at three sites of the Beeshazar Lake during the
study period
4.1.2 Species composition of Macro-invertebrates
A total of 11 macroinvertebrates represented by five groups were recorded during the
investigation viz, Oligochaetes, Hirudins, Insects, Gastropods and Bivalves. From the
results obtained that Oligochaetes was dominant (493 ind/m2) consisting of 2 species and
contributed to 34% of the total fauna during the study period. The other groups like
hirudins consists of 1 species and contribute to 3%, insects consist of 3 species and
contribute to 26%. Gastropods consist of 4 species and contribute to 24% and also
bivalves consist of 1 species and contribute to 13% of total faunal population was shown
in Figure 4.
22
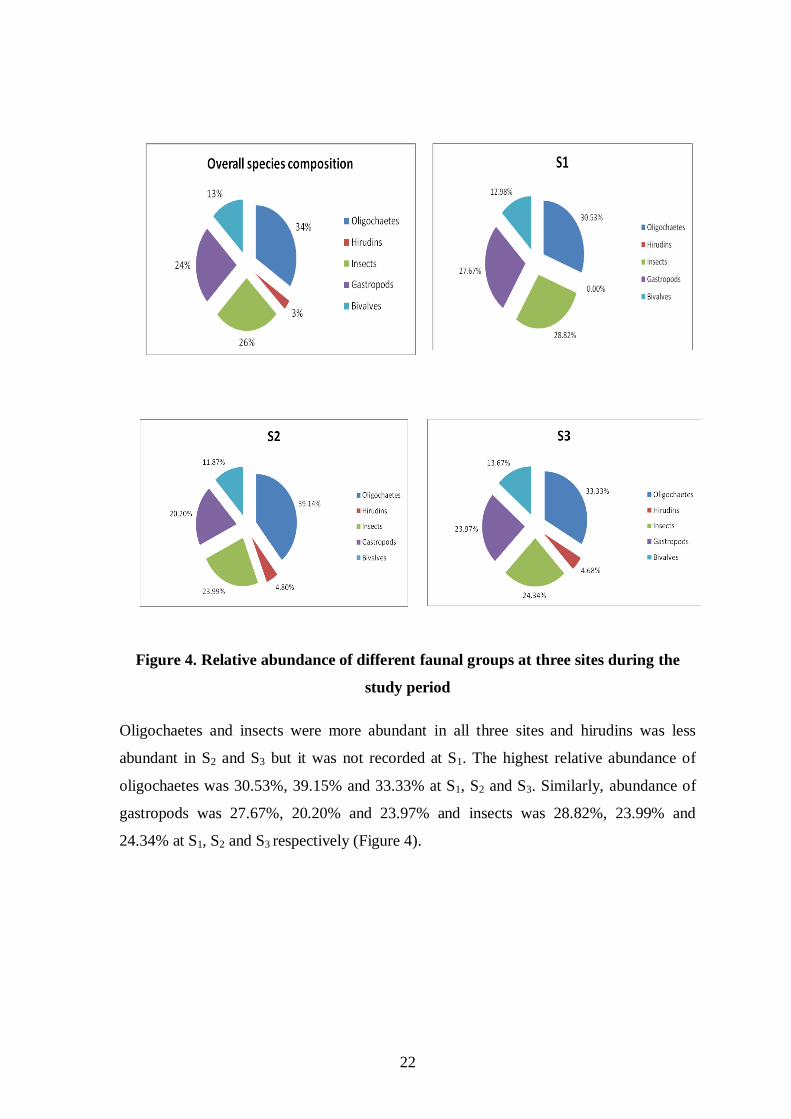
Figure 4. Relative abundance of different faunal groups at three sites during the
study period
Oligochaetes and insects were more abundant in all three sites and hirudins was less
abundant in S2 and S3 but it was not recorded at S1. The highest relative abundance of
oligochaetes was 30.53%, 39.15% and 33.33% at S1, S2 and S3. Similarly, abundance of
gastropods was 27.67%, 20.20% and 23.97% and insects was 28.82%, 23.99% and
24.34% at S1, S2 and S3 respectively (Figure 4).

23
Table 1. Sitewise occurrence of macro-invertebrates (+ Present, - Absent).
Dominant Taxa S1 S2 S3
Annelida
Oligochaeta
Tubificidae
Branchiura sowerbyi (Beddard, 1892) + + +
limnodrilus hoffmeisteri (Claparede, 1862) + – +
Hirudinea
Glossiphonidae
Glossiphonia sp. – + +
Arthropoda
Hemiptera
Nepidae
Nepa sp. (Linnaeus, 1758) + + +
Ranatra sp. (Fabricius, 1790) + + +
Diptera
Chironomidae
Chironomus sp. + + +
Mollusca
Gastropoda
Viviparidae
Bellamya bengalensis (Lamarck, 1882) + + +
Lymnaeidae
Lymnaea acuminata (Lamarck, 1822) + + –
Planorbidae
Indoplanorbis exustus (Deshayes, 1834) + + +
Gyraulus convexiusculus (Hutton, 1849) + + +
Bivalvia
Unionidae
Lamellidens sp. (Lamarck, 1819) + + +

24
Annelida
Phylum Annelida was represented by two classes Oligochaeta and Hirudinea.
The family belonging to class Oligochaeta was Tubificidae. Branchiura sowerbyi and
limnodrilus sp. were recorded in this family. Branchiura sowerbyi was recorded at all
three sites but limnodrilus sp. was recorded only at sites S1 and S3.
The family belonging to class Hirudinea was Glossiphonidae. The species belonging to
this family includes Glossiphonia sp. recorded only at S2 and S3 but it was found at S1.
Arthropoda
Phylum Arthropoda was represented by two orders Hemiptera and Diptera. The family
belonging to order Hemiptera was Nepidae and the species belonging to this species
family were Nepa sp. and Ranatra sp. only at S1 and S3. Similarly the family belonging to
order Diptera was Chironomidae and the species belonging to order Diptera includes
Chironomus sp. at all S1, S2 and S3.
Mollusca
Phylum Mollusca was represented by two classes Gastropoda and Bivalvia.
The family belongings to class Gastropoda were Lymnaeidae, Viviparidae and
Planorbidae. In Lymnaeidae family Lymnaea acuminata were recorded only at site S1and
S2 but not found in S3. The species belonging to family Viviparidae was Bellamya
bengalensis at all three sites. The species belonging to family Planorbidae includes
Indoplanorbis exustus and Gyraulus convexiusculus were recorded at all three sites.
Class Bivalvia was represented by the family Unionidae. The species belonging to this
family includes Lamellidens sp. recorded at all three sites S1, S2 and S3.
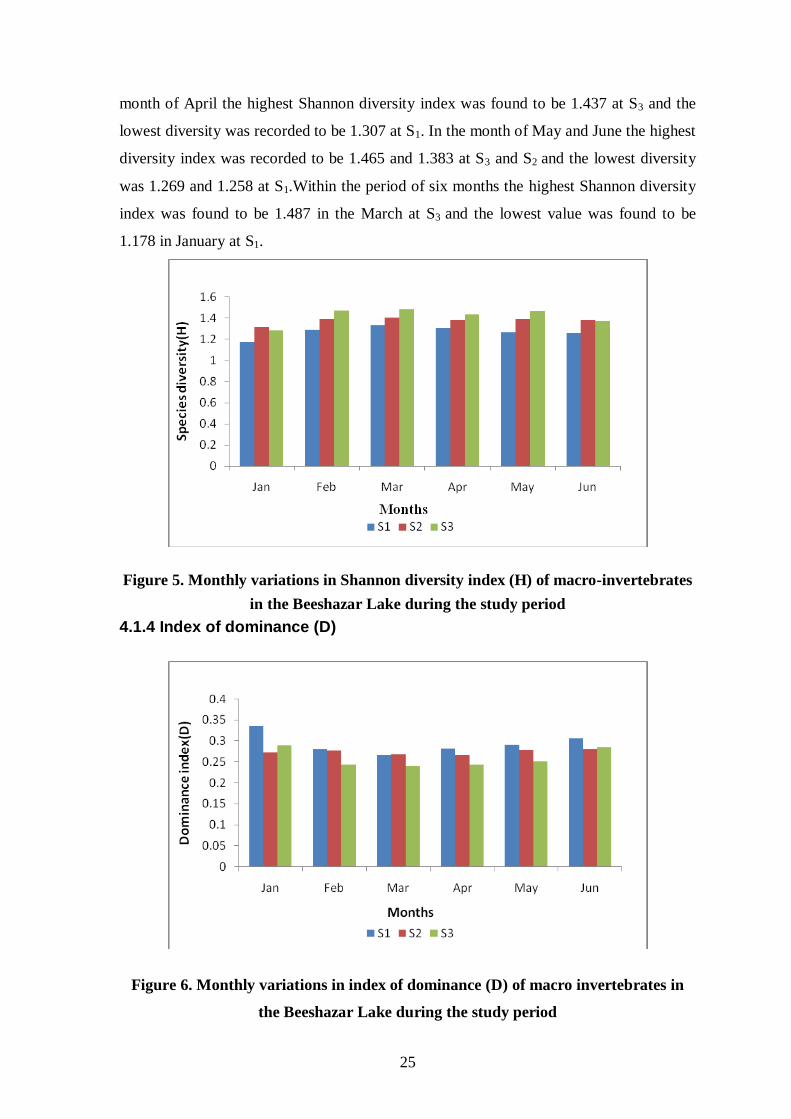
4.1.3 Shannon index of diversity (H)
In the month of January the highest Shannon diversity index (H) was found to be 1.317 at
S2 and the lowest value was found to be 1.178 at S1. In the month of February the highest
Shannon diversity index was found to be 1.470 at S3 and the lowest diversity was found
to be 1.291 at S1. In the month of March the highest Shannon diversity index was found
to be 1.487 at S3 and the lowest diversity was found to be 1.336 at S1. Similarly in the
25
month of April the highest Shannon diversity index was found to be 1.437 at S3 and the
lowest diversity was recorded to be 1.307 at S1. In the month of May and June the highest
diversity index was recorded to be 1.465 and 1.383 at S3 and S2 and the lowest diversity
was 1.269 and 1.258 at S1.Within the period of six months the highest Shannon diversity
index was found to be 1.487 in the March at S3 and the lowest value was found to be
1.178 in January at S1.
Figure 5. Monthly variations in Shannon diversity index (H) of macro-invertebrates
in the Beeshazar Lake during the study period
4.1.4 Index of dominance (D)
Figure 6. Monthly variations in index of dominance (D) of macro invertebrates in
the Beeshazar Lake during the study period

26
In the month of January the highest index of dominance was found to be 0.336 at S1 and
the lowest dominance was found to be 0.273 at S2. In the month of February the highest
index of dominance was found to be 0.281 at S1 and the lowest dominance was found to
be 0.243 at S3. In the month of March the highest index was found to be 0.268 at S2 and
the lowest dominance was found to be 0.241 at S3. Similarly in the month of April the
highest index of dominance was found to be 0.282 at S1 and the lowest dominance was
recorded to be 0.243 at S3. In the month of May and June the highest index of dominance
was recorded to be 0.291 and 0.307 at S1 and the lowest dominance was 0.251 and 0.281
at S3 and S2.Within the period of six months the highest value of dominance was recorded
in the month of January at S1 and the lowest value was found in the month of March at S3.
4.2 Physico-chemical Parameters of lake Water
The results of physico-chemical parameters from the three sampling sites S1, S2 & S3 of
the Beesh Hazari Lake during the study period.
4.2.1 Physical parameters
Figure 7. Monthly variations in temperature of water of three sites of the Beeshazar
Lake during the study period
At S1 the temperature of water was recorded 18.2oC in January gradually increased and
reached maximum level 31.2oc in June. In other months the temperature was ranged from
21.2oC to 28
oC. At S2 the temperature was recorded 19.1
oC in January and increased and
reached maximum level 30.2oC in June. In other months the temperature was ranged from
20.2oC to 29.7
oC. At S3 the temperature was recorded 18.5
oC in January and increased
27
and reached maximum level 32.4oC in June. In other months the temperature was ranged
from 20.8oC to 29.9
oC.
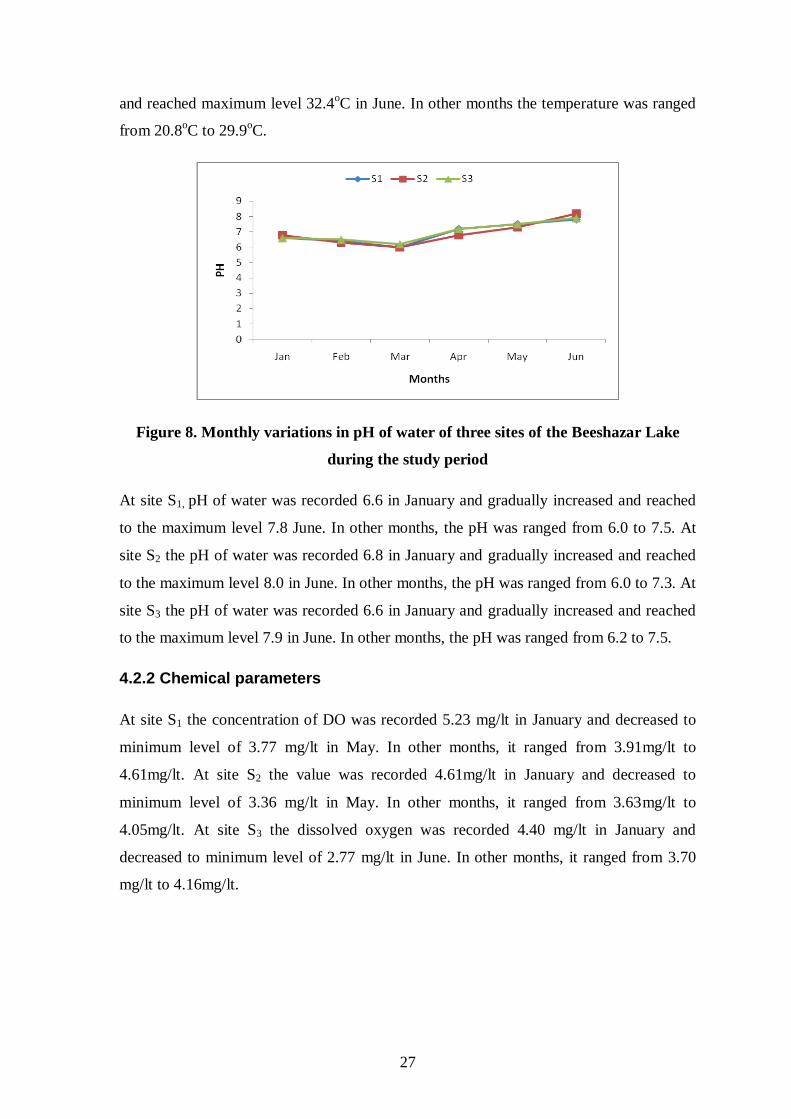
Figure 8. Monthly variations in pH of water of three sites of the Beeshazar Lake
during the study period
At site S1, pH of water was recorded 6.6 in January and gradually increased and reached
to the maximum level 7.8 June. In other months, the pH was ranged from 6.0 to 7.5. At
site S2 the pH of water was recorded 6.8 in January and gradually increased and reached
to the maximum level 8.0 in June. In other months, the pH was ranged from 6.0 to 7.3. At
site S3 the pH of water was recorded 6.6 in January and gradually increased and reached
to the maximum level 7.9 in June. In other months, the pH was ranged from 6.2 to 7.5.
4.2.2 Chemical parameters
At site S1 the concentration of DO was recorded 5.23 mg/lt in January and decreased to
minimum level of 3.77 mg/lt in May. In other months, it ranged from 3.91mg/lt to
4.61mg/lt. At site S2 the value was recorded 4.61mg/lt in January and decreased to
minimum level of 3.36 mg/lt in May. In other months, it ranged from 3.63mg/lt to
4.05mg/lt. At site S3 the dissolved oxygen was recorded 4.40 mg/lt in January and
decreased to minimum level of 2.77 mg/lt in June. In other months, it ranged from 3.70
mg/lt to 4.16mg/lt.

28
Figure 9. Monthly variations in DO of water of three sites of the Beeshazar Lake
during the study period
Figure 10. Monthly variations in free Co2 of water of three sites of Beeshazar Lake
during the study period
The free Co2 of the lake water was recorded regularly during the study period. At S1 the
free Co2 was recorded 15.23 mg/lt in January and increased to maximum level of 20.16
mg/lt in June. In other months, it ranged from 15.99 mg/lt to19.85mg/lt. At S2 the free
Co2 was recorded 15 mg/lt in January and increased to maximum level of 23.16 mg/lt in
June. In other months, it ranged from 16.98 mg/lt to 21.85 mg/lt. At S3 the free Co2 was
recorded 16.96 mg/lt in January and increased to maximum level of 22.20 mg/lt in June.
In other months, it ranged from 17 mg/lt to 21.20 mg/lt.

29
Figure 11. Monthly variations in total alkalinity of water of three sites of the
Beeshazar Lake during the study period
At S1 the total alkalinity of the lake water was 119.9 mg/it in January and increased to
128 mg/lt in March. In other months, it ranged from 121.9 mg/lt to 126.6 mg/lt. At S2 the
total alkalinity was recorded 98.8 mg/lt in January and increased to maximum level of
129.6 mg/lt in May. In other months, it ranged from 102.8 mg/lt to 125.5 mg/lt. At S3 the
total alkalinity was recorded 100.9 mg/lt in January and increased to maximum level of
130.6 mg/lt in May. In other months, it ranged from 104.8 mg/lt to 128.6 mg/lt.
Figure 12. Monthly variations in total hardness of water of three sites of the
Beeshazar Lake during the study period
At S1 the total hardness of the lake water was 138.11 mg/it in January and increased to
reached 156.77 mg/lt in May. In other months, it ranged from 92.11mg/lt to 141.88mg/lt.
At S2 the total hardness was recorded 140.11 mg/lt in January and increased to maximum
30
level of 170.77 mg/lt in April. In other months, it ranged from 95.11 mg/lt to145.88 mg/lt.
At S3 the total hardness was recorded 142.11 mg/lt in January and increased to maximum
level of 146 mg/lt in June. In other months, it ranged from 98.77 mg/lt to 140.88 mg/t.
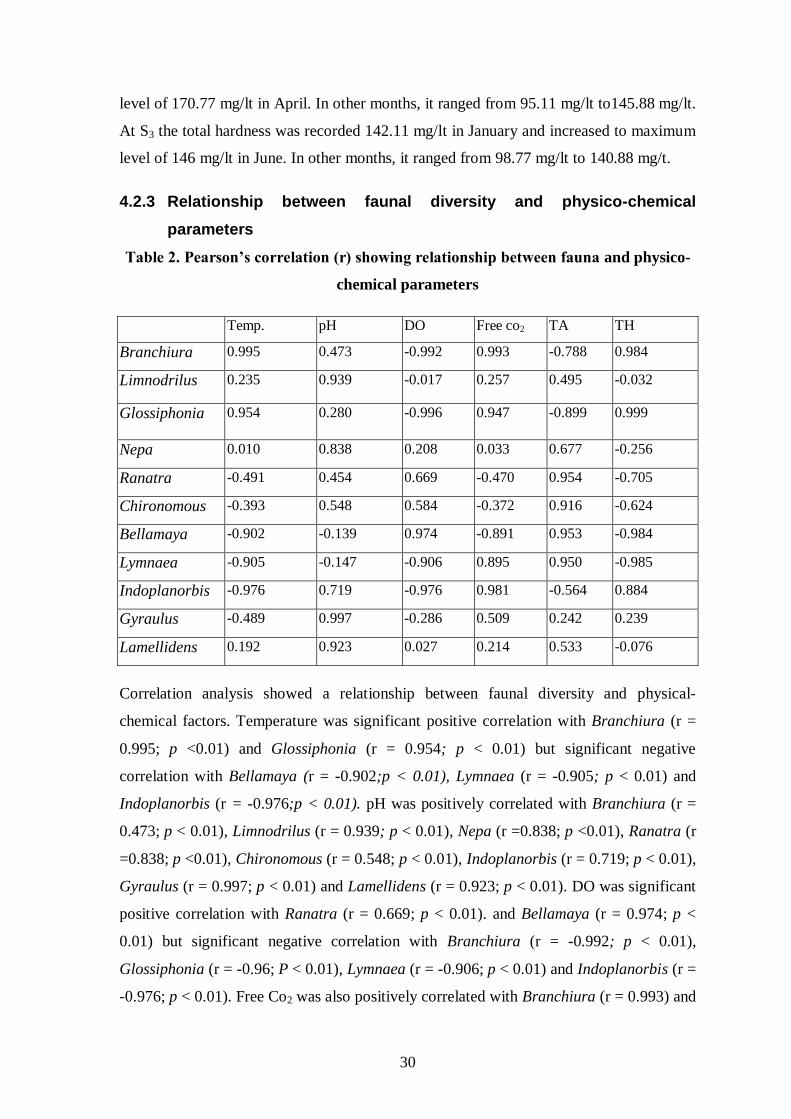
4.2.3 Relationship between faunal diversity and physico-chemical
parameters
Table 2. Pearson’s correlation (r) showing relationship between fauna and physico-
chemical parameters
Temp. pH DO Free co2 TA TH
Branchiura 0.995 0.473 -0.992 0.993 -0.788 0.984
Limnodrilus 0.235 0.939 -0.017 0.257 0.495 -0.032
Glossiphonia 0.954 0.280 -0.996 0.947 -0.899 0.999
Nepa 0.010 0.838 0.208 0.033 0.677 -0.256
Ranatra -0.491 0.454 0.669 -0.470 0.954 -0.705
Chironomous -0.393 0.548 0.584 -0.372 0.916 -0.624
Bellamaya -0.902 -0.139 0.974 -0.891 0.953 -0.984
Lymnaea -0.905 -0.147 -0.906 0.895 0.950 -0.985
Indoplanorbis -0.976 0.719 -0.976 0.981 -0.564 0.884
Gyraulus -0.489 0.997 -0.286 0.509 0.242 0.239
Lamellidens 0.192 0.923 0.027 0.214 0.533 -0.076
Correlation analysis showed a relationship between faunal diversity and physical-
chemical factors. Temperature was significant positive correlation with Branchiura (r =
0.995; p <0.01) and Glossiphonia (r = 0.954; p < 0.01) but significant negative
correlation with Bellamaya (r = -0.902;p < 0.01), Lymnaea (r = -0.905; p < 0.01) and
Indoplanorbis (r = -0.976;p < 0.01). pH was positively correlated with Branchiura (r =
0.473; p < 0.01), Limnodrilus (r = 0.939; p < 0.01), Nepa (r =0.838; p <0.01), Ranatra (r
=0.838; p <0.01), Chironomous (r = 0.548; p < 0.01), Indoplanorbis (r = 0.719; p < 0.01),
Gyraulus (r = 0.997; p < 0.01) and Lamellidens (r = 0.923; p < 0.01). DO was significant
positive correlation with Ranatra (r = 0.669; p < 0.01). and Bellamaya (r = 0.974; p <
0.01) but significant negative correlation with Branchiura (r = -0.992; p < 0.01),
Glossiphonia (r = -0.96; P < 0.01), Lymnaea (r = -0.906; p < 0.01) and Indoplanorbis (r =
-0.976; p < 0.01). Free Co2 was also positively correlated with Branchiura (r = 0.993) and
31
Glossiphonia (r = 0.947; p < 0.01), Lymnaea (r = 0.895; p < 0.01) and Indoplanorbis (r =
-0.891; p < 0.01) but negatively correlated with Ranatra (r = -0.470; p < 0.01),
Chironomous (r = -0.372; p < 0.01) and Bellamaya (r = -0.891; p < 0.01) The total
alkalinity was positively correlated with Nepa (r = 0.677; p < 0.01), Ranatra (r = 0.954; p
< 0.01), Chironomous (r = 0.916; p < 0.01), Bellamaya (r = 0.953; p < 0.01) and
Lymnaea (r = 0.950; p < 0.01) but negatively correlated with Branchiura (r = -0.788; p <
0.01), Glossiphonia (r = -0.899; p < 0.01) and Indoplanorbis (r = 0.564; p < 0.01). Total
hardness was significant positive correlation with Branchiura (r = 0.984; p<0.01)
Glossiphonia (r = 0.999; p<0.01) and Indoplanorbis (r = 0.884; p < 0.01) but negatively
correlated with Ranatra (r = -0.705; p < 0.01), Chironomous (r = -0.624; p < 0.01),
Bellamaya (r = -0.984; p < 0.01) and Lymnaea (r = -0.985; p < 0.05).
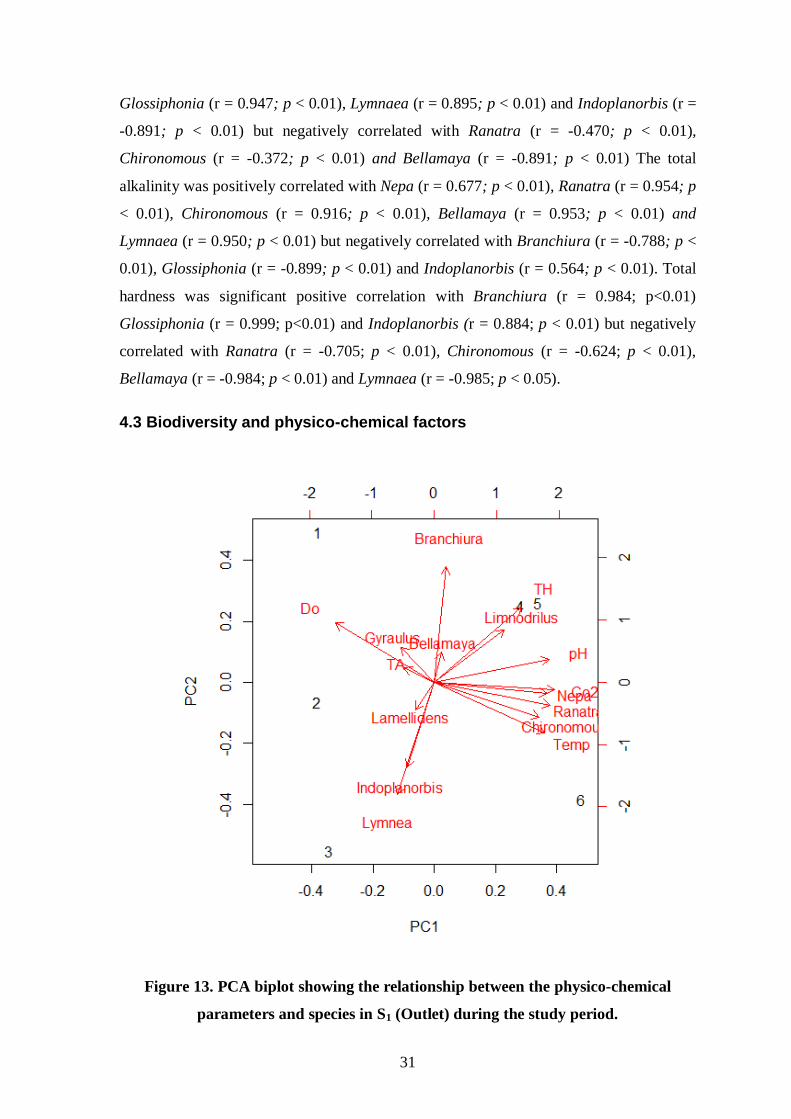
4.3 Biodiversity and physico-chemical factors
Figure 13. PCA biplot showing the relationship between the physico-chemical
parameters and species in S1 (Outlet) during the study period.

32
PCA showed that, physico-chemical variables associated with principal components 1
and 2 accounted for 65.9% variability among the samples in S1 (Figure 13). DO, pH, total
alkalinity and total hardness were positively correlated with high abundance of
Branchiura sp., Chironomous sp. and lamellidens.
Figure 14. PCA biplot showing the relationship between physico-chemical
parameters and species in S2 (Clear) during the study period.
PCA showed that physico-chemical variables associated with Principal components 1 and
2 accounted for 63.6% variability among the samples in S2 (Figure 14). DO, pH and
hardness were positively correlated with Limnodrilus, Nepa, Ranatra, Lymnaea,
Chironomous, Gyraulus and Lamellidens. The temperature and total alkalinity were
negatively correlated with Branchiura, Indoplanorbis, Bellamaya and Glossiphonia.

33
Figure 15. PCA biplot showing the relationship between the physico-chemical
parameters and species in S3 ( Inlet) during the study period.
PCA showed that physico-chemical variables associated with Principal components 1 and
2 accounted for 68.8% variability among the samples in S3 (Figure 15). DO, pH, free Co2,
and hardness were positively correlated with Limnodrilus, Nepa, Ranatra, Chironomous,
Branchiura, Gyraulus and Indoplanorbis but temperature and total alkalinity were
negatively correlated with Lamellidens, Bellamaya and Glossiphonia.
34
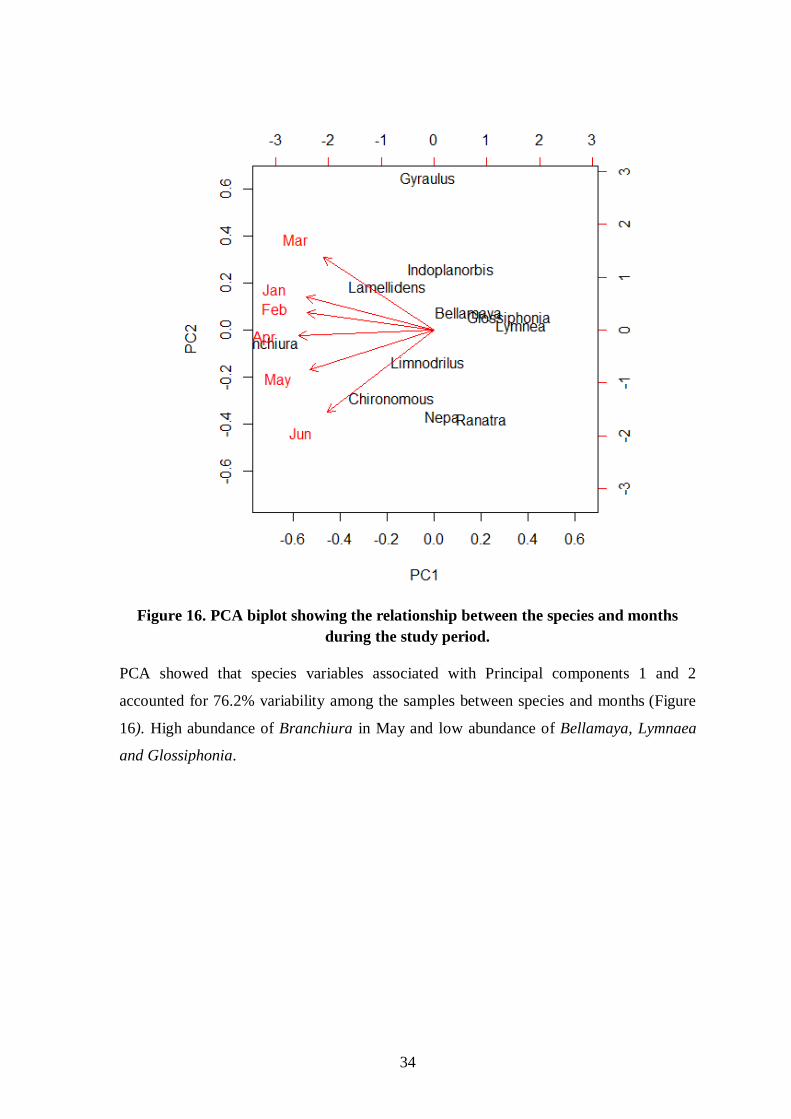
Figure 16. PCA biplot showing the relationship between the species and months
during the study period.
PCA showed that species variables associated with Principal components 1 and 2
accounted for 76.2% variability among the samples between species and months (Figure
16). High abundance of Branchiura in May and low abundance of Bellamaya, Lymnaea
and Glossiphonia.
35
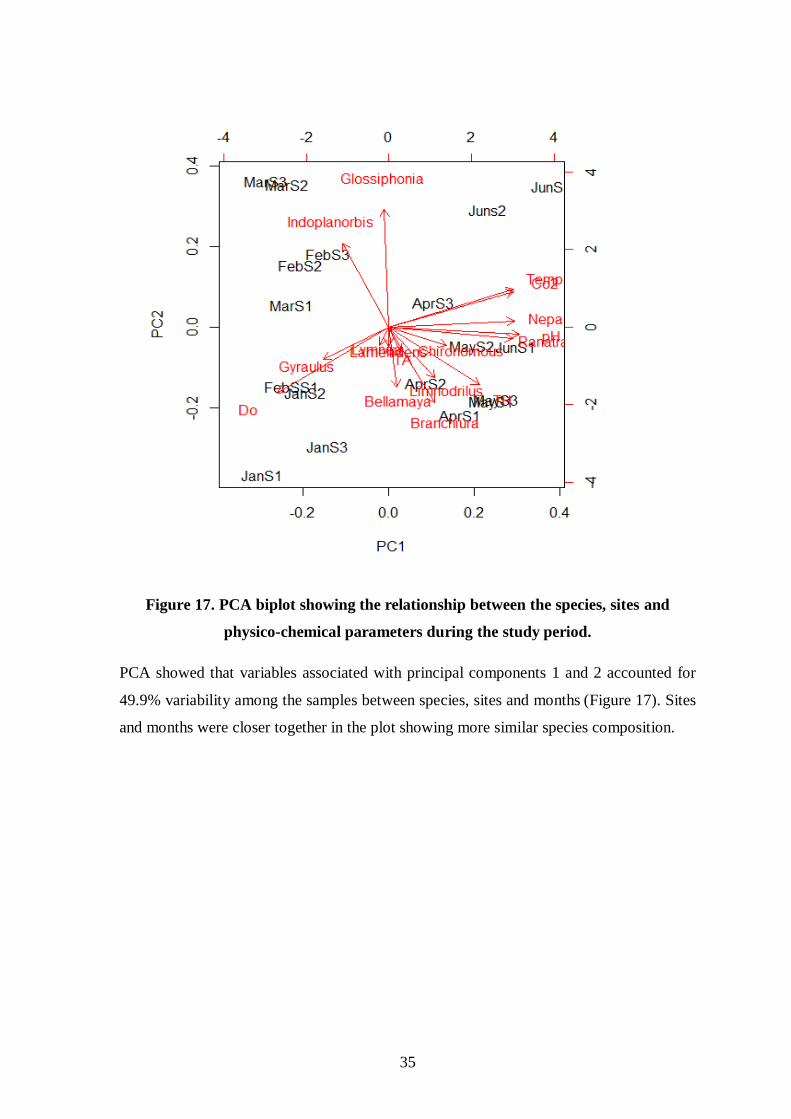
Figure 17. PCA biplot showing the relationship between the species, sites and
physico-chemical parameters during the study period.
PCA showed that variables associated with principal components 1 and 2 accounted for
49.9% variability among the samples between species, sites and months (Figure 17). Sites
and months were closer together in the plot showing more similar species composition.
36
5. Discussion
5.1 Abundance and distribution of macro invertebrates
The physico-chemical parameters of water are important for the composition, abundance
and distribution of macro-invertebrates because the interaction of physico-chemical
parameters create either favorable or unfavorable environment conditions for faunal
abundance and distribution (Dutta and Malhotra, 1986). In this study, 11 species
belonging to 8 families of macro-invertebrates were recorded in Lake. The faunal density
(ind.m2) ranged from 63 to 106, 56 to 76 and 66 to 100 at sites 1-3 respectively, with
highest value in June at S1.
The relative abundance of different faunal groups such as oligochaetes(34%),
insects(26%), gastropods(24%), Bivalves(13%) and hirudins(3%). The faunal density
(ind.m2) ranged from 63 to 106, 56 to 76 and 66 to 100 at sites 1-3 respectively, with
highest value in June at S1. Out of 8 families, family Tubificidae (Branchiura sowerybi)
and Chironomidae (Chironomous sp.) were recorded in all three sites of lake.This might
be due to high organic content of the lake as in the case of other tropical waters (Hansen,
et al. 1998).The high abundance of Branchiura sowerbyi were 81 ind./m2 observed in the
month of May and Chironomous sp. were 45 ind./m2 observed in the month of June
respectively. Oligochaetes can also be as deposit feeders, as such more tolerant to silting
and decomposition than other groups of benthic organisms( Olumukoro and victor, 2001).
Among the mollusca, the abundance of Lamellidens sp. were 51 ind./m2 in the month of
April and Gyraulus convexiusculus were 43 ind./m2
observed in the month of January.
Pollution indicators such as Chironomous sp. Nepa sp. and Ranatra sp. were observed in
all three sites of Six months. The high abundance of Chironomous sp. were 45 ind./m2 in
the month of the January whereas the abundance of Nepa sp. and Ranatra sp. were 32
ind./m2 and 25 ind./m
2 in the month of June.
At S1, the highest species diversity was 1.336 recorded in the month of March and the
lowest was 1.178 in the month of January. At S2, the highest species diversity was 1.407
in the month of March and the lowest was 1.317 in the month of January. Similarly, at S3
the highest diversity was 1.487 in the month of March and the lowest was 1.284 in the
month of January. The recorded Shannon diversity in the three sites were considered to be
good ranged for healthy nature of ecosystems. Similar seasonal pattern was found in
Beeshazar Lake by Jayana (1996).
37
At S1, the highest value of dominance was 0.336 recorded in the month of January and the
lowest was 0.266 in the month of March. At S2, the highest dominance was 0.281 in the
month of June and the lowest was 0.266 in the month of April. Similarly, at S3 the highest
dominance was 0.289 in the month of January and the lowest was 0.241 in the month of
March.
5.2 Physico-chemical parameters
5.2.1 Temperature
Physical, chemical and biological parameter processes in the aquatic environment are
affected by temperature. A rise in temperature of water leading to the speeding up of the
chemical reactions in water reduces the solubility of gases and amplifies the taste and
odors (Trivedy and Goel, 1986). Solubility of chemical compound increases with increase
in temperature.
The result showed that water temperature of lake depends on the air temperature.
Temperature of water was recorded 18.2oC in January gradually increased and reached
maximum level 32.4oC in June. The Chemical and biological actions in aquatic
environment are some way influenced by water temperature. At higher water temperature
the oxygen retaining capacity of water lower. The temperature is also very important
factors in the determination of various water parameters such as pH saturation level of
gases and various forms of alkalinity etc. At high temperature the capacity of water to
keep Oxygen in solution is decreased and biological Oxygen demand increased (Holdren
and Armstrong, 1980). The air temperature play main role for the seasonal variations in
temperature of the surface water of the aquatic environment. Such relations have also
been observed by Hussainy (1967), Kannan and Job (1980), Sreenivasan (1964), Sumitra
(1969) and Birendra (1996). The water temperature affects directly or indirectly on the
dissolved oxygen and carbon dioxide. The amount of dissolved oxygen decreased due to
high temperature in the lake (Ansari, 1986). The increase of temperature was inverse
relation with dissolved oxygen during the study period. Bose and Gorai (1993) reported
negative correlation between water temperature and dissolved oxygen.
5.2.2 pH
The Beeshazar Lake was slightly acidic to alkaline throughout the study period ranging
from 6.0 to 7.9. Warm water develops increased pH levels due to conversion of Co2 to

38
organic carbon by photosynthesis and the rate may exceed the rate of release of Co2 from
organic carbon by the process of respiration (King, 1970). Alkaline pH was supposed to
be helpful for proper growth and development of fishes and other aquatic organisms. The
hydrogen ion concentrations of water below the 5 and above the 11 have been described
as toxic and not suitable for aquatic fauna. pH level observed in the Beeshazar Lake was
favorable for aquatic animals during the study period. Swingle (1967) reported water
having from 6.5 to 9.0 is most suitable for pisciculture which is nearly equal to observed
value. Also Ellis (1973) reported that pH value from 6.7 to 8.4 is suitable for aquatic life.
The maximum pH in winter may be attributed to algal blooms because Hutchinson, et al.
(1929) and Roy (1955) have shown that the higher pH is associated with the
phytoplankton maxima.
5.2.3 Free Carbondioxide
The permitted level of carbon dioxide concentration has been described from 4.0mg/lt to
25 mg/lt for aquatic animals. Free carbon dioxide is one of the essential raw materials for
photosynthesis activities in aquatic environment. Due to this it play a significant role in
the food cycle of an aquatic ecosystem. The high concentration of Co2 is probably due to
the high rate of organic matter decomposition by microbes and respiratory activities of
aquatic plants and animals (Rutter 1953, Verma 1988, Agrawal 1988). During the study
period the concentration of Co2 ranged from 15.00mg/lt to 23.16mg/lt due to such
activities. The water temperature showed positive correlation with free co2.
5.2.4 Dissolved oxygen
The average variation of DO in the Beeshazar Lake showed from 2.77 to 5.23mg/lt. It
was found below permitted level. DO below 5 mg/lt is considered to be unsuitable for the
life of many aquatic organisms (WHO. 1970/1971). Comparatively, the low level of DO
in summer months may be due to the high temperature which accelerates the rate of
bacterial decomposition of organic matter (Mortimer, 1941). The value of dissolved
oxygen in water is depends upon temperature, pressure, dissolved solid, pH and salinity.
The low level of DO is probably related with the nutrients and organic matter available in
water bodies. The main source of nutrient is flood water and surface runoff during the
monsoon period. The amount of DO decreased due to high temperature in the lake
(Ansari, 1986). Such type of relation was also observed in the Beeshazar Lake during the
study period.

39
5.2.5 Total alkalinity
The total alkalinity of the lake water was found dependent on carbonate and bicarbonate
alkalinities. The carbonate alkalinity was found only in the absence of Co2 and the pH
value greater than 8.5. The total alkalinity was found higher (130.6mg/lt) in May. The
value of alkalinity indicates that lake was highly productive. In higher productive water
alkalinity ought to be over 100mg/lt. Usually the total alkalinity shows positive relation
with carbon dioxide content in the water. The total alkalinity was mainly due to the
function of bicarbonates in the Beeshazar Lake, which recorded throughout the study
period.
5.2.6 Total Hardness
The Hardness depends on the amount of calcium and magnesium salts dissolved in the
lake water. The water having hardness of 15 mg/lt or above may be considered suitable
for the growth of aquatic animals and plants (Swingle, 1967). The maximum value of
total hardness was recorded in summer and minimum value was recorded in winter. The
minimum value indicates more dilution of water (Patralekh, 1994). The total hardness in
the Beeshazar Lake was found higher (170.77mg/lt) in April at S2 and lower (85.77mg/lt)
in March at S1 during the study period.
5.3 Relationship between physico-chemical parameters and fauna
Environmental factors such as temperature are one of the key factors which determine the
composition of biological component in the lake water. Temperature, pH, free
carbondioxide and hardness were found significant positive correlation with diversity and
density of species but significant negative correlation with DO and alkalinity.
The value of dissolved oxygen was found decreased level in April, May and June during
the study period indicates accumulation of organic materials in the lake as well as
Oligochaetes are least dominant groups. Such type of relation was observed in the
Beeshazar Lake (Jayana, 1997).
The multivariate analysis such as PCA ordination plot showed that the good
representation of the interrelationship between the macroinvertebrates of each site with
physico-chemical parameters.

40
6. Conclusions and Recommendations
Among the three sites, the macro invertebrates species assemblage is comparatively
higher in sites S1 and S3 than in site S2. The analysis of the Shannon diversity and
dominance index clearly showed that the number of species is very high in all three sites.
The increase of temperature was inverse relation with DO during the study period. The
DO was recorded below the standard (permitted) level and was not suited for aquatic life.
The pH level observed in Beeshazar Lake was (6.0-7.9) favorable for aquatic animals in
the study period. The total alkalinity was found higher (130.6mg/lt) in May. It indicates
that lake was highly productivity. The value of hardness was found within the accepted
value for aquaculture; therefore, the water is suitable for aquaculture in terms of hardness.
The diversity and density of species were significant positive correlation with
temperature, pH, free Co2 and hardness but significant negative correlation with DO and
alkalinity. It From the study, it was concluded that the physico-chemical parameters were
major facrors responsible for fluctuation in benthic macrofaunal distribution in the study
area.
The recommendations are given by Site management plan of Beeshazar and associated
lakes (GoN/MOFSC/DNPWC/CNP. 2010).
At Strategic Level
1 Maintain healthy wetland ecosystem in and around Beeshazar Lake.
2. Promote sustainable wetland based eco-tourism.
3. Raise community awareness on wetland conservation.
4. Promote the use of alternative energy.
5. Facilitate scientific research and monitoring.
6. Enhance the livelihood opportunities of the local communities.
7. Ensure the sustainable and perpetual water source.
At Site Level
1. Take action to control pollution of Beeshazar and associated Lakes.
2. Explore the alternative use of invasive species.
3. Discourage forest products harvest and stop poaching.
4. Study the impact of invasive species in the area.

41
7. REFERENCES
American Public Health Association, 1976. Standard Methods for the Examination of
Water and Waste water 14th ed. Washington D.C.
Basnet, K., Shrestha, P., Shah, K. and Ghimire, P. 2000. Biodiversity Assessment of
Corridors linking Annapurna conservation Area and Chitwan National Park- Parsa
wildlife reserve. WWF, Kathmandu. p. 153.
Bhandari, B. 1998. A study on conservation of Beesh Hazari Tal. Heritage and
Biodiversity conservation Programme, IUCN.
Bhattarai, B. and Acharya, P.M. 2007. Water chemistry and trophic status of shallow
macrophytes dominant Lakes (Beeshazar Lake Complex), a Ramsar site in Chitwan,
Nepal. Journal of Science and Technology 8: 119-127.
Bhattarai, K.K. 1996. Studies on physico-chemical environment and biotic community of
Lami Tal in the Royal Chitwan National Park, Chitwan. M.Sc. Thesis. Tribhuvan
University, Kritipur, Kathmandu, Nepal.
BPP. 1996. Biodiversity Assessment of Tarai wetlands. HMG/MOFA p. 18-20.
Cole, G.A. 1975. Text book of Limnology. University of Toronto press, Toronto.
Crawford, R. P. 1977. Chemical, Physical and Biological changes associated with Charra
succession in farm ponds Hydrobiology 3: 29-217.
Dhakal, S. 2007. Study on composition of Macrophytes in relation to physico-chemical
parameters of Beeshazar Lake, a Ramsar site of Chitwan, Nepal. M.sc. Thesis. Central
Department of Environmental Science, Tribhuvan University, Kritipur, Kathmandu.
Dutta, S. P. S. and Malhotra, V.R. 1986. Seasonal variation in the macro- benthic fauna of
Gadigarh Stream (Marian Sahib) Jammu. India Journal of Ecology 1: 138-145.
DVN. 2005. Barandhabhar Forest Corridor Management Plan, RCNP. p. 70.
Edmonson, W.T. 1959. Freshwater Biology 2nd
ed. Ward H.B. and G.C Whipple John
Willey and sons, New York. p. 1248.

42
Elliott, J. M. 1977. Some methods for the Statistical analysis of samples of benthic
invertebrates 2nd
ed. Scientific Publication, Fresh Water Biology 25: 160.
Folwer, J. L. and Jarvis, P. 1990. Practical Statistics for field Biology 2nd
ed. John Willey
and Sons, Chichester, New York.
Gawad, S.A. and Mola, H.R.A. 2013. Spatio-temporal variations of macrobenthic fauna
in Lake Nasser Khors, Egypt. The Egyptian Journal of Aquatic Research 4: 415-423.
GoN/MOFSC/DNPWC/CNP. 2010. Site Management Plan, Beeshazar and Associated
Lakes (Ramsar site). p. 48.
Hutchinson, G. E.1975. A Treatise on Limnology. New York, Wiley.
Ishaq, F. and Khan, A. 2013. Aquatic biodiversity as an ecological indicators for water
Quality criteria of River Yamuna in Doon Valley, Uttarakhand, India. World Journal of
fish and Marine Sciences 3: 322-334.
IUCN. 1996. An inventory of Nepal’s Tarai Wetlands. Bhandari (ed.), IUCN, Nepal.
Jayana, B. 1997. Abiotic and biotic environment of the Beesh Hazari Tal in Tikauli
Jungle Chitwan. M. Sc. Thesis. Central Department of Zoology, Tribhuvan University,
Kirtipur, Kathmandu, Nepal.
Jha, A. K. 1995. Studies of macrozoobenthos of the Beesh Hazari Tal in Tikauli Jungle,
Chitwan. M. sc. Thesis. Central Department of Zoology, Tribhuvan University, Kirtipur,
Kathmandu, Nepal.
Karamacharya, A. P. 1990. Water pollution assessment in the Bagmati River and its
Tributaries in Kathmandu. Town Section. M. Sc. Thesis. Central Department of Zoology,
Tribhuvan University, Kirtipur, Kathmandu, Nepal.
Kormondy, E. J. 2000. Concept of Ecology. 4th ed. Prentice Hall of India Pvt. Ltd., New
Delhi.
Kothari, C.R. 1990. Research Methodology. Methods and techniques 2nd
ed. Wishwa
Prakashan, New Delhi.
Lonkar, S.S. and Kedar, G.T. 2014. Macrozoobenthic diversity of three Urban Lakes of
Nagpur, Central India. International Journal of Advanced Research 2: 1082-1090.

43
Mahapatro, D., Panigrahy, R.C., Panda, S. and Mishra, R.K. 2009. Influence of Monsoon
in Macrobenthic Assemblage in Outer Channel Area of Chilika Lagoon, East Coast of
India. Journal of Wetlands Ecology 3: 56-67.
Mahesh, V.K. 1988. Physico-chemical parameters of Tadi River in relation to fish
production and management. M.Sc. Thesis. Tribhuvan University, Kirtipur, Kathmandu,
Nepal.
Maskey, T.M. 1992. Socio-economic and biophysical Pressure on Wetlands of Nepal.
Moss, B. 1980. Ecology of fresh water. Blackwell Scientific Publications, Oxford.
Odum, E. P. 1971. Fundamentals of Ecology 3rd
ed. W.B. Saunders and Co. Philadelphia
U.S.A.
Pennak, R. W. 1953. Freshwater Invertebrates of United States. The Ronald press
Company, New York 275-730.
Richard, A. P. 1965. Invertebrate Identification. Manual Reihold Publishing Corporation
New York.
Shakya, S. K. 1992. Study on water quality, distribution, abundance and biomass of
benthic macro invertebrate in Baghmati River. M.Sc. Thesis. Tribhuvan University,
Kirtipur, Kathmandu, Nepal.
Sharma, C.K. 1977. River Systems of Nepal, Kathmandu.
Sharma, P.D. 2001. Ecology and Environment 7th
ed. Rastogi Publication, India, 660 p.
Shrestha, A. 2004. Faunal diversity and Water Quality: An Ecological Assessment of
Trishuli Watershed Area, Kurintar, Chitwan. M.Sc. Thesis. Central Department of
Zoology, Tribhuvan University, Kirtipur, Kathmandu, Nepal.
Shrestha, R.C. 1997. Study on Physico-chemical parameters of Dolalghat Dovan. M.Sc.
Thesis. Tribhuvan University, Kirtipur, Kathmandu, Nepal.
Shrestha, S. 2007. Study on water quality Parameters and benthic macroinvertebrates of
Taudaha Lake, Kathmandu. M.Sc. Thesis. Central Department of Zoology, Tribhuvan
University, Kirtipur, Kathmandu, Nepal.
44
Singh, R.K. 1994. Studies on the Macrozoobenthos of Lami Tal in Royal Chitwan
National Park. M.Sc.Thesis. Central Department of Zoology, Tribhuvan, University,
Kirtipur, Kathmandu, Nepal.
Sumitra, V. 1969. Limnological Studies of some tropical ponds. Ph. D. Thesis. Madurai
University, India.
Thakur, S. 1995. Studies of Macrozoobenthos of Tamar Tal in Royal Chitwan National
Park. M.Sc Thesis. Central Department of Zoology. Tribhuvan University, Kritipur,
Kathmandu, Nepal.
Thilagavathi, B., Varadharajan, D., Babu, A., Manoharan, J., Vijayalakshmi, S. and
Balasubramanian, T. 2013. Distribution and Diversity of Macro benthos in different
Mangrove Ecosystems of Tamil Nadu Coast, India. Journal Aquatic Research
Development 4:199.
Trivedy, R. K. and Goel, P. K. 1984. Chemical and Biological Methods for water
pollution studies 1st ed. Environmental Publication, KARAD (India).
Udash, R. K. 1996. Studies on Ecological Characteristics of Tamar Lake in Royal
Chitwan National Park of Chitwan District. M.Sc. Thesis. Central Department of
Zoology, Tribhuvan University, Kirtipur, Kathmandu, Nepal.
WBC. 2006. Conservation and Sustainable use of Beeshazar Lake System, Nepal.
Submitted to the Netherland Commitee of IUCN. Small frame for wetland Programme.
WHO. 1998. Guidelines of drinking water quality, Vol. 1, World Health Organization,
Geneva.
Yadav, M. P. 1992. Studies on the benthic macro fauna as indicator of river water quality.
M.Sc. Thesis. Central Department of Zoology, Tribhuvan University, Kirtipur,
Kathmandu, Nepal.
Yadav, U. K. R., Basnet, K. and Mehta, T. 1983. Studies on Benthic fauna of four ponds
of the Godavari fish farm, Kathmandu, Valley Nepal. Journal of Natural History Museum
7 (3): 72-91.
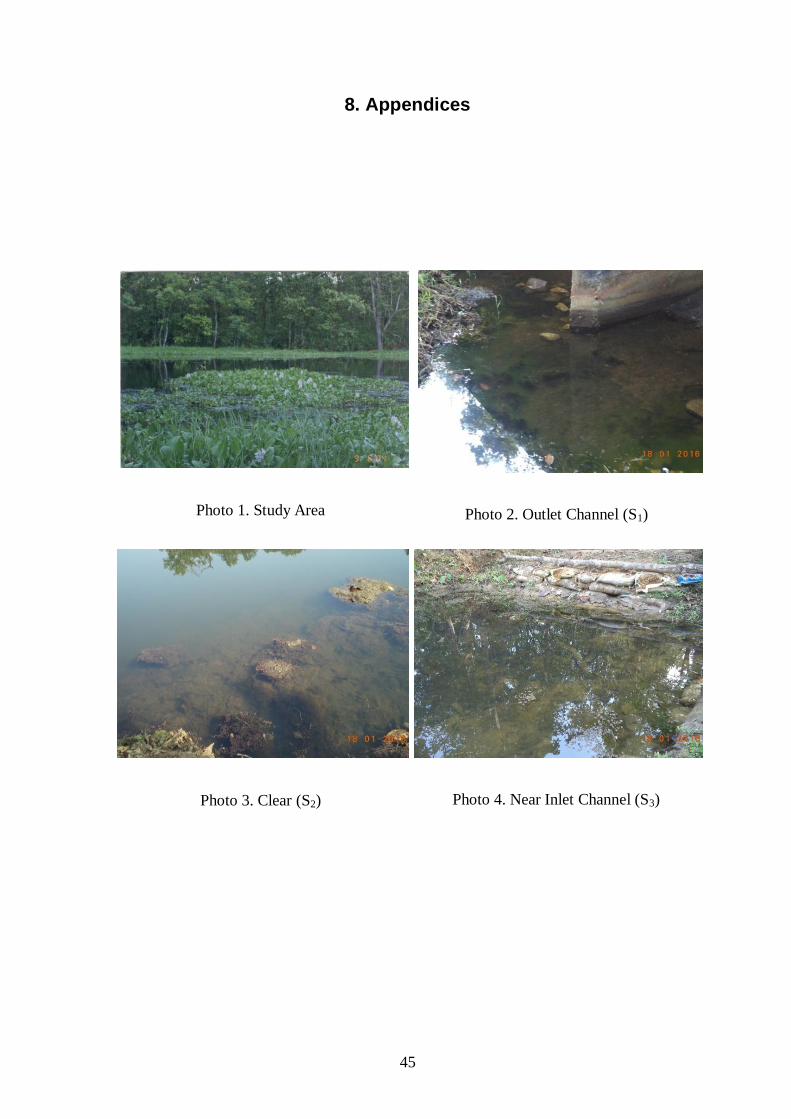
45
8. Appendices
Photo 1. Study Area
Photo 3. Clear (S2)
Photo 2. Outlet Channel (S1)
Photo 4. Near Inlet Channel (S3)

46
I. PCA analysis data sheet (R Package 3.3.2)
Importance of components (Site 1)
PC1 PC2 PC3 PC4 PC5 PC6
Standard deviation 2.6410 1.8912 1.5241 1.3757 1.11054 6.567e-16
Proportion of
Variance
0.4359 0.2235 0.1452 0.1183 0.07708 0.000e+00
Cumulative
Proportion
0.4359 0.6594 0.8046 0.9229 1.00000 1.000e+00
Importance of components (Site 2)
PC1 PC2 PC3 PC4 PC5 PC6
Standard deviation 2.4791 2.1604 1.7522 1.4032 1.07148 9.806e-16
Proportion of
Variance
0.3615 0.2745 0.1806 0.1158 0.06753 0.000e+00
Cumulative
Proportion
0.3615 0.6361 0.8166 0.9325 1.000000 1.000e+00
Importance of components (Site 3)
PC1 PC2 PC3 PC4 PC5 PC6
Standard deviation 2.7051 1.9223 1.5290 1.3490 0.91080 9.841e-16
Proportion of
Variance
0.4574 0.2309 0.1461 0.1137 0.05185 0.000e+00
Cumulative
Proportion
0.4574 0.8344 0.8344 0.9482 1.00000 1.000e+00
Importance of components (Species and Months )
PC1 PC2 PC3 PC4 PC5 PC6
Standard deviation 2.1394 0.8731 0.52653 0.49470 0.32893 0.1750
Proportion of
Variance
0.7628 0.1271 0.04621 0.004621 0.01803 0.0051
Cumulative
Proportion
0.7628 0.8899 0.93608 0.97687 0.99490 1.0000

47
Importance of components between sites, species and months
PC1 PC2 PC3 PC4 PC5 PC6 PC7 PC8 PC9 PC10 PC11 PC12 PC13 PC14 PC15 PC16 PC17
Standard
deviation
2.4161 1.6309 1.4909 1.3633 1.22016 0.99114 0.76221 0.61659 0.53366 0.4498 0.41991 0.40729 0.30422 0.23125 0.10952 0.03865 0.004635
Proportion
of Variance
0.3434 0.1565 0.1308 0.1093 0.08758 0.05779 0.03417 0.02236 0.01675 0.0119 0.01037 0.00976 0.00544 0.00315 0.00071 0.00009 0.000000
Cumulative
Proportion
0.3434 0.4998 0.6306 0.7399 0.82751 0.88529 0.91947 0.94183 0.95858 0.9705 0.98086 0.99062 0.99606 0.99921 0.99991 1.00000 1.000000