fbi headquarters (hq) consolidation deis appendix f: air ... · greenhouse gas emissions from...
TRANSCRIPT

Appendix F: Air Quality Evaluation Technical Documentation
FBI Headquarters C o n s o l i d a t i o n

(This page intentionally left blank.)

Stationary Sources
1

(This page intentionally left blank.)

FBI HQ Campus- Natural Gas Boiler Emissions Based on CJISFY2013CJIS Annual Fuel Consumption
Natural Gas ( cf) 77,208,000
Heating Value of natural gas- MMBTU/MMscf
1020Building size- sf 500,000natural gas cf per sf 154 Annual Average MMBTU 393760.8
Ave. Annual Hourly Heat Input MMBTU 44.94986
Max Hourly Heat Input (MMBTU)* 89.89973FBI HQ Campus- sf 2,500,000 Max Hourly MMscf 0.088137FBI HQ Campus- natural gas cf 386,040,000
Converted MMscf 386.04Annual Boiler Emissions
Emission Factor (lbs/MMscf) lbs/year
Tons Per Year
Emission Factor SourceCO 84 32,427 16.2 AP 42 Table 1.4-1.VOC 5.5 2,123 1.1 AP-42 Table 1.4-2NOx 50 19,302 9.7 AP 42 Table 1.4-1., assume low-NOx burnersPM 7.6 2,934 1.5 AP-42 Table 1.4-2SO2 0.6 232 0.1 AP-42 Table 1.4-2CO2 120,000 46,324,800 23,162.4 AP-42 Table 1.4-2N2O 0.64 247 0.1 AP-42 Table 1.4-2, assume low-NOx burnersCH4 2.3 888 0.4 AP-42 Table 1.4-2Total CO2e 23,211.6Short-Term Maximum Hourly Emissions
(lbs/MMscf) lbs/hour grams/secondCO 84 7.403506849 0.932825NOX 50 4.406849315 0.555253PM 7.6 0.669841096 0.084398
Grams/lb 453.592
*Actual maximum capacity is not known, assumed 2x annual
average
2

Diesel Backup Generator EmissionsAP 42 3.4 Large Stationary Diesel And All Stationary Dual-fuel Engines
Annual Fuel 3,357 gallons (from JEH fuel consumption data) 137,381 BTU/gallon461188017 BTU http://www.eia.gov/Energyexplained/?page=about_energy_units461.18802 MMBTU
Emission Factor lb/MMBtu Annual lbs Annual tonsCO 0.85 392.0098145 0.1960NOx 3.2 1475.801654 0.7379PM 0.1 46.1188017 0.0231SO2 0.001515 0.698699846 0.0003 0.0015 percent sulfur
3

Greenhouse Gas Emissions from Building Electricity ConsumptionJEH Existing
26,195.50 CO2e metric tons0.0004321 metric tons per kwh
60,623,236 kwh2,400,000 sf
25.259682 Kwh/sf
FBI HQ Campus- sf2,500,000 sf
63,149,204 kwh27,286.98 CO2e metric tons
4

Dispersion Modeling Assumptions- Greenbelt, Landover, and Springfield
For the preliminary dispersion modeling with AERMOD, it was assumed one exhaust stack for the boiler system would be located on the roof of the Central Utility Plant. The following stack parameters were used:
Stack height (above grade) - 25.19 meters (13 meters above the utility plant roof). Stack Inside diameter- 0.5 meter Temperature- 293 (degrees K) Exit velocity- 1.0 meters/second
AERMOD requires meteorological data to analyze how parameters such as wind speed, direction, temperature and other factors affect the dispersion of air pollution. Five years of surface meteorological data from Dulles International Airport and upper air data from Sterling VA was preprocessed with AERMET. USGS land cover data was processed with AERSURFACE for input into AERMET.
USGS digital elevation data (1/3 arc-second National Elevation Dataset) was processed using AERMAP to define the ground elevation in the modeling domain, as well as the base elevation for receptors, buildings and sources.
In urban areas, AERMOD takes into account the urban heat island effects on dispersion. The urban dispersion option was utilized for all three sites and the urban area population input was based on the 2010 population of the Washington-Arlington-Alexandria, Metropolitan Statistical Area (5,582,000).
Receptors were placed along the fence line of the proposed FBI HQ campus and a grid of 440 off-site receptors with a spacing of approximately 160 meters were placed over the area within 1,500 meters of the central utility plant. Additional receptors were placed to ensure adequate coverage of sensitive receptors, such as residential areas, that are closest to each of the sites. A receptor height of 1.8 meters was used to reflect breathing height for ground-level receptors. The focus of the screening analysis was off-site impacts, therefore receptors were not placed within the site itself. Building fresh air intakes would be located away from areas potentially affected by boiler stack emissions, as determined by further detailed analysis to be completed once a preferred site is identified and designed.
The Building Profile Input Program (BPIP) program for the PRIME model (BPIPRM) was used to account for building downwash effects for the boiler stack. Major buildings such as the main office building, parking structures and the central utility plant were digitized based on the conceptual site layouts and building heights discussed in Chapter 2. The “buildable area” for the main building was used as proxy for the actual building footprint.
5

For NO2 analysis, the Ambient Ratio Method (ARM) was used to address NOx to NO2 conversion.
Background concentrations for PM2.5 and NO2 were obtained from EPA’s AirData portal.1 Table 1 summarizes the monitoring stations identified as most representative for each of the three sites.
11 http://www.epa.gov/airdata/ad_maps.html
6

Table 1: Background Concentrations
Project Site
Selected Monitor for PM2.5
Selected Monitor for NO2
PM2.5- 24hr (98th Percentile) (µg/m3)
PM2.5- Annual Ave. (µg/m3)
NO2- 1hr (98th Percentile) (ppb)
NO2- Annual Average (ppb)
2012 2013 2014 2012 2013 2014 2012 2013 2014 2012 2013 2014
Greenbelt and Landover
24-033-0030 Howard University, Beltsville 3.4 miles northeast of Greenbelt, 9 miles north of Landover
Same as PM2.5 25.1 21.3 22.5 11.3 9.5 9.9 35.7 36.7 39.2 8.7 8.0 7.9
Springfield
51-059-0030 Lee Park, Telegraph Rd. 4 miles to east
51-510-0021 Alexandria City 5.6 miles northeast
21.1 21.0 18.0 8.7 8.3 8.2 65.7* 63.7 56.4 15.5* 12.5 12.3
*2012 data for incomplete year at this monitor was not used.
7

Mobile Sources
8

Consideration of PM2.5 Hot-Spots Due to Project-Related Traffic Impacts
Although not subject to transportation conformity requirements, the transportation conformity regulations were used for NEPA purposes to determine if a PM2.5 hot-spot analysis was necessary. The transportation conformity regulations are relevant to use for this purpose because they are intended to prevent violations of the National Ambient Air Quality Standards (NAAQS) or worsening of existing violations. A transportation project that is located in a “nonattainment” or “maintenance” area for PM10 or PM2.5, and meets one of the following conditions, is referred to as a “project of local air quality concern”, and requires a quantitative PM hotspot analysis under transportation conformity.
1. New highway projects that have a significant number of diesel vehicles, and expanded highway projects that have a significant increase in the number of diesel vehicles; (40 CFR 93.123(b)(1)(i))
2. Projects affecting intersections that are at level of service (LOS) D, E, or F with a significant number of diesel vehicles, or those that will change to LOS D, E, or F because of increased traffic volumes from a significant number of diesel vehicles related to the project; (40 CFR 93.123(b)(1)(ii))
3. New bus and rail terminals and transfer points that have a significant number of diesel vehicles congregating at a single location; (40 CFR 93.123(b)(1)(iii)).
4. Expanded bus and rail terminals and transfer points that significantly increase the number of diesel vehicles congregating at a single location; (40 CFR 93.123(b)(1)(iv)) and
5. Projects in or affecting locations, areas, or categories of sites which are identified in the PM10 or PM2.5 applicable state implementation plan, as sites of violation or possible violation. (40 CFR 93.123(b)(1)(v))
The types of projects that would require PM hot-spot analysis were further clarified through a series of examples provided in the preamble of the March 2006 Final Rule.
Some examples of projects of local air quality concern that would be covered by 40 CFR 93.123(b)(1)(i) and (ii) are:
● a project on a new highway or expressway that serves a significant volume of diesel truck traffic, such as facilities with greater than 125,000 annual average daily traffic (AADT) and 8 percent or more of such AADT is diesel truck traffic;
● new exit ramps and other highway facility improvements to connect a highway or expressway to a major freight, bus, or intermodal terminal;
● expansion of an existing highway or other facility that affects a congested intersection (operated at LOS D, E, or F) that has a significant increase in the number of diesel trucks; and,
● similar highway projects that involve a significant increase in the number of diesel transit busses and/or diesel trucks.
The following are examples of projects that are not a local air quality concern under 40 CFR 93.123(b)(1)(i) and (ii):
9

● any new or expanded highway project that primarily services gasoline vehicle traffic (i.e., does not involve a significant number or increase in the number of diesel vehicles), including such projects involving congested intersections operating at LOS D, E, or F;
● an intersection channelization project or interchange configuration project that involves either turn lanes or slots, or lanes or movements that are physically separated. These kinds of projects improve freeway operations by smoothing traffic flow and vehicle speeds by improving weave and merge operations, which would not be expected to create or worsen PM NAAQS violations; and,
● intersection channelization projects, traffic circles or roundabouts, intersection signalization projects at individual intersections, and interchange reconfiguration projects that are designed to improve traffic flow and vehicle speeds, and do not involve any increases in idling. Thus, they would be expected to have a neutral or positive influence on PM emissions.
The proposed FBI HQ would involve heavy truck trips daily for deliveries. The remainder of traffic generation by employee and contractor commutes would be by gasoline vehicle traffic. Therefore, the project would not cause a significant increase in diesel truck traffic. The traffic mitigation measures include intersection channelization/traffic signal timing changes that would be expected to improve traffic flow and reduce idling.
The traffic analysis data was reviewed to identify the number of percentage of heavy vehicle volumes as shown in Table 2. For the intersections with the highest number of heavy vehicles, the heavy vehicle percentage in the peak hours was 4 percent or less, and the highest peak hour heavy vehicle volume was approximately 300. Based on this information, a determination was made that none of the site alternatives would adversely affect intersections with significant heavy vehicle volumes, nor result in adverse PM2.5 concentrations within the vicinity of congested intersections.
Table 2: Intersections with highest peak hour heavy vehicle volumes Site Intersection
with highest heavy vehicle volume
Heavy Vehicle Approach Volume
Total Approach Volume
Total Heavy Vehicle Percent
Greenbelt 60th Ave/Cherrywood Lane and Greenbelt Road (PM peak)
110 5,484 2.01%
Landover Brightseat Road and MD 202
299 7,517 3.98%
10

(Landover Road) (AM peak)
Springfield Fairfax County Parkway and I-95 (N) Ramp C & D/Loisdale Road (AM peak)
241 6,035 3.99%
Qualitative Microscale Evaluation of CO
Landover
Two intersections would be at LOS F in the Landover transportation study area with incorporation of traffic mitigation: Intersection #16, Martin Luther King Jr. Highway and Ardwick Ardmore Road in the AM peak hour and Intersection #12, Landover Road and St. Joseph’s Drive/McCormick Drive in the PM peak hour. These intersections would also be at LOS F under the No-Action Alternative. FHWA’s categorical hotspot finding for CO was based on modelling of LOS E conditions; therefore, LOS F is outside the range (more congested) than was assumed in the finding. However, the increase in CO emissions and concentrations from LOS E to LOS F was considered in the context of the following factors:
● Approach volumes at both intersections are substantially below the maximum modeled in the categorical finding (2,640 per approach). At Intersection #16 during the AM peak hour, approach volumes are 583 to 1,628, with the highest volume being the Martin Luther King Jr. Highway southbound approach. At Intersection #12 during the PM peak hour, approach volumes are 216 to 1,350, with the highest volume being the St. Joseph’s Drive southbound approach. These volumes are more than 1,000 vehicles less than were assumed in the categorical finding.
● Background concentrations are substantially below the maximum assumed in the categorical finding. The maximum allowable 1-hour concentration is 29.5 ppm, the actual 1-hour concentration for the closest active monitor (2500 1st Street, NW AQS Site ID: 11-001-0043) in 2014 is 1.7 ppm. The District monitor in this location is located closer to the Landover site than other monitors within Prince George’s County. The maximum allowable 8-hour concentration is 5.1 ppm, the actual concentration in 2014 was 1.5 ppm.
Springfield
All signalized intersections would operate at LOS D or better after taking into account traffic mitigation measures except for Intersection #21, Franconia- Springfield Parkway/Manchester
11

Boulevard and Beulah Street, which would operate at LOS E in the AM peak hour and LOS F in the PM peak hour. FHWA’s categorical hotspot finding for CO was based on modelling of LOS E conditions; therefore, LOS F is outside the range (more congested) than was assumed in the finding. However, the increase in CO emissions and concentrations from LOS E to LOS F was considered in the context of the following factors:
• Approach volumes at both intersections are below the maximum modeled in the categorical finding (2,640 per approach). At Intersection #21 in the PM peak hour, approach volumes are 1,200 to 2,519, with the highest volume being the Franconia-Springfield Parkway eastbound approach. The Franconia-Springfield Parkway approach would operate at LOS E; the LOS F conditions would be on the lower volume Beulah Street northbound and southbound approaches. For three out of the four approaches, volumes are more than 1,000 vehicles less than were assumed in the categorical finding and the highest volume approach is also below 2,640.
• Background concentrations are substantially below the maximum assumed in the categorical finding. The maximum allowable 1-hour concentration is 1.7 ppm, the actual 1-hour concentration for the closest active monitor (3200 Colvin Street, Alexandria. AQS Site ID: 51-510-0021) in 2014 was 1.5 ppm. The maximum allowable 8-hour concentration is 5.1 ppm, the actual concentration in 2014 was 1.5 ppm.
MOVES2014 Modeling Methodology
The methodology used to determine an overall CO2e emission factor for the employee commute greenhouse gas emissions analysis is provided below.
Model Version
MOVES2014-20141021
Scale
Project-level, emission rates
Analysis Year
The analysis year of 2025 was selected to correspond to the closest year to the FBI HQ opening year that regional MOVES modeling inputs were available from MWCOG.
Time Period
The 7:00 AM hour in January was used a conservative assumption given that emissions are generally higher at cold temperatures.
12

Geographic Bounds
Separate runs were conducted for the District of Columbia, Prince George’s County Maryland and Fairfax County, Virginia. An average of these three emission factors was used for all three sites to represent generic regional travel emissions rates.
Vehicles/Equipment
It was assumed employee commutes utilized passenger cars only and all of the available fuel types were selected for passenger cars (gasoline, diesel, electricity and E-85).
Road Type
The urban unrestricted access road type was selected (e.g. arterial with intersections). This is a conservative assumption because travel on urban unrestricted access (e.g. freeways) would account for a large portion of many commutes and would generally have a lower emission rate per vehicle-mile due to a smoother traffic flow.
Pollutants and Processes
CO2e and the necessary prerequisites to CO2e were selected.
General Output
Mass units were set to grams; energy units was set to joules; and distance units was set to miles.
Meteorological Inputs
Temperature and humidity data for January were obtained from MWCOG’s regional MOVES modeling input data for each county.
Age Distribution
The age distribution was obtained from MWCOG’s regional MOVES modeling input data for each county.
Fuel Parameters
Fuel supply/formulation input utilized the MOVES database default data for each county.
I/M Programs
I/M program input was obtained from MWCOG’s regional MOVES modeling input data for each county.
Link-Level Inputs
A single link was included since the objective was to determine a generic emission factor rate. The link had an average speed of 35 mph and 100% of the volume consisted of passenger vehicles.
13

Greenhouse Gas Emissions from Employee Commutes (2025)Springfield Landover Greenbelt JEH- No Action Off-Site No Action
Total one-way VMT based on existing FBI employees 217,387 266,147 297,467 196,681Total one-way VMT average per employee 23.0282839 28.19353814 31.51133475 20.83485169 25.89200212
Total Future Employees (FBI plus 450 no-seat contractors) 11,505 11,505 11,505 5,045 6,460
Percent Driving Alone 0.3058 0.633 0.2967 0.135 0.342625
Number of Employees Driving Alone 3518.229 7282.665 3413.5335 681.075 2213.3575
Percent Carpool 0.11 0.1 0.11 0.085 0.10125
Number of Employees Using Carpool 1265.55 1150.5 1265.55 428.825 654.075
Number of Carpool Trips (One way, 3 people/vehicle) 421.85 383.5 421.85 142.9416667 218.025Total VMT per Work Day (roundtrip) 181,467 432,273 241,716 34,337 125,907Annual VMT (250 days) 45,366,629 108,068,158 60,429,027 8,584,133 31,476,680Change from No Action 5,305,816 68,007,345 20,368,214
No Action Total 40,060,813Annual CO2e- Metric Tons 11,541.0 27,491.8 15,372.7 10,191.2CO2e Change from JEH No Action 1,349.8 17,300.6 5,181.5Percent Change 13.24% 169.76% 50.84%
254.393 CO2e emission factor (grams/vehicle-mile)
14

Mobile Source Greenhouse Gas Emission Factor (2025, Jan, 7am)
County2025 CO2E emission factor (grams/veh-mile)
DC 256.164PG 259.631FFX 247.384
Ave 254.393
15

Mileage Totals (one-way, per day)Springfield Landover Greenbelt JEH
217,387 266,147 297,467 196,681
* Assumes every employee drives, no alternative modes, no absence allowances
* Miles represent ONE-WAY trips
* There was no zipcode-mileage data available for 7% of employees. Those employees
were added back with a weighted distribution amongst the zip codes for which we did
have mileage data.
16

ZIP TAZ Greenbelt JEH Landover Springfield20737 993 4.3 8.6 6.5 25.420742 916 3.6 9.1 8.6 22.820740 914 2.2 10.2 9.8 2420722 958 7.3 6 6 19.720781 1030 7.1 7 5.8 22.720784 1010 9.1 9.3 3.8 24.320746 844 19.2 7.3 8.1 17.820747 1077 15.8 9.7 6.5 2222742 3644 84.8 63.4 76.1 50.720708 1193 8 18.6 12.8 37.320771 1183 4.4 14.4 7.2 31.720769 1138 8.1 15.5 6.2 32.320720 1148 9.4 15.7 6.4 32.520721 1105 14.2 14.3 5.3 27.820744 772 29.2 15.9 20.5 17.320748 821 22.1 9.5 13.4 15.622207 1447 24.8 7.2 17.2 16.625442 3666 74.5 73 81.3 67.225438 3665 74.4 72.8 81.1 62.120735 1366 23.2 14.9 14.5 2220762 1342 17.9 12.6 9.2 20.120623 1325 25.6 18.2 16.9 25.320608 1294 39.6 30.8 30.9 37.920613 1299 31.4 23.1 22.7 30.220745 791 23.5 7.2 14.8 12.420774 1248 13.8 12.9 5.3 23.620785 1016 11.8 9.1 2.4 23.920743 1064 14.4 7.7 4.8 21.120628 3400 81 72.7 72.3 78.520616 3140 43.4 30.2 34.7 31.620646 3147 42.8 29.6 34.1 3120658 3129 45.9 32.6 37.2 3420662 3117 56.9 43.6 48.2 4520693 3121 53.1 39.8 44.4 41.220617 3212 41.3 33 32.6 38.920637 3207 43.2 34.9 34.5 40.720622 3218 48.1 39.8 39.4 45.720611 3228 47.5 40 38.8 41.420632 3227 49.5 42 40.8 43.420680 3399 81.4 73.1 72.8 7920684 3398 80.9 72.6 72.2 78.421140 3112 21.4 23.5 14.2 40.220650 3409 67.4 59.1 58.7 6520609 3342 62.5 54.2 53.8 6020618 3335 63.7 55.4 55 61.220606 3336 65.9 57.6 57.3 63.5
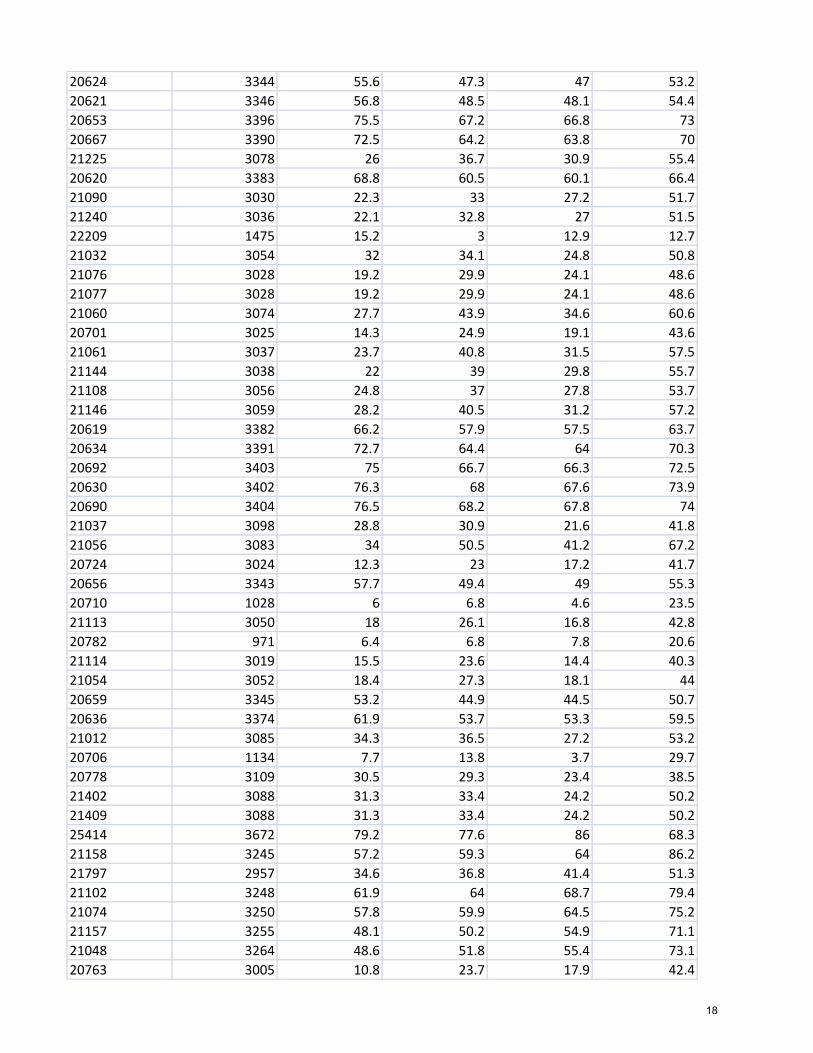
Travel Distances by Zip Code Used In VMT Calculation
17
20624 3344 55.6 47.3 47 53.220621 3346 56.8 48.5 48.1 54.420653 3396 75.5 67.2 66.8 7320667 3390 72.5 64.2 63.8 7021225 3078 26 36.7 30.9 55.420620 3383 68.8 60.5 60.1 66.421090 3030 22.3 33 27.2 51.721240 3036 22.1 32.8 27 51.522209 1475 15.2 3 12.9 12.721032 3054 32 34.1 24.8 50.821076 3028 19.2 29.9 24.1 48.621077 3028 19.2 29.9 24.1 48.621060 3074 27.7 43.9 34.6 60.620701 3025 14.3 24.9 19.1 43.621061 3037 23.7 40.8 31.5 57.521144 3038 22 39 29.8 55.721108 3056 24.8 37 27.8 53.721146 3059 28.2 40.5 31.2 57.220619 3382 66.2 57.9 57.5 63.720634 3391 72.7 64.4 64 70.320692 3403 75 66.7 66.3 72.520630 3402 76.3 68 67.6 73.920690 3404 76.5 68.2 67.8 7421037 3098 28.8 30.9 21.6 41.821056 3083 34 50.5 41.2 67.220724 3024 12.3 23 17.2 41.720656 3343 57.7 49.4 49 55.320710 1028 6 6.8 4.6 23.521113 3050 18 26.1 16.8 42.820782 971 6.4 6.8 7.8 20.621114 3019 15.5 23.6 14.4 40.321054 3052 18.4 27.3 18.1 4420659 3345 53.2 44.9 44.5 50.720636 3374 61.9 53.7 53.3 59.521012 3085 34.3 36.5 27.2 53.220706 1134 7.7 13.8 3.7 29.720778 3109 30.5 29.3 23.4 38.521402 3088 31.3 33.4 24.2 50.221409 3088 31.3 33.4 24.2 50.225414 3672 79.2 77.6 86 68.321158 3245 57.2 59.3 64 86.221797 2957 34.6 36.8 41.4 51.321102 3248 61.9 64 68.7 79.421074 3250 57.8 59.9 64.5 75.221157 3255 48.1 50.2 54.9 71.121048 3264 48.6 51.8 55.4 73.120763 3005 10.8 23.7 17.9 42.4
18

22204 1528 17.8 5.4 15.9 9.720783 919 4.8 8.8 14.5 22.620770 900 2 11.8 8.2 32.720705 889 4.3 15.3 11.6 36.120707 866 10.7 17.7 17.5 4222201 1480 16.5 4.2 14.2 12.220712 953 7.7 5.7 7.5 19.520716 1219 17.9 20 10.8 36.820715 1160 12.9 19.2 9.9 3622205 1431 19.6 7.3 17.3 11.422611 3656 85.4 65.1 92.1 64.622203 1410 18.6 6.4 16.3 9.821723 2960 32.8 30.8 39.6 45.321784 3270 39.1 42.2 45.8 56.321794 2961 31.4 34.6 38.2 47.921737 2952 26.9 29.1 33.7 43.521738 2952 26.9 29.1 33.7 43.520751 3106 31 29.2 22.1 38.421042 2980 26.9 30.1 33.7 47.122620 3655 85.2 71.2 81.2 69.721043 2968 26 33 32.8 57.320759 3015 19.4 23.2 26.2 40.621036 2953 29 32.1 35.7 45.621029 2951 27.7 30.9 34.5 45.521044 2982 21.5 24.7 28.3 37.721045 2986 20.3 27.3 27.1 51.621075 2999 21.9 28.8 25.1 49.621046 3012 19.8 22.9 26.6 3620723 3011 15.2 22.2 22 46.520794 3004 13.7 25.8 20.1 44.620776 3114 26.2 24.3 16 37.820733 3107 32.9 31.2 24.1 40.320764 3107 32.9 31.2 24.1 40.320758 3105 31.3 29.5 22.4 38.720779 3105 31.3 29.5 22.4 38.721403 3099 30.1 32.2 23 4920711 3116 24.7 23 15.9 32.220777 3017 22.1 24.1 28.9 40.521035 3113 22.2 24.3 15 35.720772 1268 22 18 13.3 27.122663 3654 84.3 70.3 80.3 68.820130 3661 80.6 66.7 76.7 65.220180 2248 55.7 52.1 62.5 47.722712 3646 67.8 53.9 71.6 46.220111 2643 46.2 32.2 45.4 21.121122 3079 32.4 48.8 39.6 65.621104 2965 34.2 37.4 41 52
19

20625 3220 60.1 52.6 51.4 5420664 3220 60.1 52.6 51.4 5420754 3302 28.9 27.1 20 36.320736 3311 33.4 31.7 24.5 40.820714 3321 35.1 33.3 26.2 42.520689 3310 35.7 33.9 26.8 43.120732 3310 35.7 33.9 26.8 43.120639 3315 39.2 37.5 30.4 46.720678 3291 45.8 44 36.9 51.120676 3333 48.6 46.9 39.8 56.120615 3334 52.5 50.8 43.7 6020685 3326 54.2 52.4 45.3 61.620657 3327 57.9 56.2 49.1 65.420629 3325 62 60.2 53.1 66.220688 3325 62 60.2 53.1 66.220675 3148 42 28.8 33.4 30.220695 3170 37.1 32.2 28.4 33.622202 1501 16.3 4 14.5 11.822134 2816 59.1 37.8 50.4 2520143 2518 52.3 38.4 48.4 36.922026 2808 54.5 33.1 45.8 20.422193 2738 50 28.6 41.3 15.920181 2444 52.5 38.3 51 25.620112 2698 56 34.6 47.3 21.922192 2671 47.9 26.5 39.2 13.720110 2628 49.4 35.5 46.5 22.220136 2570 50.8 36.8 46.8 35.320109 2541 45.9 31.9 41.9 30.420155 2498 49.9 36 46 34.520169 2476 55.8 41.9 51.9 40.420677 3124 47.3 34 38.6 35.420135 2161 69.1 70.2 80.2 68.720016 94 16.9 5.2 15.2 16.625443 3668 78.5 77 85.3 71.920176 2240 55 43.8 61.7 43.320115 3615 66.6 52.7 62.7 51.222639 3606 78.5 64.6 74.6 63.122643 3606 78.5 64.6 74.6 63.120137 3629 56.8 42.9 52.8 41.425430 3664 78 76.4 84.7 65.820187 3632 60.9 46.9 56.9 45.420012 118 11.4 6 12.9 18.720198 3625 59.3 45.3 55.3 43.820010 160 10.7 3 11.8 16.120009 178 11.8 2.2 11.2 14.720002 274 10.2 2.7 8.1 16.220020 351 15.5 5 8.5 17.9
20

22556 3468 60.6 39.2 51.9 26.422406 3456 74.8 53.5 66.2 40.722554 3491 64.5 43.1 55.8 30.422407 3549 77.7 56.3 69 43.622408 3583 82.2 60.8 73.5 48.122485 3420 64.8 57.4 56.1 59.522553 3556 86.1 64.8 77.4 5222405 3518 73.4 52 64.7 39.322401 3438 75 53.7 66.3 40.922448 3423 58.9 51.4 50.2 64.420184 2164 78.5 64.5 74.5 6320152 2392 42.1 28.2 38.2 22.520052 58 13.2 1.6 11.5 1320166 2388 39.4 28.1 38.1 27.420006 33 13.2 1.2 11.2 13.220005 27 12.1 0.8 10.4 14.420036 43 12.3 1.5 11 14.120910 603 10.3 8.3 17.1 21.120902 565 10.7 11.9 17.5 29.220861 580 15.4 19.2 22.2 36.420868 580 15.4 19.2 22.2 36.420906 540 14.5 15.1 21.3 3120879 510 22.8 26.8 29.6 34.320832 504 18.5 20.6 25.3 3520882 493 25.8 29.4 32.6 3720872 443 31.6 35.3 38.4 42.820877 513 24.8 23.2 31.5 30.820037 60 13.8 2 12.2 1320817 656 17.6 12.3 24.4 19.820860 499 17.4 20.1 24.2 35.320839 440 36.1 31.6 42.9 39.220842 441 39.9 35.4 46.7 42.920837 395 32.5 26.3 39.2 33.820903 610 6.5 9.2 13.3 2320818 648 19.1 10.4 25.9 18.720812 647 21.1 8.5 18.3 20.120816 647 21.1 8.5 18.3 20.120912 617 9.2 7 10.4 20.820833 500 20.1 23.8 26.8 37.820862 500 20.1 23.8 26.8 37.822734 3645 74.6 60.6 82.2 56.720119 3640 60.3 46.3 59.6 37.622728 3639 64 50 63.3 41.320186 3652 66 52.1 62.1 50.620001 191 11.2 1.5 9.9 15.220004 15 12.6 0.6 10.3 13.420057 66 14.2 3.6 13.3 14.6
21

20007 88 17.6 4.5 14.1 15.220008 149 15.4 3.7 13.5 15.820059 169 10.7 2 10.7 15.820064 226 9.1 4 9.4 17.820003 297 11.7 2.7 9.1 15.320374 364 15 3.3 9.4 15.120024 387 14.8 2.6 12.9 13.720319 388 17.1 2.5 11.5 14.320015 108 12.7 6.8 14.2 18.820011 131 11.9 4 11.6 17.820017 227 8.7 4.2 9.5 1820018 235 8.5 4.4 7.8 18.220158 2227 54 43.6 53.6 43.120019 326 12.2 4.9 6.1 19.820032 390 18 5.4 12 15.620132 2215 62.7 47.2 57.2 46.720105 2404 49.6 35.7 45.7 34.220197 2219 59.6 46.4 66.4 45.920129 2238 51.6 41.2 51.2 40.720175 2426 50.3 39.7 49.7 34.120147 2340 40.9 30.5 40.5 32.620148 2307 45 33.1 43.1 3320141 2187 60 49.6 59.6 49.120117 2433 59.5 45.6 55.6 39.920164 2369 35.2 24.8 34.8 24.320165 2354 37.1 26.7 36.7 26.222720 3643 84.3 63 75.7 50.220607 1392 31.3 18.1 22.6 19.525425 3673 75.2 73.7 82 58.225446 3663 78.7 77.2 85.5 70.721787 3235 72.4 70.8 79.1 78.422191 2772 46.4 25.1 37.7 12.322172 2721 56.9 35.6 48.3 22.822025 2721 56.9 35.6 48.3 22.822211 1487 15.3 3 13 11.422213 1439 26.9 9.1 19.1 14.120601 3174 35 26.7 26.3 32.920603 3192 34.7 26.1 26.1 27.521773 2847 63.3 61.8 70.1 69.321702 2844 54.3 52.8 61.1 60.321703 2940 51.3 49.8 58.1 57.321754 2903 39.4 37.9 46.2 45.421793 2879 56.3 54.7 63 62.321771 2895 38.8 47.2 45.6 54.821770 2905 36.8 41.4 43.5 48.921769 2823 57.5 56 64.3 63.521701 2918 51.9 50.3 58.6 57.9
22

21780 2850 71.4 69.9 78.2 77.421755 2941 54.1 52.6 60.9 60.121757 2864 61.6 60.1 68.4 67.621798 2875 57.1 55.5 63.8 63.121774 2883 48 46.4 54.8 5420852 685 16.1 13.1 22.9 24.420602 3173 35.9 27.6 27.2 33.421704 2911 41.4 39.9 48.2 47.421788 2853 62.3 60.7 69.1 68.321727 2866 64.9 63.4 71.7 70.921778 2866 64.9 63.4 71.7 70.922046 1920 27.5 9.8 19.8 1322067 1885 22.6 14.2 24.2 16.622101 1880 25 9.3 19.3 1622180 1823 27.6 16.2 26.2 14.722027 1857 26 12.6 22.6 11.422102 1888 24.5 14.1 24.1 15.322066 1712 28.7 19.3 29.3 21.120041 1677 41.9 28 38 22.320170 1736 35.3 24.9 34.9 24.420190 1732 31.8 21.4 31.4 20.920120 1700 41.7 27.8 37.7 26.320171 1760 36.1 26.4 36.4 20.720192 1743 33.7 22.4 32.4 22.322033 1665 36.4 22.4 32.4 16.822124 1782 31.5 20.2 30.2 18.722181 1778 28.9 17.9 27.9 16.422041 1908 20.7 8.4 18.9 8.322042 1961 29.7 12 22 8.722031 1976 30.6 17 32.2 9.520191 1768 32.8 23 33 21.522312 2003 22.8 10.4 25.4 5.520194 1733 31.7 21.3 31.3 20.820151 1682 41.9 27.9 37.9 26.420121 1612 42.2 28.3 42.5 20.222044 1947 29.8 9.2 19.1 9.222003 1982 31.4 14 28.6 5.922303 2060 28.6 10.1 19.9 6.722306 2075 30.8 12.8 22.1 822150 2022 34.6 13.2 25.9 222309 2079 33.2 18.2 24.5 8.822307 2067 29.5 10.5 20.8 11.222151 1989 35.8 12.7 27.1 4.122079 2091 44.6 23.3 36 10.522060 2089 39.9 20.9 31.3 8.222015 2142 35.9 18.8 31.8 8.422032 2145 35.4 18.7 31.6 8.9
23

20124 1617 41.7 27.8 40.5 16.222310 2048 30.2 11.7 21.5 5.522153 2126 38.3 16.9 29.6 5.622030 1635 34.9 20.9 34.2 11.522039 2156 42.6 21.2 33.9 9.922152 2137 37.7 16.1 29.1 5.122043 1924 26.1 11.5 21.5 12.322308 2069 33.2 14.1 24.5 11.422315 2038 33.7 12.9 25 3.522182 1829 28.4 20 29.9 16.321401 3092 28.7 30.9 21.6 47.620670 3376 70.9 62.6 62.2 68.420755 3021 13.9 24.6 18.8 43.320144 3607 74.9 60.9 70.9 59.421776 3231 48.8 51 55.6 68.621791 2874 58.3 56.7 65.1 64.320838 437 36.9 35.3 43.6 42.921710 2945 46.4 44.8 53.1 52.421777 2947 45.4 41.8 52.2 49.321790 2947 45.4 41.8 52.2 49.321718 2822 60.4 58.9 67.2 66.421758 2822 60.4 58.9 67.2 66.421716 2820 59 57.4 65.7 6520876 473 29.5 28 36.3 35.520841 434 32.6 31.1 39.4 38.620886 485 26.5 25 33.3 32.520878 758 25.5 23.4 32.2 30.920855 525 20.4 20.6 27.2 33.620850 725 21.2 19.6 27.9 27.220871 444 34.4 32.9 41.2 40.420874 419 29 27.4 35.7 3520854 765 22.2 16 28.9 23.520895 679 13.3 10.5 20.1 24.420896 676 13.6 11.7 20.4 25.120815 636 13.6 7.5 20.4 22.420814 664 13.8 9.2 20.6 23.220904 573 9.6 13.4 16.4 26.420901 595 7.9 10.2 14.6 22.720866 585 10.9 16 17.7 29.120905 581 12.1 16.7 18.8 35.522305 1585 18.8 6.4 20.8 1022304 1550 31 9 22.3 5.522301 1582 28.4 7.4 19.7 9.822206 1516 19.1 6.7 17.2 7.722311 1563 20.5 8.1 18.6 7.222314 1604 27.2 7.6 18.5 9.722302 1569 19.2 6.9 21.4 8.4
24

20853 533 16.6 16.7 23.4 29.620851 544 15.9 15.7 22.7 27.4
25

Construction Emissions
26

Construction Emissions Methodology
Construction activities would result in emissions of criteria pollutants through vehicle exhaust and fugitive dust over the approximately four- year construction period. Given that detailed construction methods and staging plans are not currently available, it is not possible to conduct a detailed construction emissions analysis specific to the proposed project. Instead, the overall order of magnitude of construction emissions that are likely to occur can be understood based on a review of the emissions analyses conducted for other projects of a similar scale and scope. After reviewing multiple potentially comparable projects, the selected comparison project for the purpose of direct construction equipment emissions is the U.S. Department of State’s Foreign Affairs Security Training Center (FASTC) at Nottoway County, Virginia. The FASTC project as originally proposed involved 2.5 million GSF of building space, 1,070 staff and 8-10K trainees annually.1 The total building space to be constructed by the original FASTC project is the same as the total building space for the FBI Headquarters (approximately 2.5 million GSF). The FASTC EIS construction emissions methodologies included the NONROAD2008 model, MOVES2010, and AP-42.2 A detailed list of assumptions is provided in the FASTC air quality technical report.
The FASTC project was analyzed based on a seven year construction schedule (2014 through 2020). The total emissions from the 7 years of construction assumed for the FASTC project were be summed and divided by the four years of construction (2018 through 2022) proposed for the FBI Headquarters project to determine average annual emissions from construction equipment.
With respect to fugitive dust emissions, the FASTC project was not considered comparable because it involved the disturbance of over 1,100 acres, compared to less than 100 acres for any of the FBI Headquarters alternatives. Dust emissions are proportional to the surface area of soil exposed, therefore, the use of the FASTC emissions of dust for the FBI project would result in an unrealistically high level of impact. Therefore, a separate construction dust emissions analysis was completed for each of the sites.
Section 13.2.3 of AP-42 provides a conservative total suspended particulate (TSP) emission factor for heavy construction of 1.2 tons/acre/month or alternative methods addressing each component of the construction process separately (e.g. land clearing, bulldozing, scraping etc.).i The overall emission factor was used as the basis for estimating fugitive dust emissions because the currently available information on the construction process would not meet the data needs of the alternative methods.
1 http://www.state.gov/recovery/fastc/z/ The project scope was eventually reduced, but the air quality analysis was prepared based on the initial (larger) project scope. 22 http://www.state.gov/documents/organization/241089.pdf
27

The TSP emission factor was converted to a PM10 emission factor assuming 50% of the TSP consists of PM10 per AP-42 Section 13.2.5.3. PM2.5 was assumed to consist of 10% of PM10 dust.ii As construction is completed in each portion of the project site, stabilization measures will be implemented to control both dust and erosion/stormwater. The analysis conservatively assumed approximately 40% of each site would consist of uncovered/open soil at any given time. A 50% reduction in emissions was credited for commitment to dust control measures (e.g. watering during dry weather, covering trucks etc.).
Table 3
Construction Emissions- Greenbelt
VOC (tons) CO (tons) NOx (tons) SO2 (tons) PM10 (tons) PM2.5 (tons) Total Construction Equipment Emissions (from FASTC EIS)
16.1 261.0 213.8 4.6 11.5 11.0
Annual Average Construction Equipment Emissions (over four years)
4.0 65.2 53.4 1.2 2.9 2.8
Annual Average Fugitive Dust emissions
-- -- -- -- 47.5 4.8
Total Construction Emissions per year 4.0 65.2 53.4 1.2 50.4 7.6
General Conformity de minimis threshold (per year)
50 100 100 100 100 100
28

Table 4
Construction Emissions- Landover
VOC (tons) CO (tons) NOx (tons) SO2 (tons) PM10 (tons) PM2.5 (tons) Total Construction Equipment Emissions (from FASTC EIS)
16.1 261.0 213.8 4.6 11.5 11.0
Annual Average Construction Equipment Emissions (over four years)
4.0 65.2 53.4 1.2 2.9 2.8
Annual Average Fugitive Dust emissions
-- -- -- -- 115.2
11.5
Total Construction Emissions per year 4.0 65.2 53.4 1.2 118.1 14.3
General Conformity de minimis threshold (per year)
50 100 100 100 100 100
Table 5
Construction Emissions- Springfield
VOC (tons) CO (tons) NOx (tons) SO2 (tons) PM10 (tons) PM2.5 (tons) Total Construction Equipment Emissions (from FASTC EIS)
16.1 261.0 213.8 4.6 11.5 11.0
Annual Average Construction Equipment Emissions (over four years)
4.0 65.2 53.4 1.2 2.9 2.8
Annual Average Fugitive Dust emissions
-- -- -- -- 83.5
8.4
Total Construction Emissions per year 4.0 65.2 53.4 1.2 86.4
11.1
General Conformity de minimis threshold (per year)
50 100 100 100 100 100
29

i http://www.epa.gov/ttn/chief/ap42/ch13/final/c13s02-3.pdf ii http://www.epa.gov/ttnchie1/conference/ei14/session5/pace.pdf
30

Construction Emissions Calculations
FASTC Construction EmissionsVOC CO NOx SO2 PM10 PM2.5 PM10 PM2.5 PM10 PM2.5
2014 2.93 36.34 35 0.77 148.11 16.53 146.1 14.61 2.01 1.922015 2.91 34.71 34.85 0.77 148.12 16.54 146.1 14.61 2.02 1.932016 3.49 54.44 44.82 0.97 153.83 17.5 151.4 15.14 2.43 2.362017 4.16 69.29 55.79 1.21 182.36 20.76 179.4 17.94 2.96 2.822018 1.27 35.44 21.01 0.44 34.25 4.29 33.3 3.33 0.95 0.962019 0.69 15.61 11.15 0.24 28.55 3.33 28 2.8 0.55 0.532020 0.69 15.12 11.13 0.24 28.54 3.32 28 2.8 0.54 0.52
Total 16.1 261.0 213.8 4.6 723.76 82.27 11.5 11.0FBI Construction Emissions per year*
4.0 65.2 53.4 1.2 2.9 2.8* Assuming four years of construction
Dust Greenbelt 47.5 4.8Greenbelt total 50.4 7.6
Dust Landover 115.2 11.5Landover total 118.1 14.3
Dust Springfield 83.5 8.4Springfield total 86.4 11.1
Total (Equipment + Fugitive Dust) FASTC Fugitive Dust FASTC Equipment -Only
PM10 and PM2.5 Total for FBI HQ Construction
31

Fugitive Dust from ConstructionFrom AP-42, Section 13.2.3 Heavy Construction Operations:For construction activity operations:
TSP emissions= 1.2 tons/acre/month of activityPM10 fraction- 0.5
PM10 Emission Factor 0.6 tons/acre/month
Uncontrolled PM10 7.2 tons/acre/yearGreenbelt Landover Springfield
acres 33.0 80 5840% uncovered at one time 13.2 32.0 23.2Uncontrolled PM10 tons/year 95.0 230.4 167.0Controlled PM10 tons/year 47.5 115.2 83.5Controlled PM2.5 4.8 11.5 8.4
32