fcat 2.0 reading, mathematics, and algebra 1 end-of … · and algebra 1 end-of-course assessment...
TRANSCRIPT
Rule Development Workshops
October 10-12, 2011
FCAT 2.0 Reading, Mathematics, and Algebra 1 End-of-Course Assessment Standard Setting
Office of Assessment
Florida Department of Education

Purpose of this Rule Development Workshop 2
Express the Department’s intent: To develop a rule for consideration by the State Board of
Education To establish achievement levels for FCAT 2.0 Reading,
Mathematics, and Algebra 1 End-of-Course Assessments
Obtain input from interested audiences: General input about setting the achievement levels Specific feedback on achievement level recommendations

Today’s Topics 3
Background on the assessments
Review the standard-setting process
Review the recommendations
Review the impact data
Feedback from you

Type of Assessment Assessment Area Year Administered to Students 2011-12 2012-13 2013-14 2014-15
FCAT FCAT Writing Gr 4, 8, 10 Gr 4, 8, 10 Gr 4, 8, 10
FCAT 2.0
FCAT 2.0 Reading Gr 3-10 Gr 3-10 Gr 3-10
FCAT 2.0 Mathematics
Gr 3-8 Gr 3-8 Gr 3-8
FCAT 2.0 Science Gr 5, 8 Gr 5, 8 Gr 5, 8 Gr 5, 8
End-of-Course Assessments
Algebra 1 In Course In Course In Course
Geometry In Course In Course In Course
Biology 1 In Course In Course In Course In Course
US History In Course In Course In Course
Civics Middle School
Middle School
Partnership for Assessment of Readiness for College and Careers (PARCC)
English language Arts Gr 3-11
Mathematics Gr 3-8
High School Math EOCs (3 subjects)
In course
Postsecondary Education Readiness Test (PERT)
Reading, Writing, Mathematics
Gr 11 Gr 11 Gr 11 Gr 11

FCAT 2.0 Reading
Grades 3-10
All multiple-choice items
Increased content rigor — aligned to the Next Generation Sunshine State Standards (NGSSS).
5

FCAT 2.0 Reading: Examples of Increased Rigor
Students are asked more often to:
use reasonable prior knowledge, such as grade-appropriate
vocabulary.
make reasonable inferences that are not explicitly text-based.
analyze information across a pair of texts, such as making comparisons of main ideas.
6

FCAT 2.0 Mathematics
Grades 3-8
Multiple-choice and gridded-response items
Increased content rigor — aligned to the 2007 Next Generation Sunshine State Standards (NGSSS).
7

FCAT 2.0 Mathematics: Examples of Increased Rigor
● FCAT 2.0 will more often require students to use information learned in an earlier grade and apply it to a current problem.
On FCAT, for example, students responded to items related to mean, median, and mode at several consecutive grades. On FCAT 2.0, this concept is assessed primarily in grade 6, but may be incorporated in test items assessing other benchmarks at grades 7 and 8.
Before, students at a certain grade level were asked to make conversions within a measurement system such as converting feet to inches. Now, students will be asked to make conversions across measurement systems such as converting feet to meters.
8

Algebra 1 EOC Assessment
Aligned to the 2007 Next Generation Sunshine State Standards Algebra 1 course description
Computer-based test with paper-based test
accommodations Online reference sheet and straightedge Up to 65 items: Multiple-choice and fill-in response items No performance tasks
9

FCAT 2.0/EOC are Standards-Based Tests 10
Based on Florida’s content standards (Next Generation Sunshine State Standards)
Students’ scores are in comparison to achievement standards – the criteria (Criterion-Referenced Test)
Used to measure how well students have learned the content assessed
Used to measure the teaching and learning of important content in Florida’s schools

When is Standard Setting Necessary?
Standard setting becomes necessary whenever any of the following occur New test
Curriculum updates
Blueprint changes
Achievement Level Description changes
Next Generation Sunshine State Standards – new content standards
11

Why have standards?
To define what students should know and be able to do
To identify clear expectations for students, parents, and teachers
To improve teaching and learning
To develop a society able to compete in a global economy
Important! Standards define what we want to achieve.
Standards do not describe our current status.
12

Types of Standards
Content Standards - Define the “what”
Next Generation Sunshine State Standards
Common Core State Standards
Performance Standards - Define how much
Achievement-Level Standards
Graduation Requirement
Accountability Standards
School Grading Criteria
Adequate Yearly Progress
13
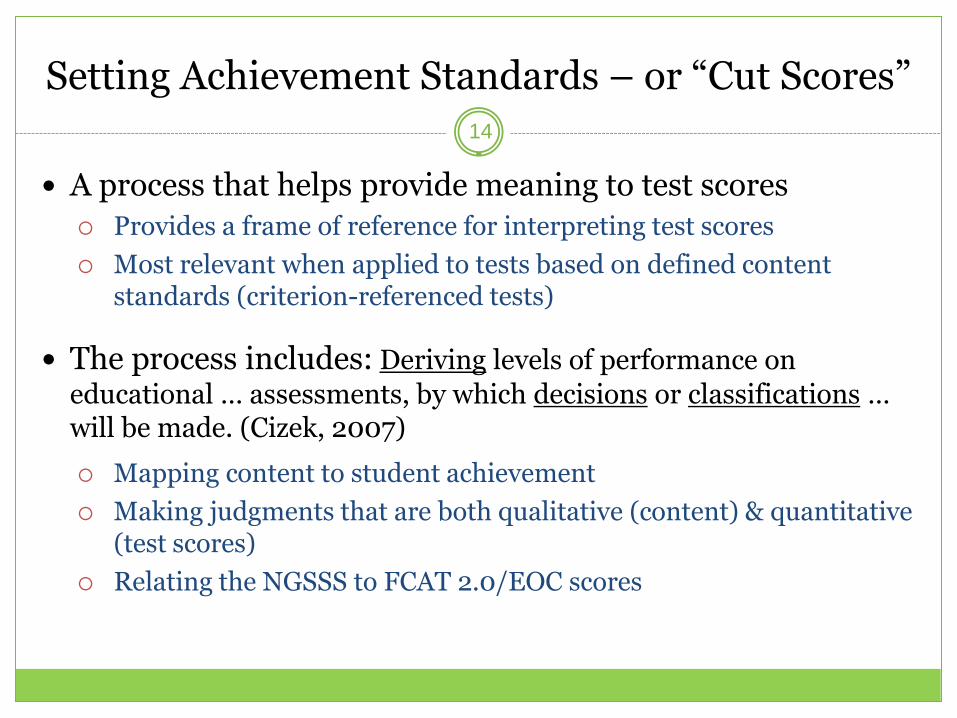
Setting Achievement Standards – or “Cut Scores” 14
A process that helps provide meaning to test scores Provides a frame of reference for interpreting test scores
Most relevant when applied to tests based on defined content standards (criterion-referenced tests)
The process includes: Deriving levels of performance on educational … assessments, by which decisions or classifications … will be made. (Cizek, 2007)
Mapping content to student achievement
Making judgments that are both qualitative (content) & quantitative (test scores)
Relating the NGSSS to FCAT 2.0/EOC scores

Achievement Levels 15
There are five Achievement Levels
Requires the setting of four Achievement Level cuts
Level 1 Level 5 Level 2 Level 3 Level 4 Low High
Five Achievement Levels, Four Cut Points

We’ve done this before…
1998: Reading and Mathematics Achievement Standards approved
for grades 4, 5, 8, and 10.
2001: Reading and Mathematics Achievement Standards approved
for grades 3-10.
Grade 10 passing scores established.
16

Past Experience - FCAT Reading Standards
32% 31% 29% 27% 26%
22% 21% 20% 18% 18%
47% 47% 50% 52% 53%
57% 58% 60% 61% 62%
0%
10%
20%
30%
40%
50%
60%
70%
80%
90%
100%
2001 2002 2003 2004 2005 2006 2007 2008 2009 2010
FCAT Reading by Achievement Level
Grades 3-10
Level 1 PCT Level 3 Above PCT
17

Past Experience - FCAT Mathematics Standards
30% 27% 25% 23%
21% 18% 17% 16% 15% 14%
49% 50% 53%
55% 58%
61% 63% 65% 66% 67%
0%
10%
20%
30%
40%
50%
60%
70%
80%
90%
100%
2001 2002 2003 2004 2005 2006 2007 2008 2009 2010
FCAT Mathematics By Achievement Level
Grade 3-8
Level 1 PCT Level 3 Above PCT
18

Standard-Setting Steps
1. Develop a policy definition describing the meaning of each Achievement Level
2. Develop achievement-level descriptions 3. Convene a standard-setting panel composed of
educators 4. Conduct the standard-setting process to propose
cut scores 5. Convene a business and policy leader reactor
panel to review the proposed cut scores 6. Obtain State Board of Education approval of cut
scores with public input
19
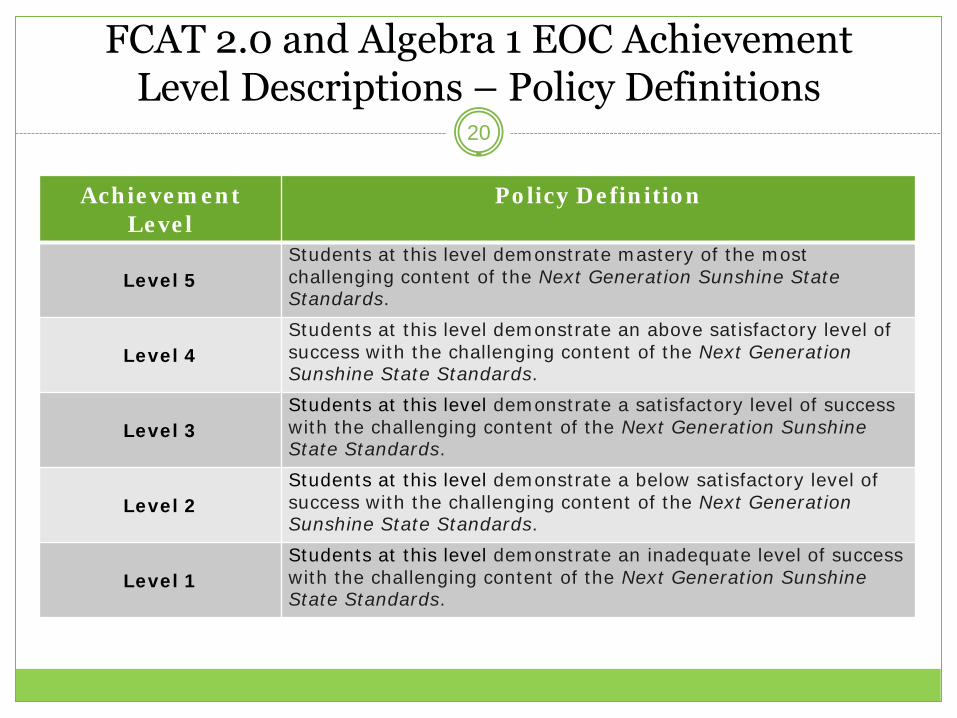
FCAT 2.0 and Algebra 1 EOC Achievement Level Descriptions – Policy Definitions
20
Achievement Level
Policy Definition
Level 5 Students at this level demonstrate mastery of the most challenging content of the Next Generation Sunshine State Standards.
Level 4 Students at this level demonstrate an above satisfactory level of success with the challenging content of the Next Generation Sunshine State Standards.
Level 3 Students at this level demonstrate a satisfactory level of success with the challenging content of the Next Generation Sunshine State Standards.
Level 2 Students at this level demonstrate a below satisfactory level of success with the challenging content of the Next Generation Sunshine State Standards.
Level 1 Students at this level demonstrate an inadequate level of success with the challenging content of the Next Generation Sunshine State Standards.

Achievement Level Descriptions 21
Achievement Level Descriptions (ALDs) explain what a typical student at each achievement level should know and be able to do for every grade level and subject.
Developed by committee of educators and then posted for public review and comment.

Educator Panels: September 20-23 22
Approximately 300 teachers and district-level administrators with subject-area expertise and expertise with special populations.
Panels represented Florida’s diversity, including: Gender
Ethnicity
District Size

Standard-Setting Procedure - Educator Panel 23
Reviewed and discussed achievement level descriptions (ALDs)
Panelists “took the test”
Participated in standard-setting training
Practiced judgmental procedure
Provided independent judgments in multiple rounds

Modified Angoff Method 24
The judgmental process (by item)
Review the Achievement Level Description
Evaluate the knowledge & skills needed to respond correctly to the item
Judge the percentage of students expected to respond correctly

The ‘Just-Barely’ Test Taker 25
Borderline in terms of achievement level
Just barely meets criteria to be classified into the achievement level
Level 1 Level 2 Level 3 Level 4 Level 5
Achievement
‘Just-Barely’ Level Students

College Readiness 26
According to Florida Law
“In addition to designating a passing score under subparagraph 6., the State Board of Education shall also designate, by rule, a score for each statewide, standardized end-of-course assessment which indicates that a student is high achieving and has the potential to meet college-readiness standards by the time the student graduates from high school.”1
Question: Which achievement level cut represents a level of student achievement that indicates the student is high achieving AND has the potential to meet college-readiness standards by the time he/she graduates from high school? Why?
1Florida Statutes: Title XLVIII, Chapter 1008, Section 1008.22, (3) (c) 7

Reactor Panel Meeting – September 29-30 27
Convened a group of diverse stakeholders from across Florida
Provided feedback to the Department on the outcomes of the educator panels

2011 FCAT 2.0 Reading and Mathematics/Algebra 1 End-of-Course (EOC) Assessment Reactor Panel Committee List
Last Name First Name Organization
Benjamin Michael Step Up For Students
Biemesderfer David Florida's Philanthropic Network
Birnholz Steven Florida Council of 100
Blocker Ronald Orange County Schools
Boyd Dan Alachua County Schools
Bragg Mary Laura Foundation for Florida's Future
Burke Joseph Lee County Schools
Cox Wally Highlands County Schools
Finney Janice Florida State University
Fiorentino Heather Pasco County Schools
Hovey Jean Florida PTA
Howdyshell Linda Broward College
Joyner Joseph St. Johns County Schools
Moxley Susan Lake County Schools
Pratt-Dannals William E. Duval County Schools
Rodriguez Ed Hispanic CREO
Smith Margaret (Peg) Volusia County Schools
Thomas Malcolm Escambia County Schools
Tibbetts Alexis Okaloosa County Schools
Vogel Bill Seminole County Schools
West Ryan Florida Chamber of Commerce
28

Reactor Panel Review 29
Considered the following: Information and materials from the standard-setting meeting
Next Generation Sunshine State Standards
Achievement Level Descriptions
External tests that are commonly administered to Florida students outside of the FCAT 2.0 and Algebra 1 EOC Assessment system NAEP, Stanford 10, PSAT, SAT, PLAN, ACT
Impact data By subject/grade
By gender
By ethnicity
Across subjects and grades (“vertical articulation”)

Key Review Questions 30
Reactor panel considered the following questions: Do the impact data for this grade look reasonable compared to
other grades?
Is this the expected pattern of impact data across grades and between subjects?
How does the impact data compare to external data?
What is your feedback? Would you move the cut scores higher (higher expectation) or lower (lower expectation)? Why?

Sample Vertical Articulation – Scale Scores 31

Sample Vertical Articulation – Impact Data 32
18 14 14 13 11 16 17
19 21 18 19 2423 26
32 34 35 32 31 2728
21 22 2423 22 22
19
10 9 9 13 12 12 10
0%
10%
20%
30%
40%
50%
60%
70%
80%
90%
100%
Math Gr3 Math Gr4 Math Gr5 Math Gr6 Math Gr7 Math Gr8 Algebra I EOC
Level 5
Level 4
Level 3
Level 2
Level 1

FCAT 2.0 Reading and Mathematics Scale Score Ranges
33
Grade Level Reading Mathematics
3 140-260 140-260
4 154-269 155-271
5 161-277 163-279
6 167-283 170-284
7 171-289 179-292
8 175-296 187-298
9 178-302 N/A
10 188-302 N/A

Scale Scores – Reading, Educator Panel 34
174
190 198
210 206 216
227 228
184
210 217
225 219
229 238 243
199
221 232 237 240
250 258 256
216
233 242 247
258 265 266 271
150
175
200
225
250
275
300
3 4 5 6 7 8 9 10
Scal
e Sc
ore
Grade Level
Proposed FCAT 2.0 Reading Scale Score Cuts - Educator Panel, 9/23/11
Achievement Level 2 Cut Score Achievement Level 3 Cut Score
Achievement Level 4 Cut Score Achievement Level 5 Cut Score

Impact Data – Reading, Educator Panel 35
11% 13% 14% 21%
12% 16%
26% 19%
10%
32% 30%
26%
15%
19%
19% 25% 24%
22% 28% 23%
40%
39%
35% 26%
32%
18% 14% 14% 24%
16% 9% 20%
23% 15% 14% 15%
10% 9% 12% 10%
3 4 5 6 7 8 9 10 Grade
Impact Distribution for Reading - Vertical Articulation After Round 5
Level 1 Level 2 Level 3 Level 4 Level 5

Scale Scores – Mathematics, Educator Panel 36
180 194
201 213
220 229
195 206
222 225 234
240
214 220
234 240
248 256
229 238
246 253
259 265
150
175
200
225
250
275
300
3 4 5 6 7 8
Scal
e Sc
ore
Grade Level
Proposed FCAT 2.0 Mathematics Scale Score Cuts - Educator Panels, 9/23/11
Achievement Level 2 Cut Score Achievement Level 3 Cut Score
Achievement Level 4 Cut Score Achievement Level 5 Cut Score
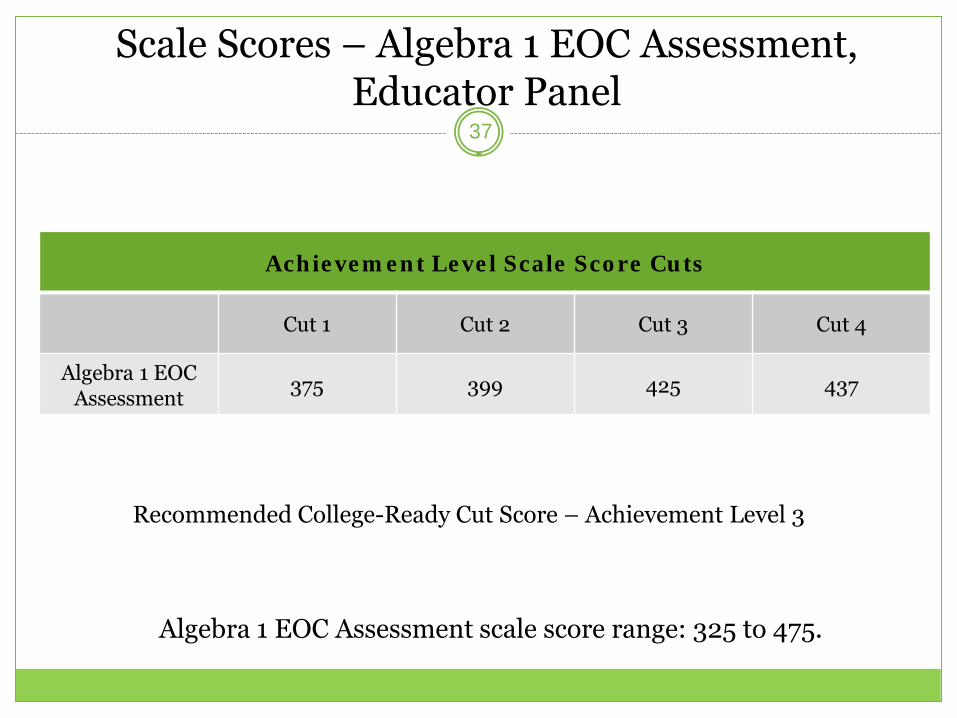
Scale Scores – Algebra 1 EOC Assessment, Educator Panel
37
Achievement Level Scale Score Cuts
Cut 1 Cut 2 Cut 3 Cut 4
Algebra 1 EOC Assessment
375 399 425 437
Recommended College-Ready Cut Score – Achievement Level 3
Algebra 1 EOC Assessment scale score range: 325 to 475.

Impact Data – Mathematics, Educator Panel 38
16% 16% 15% 22% 20% 22% 18%
23% 18%
33% 20% 24% 20% 28%
36%
28%
24% 30% 28% 32%
37%
16%
26% 17% 18% 16% 13%
10%
9% 12% 11% 9% 12% 13% 7%
3 4 5 6 7 8 Algebra Grade
Impact Distribution for Math - Vertical Articulation After Round 5
Level 1 Level 2 Level 3 Level 4 Level 5
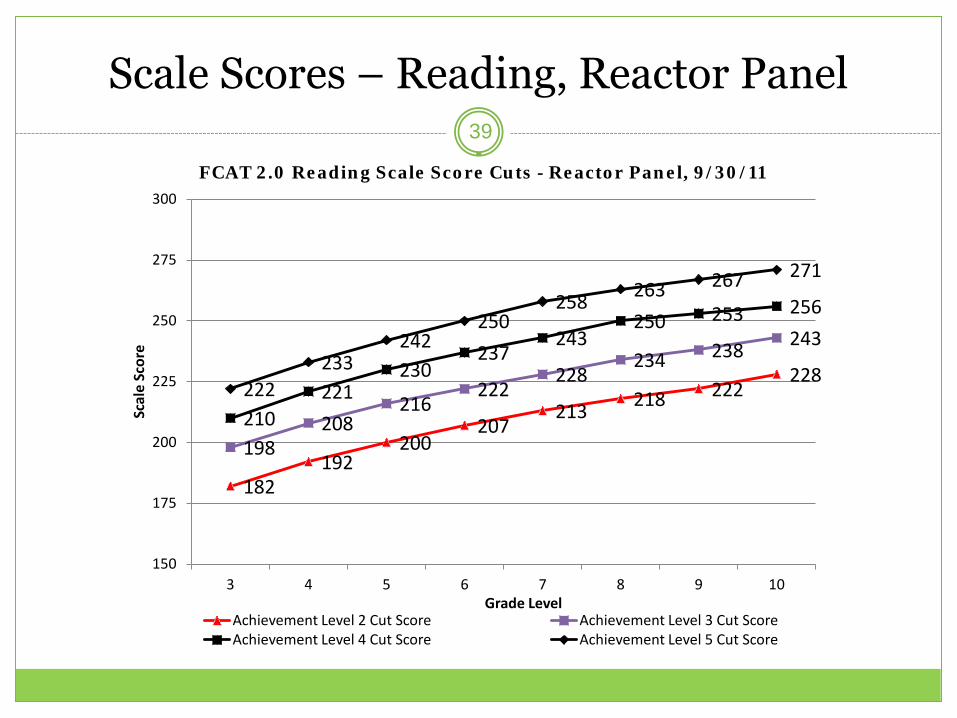
Scale Scores – Reading, Reactor Panel 39
182 192
200 207
213 218 222 228
198 208
216 222
228 234 238 243
210 221
230 237
243 250 253 256
222 233
242 250
258 263 267 271
150
175
200
225
250
275
300
3 4 5 6 7 8 9 10
Scal
e Sc
ore
Grade Level
FCAT 2.0 Reading Scale Score Cuts - Reactor Panel, 9/30/11
Achievement Level 2 Cut Score Achievement Level 3 Cut Score Achievement Level 4 Cut Score Achievement Level 5 Cut Score

Impact Data – Reading, Reactor Panel 40
18% 15% 16% 17% 18% 19% 19% 19%
25% 26% 26% 24% 24% 26% 26% 25%
23% 26% 27% 29% 29% 29% 27% 26%
19% 18% 18% 18% 19% 15% 17% 20%
15% 15% 14% 12% 10% 11% 11% 10%
3 4 5 6 7 8 9 10 Grade
Percentage in each Performance Category
Level 1 Level 2 Level 3 Level 4 Level 5

Scale Scores – Mathematics, Reactor Panel 41
183
197 205
213 220
229
198
210 220
227 234
241
214 224
234 240
248 256
229 238
246 253
259 266
150
175
200
225
250
275
300
3 4 5 6 7 8
Scal
e Sc
ore
Grade Level
Proposed FCAT 2.0 Mathematics Scale Score Cuts - Reactor Panel, 9/30/11
Achievement Level 2 Cut Score Achievement Level 3 Cut Score
Achievement Level 4 Cut Score Achievement Level 5 Cut Score

Impact Data – Mathematics, Reactor Panel 42
19% 19% 19% 22% 20% 22% 18%
25% 23% 25% 24% 24% 22% 28%
31% 28% 28% 26% 28% 30% 37%
16% 18% 17% 18% 16% 14%
10% 9% 12% 11% 9% 12% 12% 7%
3 4 5 6 7 8 Algebra
Grade
Percentage in each Performance Category
Level 1 Level 2 Level 3 Level 4 Level 5

Proposed Rule 43
The Commissioner is recommending changes as follows: Set the bar higher for Achievement Level 5 – by setting the
expectation such that no more than 10% of 2011 students would have achieved Level 5 in all grades and subjects.
Make a small correction to the required scale score to achieve Level 4 in Grade 8 Reading. It was slightly inconsistent with the other grades (slightly more
rigorous) and subtracting one scale score point (250 to 249) achieved consistency.

Scale Scores – Reading, Proposed Rule 44
182 192
200 207
213 218 222
228
198 208
216 222
228 234 238
243
210 221
230 237
243 249 253 256
227 238
246 252
258 264 268 271
150
175
200
225
250
275
300
3 4 5 6 7 8 9 10
Scal
e Sc
ore
Grade Level
FCAT 2.0 Reading Scale Score Cuts - Proposed Rule, 10/7/11
Achievement Level 2 Cut Score Achievement Level 3 Cut Score
Achievement Level 4 Cut Score Achievement Level 5 Cut Score
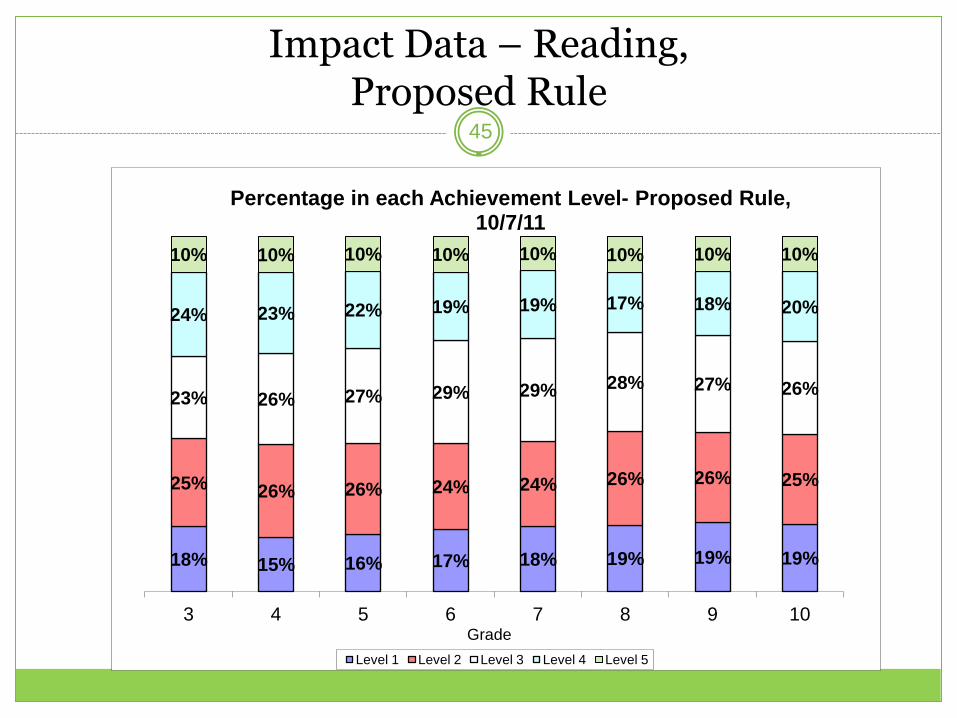
Impact Data – Reading, Proposed Rule
45
18% 15% 16% 17% 18% 19% 19% 19%
25% 26% 26% 24% 24% 26% 26% 25%
23% 26% 27% 29% 29% 28% 27% 26%
24% 23% 22% 19% 19% 17% 18% 20%
10% 10% 10% 10% 10% 10% 10% 10%
3 4 5 6 7 8 9 10 Grade
Percentage in each Achievement Level- Proposed Rule, 10/7/11
Level 1 Level 2 Level 3 Level 4 Level 5

Historical Data – FCAT Reading 46
19% 18% 14%
12% 11% 10% 9% 9% 8% 9% 9%
40% 37%
33%
27% 23%
21% 20% 21% 19% 18% 18%
48% 44%
39%
33% 29%
26% 27% 27% 24%
26% 26%
0%
10%
20%
30%
40%
50%
60%
70%
2001 2002 2003 2004 2005 2006 2007 2008 2009 2010 2011
White Hispanic African-American
FCAT Reading (2001-2010) and FCAT 2.0 Reading (2011) Achievement Level 1
Grades 3, 4, and 5

Historical Data – FCAT Reading 47
18% 18% 16% 17% 16%
12% 11% 10% 9% 9% 9%
41% 39%
36% 36% 34%
27% 24% 23%
21% 19% 19%
50% 48%
44% 44% 41%
32% 31% 28% 27% 28% 27%
0%
10%
20%
30%
40%
50%
60%
70%
2001 2002 2003 2004 2005 2006 2007 2008 2009 2010 2011
White Hispanic African-American
FCAT Reading (2001-2010) and FCAT 2.0 Reading (2011) Achievement Level 1 Grades 6, 7, and 8

Historical Data – FCAT Reading 48
25% 26% 25% 25% 24% 22% 21%
18% 17% 16% 17%
52% 51% 49% 48%
46% 42%
40% 37%
34% 30% 30%
63% 62% 60% 59% 59%
53% 52% 49%
46% 45% 44%
0%
10%
20%
30%
40%
50%
60%
70%
2001 2002 2003 2004 2005 2006 2007 2008 2009 2010 2011
White Hispanic African-American
FCAT Reading (2001-2010) and FCAT 2.0 (2011) Achievement Level 1
Grades 9 and 10

Proposed Rule Impact Data (by Subgroup)
Reading 49
15% 21% 13% 18% 13% 19%
23% 26%
25% 27%
26% 25%
24% 23%
26% 25%
28% 26%
26% 22%
24% 21% 23% 21%
12% 9% 12% 9% 10% 10%
0%
10%
20%
30%
40%
50%
60%
70%
80%
90%
100%
Grade 3 Female Grade 3 Male Grade 4 Female Grade 4 Male Grade 5 Female Grade 5 Male
Perc
ent
Group
Grades 3, 4, and 5 Reading AL Percentages
Level 5 Level 4 Level 3 Level 2 Level 1

50
15% 19% 16% 20% 16% 21% 18% 21% 18% 20%
24% 24%
25% 24%
26% 27%
26% 25% 26% 25%
30% 28% 29% 29% 28%
27% 28% 27%
26% 26%
20% 19% 19% 19% 18% 16%
19% 18% 20% 20%
11% 9% 11% 9% 12% 9% 10% 10% 11% 9%
0%
10%
20%
30%
40%
50%
60%
70%
80%
90%
100%
Grade 6 Female
Grade 6 Male
Grade 7 Female
Grade 7 Male
Grade 8 Female
Grade 8 Male
Grade 9 Female
Grade 9 Male
Grade 10 Female
Grade 10 Male
Perc
ent
Group
Grades 6, 7, 8, 9, and 10 Reading AL Percentages
Level 5 Level 4 Level 3 Level 2 Level 1
Proposed Rule Impact Data (by Subgroup)
Reading

Proposed Rule Impact Data (by Subgroup) Reading
51

Proposed Rule Impact Data (by Subgroup) Reading
52

Proposed Rule Impact Data (by Subgroup) Reading
53
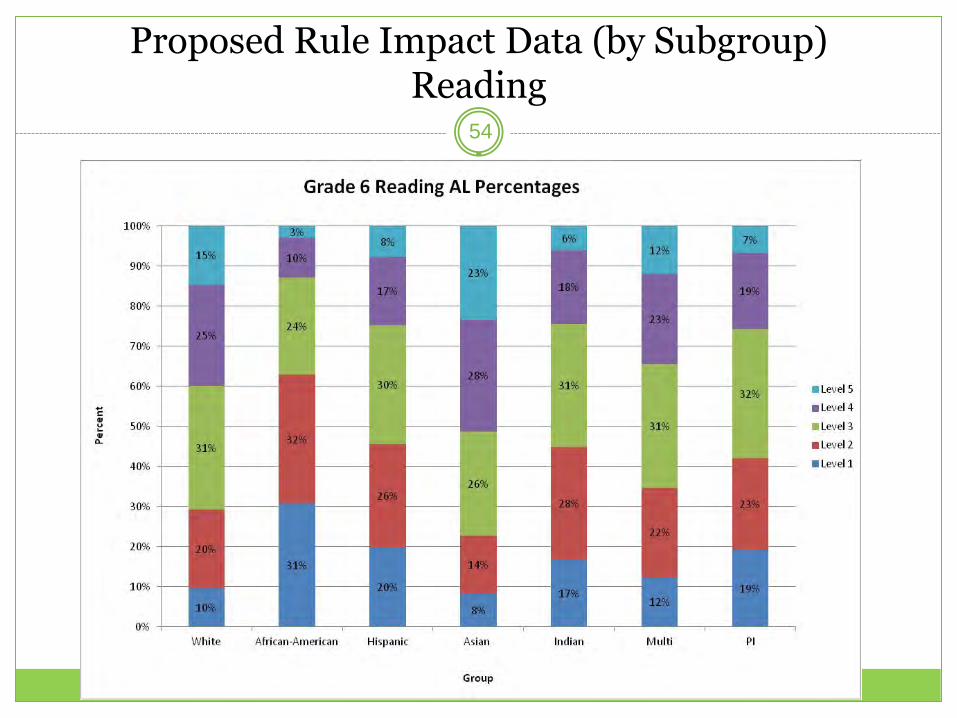
Proposed Rule Impact Data (by Subgroup) Reading
54

Proposed Rule Impact Data (by Subgroup) Reading
55

Proposed Rule Impact Data (by Subgroup) Reading
56

Proposed Rule Impact Data (by Subgroup) Reading
57

Proposed Rule Impact Data (by Subgroup) Reading
58

Scale Scores – Mathematics, Proposed Rule 59
183
197 205
213 220
229
198 210
220 227
234 241
214 224
234 240
248 256
229 240
247 253
261 268
150
175
200
225
250
275
300
3 4 5 6 7 8
Scal
e Sc
ore
Grade Level
Proposed FCAT 2.0 Mathematics Scale Score Cuts - Proposed Rule, 10/7/11
Achievement Level 2 Cut Score Achievement Level 3 Cut Score
Achievement Level 4 Cut Score Achievement Level 5 Cut Score

Scale Scores – Algebra 1 EOC Assessment, Proposed Rule
60
Achievement Level Scale Score Cuts
Cut 1 Cut 2 Cut 3 Cut 4
Algebra 1 EOC Assessment
375 399 425 437
Recommended College-Ready Cut Score – Achievement Level 3

Impact Data – Mathematics, Proposed Rule
61
19% 19% 19% 22% 20% 22% 18%
25% 23% 25% 24% 24% 22% 28%
31% 28% 28% 26% 28% 30% 37%
16% 20% 18% 18% 18% 16% 10%
9% 10% 10% 9% 10% 10% 7%
3 4 5 6 7 8 Algebra Grade
Percentage in each Achievement Level - Proposed Rule, 10/7/11
Level 1 Level 2 Level 3 Level 4 Level 5

Historical Data – FCAT Mathematics 62
16% 14%
12% 10% 9% 8% 7% 7% 6% 6% 6%
33% 29%
26% 22%
18% 17% 15% 14% 13% 12% 12%
47%
41% 37%
31% 28%
25% 23% 22%
20% 19% 19%
0%
10%
20%
30%
40%
50%
60%
70%
2001 2002 2003 2004 2005 2006 2007 2008 2009 2010 2011
White Hispanic African-American
FCAT Mathematics (2001-2010) and FCAT 2.0 Mathematics (2011) Achievement Level 1
Grades 3, 4, and 5

Historical Data – FCAT Mathematics 63
21% 20% 18% 18%
16% 14% 13% 12% 12% 11% 11%
40% 38%
34% 33% 31%
27% 25%
23% 22% 20% 20%
55% 52%
48% 47% 44%
39% 37%
34% 33% 31% 30%
0%
10%
20%
30%
40%
50%
60%
70%
2001 2002 2003 2004 2005 2006 2007 2008 2009 2010 2011
White Hispanic African-American
FCAT Mathematics (2001-2010) and FCAT 2.0 Mathematics (2011) Achievement Level 1
Grades 6, 7, and 8

Proposed Rule Impact Data (by Subgroup) Mathematics
64
19% 19% 20% 19% 20% 19%
26% 25% 24% 22% 26% 24%
31% 30% 28% 27% 28% 28%
16% 16% 19% 21% 17% 18%
9% 10% 10% 11% 9% 11%
0%
10%
20%
30%
40%
50%
60%
70%
80%
90%
100%
Grade 3 Female Grade 3 Male Grade 4 Female Grade 4 Male Grade 5 Female Grade 5 Male
Perc
ent
Group
Grades 3, 4, and 5 Mathematics AL Percentages
Level 5 Level 4 Level 3 Level 2 Level 1
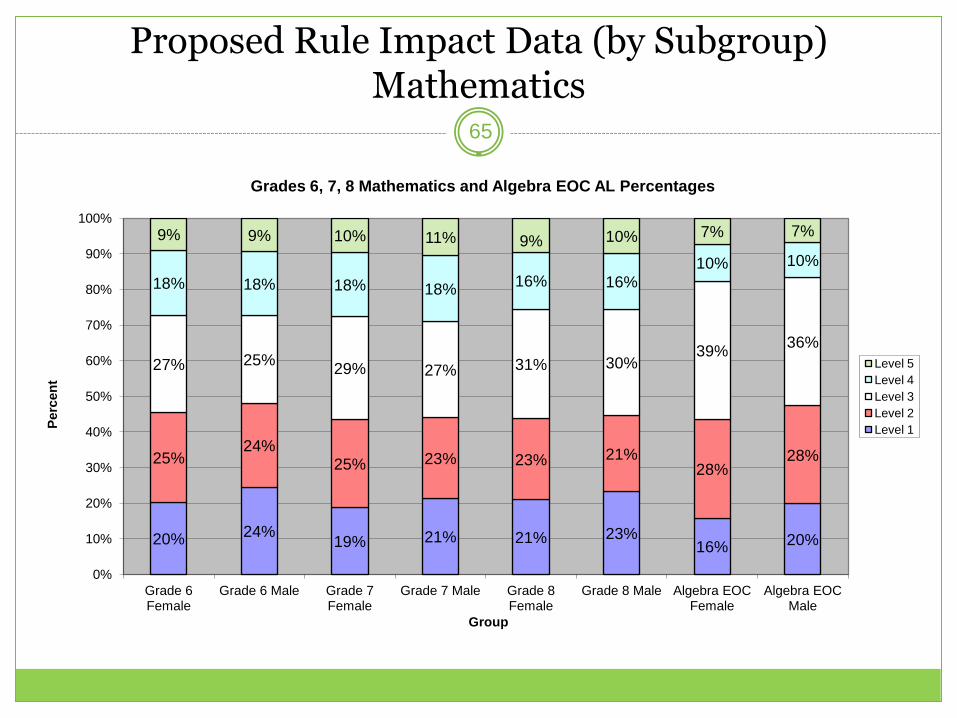
Proposed Rule Impact Data (by Subgroup) Mathematics
65
20% 24% 19% 21% 21% 23% 16% 20%
25% 24%
25% 23% 23% 21% 28%
28%
27% 25% 29% 27% 31% 30% 39% 36%
18% 18% 18% 18% 16% 16% 10% 10%
9% 9% 10% 11% 9% 10% 7% 7%
0%
10%
20%
30%
40%
50%
60%
70%
80%
90%
100%
Grade 6 Female
Grade 6 Male Grade 7 Female
Grade 7 Male Grade 8 Female
Grade 8 Male Algebra EOC Female
Algebra EOC Male
Perc
ent
Group
Grades 6, 7, 8 Mathematics and Algebra EOC AL Percentages
Level 5 Level 4 Level 3 Level 2 Level 1

Proposed Rule Impact Data (by Subgroup) Mathematics
66

Proposed Rule Impact Data (by Subgroup) Mathematics
67
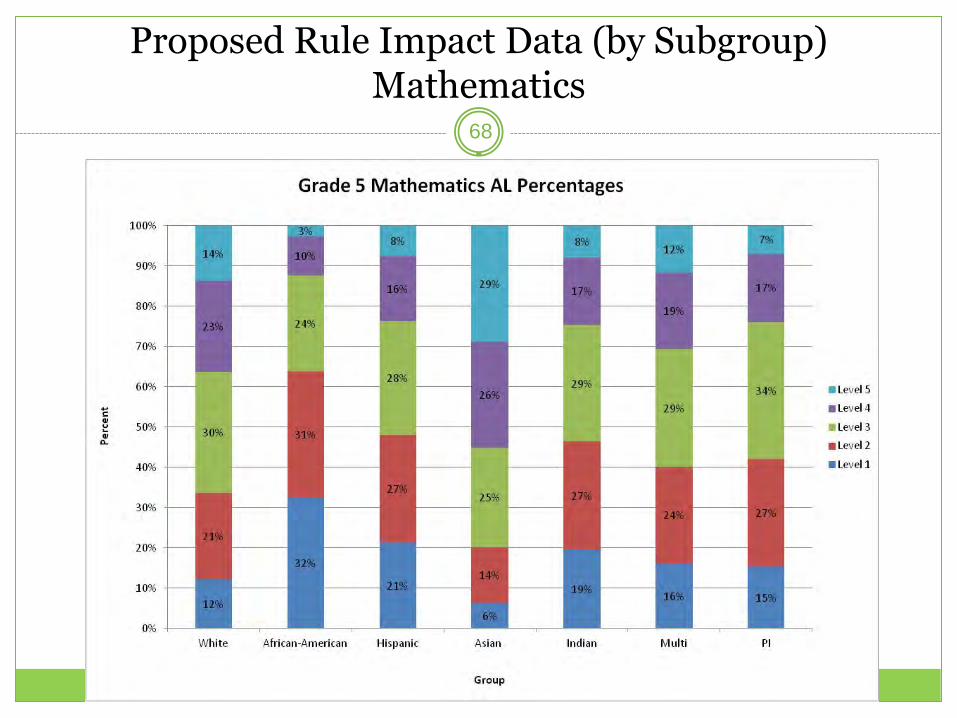
Proposed Rule Impact Data (by Subgroup) Mathematics
68

Proposed Rule Impact Data (by Subgroup) Mathematics
69

Proposed Rule Impact Data (by Subgroup) Mathematics
70

Proposed Rule Impact Data (by Subgroup) Mathematics
71

Proposed Rule Impact Data (by Subgroup) Mathematics
72

Setting Standards is a Multi-Stage Process
Achievement Level Descriptions Educator Panel Reactor Panel
Commissioner’s Recommendations Public Input State Board of
Education
73

Standard-Setting Timeline 74
Month/Year Task
August 2011 Advertise Intent to Revise FCAT Rule
September 19-23, 2011 Conduct Standard-Setting Meetings – Orlando, FL 15-20 Educators per Subject/Grade (15 panels)
September 29-30, 2011 Conduct Reactor Panel Meeting – Tallahassee, FL 20-25 Superintendents and Community Leaders (1 panel)
October 2011 Conduct Rule-Development Workshops and Advertise Proposed State Board of Education FCAT Rule
December 2011 State Board of Education Rule Adoption – New Achievement Levels for FCAT 2.0 Reading, Mathematics, and Algebra 1 EOC Assessment

Your turn to provide input… 75
For each grade and subject: Review recommendations and impact data Reflect Provide input on the proposed cut scores. Options…
Higher – Move the cut score higher to increase expectations (fewer students classified as proficient)
No Change – Maintain proposed cut scores Lower – Move the cut score lower to lower expectations (more
students classified as proficient)
Provide written comments as desired