fccc/web/agi/2016 distr.: general - unfccc.intunfccc.int/resource/webdocs/agi/2016.pdf · 12 . 2....
TRANSCRIPT

Aggregate information on greenhouse gas emissions by sources and removals by sinks for Parties included in Annex I to the Convention
Note by the secretariat
Contents
Paragraphs Page
I. Mandate .......................................................................................................... 1–3 2
II. Comparison of greenhouse gas inventory information ................................... 4–23 2
A. Approach ................................................................................................ 4–12 2
B. Explanatory notes to the tables ............................................................... 13–23 3
C. List of sectoral figures and tables with information submitted under
decision 24/CP.19 ................................................................................... 6
D. List of tables with information submitted under Article 7,
paragraph 1, of the Kyoto Protocol in accordance with decisions
15/CMP.1, in conjuction with 3/CMP.11, and 6/CMP.9 ........................ 8
SECTORAL TABLES .......................................................................................... 10
General ................................................................................................................ 10
1. Energy ............................................................................................................. 14
2. Industrial processes and product use ............................................................... 31
3. Agriculture ...................................................................................................... 36
4. Land use, land-use change and forestry .......................................................... 41
5. Waste .............................................................................................................. 47
6. Supplementary information for LULUCF activities under the Kyoto Protocol 50
United Nations FCCC/WEB/AGI/2016
Distr.: General
4 August 2016
English only

FCCC/WEB/AGI/2016
I. Mandate
1. The Conference of the Parties (COP), by its decision 13/CP.20, adopted the revised
guidelines for the technical review of greenhouse gas (GHG) inventories from Parties
included in Annex I to the Convention (Annex I Parties).1 As part of the process for the
technical review of GHG inventories, the COP requested the secretariat to compile and
tabulate aggregate information on greenhouse gas emissions by sources and removals by
sinks and trends from the latest available GHG inventory submissions of Annex I Parties
and publish this information in a stand-alone document.2
2. Pursuant to decision 4/CMP.11, the initial check and the scope of the individual
review shall be conducted consistent with the initial assessment and apply the relevant
provisions for the review contained in decision 13/CP.20.
3. The COP, by its decision 24/CP.19, adopted the revised “Guidelines for the
preparation of national communications by Parties included in Annex I to the Convention,
Part I: UNFCCC reporting guidelines on annual inventories” (hereinafter referred to as the
UNFCCC reporting guidelines)3 and a revised set of common reporting format (CRF)
tables4 to be used by Annex I Parties to report quantitative GHG inventory data. Similarly,
the Conference of the Parties serving as the meeting of the Parties to the Kyoto Protocol
(CMP), by decision 6/CMP.9, adopted the revised CRF tables5 that Parties shall use for
reporting information on anthropogenic greenhouse gas emissions by sources and removals
by sinks from land use, land-use change and forestry (LULUCF) activities under Article 3,
paragraphs 3 and 4, of the Kyoto Protocol in the second commitment period.
II. Comparison of greenhouse gas inventory information
A. Approach
4. This document contains GHG inventory information compiled in tabular format.
The tables provide information on emissions by sources and removals by sinks, implied
emission factors (IEFs), and activity data (AD) reported by Annex I Parties. In addition the
tables contain information on the methods and emission factors used, activity data from
international sources and other information relating to GHG inventory estimates. This
information is provided for both the base year/period and for the year 2014.
5. Where it has been submitted by Annex I Parties listed in annex B to the Kyoto
Protocol, pages 50–73 of this document also contain inventory information on
anthropogenic GHG emissions by sources and removals by sinks from LULUCF activities
under Article 3, paragraph 3, forest management under Article 3, paragraph 4, and any
elected activities under Article 3, paragraph 4, of the Kyoto Protocol, reported in
accordance with decision 15/CMP.1, in conjuction with decision 3/CMP.11.
6. The information provided in this document is based on information in the CRF
tables of the 2016 national GHG inventories submission, received from Parties as at 29
June 2016. It does not cover information contained in inventory submissions from previous
years.
1 The full text of the guidelines is contained in the annex to decision 13/CP.20.
2 Decision 13/CP.20, paragraph 8.
3 The full text of the guidelines is contained in annex I to decision 24/CP.19.
4 The tables, agreed in decision 24/CP.19, can be accessed here: <http://unfccc.int/5333.php>.
5 The tables, agreed in decision 6/CMP.9, can be accessed here: <http://unfccc.int/7969.php>.
2

FCCC/WEB/AGI/2016
7. The inventory data is presented according to the sectors, subsectors and categories
specified in the CRF tables.
8. Further to decision 13/CP.20, decisions 20/CP.21 and 10/CMP.11 noted that the
CRF reporter was still not functioning. As such, at the time of the publication of this
document, not all Parties had submitted their 2016 GHG inventories. As the submission
process is ongoing, the data presented here may, therefore, not reflect the latest information
provided by Parties. The latest GHG inventory data are available on the UNFCCC website.6
9. As at 29 June 2016, 43 Parties had submitted their CRF tables, including
Kazakhstan, which is an Annex I Party for the purposes of the Kyoto Protocol, while
remaining a Party not included in Annex I to the Convention for the purposes of the
Convention.
10. Three Parties, Denmark, the European Union (EU) and France, provided more than
one set of CRF tables in order to address the different geographical areas used for reporting
under the Convention and for reporting under the Kyoto Protocol. For the purposes of the
this document, the following naming conventions are used to indentify inventory
submissions under the Convention: Denmark (Convention), covering the Kingdom of
Denmark (Denmark mainland, Greenland and Faroe Islands); European Union
(Convention), covering its 28 member States; and France (Convention) covering
metropolitan France, the French Overseas Departments, the French Overseas Collectivities
and New Caledonia. The following naming conventions are used to identify inventory
submissions under the Kyoto Protocol: Denmark (KP), covering Denmark mainland;
European Union (KP), covering its 28 member states and Iceland; and France (KP),
covering metropolitan France and the French Overseas Departments (including Mayotte).
11. In order to streamline the aggregate GHG information the 12th meeting of the Lead
Reviewers (LRs) recommended deleting tables with limited relevance.7 The information in
this document is based on the recommendation of the 13th meeting of the LRs8 to
provisionally implement the streamlining proposal of the secretariat in 2016.
12. The information contained in this report is not intended as a judgment of whether
inventory problems exist, but as an indication of potential issues that need to be considered
further during the individual review by the expert review team.
B. Explanatory notes to the tables
13. Blank cells in a table indicate that a Party did not report information for a given
category, gas, AD or other parameter. Where a Party’s value is very small compared with
that of other Parties, it has been rounded to zero (0.0 or 0.00). Where a Party reports a zero
numerical value, a zero value (0) is shown.
6 <http://unfccc.int/national_reports/annex_i_ghg_inventories/national_inventories_submissions/items/
9492.php>.
7 See paragraph 15 of the draft conclusions of the 12th meeting of the inventory lead reviewers;
available at
<http://unfccc.int/files/national_reports/annex_i_ghg_inventories/application/pdf/draftconclusions_m
da_ghg_inventory.pdf>.
8 See paragraph 17 of the draft conclusions of the 13th meeting of the inventory lead reviewers;
available at
<http://unfccc.int/files/national_reports/annex_i_ghg_inventories/review_process/application/pdf/draf
t_conclusions_lrs_13th_v01_4march2016_incl_location_asr.pdf>.
3

FCCC/WEB/AGI/2016
14. In tables where shares or contributions of categories, gases, AD or other parameters
to a total are shown (e.g. contribution of specific fuel type to the total emissions of a
combustion category), where a Party reports a notation key, zero value (0) or blank in either
the numerator or denominator of the calculation, the share or contribution to the total is
shown using the symbol “–”.
15. The differences in AD between the values reported by Parties and international data
sources were calculated as percentage deviations from the AD provided by the Party. A
positive number indicates that the data from the international data source are higher than
the data reported by the Party. Similarly, a negative number indicates that data from the
international data source are lower than the data reported by the Party.
16. References to the base year refer to 1990, except for the following Parties with
economies in transition which, in accordance with decisions 9/CP.2 and 11/CP.4, use base
years other than 1990: Bulgaria (1988), Hungary (average 1985–1987), Poland (1988),
Romania (1989) and Slovenia (1986).
17. The column “Share of national total” in the tables indicates the contribution of that
category to the Party’s national total of GHG emissions in terms of carbon dioxide
equivalent, without emissions and removals from LULUCF including indirect CO2
emissions where reported.
18. Where Parties used notation keys “NO”, “NE”, “NA”, “IE” or “C”, these have been
reproduced verbatim from the CRF tables provided by Parties. The notation keys, as
described in the UNFCCC reporting guidelines, are as follows:
NO Not occurring IE Included elsewhere
NE Not estimated C Confidential
NA Not applicable
19. Where Parties used notation keys “R”, “NO”, “NR” or “IE”, these have been
reproduced verbatim from the tables provided by Parties. The notations keys, as described
in the tables referred to in decision 6/CMP.9, are as follows:
R Reported NR Not reported
NO Not occurring IE Included elsewhere
20. Tables on energy indicate whether IEFs given in the CRF are based on gross
calorific value (GCV) or net calorific value (NCV). Australia, Canada, Japan, New Zealand
and United States of America reported energy data on a GCV basis, whilst Denmark
reported using a combination of GCV and NCV. Hence, reported IEFs are about 5 per cent
lower for liquid, solid and other fuels, and about 10 per cent lower for gaseous fuels than
would have been the case if the data were given on a net calorific calue (NCV) basis.
21. The following chemical formulae or abbreviations for GHGs are used in this
document:
C carbon
CH4 methane
CO2 carbon dioxide
HFCs hydrofluorocarbons
N2O nitrous oxide
NF3 nitrogen trifluoride
NMVOC non-methane volatile organic compound
4

FCCC/WEB/AGI/2016
PFCs perfluorocarbons
SF6 sulphur hexafluoride
22. To indicate the methods and emission factors used by Parties, the following
abbreviations have been used (see also footnotes to Summary table 3 of the CRF) in this
document:
Methods: Emission factors:
D IPCC default D IPCC default
RA Reference approach CR CORINAIR
T1 IPCC tier 1 CS Country specific
T1a, T1b, T1c IPCC tier 1a, tier 1b and PS Plant specific
tier 1c, respectively M Model
T2 IPCC tier 2 OTH Other
T3 IPCC tier 3
CR CORINAIR
CS Country specific
M Model
OTH Other
23. The following units have been used in this document:
kg kilogram (103 grams)
kt kilotonne (109 grams)
Mg megagram (106 grams) – same as tonne
t tonne (106 grams)
Mt megatonne (1012 grams)
TJ terajoule (1012 joules)
PJ petajoule (1015 joules)
km kilometre
ha hectare
kha thousand hectares
m3 cubic metre
AB area burned
AD activity data
BB biomass burned
CO carbon monoxide
CRF common reporting format
CSC carbon stock change
dm dry matter
5
FCCC/WEB/AGI/2016
DOM dead organic matter
EF emission factor
FAO Food and Agriculture Organization of the United Nations
GCV gross calorific value
GHG greenhouse gas
IEA International Energy Agency
IEF implied emission factor
LPG liquefied petroleum gas
LULUCF land use, land-use change and forestry
N nitrogen
NCV net calorific value
NIR national inventory report
NMVOC non-methane volatile organic compounds
NOX nitrogen oxides
yr year
C. List of sectoral figures and tables with information submitted under
decision 24/CP.19
1. General
Figure number Figure name
Figure G.1 GHG emissions by gas (with LULUCF): base year and 2014
Figure G.2 GHG emissions by gas (without LULUCF): base year and 2014
Figure G.3 GHG emissions by sector (without LULUCF): base year and 2014
Table number Table name
Table G.1 Submissions used in this report
2. Energy
Figure number Figure name
Figure 1.1 Contribution of subsectors to total GHG emissions in the Energy
sector
Table number Table name
Table 1.1 CO2 emissions from fuel combustion: reference approach and sectoral
approach
Table 1.2 Stationary combustion: liquid fuels – CO2 (2014)
Table 1.3 Stationary combustion: solid fuels – CO2 (2014)
Table 1.4 Stationary combustion: gaseous fuels – CO2 (2014)
Table 1.5 Stationary combustion: other fossil fuels – CO2 (2014)
6

FCCC/WEB/AGI/2016
Table 1.6 Road transportation – CO2, N2O (2014)
Table 1.7 Domestic aviation and navigation – CO2 (2014)
Table 1.8 Domestic and international aviation – activity data (2014)
Table 1.9 Domestic and international navigation – activity data (2014)
Table 1.10 Fugitive emissions from fuels: coal mining and handling – CH4 (2014)
Table 1.11a Fugitive emissions from fuels: oil and natural gas – CH4, CO2 (2014)
Table 1.11b Fugitive emissions from fuels: oil and natural gas – oil – CH4, CO2
(2014)
Table 1.11c Fugitive emissions from fuels: oil and natural gas – natural gas – CH4,
CO2 (2014)
Table 1.11d Fugitive emissions from fuels: oil and natural gas – venting and
flaring – CH4, CO2 (2014)
Table 1.12 CO2 transport and storage (2014)
3. Industrial processes and product use
Figure number Figure name
Figure 2.1 Contribution of subsectors to total GHG emissions in the Industrial
processes and product use sector
Table number Table name
Table 2.1 Mineral industry – CO2 (2014)
Table 2.2 Chemical industry – CO2 and N2O (2014)
Table 2.3 Metal industry – CO2 (2014)
Table 2.4 HFCs, PFCs, SF6 and NF3 (2014)
4. Agriculture
Figure number Figure name
Figure 3.1 Contribution of subsectors to total GHG emissions in the Agriculture
sector
Table number Table name
Table 3.1 Enteric fermentation – CH4 (2014)
Table 3.2 Manure management – CH4 (2014)
Table 3.3 Manure management – N2O (2014)
Table 3.4 Agricultural soils – N2O (2014)
5. Land use, land-use change and forestry
Table number Table name
Table 4.1a–b Methods and emission factors used (2014)
Table 4.2 Forest land – AD, IEFs, carbon stock changes in pools and net CO2
emissions/removals (2014)
Table 4.3 Cropland – AD, IEFs, carbon stock changes in pools and net CO2
emissions/removals (2014)
7
FCCC/WEB/AGI/2016
Table 4.4 Grassland – AD, IEFs, carbon stock changes in pools and net CO2
emissions/removals (2014)
Table 4.5 Land area (2014)
6. Waste
Figure number Figure name
Figure 5.1 Contribution of subsectors to total GHG emissions in the Waste sector
Table number Table name
Table 5.1a–b Solid waste disposal on land, biological treatment of solid waste,
incineration and open burning of waste and wastewater treatment and
discharge (2014)
D. List of tables with information submitted under Article 7, paragraph 1,
of the Kyoto Protocol in accordance with decisions 15/CMP.1, in
conjuction with 3/CMP.11, and 6/CMP.9
Supplementary information for land use, land-use change and forestry activities
under the Kyoto Protocol
Table number Table name
Table 6.1 Selected values (forest parameters), elected activities under Article
3.4, accounting period, forest management cap
Table 6.2(a)-(d) Activity coverage in the reporting of information relating to activities
under Article 3, paragraph 3, forest management under Article 3.4,
and elected activities under Article 3.4
Table 6.3(a) Afforestation and reforestation - area and implied carbon stock change
factors from the change in carbon stocks for 2014
Table 6.3(b) Deforestation - area and implied carbon stock change factors from the
change in carbon stocks for 2014
Table 6.3(c) Forest management - area and implied carbon stock change factors
from the change in carbon stocks for 2014
Table 6.3(d) Cropland management - area and implied carbon stock change factors
from the change in carbon stocks for 2014
Table 6.3(e) Cropland management - area and implied carbon stock change factors
from the change in carbon stocks for the base year
Table 6.3(f) Grazing land management - area and implied carbon stock change
factors from the change in carbon stocks for 2014
Table 6.3(g) Grazing land management - area and implied carbon stock change
factors from the change in carbon stocks for the base year
Table 6.3(h) Revegetation - area and implied carbon stock change factors from the
change in carbon stocks for 2014
Table 6.3(i) Revegetation - area and implied carbon stock change factors from the
change in carbon stocks for the base year
Table 6.3(j) Wetland drainage and rewetting - area and implied carbon stock
change factors from the change in carbon stocks for 2014
8

FCCC/WEB/AGI/2016
Table 6.3(k) Wetland drainage and rewetting - area and implied carbon stock
change factors from the change in carbon stocks for the base year
Table 6.4 Direct and indirect N2O emissions from N fertilization for 2014
Table 6.5 CH4 and N2O emissions from drained and rewetted organic soils for
2014
Table 6.6 N2O emissions from N mineralization/immobilization due to carbon
loss/gain associated with land-use conversions and management
change in mineral soils for 2014
Table 6.7(a) Emissions from biomass burning 2014
Table 6.7(b) Emissions from biomass burning on cropland management land
Table 6.7(c) Emissions from biomass burning on grazing land management land
Table 6.7(d) Emissions from biomass burning on revegetation land
Table 6.7(e) Emissions from biomass burning on wetland drainage and rewetting
land
9

Figure G.1
GHG emissions by gasa (with LULUCF): base year
b and 2014
b In accordance with the UNFCCC reporting guidelines on annual inventories of Annex I Parties the year 1990 should be the base year for the estimation and reporting of inventories. However, in accordance with decisions 9/CP.2, 11/CP.4, and 7/CP.12 some Parties with economies in transition use
base years other than 1990: Bulgaria (1988), Croatia (1990), Hungary (average of 1985 to 1987), Poland (1988), Romania (1989) and Slovenia (1986).
a The national totals and emissions by CO2 in this graph include indirect CO2 emissions from the atmospheric oxidation of CH4, CO and NMVOCs for the following Parties: Canada, Czech Republic, Denmark (KP), Denmark (Convention), European Union (KP), European Union (Convention),
Finland, France (KP), France (Convention), Ireland, Latvia, Netherlands, Portugal and Switzerland.
-40%
-20%
0%
20%
40%
60%
80%
100%
Aust
rali
a B
ase
yea
r
Aust
rali
a 20
14
Aust
ria
Bas
e y
ear
Aust
ria
20
14
Bel
aru
s B
ase
yea
r
Bel
aru
s 2
014
Bel
giu
m B
ase
yea
r
Bel
giu
m 2
014
Bu
lgar
ia B
ase
yea
r
Bu
lgar
ia 2
014
Can
ada
Bas
e yea
r
Can
ada
201
4
Cro
atia
Bas
e y
ear
Cro
atia
20
14
Cy
pru
s B
ase
yea
r
Cy
pru
s 2
014
Cze
ch R
epubli
c B
ase
yea
r
Cze
ch R
epubli
c 201
4
Den
mar
k (
KP
) B
ase
yea
r
Den
mar
k (
KP
) 2
01
4
Den
mar
k (
Co
nven
tio
n)
Bas
e y
ear
Den
mar
k (
Co
nven
tio
n)
20
14
Est
onia
Bas
e yea
r
Est
onia
201
4
Euro
pea
n U
nio
n (
KP
) B
ase
yea
r
Euro
pea
n U
nio
n (
KP
) 201
4
Euro
pea
n U
nio
n (
Con
ven
tion
) B
ase
yea
r
Euro
pea
n U
nio
n (
Con
ven
tion
) 201
4
Fin
land
Bas
e yea
r
Fin
land
2014
Fra
nce
(K
P)
Bas
e yea
r
Fra
nce
(K
P)
2014
Fra
nce
(C
onv
enti
on)
Bas
e yea
r
Fra
nce
(C
onv
enti
on)
2014
Ger
man
y B
ase
yea
r
Ger
man
y 2
01
4
Gre
ece
Bas
e yea
r
Gre
ece
2014
Hun
gar
y B
ase
yea
r
Hun
gar
y 2
014
Icel
and B
ase
yea
r
Icel
and 2
014
Irel
and
Bas
e yea
r
Irel
and
2014
Ital
y B
ase
yea
r
Ital
y 2
014
Japan
Bas
e yea
r
Japan
20
14
Kaz
akh
stan
Bas
e yea
r
Kaz
akh
stan
201
4
Lat
via
Bas
e y
ear
Lat
via
20
14
Lie
chte
nst
ein B
ase
yea
r
Lie
chte
nst
ein
20
14
Lit
huan
ia B
ase
yea
r
Lit
huan
ia 2
014
Luxem
bo
urg
Bas
e y
ear
Luxem
bo
urg
20
14
Mal
ta B
ase
yea
r
Mal
ta 2
014
Mo
nac
o B
ase
yea
r
Mo
nac
o 2
014
Net
her
lands
Bas
e yea
r
Net
her
lands
201
4
New
Zea
land B
ase
yea
r
New
Zea
land 2
014
Norw
ay B
ase
yea
r
Norw
ay 2
014
Pola
nd B
ase
yea
r
Pola
nd 2
014
Port
ugal
Bas
e yea
r
Port
ugal
201
4
Ro
man
ia B
ase
yea
r
Ro
man
ia 2
014
Ru
ssia
n F
eder
atio
n B
ase
yea
r
Ru
ssia
n F
eder
atio
n 2
01
4
Slo
vak
ia B
ase
yea
r
Slo
vak
ia 2
014
Slo
ven
ia B
ase
yea
r
Slo
ven
ia 2
014
Spai
n B
ase
yea
r
Spai
n 2
01
4
Sw
eden
Bas
e yea
r
Sw
eden
201
4
Sw
itze
rlan
d B
ase
yea
r
Sw
itze
rlan
d 2
014
Turk
ey B
ase
yea
r
Turk
ey 2
014
Ukra
ine
Bas
e yea
r
Ukra
ine
2014
Unit
ed K
ingd
om
Bas
e yea
r
Unit
ed K
ingd
om
201
4
Unit
ed S
tate
s of
Am
eric
a B
ase
yea
r
Unit
ed S
tate
s of
Am
eric
a 2
014
Per
centa
ge
CO2 CH4 N2O F-gases
10

Figure G.2
GHG emissions by gasa (without LULUCF): base year
b and 2014
a The national totals and emissions by CO2 in this graph include indirect CO2 emissions from the atmospheric oxidation of CH4, CO and NMVOCs for the following Parties: Canada, Czech Republic, Denmark (KP), Denmark (Convention), European Union (KP), European Union
(Convention), Finland, France (KP), France (Convention), Ireland, Latvia, Netherlands, Portugal and Switzerland.b In accordance with the UNFCCC reporting guidelines on annual inventories of Annex I Parties the year 1990 should be the base year for the estimation and reporting of inventories. However, in accordance with decisions 9/CP.2, 11/CP.4, and 7/CP.12 some Parties with economies in
transition use base years other than 1990: Bulgaria (1988), Croatia (1990), Hungary (average of 1985 to 1987), Poland (1988), Romania (1989) and Slovenia (1986).
0%
10%
20%
30%
40%
50%
60%
70%
80%
90%
100%
Aust
rali
a B
ase
yea
r
Aust
rali
a 20
14
Aust
ria
Bas
e y
ear
Au
stri
a 2
014
Bel
aru
s B
ase
yea
r
Bel
aru
s 2
014
Bel
giu
m B
ase
yea
r
Bel
giu
m 2
014
Bu
lgar
ia B
ase
yea
r
Bu
lgar
ia 2
014
Can
ada
Bas
e yea
r
Can
ada
201
4
Cro
atia
Bas
e y
ear
Cro
atia
20
14
Cy
pru
s B
ase
yea
r
Cy
pru
s 2
014
Cze
ch R
epubli
c B
ase
yea
r
Cze
ch R
epubli
c 201
4
Den
mar
k (
KP
) B
ase
yea
r
Den
mar
k (
KP
) 20
14
Den
mar
k (
Co
nven
tio
n)
Bas
e y
ear
Den
mar
k (
Co
nven
tio
n)
20
14
Est
onia
Bas
e yea
r
Est
onia
201
4
Euro
pea
n U
nio
n (
KP
) B
ase
yea
r
Euro
pea
n U
nio
n (
KP
) 201
4
Euro
pea
n U
nio
n (
Con
ven
tion
)…
Euro
pea
n U
nio
n (
Con
ven
tion
) 201
4
Fin
land
Bas
e yea
r
Fin
land
2014
Fra
nce
(K
P)
Bas
e yea
r
Fra
nce
(K
P)
2014
Fra
nce
(C
onv
enti
on)
Bas
e yea
r
Fra
nce
(C
onv
enti
on)
2014
Ger
man
y B
ase
yea
r
Ger
man
y 2
01
4
Gre
ece
Bas
e yea
r
Gre
ece
2014
Hu
ng
ary B
ase
yea
r
Hun
gar
y 2
014
Icel
and B
ase
yea
r
Icel
and 2
014
Irel
and
Bas
e yea
r
Irel
and
2014
Ital
y B
ase
yea
r
Ital
y 2
014
Japan
Bas
e yea
r
Japan
2014
Kaz
akh
stan
Bas
e yea
r
Kaz
akh
stan
201
4
Lat
via
Bas
e y
ear
Lat
via
20
14
Lie
chte
nst
ein B
ase
yea
r
Lie
chte
nst
ein 2
014
Lit
huan
ia B
ase
yea
r
Lit
huan
ia 2
014
Luxem
bo
urg
Bas
e y
ear
Luxem
bo
urg
20
14
Mal
ta B
ase
yea
r
Mal
ta 2
014
Mo
nac
o B
ase
yea
r
Mo
nac
o 2
014
Net
her
lands
Bas
e yea
r
Net
her
lands
201
4
New
Zea
lan
d B
ase
yea
r
New
Zea
land 2
014
Norw
ay B
ase
yea
r
No
rway
20
14
Pola
nd B
ase
yea
r
Pola
nd 2
014
Port
ugal
Bas
e yea
r
Port
ugal
201
4
Ro
man
ia B
ase
yea
r
Ro
man
ia 2
014
Ru
ssia
n F
eder
atio
n B
ase
yea
r
Ru
ssia
n F
eder
atio
n 2
01
4
Slo
vak
ia B
ase
yea
r
Slo
vak
ia 2
014
Slo
ven
ia B
ase
yea
r
Slo
ven
ia 2
014
Spai
n B
ase
yea
r
Spai
n 2
01
4
Sw
eden
Bas
e y
ear
Sw
eden
201
4
Sw
itze
rlan
d B
ase
yea
r
Sw
itze
rlan
d 2
014
Turk
ey B
ase
yea
r
Turk
ey 2
014
Ukra
ine
Bas
e yea
r
Ukra
ine
2014
Unit
ed K
ingd
om
Bas
e yea
r
Unit
ed K
ingd
om
201
4
Unit
ed S
tate
s of
Am
eric
a B
ase
yea
r
Unit
ed S
tate
s of
Am
eric
a 2
014
Percen
tage
CO2 CH4 N2O F-gases
11

Figure G.3
GHG emissionsa by sector (without LULUCF): base year
b and 2014
a The national and sectoral totals in this graph include indirect CO2 emissions from the atmospheric oxidation of CH4, CO and NMVOCs for the following Parties: Czech Republic, Denmark (KP), Denmark (Convention), European Union (KP), European Union (Convention), Finland, France (KP), France (Convention), Ireland, Latvia, Netherlands,
Portugal and Switzerland.b In accordance with the UNFCCC reporting guidelines on annual inventories of Annex I Parties the year 1990 should be the base year for the estimation and reporting of inventories. However, in accordance with decisions 9/CP.2, 11/CP.4, and 7/CP.12 some Parties with economies in transition use base years other than 1990: Bulgaria (1988), Croatia
(1990), Hungary (average of 1985 to 1987), Poland (1988), Romania (1989) and Slovenia (1986).
0%
10%
20%
30%
40%
50%
60%
70%
80%
90%
100%
A
ust
rali
a B
ase
yea
r
A
ust
rali
a 2
01
4
A
ust
ria
Bas
e yea
r
A
ust
ria
20
14
B
elar
us
Bas
e y
ear
B
elar
us
201
4
B
elg
ium
B
ase
yea
r
B
elg
ium
2
01
4
B
ulg
aria
B
ase
yea
r
B
ulg
aria
2014
C
anad
a B
ase
yea
r
C
anad
a 2
01
4
C
roat
ia B
ase
yea
r
C
roat
ia 20
14
C
yp
rus
Bas
e y
ear
C
ypru
s 2
014
C
zech
Rep
ubli
c B
ase
yea
r
C
zech
Rep
ubli
c 2
014
D
enm
ark (
KP
) B
ase
yea
r
D
enm
ark (
KP
) 2
014
D
enm
ark (
Con
ven
tion
) B
ase
yea
r
D
enm
ark (
Conven
tion)
2014
E
stonia
B
ase
yea
r
E
ston
ia 20
14
E
uro
pea
n U
nio
n (
KP
) B
ase
yea
r
E
uro
pea
n U
nio
n (
KP
) 2
014
E
uro
pea
n U
nio
n (
Co
nv
enti
on
)…
E
uro
pea
n U
nio
n (
Co
nv
enti
on
)…
F
inla
nd B
ase
yea
r
F
inla
nd
2
01
4
F
rance
(K
P)
Bas
e y
ear
F
rance
(K
P)
20
14
F
rance
(C
on
ven
tion
) B
ase
yea
r
F
rance
(C
onven
tion)
2014
G
erm
any
B
ase
yea
r
G
erm
any 2014
G
reec
e B
ase
yea
r
G
reec
e 2
014
H
un
gar
y
Bas
e y
ear
H
ungar
y 2014
Ic
elan
d B
ase
yea
r
Ic
elan
d 2
01
4
Ir
elan
d B
ase
yea
r
Ir
elan
d 2014
It
aly
B
ase
yea
r
It
aly 2014
Ja
pan
B
ase
yea
r
Ja
pan
2
01
4
K
azak
hst
an B
ase
yea
r
K
azak
hst
an 2
01
4
L
atvia
B
ase
yea
r
L
atv
ia 20
14
L
iech
tenst
ein
B
ase
yea
r
L
iech
tenst
ein 2014
L
ithu
ania
B
ase
yea
r
L
ithuan
ia 2014
L
uxem
bo
urg
B
ase
yea
r
L
uxem
bourg
2014
M
alta
B
ase
yea
r
M
alta
20
14
M
onac
o B
ase
yea
r
M
on
aco
201
4
N
ether
lands
Bas
e yea
r
N
ether
lands
2014
N
ew Z
eala
nd B
ase
yea
r
N
ew Z
eala
nd
2
01
4
N
orw
ay B
ase
yea
r
N
orw
ay 2014
P
ola
nd
B
ase
yea
r
P
ola
nd
2
01
4
P
ort
ugal
B
ase
yea
r
P
ort
ug
al
20
14
R
om
ania
B
ase
yea
r
R
om
ania
20
14
R
uss
ian F
eder
atio
n B
ase
yea
r
R
uss
ian F
eder
atio
n 2014
S
lov
akia
B
ase
yea
r
S
lovak
ia 2014
S
lov
enia
B
ase
yea
r
S
loven
ia 2014
S
pai
n B
ase
yea
r
S
pai
n 2014
S
wed
en
Bas
e yea
r
S
wed
en 2014
S
wit
zerl
and
B
ase
yea
r
S
wit
zerl
and 2014
T
urk
ey B
ase
yea
r
T
urk
ey
201
4
U
kra
ine
Bas
e yea
r
U
kra
ine
20
14
U
nit
ed K
ing
do
m B
ase
yea
r
U
nit
ed K
ingdom
2014
U
nit
ed S
tate
s of
Am
eric
a B
ase…
U
nit
ed S
tate
s of
Am
eric
a 2
01
4
Per
cen
tage
Energy Industrial processes and product use Agriculture Waste Other
12

Table G.1
Submissions used in this report
Party Initial submission
date
CRF for years NIR CRF submission date and
version used in this report
CRF Reporter version
(version used in this report)CRF KP LULUCF
a submission
date and version used in this report
CRF KP LULUCF a
Reporter
version (version used in this report)
Australia 27 May 2016 1990-2014 27 May 2016 27 May 2016 (1) 5.14 27 May 2016 (1) 5.14
Austria 14 April 2016 1990-2014 14 April 2016 15 June 2016 (3) 5.14 15 June 2016 (3) 5.14
Belarus 10 June 2016 1990-2014 10 June 2016 10 June 2016 (9) 5.14 NA NA
Belgium 15 April 2016 1990-2014 15 April 2016 15 June 2016 (3) 5.14 15 June 2016 (3) 5.14
Bulgaria 15 April 2016 1988-2014 15 April 2016 27 May 2016 (1) 5.14 27 May 2016 (1) 5.14
Canada 14 April 2016 1990-2014 14 April 2016 14 April 2016 (1) 5.12 NA NA
Croatia 15 April 2016 1990-2014 15 April 2016 15 June 2016 (3) 5.14 15 June 2016 (3) 5.14
Cyprus 13 April 2016 1990-2014 13 April 2016 15 June 2016 (12) 5.14 15 June 2016 (12) 5.14
Czech Republic 15 April 2016 1990-2014 15 April 2016 15 June 2016 (2) 5.14 15 June 2016 (2) 5.14
Denmark (KP) 15 June 2016 1990-2014 15 June 2016
(submission 2)
15 June 2016 (1) 5.14 15 June 2016 (1) 5.14
Denmark (Convention) 15 April 2016 1990-2014 15 April 2016
(submission 1)
15 June 2016 (1) 5.14 NA NA
Estonia 15 April 2016 1990-2014 15 April 2016 15 June 2016 (2) 5.14 15 June 2016 (2) 5.14
European Union (KP) 27 June 2016 1990-2014 21 June 2016 27 June 2016 (3) 5.14 27 June 2016 (3) 5.14
European Union (Convention) 15 April 2016 1990-2014 15 April 2016
(submission 1)
27 June 2016 (2) 5.14 NA NA
Finland 15 April 2016 1990-2014 15 April 2016 15 April 2016 (7) 5.14 15 April 2016 (7) 5.14
France (KP) 15 April 2016 1990-2014 14 April 2016 15 June 2016 (7) 5.14 15 June 2016 (7) 5.14
France (Convention) 15 April 2016 1990-2014 14 April 2016 15 June 2016 (5) 5.14 NA NA
Germany 15 April 2016 1990-2014 15 April 2016 15 June 2016 (6) 5.14 15 June 2016 (6) 5.14
Greece 15 April 2016 1990-2014 25 April 2016 23 May 2016 (4) 5.14 23 May 2016 (4) 5.14
Hungary 15 April 2016 1985-1987, 1986-2014 15 April 2016 15 June 2016 (2) 5.14 15 June 2016 (2) 5.14
Iceland 15 April 2016 1990-2014 15 April 2016 6 May 2016 (2) 5.14 6 May 2016 (2) 5.14
Ireland 15 June 2016 1990-2014 15 June 2016 15 June 2016 (1) 5.14 15 June 2016 (1) 5.14
Italy 15 April 2016 1990-2014 15 April 2016 15 April 2016 (3) 5.14 15 April 2016 (3) 5.14
Japan 14 April 2016 1990-2014 14 April 2016 14 April 2016 (1) 5.12 14 April 2016 (1) 5.12
Kazakhstan 15 April 2016 1990-2014 4 May 2016 (3) 5.14 NA NA
Latvia 15 April 2016 1990-2014 15 April 2016 15 June 2016 (3) 5.14 15 June 2016 (3) 5.14
Liechtenstein 15 April 2016 1990-2014 27 May 2016 15 April 2016 (5) 5.14 15 April 2016 (5) 5.14
Lithuania 15 April 2016 1990-2014 15 April 2016 15 June 2016 (2) 5.14 15 June 2016 (2) 5.14
Luxembourg 15 April 2016 1990-2014 15 April 2016 15 June 2016 (4) 5.14 15 June 2016 (4) 5.14
Malta 14 April 2016 1990-2014 19 April 2016 14 April 2016 (7) 5.12
Monaco
Netherlands 15 April 2016 1990-2014 14 April 2016 15 June 2016 (5) 5.14 15 June 2016 (5) 5.14
New Zealand 20 May 2016 1990-2014 20 May 2016 20 May 2016 (1) 5.14 20 May 2016 (1) 5.14
Norway 15 April 2016 1990-2014 15 April 2016 15 April 2016 (2) 5.12 15 April 2016 (2) 5.12
Poland 15 April 2016 1988-2014 15 April 2016 23 May 2016 (1) 5.14 23 May 2016 (1) 5.14
Portugal 15 April 2016 1990-2014 15 April 2016 27 May 2016 (2) 5.14 27 May 2016 (2) 5.14
Romania 15 April 2016 1989-2014 15 April 2016 15 June 2016 (2) 5.14 15 June 2016 (2) 5.14
Russian Federation 15 April 2016 1990-2014 15 April 2016 (2) 5.14 15 April 2016 (2) 5.14
Slovakia 15 April 2016 1990-2014 15 April 2016 15 June 2016 (3) 5.14 15 June 2016 (3) 5.14
Slovenia 15 April 2016 1986-2014 15 April 2016 15 June 2016 (2) 5.14 15 June 2016 (2) 5.14
Spain 15 April 2016 1990-2014 15 April 2016 13 June 2016 (2) 5.14 13 June 2016 (2) 5.14
Sweden 15 aprill 2016 1990-2014 15 April 2016 15 June 2016 (3) 5.14 15 June 2016 (3) 5.14
Switzerland 15 April 2016 1990-2014 15 April 2016 15 April 2016 (1) 5.14 15 April 2016 (1) 5.14
Turkey 15 April 2016 1990-2014 15 April 2016 15 April 2016 (3) 5.14 NA NA
Ukraine 24 May 2016 1990-2014 24 May 2016 24 May 2016 (1) 5.14 24 May 2016 (1) 5.14
United Kingdom of Great Britain
and Northern Ireland
15 April 2016 1990-2014 15 April 2016 15 June 2016 (3) 5.14 15 June 2016 (3) 5.14
United States of America 15 April 2016 1990-2014 15 April 2016 15 April 2016 (2) 5.12 NA NA
13

Figure 1.1
Contribution of subsectors to total GHG emissions in the Energy sectora, b
a In accordance with the UNFCCC reporting guidelines on annual inventories of Annex I Parties the year 1990 should be the base year for the estimation and reporting of inventories. However, in accordance with decisions 9/CP.2, 11/CP.4, and 7/CP.12 some Parties
with economies in transition use base years other than 1990: Bulgaria (1988), Croatia (1990), Hungary (average of 1985 to 1987), Poland (1988), Romania (1989) and Slovenia (1986).b
Indirect CO2 emissions are excluded from the totals in this graph.
0%
10%
20%
30%
40%
50%
60%
70%
80%
90%
100%
Aust
rali
a B
ase
yea
r
Aust
rali
a 201
4
Aust
ria
Bas
e yea
r
Aust
ria
201
4
Bel
arus
Bas
e y
ear
Bel
arus
20
14
Bel
giu
m B
ase
yea
r
Bel
giu
m 2
014
Bulg
aria
Bas
e y
ear
Bulg
aria
20
14
Can
ada
Bas
e y
ear
Can
ada
2014
Cro
atia
Bas
e yea
r
Cro
atia
201
4
Cyp
rus
Bas
e y
ear
Cyp
rus
20
14
Cze
ch R
epu
bli
c B
ase
yea
r
Cze
ch R
epu
bli
c 2
014
Den
mar
k (
KP
) B
ase
yea
r
Den
mar
k (
KP
) 201
4
Den
mar
k (
Con
ven
tion
) B
ase
yea
r
Den
mar
k (
Con
ven
tion
) 201
4
Est
on
ia B
ase
yea
r
Est
on
ia 2
014
Eu
rop
ean U
nio
n (
KP
) B
ase
yea
r
Eu
rop
ean U
nio
n (
KP
) 2
014
Eu
rop
ean U
nio
n (
Conv
enti
on)…
Eu
rop
ean U
nio
n (
Conv
enti
on)
2014
Fin
land B
ase
yea
r
Fin
land 2
014
Fra
nce
(K
P)
Bas
e y
ear
Fra
nce
(K
P)
20
14
Fra
nce
(C
onven
tio
n)
Bas
e y
ear
Fra
nce
(C
onven
tio
n)
20
14
Ger
man
y B
ase
yea
r
Ger
man
y 2
014
Gre
ece
Bas
e y
ear
Gre
ece
20
14
Hung
ary B
ase
yea
r
Hung
ary 2
01
4
Ice
lan
d B
ase
yea
r
Ice
lan
d 2
01
4
Ire
land B
ase
yea
r
Ire
land 2
014
Ita
ly B
ase
yea
r
Ita
ly 2
01
4
Jap
an B
ase
yea
r
Jap
an 2
014
Kaz
akhst
an B
ase
yea
r
Kaz
akhst
an 2
014
Lat
via
Bas
e yea
r
Lat
via
201
4
Lie
chte
nst
ein B
ase
yea
r
Lie
chte
nst
ein 2
01
4
Lit
huan
ia B
ase
yea
r
Lit
huan
ia 2
014
Lu
xem
bou
rg B
ase
yea
r
Lu
xem
bou
rg 2
01
4
Mal
ta B
ase
yea
r
Mal
ta 2
014
Mon
aco B
ase
yea
r
Mon
aco 2
01
4
Net
her
lan
ds
Bas
e yea
r
Net
her
lan
ds
2014
New
Zea
lan
d B
ase
yea
r
New
Zea
lan
d 2
01
4
Norw
ay B
ase
yea
r
Norw
ay 2
014
Pola
nd B
ase
yea
r
Pola
nd 2
01
4
Port
ug
al B
ase
yea
r
Port
ug
al 2
014
Rom
ania
Bas
e y
ear
Rom
ania
20
14
Russ
ian F
eder
atio
n B
ase
yea
r
Russ
ian F
eder
atio
n 2
014
Slo
vak
ia B
ase
yea
r
Slo
vak
ia 2
01
4
Slo
ven
ia B
ase
yea
r
Slo
ven
ia 2
01
4
Spai
n B
ase
yea
r
Spai
n 2
014
Sw
eden
Bas
e yea
r
Sw
eden
2014
Sw
itze
rlan
d B
ase
yea
r
Sw
itze
rlan
d 2
01
4
Tu
rkey
Bas
e yea
r
Tu
rkey
20
14
Ukra
ine
Bas
e y
ear
Ukra
ine
20
14
Unit
ed K
ingdo
m B
ase
yea
r
Unit
ed K
ingdo
m 2
014
Unit
ed S
tate
s of
Am
eric
a B
ase
yea
r
Unit
ed S
tate
s of
Am
eric
a 20
14
Per
centa
ge
Stationary combustion Mobile combustion Fugitive emissions
14

Table 1.1
CO2 emissions from fuel combustion: reference approach and sectoral approacha
Reference
approach
Sectoral
approachDifference
(%)
Australia Base year 254 499 251 676 1.12
Australia 2014 360 881 362 266 –0.38
Austria Base year 51 988 51 202 1.54
Austria 2014 51 260 50 102 2.31
Belarus Base year 131 722 94 234 39.78
Belarus 2014 72 309 54 946 31.60
Belgium Base year 91 874 100 982 –9.02
Belgium 2014 76 986 80 569 –4.45
Bulgaria Base yearb 5 511 78 280 –92.96
Bulgaria 2014 3 437 41 478 –91.71
Canada Base year 414 606 417 649 –0.73
Canada 2014 519 196 518 853 0.07
Croatia Base yearb 20 188 20 079 0.54
Croatia 2014 15 131 15 032 0.66
Cyprus Base year 4 297 3 896 10.31
Cyprus 2014 5 861 5 883 –0.36
Czech Republic Base year 108 926 561 144 280 75 396.61
Czech Republic 2014 68 955 589 89 383 77 046.47
Denmark (KP) Base year 51 243 51 308 –0.13
Denmark (KP) 2014 35 228 35 786 –1.56
Denmark (Convention) Base year 51 873 52 051 –0.34
Denmark (Convention) 2014 35 753 35 738 0.04
Estonia Base year 37 223 35 647 4.42
Estonia 2014 18 004 18 420 –2.26
European Union (KP) Base year 4 051 109 4 094 617 –1.06
European Union (KP) 2014 3 169 340 3 188 264 –0.59
European Union (Convention) Base year 4 049 235 4 090 514 –1.01
European Union (Convention) 2014 3 167 335 3 184 073 –0.53
Finland Base year 53 068 52 533 1.02
Finland 2014 45 082 43 345 4.01
France (KP) Base year 372 089 364 312 2.13
France (KP) 2014 312 991 310 300 0.87
France (Convention) Base year 348 768 869 366 493 95 063.96
France (Convention) 2014 271 046 979 315 737 85 745.75
Germany Base year 991 048 985 705 0.54
Germany 2014 729 912 742 561 -1.70
Greece Base year 74 738 74 650 0.12
Greece 2014 71 760 73 294 -2.09
Hungary Base yearb 74 421 73 955 0.63
Hungary 2014 38 472 38 675 -0.53
Iceland Base year 1 731 600 1 634 105 889.14
Iceland 2014 1 482 407 1 436 103 114.07
Ireland Base year 30 763 30 140 2.07
Ireland 2014 34 487 34 426 0.18
Italy Base year 398 421 401 991 –0.89
Italy 2014 321 944 324 015 –0.64
Japan Base year 1 063 223 1 078 082 –1.38
Japan 2014 1 184 026 1 205 408 –1.77
Kazakhstan Base year 267 917 246 140 8.85
Kazakhstan 2014 224 419 228 359 –1.73
Latvia Base year 18 811 18 611 1.08
Latvia 2014 6 276 6 500 –3.44
Liechtenstein Base year 199 199 0.01
Liechtenstein 2014 162 161 0.08
Lithuania Base year 32 182 32 248 –0.21
Lithuania 2014 10 426 10 279 1.43
Luxembourg Base year 10 183 10 322 –1.35
Luxembourg 2014 9 137 9 280 –1.55
Malta Base year NA, NE, NO 1 855 –100.00
Malta 2014 2 369 2 480 –4.45
Monaco Base year
Monaco 2014
(kt CO2)
15

Table 1.1
CO2 emissions from fuel combustion: reference approach and sectoral approacha
Reference
approach
Sectoral
approachDifference
(%)(kt CO2)
Netherlands Base year 162 865 152 125 7.06
Netherlands 2014 158 934 149 190 6.53
New Zealand Base year 22 784 22 036 3.40
New Zealand 2014 30 059 29 853 0.69
Norway Base year 24 251 26 192 –7.41
Norway 2014 37 478 34 916 7.34
Poland Base yearb 470 800 439 016 7.24
Poland 2014 281 914 284 864 –1.04
Portugal Base year 39 859 39 918 –0.15
Portugal 2014 42 003 41 564 1.06
Romania Base yearb 182 944 178 531 2.47
Romania 2014 62 298 63 312 –1.60
Russian Federation Base year 2 363 320 2 265 874 4.30
Russian Federation 2014 1 403 968 1 417 173 –0.93
Slovakia Base year 53 458 53 353 0.20
Slovakia 2014 25 352 25 147 0.81
Slovenia Base yearb 15 246 15 410 –1.06
Slovenia 2014 12 626 12 600 0.20
Spain Base year 205 517 204 792 0.35
Spain 2014 225 039 229 452 –1.92
Sweden Base year 49 414 51 524 –4.09
Sweden 2014 40 350 37 242 8.35
Switzerland Base year 41 122 40 881 0.59
Switzerland 2014 37 188 36 927 0.71
Turkey Base year 147 134 588 124 376 118 197.86
Turkey 2014 260 376 690 325 325 79 935.84
Ukraine Base year 587 673 577 612 1.74
Ukraine 2014 190 701 191 473 –0.40
United Kingdom of Great Britain and Northern
Ireland Base year
548 444 560 930 –2.23
United Kingdom of Great Britain and Northern
Ireland 2014
402 023 411 872 –2.39
United States of America Base year 4 792 767 4 866 757 –1.52
United States of America 2014 5 197 216 5 331 939 –2.53
a Indirect CO2 emissions are excluded from the totals in this table.
b In accordance with the UNFCCC reporting guidelines on annual inventories of Annex I Parties the year
1990 should be the base year for the estimation and reporting of inventories. However, in accordance with
decisions 9/CP.2, 11/CP.4, and 7/CP.12 some Parties with economies in transition use base years other than
1990: Bulgaria (1988), Croatia (1990), Hungary (average of 1985 to 1987), Poland (1988), Romania (1989)
and Slovenia (1986).
16

Table 1.2
Stationary combustion: liquid fuels - CO2 (2014)
CO2 IEF CO2 IEF
Total
Public
electricity and
heat production
Petroleum
refining
Manufacture of
solid fuels and
other energy
industries
Total TotalCommercial /
InstitutionalResidential
Agriculture /
Forestry /
Fishing
Stationary
% (t/TJ) (t/TJ)
Australia 8.36 GCV T2 CS, PS 67 69 61 70 T2 CS 69 T2 CS 68 69 62 70 T1 CS
Austria 11.33 NCV NA NA 74 78 74 NO NA NA 76 NA NA 74 74 75 74
Belarus 14.93 NCV T1 D 77 77 NO NO T1 D 74 T1 D 72 73 71 73 T1 D 73
Belgium 14.19 NCV CS, T1, T3 D, PS 67 62 67 NO CS, T1, T3 D, PS 75 CS, T1, T3 D 74 74 74 74 T1 D
Bulgaria 4.76 NCV T1, T2 CS, D 77 92 67 NO T1, T2 CS, D 84 T1, T2 CS, D 72 70 64 74 T1, T2 CS, D 77
Canada 7.18 GCV T2 CS 60 76 59 57 T2 CS 67 T2 CS 68 65 69 69 T3 CS
Croatia 14.37 NCV T1 D 66 77 65 NO T1 D 83 T1 D 72 72 70 74 NO NO
Cyprus 48.33 NCV CS CS 78 78 NO CS, T1 CS, D 89 T1 D 71 69 70 74 T1 D 74
Czech Republic 2.05 NCV T1, T2 CS, D 64 77 62 74 T1, T2 CS, D 73 T1, T2 CS, D 74 72 66 74 D, T1 D
Denmark (KP) 9.89 NCV T1, T2, T3 CS, D, PS 61 76 58 74 CR, M, T1, T2, T3 CS, D, PS 80 CR, M, T1, T2, T3 CS, D 74 73 69 74 CR, T2 CS
Denmark (Convention) 11.92 GCV, NCV CS, T1, T2, T3 CS, D, PS 63 76 58 CR, M, T1, T2, T3 CS, D, PS 79 CR, M, T1, T2, T3 CS, D 74 73 72 74 CR, T1, T2 CS, D
Estonia 3.45 NCV T1, T2, T3 CS, D, PS 75 75 NO NO T1, T2, T3 CS, D, PS 72 T1, T2 CS, D 73 65 70 73 T2 CS
European Union (KP) 10.00 NA NA 69 76 67 72 NA NA 78 NA NA 73 73 72 74 73
European Union (Convention) 9.97 NA NA 69 76 67 72 NA NA 78 NA NA 73 73 72 74 73
Finland 16.28 NCV T3 CS, D, PS 64 78 61 NO CS, M, T3 CS, D, PS 70 CS, M, T1, T3 CS, D 74 74 74 74 T1 CS 72
France (KP) 13.30 NA NA 64 76 59 NO NA NA 73 NA NA 74 74 73 74
France (Convention) 13.74 NA NA 65 76 59 NO NA NA 73 NA NA 122 74 NO 74
Germany 9.97 NCV CS CS 70 78 69 82 CS CS, D 98 CS, T1, T2, T3 CS, M 74 73 74 74 CS CS, M 74
Greece 16.40 NCV T1, T2 D, PS 71 76 69 NO T1, T2 CS, D, PS 84 T1, T2 CS, D, NO 72 69 73 72
Hungary 5.72 NCV T1, T2, T3 CS, D, PS 67 77 66 63 T1, T2, T3 CS, D, PS 78 T1, T2 CS, D 72 71 63 74 NA NA
Iceland 13.30 NCV T1, T2 D 75 75 NO T1 D 75 T1, T2 D 74 68 73 74
Ireland 10.03 NCV T1, T3 CS, D, PS 81 79 82 NO T1, T2, T3 CS, D, PS 76 T1, T2 CS, D 72 73 72 73
Italy 10.83 NCV T3 CS 75 76 75 NO T2 CS 81 T2 CS 71 67 70 73 T2 CS
Japan 18.58 GCV CS, T2 CS 68 72 64 71 CS, T2 CS 67 T2 CS 67 68 65 70
Kazakhstan 5.43 NCV T1, T3 D, PS 72 77 71 73 T1, T3 D, PS 75 T1, T3 D, PS 67 72 64 64 T1, T3 D, PS 72
Latvia 7.20 NCV T1, T2 CS, D 74 74 NO 74 T1, T2, T3 CS, D, PS 72 T1, T2 CS, D 72 73 69 74 T1 D
Liechtenstein 19.88 NCV T2 CS NA, NO NA, NO NO T1, T2 CS, D 74 T1, T2 CS, D 144 147 147 74
Lithuania 9.03 NCV T1, T2, T3 CS, D, PS 69 76 69 73 T2 CS 72 T2 CS 68 72 67 72 T2 CS
Luxembourg 7.63 NCV T2 CS 74 74 NO NO T1, T2 CS, D, PS 72 T1, T2 CS, D 73 73 74 71 NA NA
Malta 61.77 NCV T1, T3 D, PS 77 77 NO NO T1 D 75 T1 D 72 75 66 74 NA NA
Monaco
Netherlands 9.74 NCV CS, T2 CS, D 68 67 68 74 T2 CS, D 68 T2 CS, D 74 74 70 74 T2 D
New Zealand 5.17 GCV T1 CS 63 70 63 70 T1 CS 68 T1 CS 68 68 61 70
Norway 14.31 NCV T1, T2, T3 CS, PS 62 52 53 74 T1, T2, T3 CS, PS 63 T1, T2 CS, PS 73 73 72 74 T1, T2 CS, D 71
Poland 3.64 NCV T1, T2 CS, D 70 77 69 74 T1, T2 CS, D 68 T1, T2 CS, D 72 72 64 74
Portugal 12.01 NCV T2 CR, D, PS 66 76 60 NO T2, T3 CR, D, OTH, PS 77 T1, T2 CR, D 68 69 64 73
Romania 6.85 NCV T1, T2 CS, D 64 69 57 70 T1, T2 CS, D 74 D, T1, T2 CS, D 69 70 63 73 T1, T2 CS, D 74
Russian Federation 6.08 NCV T1, T2 CS, D 67 74 62 74 T1, T2 CS, D 74 T1, T2 CS, D 68 77 63 73 T1, T2 CS, D 73
Slovakia 3.14 NCV T2, T3 CS, PS 72 78 71 75 T2 CS 89 T1, T2 CS, D 65 66 63 65 T2 CS, D 74
Slovenia 8.18 NCV T1, T2 CS, D, PS 75 75 NO NO T1, T2, T3 CS, D, PS 80 T1, T2 CS, D 72 72 72 74 T1 D
Spain 14.28 NCV T2 CS, OTH, PS 64 77 56 73 T2 CS, D, M, OTH, PS 85 T2, T3 CS, M, OTH 72 72 70 73 NA NA
Sweden 18.19 NCV T2 CS 57 74 54 C, NO T1, T2, T3 CS, PS 66 M, T1, T2 CS 72 72 73 73 T1 CS
Switzerland 23.35 NCV CS, T2 CS 64 74 64 CS, T2 CS 73 CS, T2 CS 74 74 74 73 T2 CS
Turkey 5.28 NCV T2, T3 CS, D 64 77 58 T1, T2 CS, D 91 T1, T2 CS, D 68 64 74
Ukraine 0.88 NCV T1, T2, T3 CS, D 68 75 73 65 T1, T2 CS, D 78 T1, T2 CS, D 63 65 62 64 T1 D
United Kingdom of Great
Britain and Northern Ireland
7.85 NCV T1, T2 CS 70 76 69 72 T1, T2, T3 CS, D 72 T1, T2, T3 CS, D 73 77 72 74 T1 CS
United States of America 7.67 GCV T2 CS 81 81 81 81 T2 CS 71 T2 CS, D 65 67 65 71 CS, T2 CS 27
d Information on methods and emission factors in this table is as reported by Parties in table Summary 3 of the CRF. It may not reflect the actual method or type of emission factor used for all subcategories within the category 1.A.2 Manufacturing industries and Construction.
e Information on methods and emission factors in this table is as reported by Parties in table Summary 3 of the CRF. It may not reflect the actual method or type of emission factor used for all subcategories within the category 1.A.4 Other sectors.
f Information on methods and emission factors in this table is as reported by Parties in table Summary 3 of the CRF. It may not reflect the actual method or type of emission factor used for all subcategories within the category 1.A.5 Other.
Energy industries Manufacturing industries and construction Other sectors
CO2 IEF
c Information on methods and emission factors in this table is as reported by Parties in table Summary 3 of the CRF. It may not reflect the actual method or type of emission factor used for all subcategories within the category 1.A.1 Energy industries.
Methods and EF usedc CO2 IEF Method and EF used
dMethod and EF used
eMethod and EF used
f
a The national total includes indirect CO2 emissions from the atmospheric oxidation of CH4, CO and NMVOCs for the following Parties: Canada, Czech Republic, Denmark (KP), Denmark (Convention), European Union (KP), European Union (Convention), Finland, France (KP), France (Convention), Ireland, Latvia, Netherlands, Portugal and Switzerland.
b The following Parties reported energy data on a gross calorific value (GCV) basis: Australia, Canada, Denmark (Convention), Japan, New Zealand, United States of America. Hence, reported IEFs are about 5 per cent lower for liquid, solid and other fuels, and about 10 per cent lower for gaseous fuels than would have been the case if the data were given on a
net calorific value (NCV) basis.
EF
Note: This table includes data from categories 1.A.1 Energy industries, 1.A.2 Manufacturing industries and Construction, 1.A.4 Other sectors and 1.A.5 Other.
Share of
national
totala
IEF in
CRF
based on
GCV or
NCVb Methods EF Methods
Other
Methods EF Methods EF
(t/TJ) (t/TJ)
17

Table 1.3
Stationary combustion: solid fuels - CO2 (2014)
CO2 IEF CO2 IEF
Total
Public
electricity and
heat production
Petroleum
refining
Manufacture of
solid fuels and
other energy
industries
Total TotalCommercial /
InstitutionalResidential
Agriculture /
Forestry /
Fishing
Stationary
% (t/TJ) (t/TJ)
Australia 30.68 GCV T2 CS, PS 90 90 NO 82 T2 CS 83 T2 CS 95 95 95 NO T1 CS
Austria 4.66 NCV NA NA 93 93 NO NO NA NA 93 NA NA 94 96 94 94
Belarus 2.30 NCV T1 D 98 98 NO NO T1 D 102 T1 D 98 98 98 98 T1 D 98
Belgium 7.98 NCV CS, T1, T3 D, PS 157 171 NO 41 CS, T1, T3 D, PS 96 CS, T1, T3 D 95 NO 95 95 T1 D
Bulgaria 46.02 NCV T1, T2 CS, D 103 103 NO 101 T1, T2 CS, D 100 T1, T2 CS, D 96 97 96 96 T1, T2 CS, D
Canada 8.95 GCV T2 CS 92 92 NO 85 T2 CS 73 T2 CS 93 92 95 NO T3 CS
Croatia 11.24 NCV T1 D 95 95 NO NO T1 D 97 T1 D 99 98 100 NO NO NO
Cyprus 0.11 NCV CS CS NO NO NO CS, T1 CS, D 95 T1 D NO NO T1 D NO
Czech Republic 44.17 NCV T1, T2 CS, D 97 97 NO 97 T1, T2 CS, D 86 T1, T2 CS, D 98 100 98 98 D, T1 D
Denmark (KP) 19.83 NCV T1, T2, T3 CS, D, PS 94 94 NO NO CR, M, T1, T2, T3 CS, D, PS 96 CR, M, T1, T2, T3 CS, D 95 NO 98 95 CR, T2 CS
Denmark (Convention) 19.81 GCV, NCV CS, T1, T2, T3 CS, D, PS 94 94 NO CR, M, T1, T2, T3 CS, D, PS 96 CR, M, T1, T2, T3 CS, D 95 NO 98 95 CR, T1, T2 CS, D
Estonia 66.50 NCV T1, T2, T3 CS, D, PS 74 100 NO 11 T1, T2, T3 CS, D, PS 97 T1, T2 CS, D 94 94 94 NO T2 CS
European Union (KP) 24.17 NA NA 101 101 163 97 NA NA 118 NA NA 95 95 95 95 99
European Union (Convention) 24.21 NA NA 101 101 163 97 NA NA 118 NA NA 95 95 95 95 99
Finland 17.81 NCV T3 CS, D, PS 94 93 NO 95 CS, M, T3 CS, D, PS 136 CS, M, T1, T3 CS, D 92 NO 89 93 T1 CS NO
France (KP) 7.95 NA NA 120 109 278 187 NA NA 124 NA NA 95 95 95 NO
France (Convention) 8.11 NA NA 120 109 278 187 NA NA 121 NA NA 267 95 NO NO
Germany 36.24 NCV CS CS 106 105 41 140 CS CS, D 136 CS, T1, T2, T3 CS, M 99 100 99 98 CS CS, M 99
Greece 33.74 NCV T1, T2 D, PS 123 123 NO NO T1, T2 CS, D, PS 94 T1, T2 CS, D 99 IE, NO 99 99
Hungary 15.49 NCV T1, T2, T3 CS, D, PS 112 114 NO 71 T1, T2, T3 CS, D, PS 68 T1, T2 CS, D 104 96 104 NO NA NA
Iceland 0.01 NCV T1, T2 D NO NO T1 D 74 T1, T2 D NO NO NO NO
Ireland 8.48 NCV T1, T3 CS, D, PS 92 92 NO NO T1, T2, T3 CS, D, PS 95 T1, T2 CS, D 96 NO 96 NO
Italy 12.49 NCV T3 CS 101 94 NO 177 T2 CS 68 T2 CS 94 NO 94 NO T2 CS
Japan 33.97 GCV CS, T2 CS 89 89 90 83 CS, T2 CS 95 T2 CS 95 95 NO NO
Kazakhstan 46.70 NCV T1, T3 D, PS 96 96 106 96 T1, T3 D, PS 89 T1, T3 D, PS 96 95 96 95 T1, T3 D, PS 97
Latvia 2.06 NCV T1, T2 CS, D 95 95 NO NO T1, T2, T3 CS, D, PS 95 T1, T2 CS, D 95 95 95 95 T1 D
Liechtenstein – NCV T2 CS NA, NO NA, NO NO T1, T2 CS, D NA, NO T1, T2 CS, D NO NO NO
Lithuania 4.10 NCV T1, T2, T3 CS, D, PS 95 95 NO NO T2 CS 96 T2 CS 95 95 95 95 T2 CS
Luxembourg 1.73 NCV T2 CS NO NO NO NO T1, T2 CS, D, PS 95 T1, T2 CS, D 97 NO 97 NO NA NA
Malta – NCV T1, T3 D, PS NO NO NO NO T1 D IE, NO T1 D NO NO NO NO NA NA
Monaco
Netherlands 18.11 NCV CS, T2 CS, D 106 107 NO 79 T2 CS, D 147 T2 CS, D 101 101 100 NO T2 D
New Zealand 4.57 GCV T1 CS 92 92 NO NO T1 CS 92 T1 CS 92 92 92 92
Norway 1.28 NCV T1, T2, T3 CS, PS 90 90 NO T1, T2, T3 CS, PS 115 T1, T2 CS, PS 103 NO 103 NO T1, T2 CS, D
Poland 52.68 NCV T1, T2 CS, D 100 101 97 48 T1, T2 CS, D 104 T1, T2 CS, D 95 95 94 95
Portugal 15.62 NCV T2 CR, D, PS 93 93 NO NO T2, T3 CR, D, OTH, PS 96 T1, T2 CR, D NO NO NO NO
Romania 18.41 NCV T1, T2 CS, D 88 88 NO 88 T1, T2 CS, D 91 D, T1, T2 CS, D 90 88 90 NO T1, T2 CS, D NO
Russian Federation 10.13 NCV T1, T2 CS, D 94 95 NA 71 T1, T2 CS, D 77 T1, T2 CS, D 95 95 95 95 T1, T2 CS, D 95
Slovakia 23.34 NCV T2, T3 CS, PS 116 101 NO 195 T2 CS 122 T1, T2 CS, D 98 97 100 97 T2 CS, D 101
Slovenia 26.53 NCV T1, T2 CS, D, PS 103 103 NO NO T1, T2, T3 CS, D, PS 103 T1, T2 CS, D 96 NO 96 NO T1 D
Spain 14.68 NCV T2 CS, OTH, PS 97 98 NO 44 T2 CS, D, M, OTH, PS 135 T2, T3 CS, M, OTH 101 101 101 NO NA NA
Sweden 8.73 NCV T2 CS 169 191 NO 92 T1, T2, T3 CS, PS 110 M, T1, T2 CS NO NO NO NO T1 CS
Switzerland 1.15 NCV CS, T2 CS NO NO NO NO CS, T2 CS 95 CS, T2 CS 93 NO 93 NO T2 CS
Turkey 28.20 NCV T2, T3 CS, D 105 103 NO 246 T1, T2 CS, D 122 T1, T2 CS, D 93 93 99
Ukraine 23.11 NCV T1, T2, T3 CS, D 91 91 NA, NO 93 T1, T2 CS, D 94 T1, T2 CS, D 93 93 93 93 T1 D
United Kingdom of Great
Britain and Northern Ireland
20.92 NCV T1, T2 CS 90 90 NO 84 T1, T2, T3 CS, D 153 T1, T2, T3 CS, D 97 95 97 NO T1 CS
United States of America 23.54 GCV T2 CS 91 91 91 91 T2 CS 90 T2 CS, D 89 89 NA, NO 90 CS, T2 CS 82
d Information on methods and emission factors in this table is as reported by Parties in table Summary 3 of the CRF. It may not reflect the actual method or type of emission factor used for all subcategories within the category 1.A.2 Manufacturing industries and Construction.
e Information on methods and emission factors in this table is as reported by Parties in table Summary 3 of the CRF. It may not reflect the actual method or type of emission factor used for all subcategories within the category 1.A.4 Other sectors.
f Information on methods and emission factors in this table is as reported by Parties in table Summary 3 of the CRF. It may not reflect the actual method or type of emission factor used for all subcategories within the category 1.A.5 Other.
Energy industries Manufacturing industries and construction Other sectors
CO2 IEF
c Information on methods and emission factors in this table is as reported by Parties in table Summary 3 of the CRF. It may not reflect the actual method or type of emission factor used for all subcategories within the category 1.A.1 Energy industries.
Methods and EF usedc CO2 IEF Method and EF used
dMethod and EF used
eMethod and EF used
f
a The national total includes indirect CO2 emissions from the atmospheric oxidation of CH4, CO and NMVOCs for the following Parties: Canada, Czech Republic, Denmark (KP), Denmark (Convention), European Union (KP), European Union (Convention), Finland, France (KP), France (Convention), Ireland, Latvia, Netherlands, Portugal and Switzerland.
b The following Parties reported energy data on a gross calorific value (GCV) basis: Australia, Canada, Denmark (Convention), Japan, New Zealand, United States of America. Hence, reported IEFs are about 5 per cent lower for liquid, solid and other fuels, and about 10 per cent lower for gaseous fuels than would have been the case if the data were given on a
net calorific value (NCV) basis.
EF
Note: This table includes data from categories 1.A.1 Energy industries, 1.A.2 Manufacturing industries and Construction, 1.A.4 Other sectors and 1.A.5 Other.
Share of
national
totala
IEF in
CRF
based on
GCV or
NCVb
Methods EF Methods
Other
Methods EF Methods EF
(t/TJ) (t/TJ)
18

Table 1.4
Stationary combustion: gaseous fuels - CO2 (2014)
CO2 IEF CO2 IEF
Total
Public
electricity and
heat production
Petroleum
refining
Manufacture of
solid fuels and
other energy
industries
Total TotalCommercial /
InstitutionalResidential
Agriculture /
Forestry /
Fishing
Stationary
% (t/TJ) (t/TJ)
Australia 12.73 GCV T2 CS, PS 51 51 48 51 T2 CS 51 T2 CS 51 51 51 51 T1 CS
Austria 17.98 NCV NA NA 55 55 55 55 NA NA 55 NA NA 55 55 55 55
Belarus 37.33 NCV T1 D 56 56 NO NO T1 D 56 T1 D 56 56 56 56 T1 D 56
Belgium 24.33 NCV CS, T1, T3 D, PS 58 58 56 NO CS, T1, T3 D, PS 56 CS, T1, T3 D 56 56 56 56 T1 D
Bulgaria 6.95 NCV T1, T2 CS, D 55 55 55 55 T1, T2 CS, D 55 T1, T2 CS, D 55 55 55 55 T1, T2 CS, D
Canada 27.05 GCV T2 CS 51 49 49 52 T2 CS 49 T2 CS 49 49 49 49 T3 CS
Croatia 15.42 NCV T1 D 56 56 56 56 T1 D 56 T1 D 56 56 56 56 NO NO
Cyprus – CS CS NO NO NO CS, T1 CS, D NO T1 D NO NO T1 D
Czech Republic 10.90 NCV T1, T2 CS, D 55 55 55 55 T1, T2 CS, D 55 T1, T2 CS, D 55 55 55 55 D, T1 D
Denmark (KP) 13.32 NCV T1, T2, T3 CS, D, PS 57 57 57 57 CR, M, T1, T2, T3 CS, D, PS 57 CR, M, T1, T2, T3 CS, D 57 57 57 57 CR, T2 CS
Denmark (Convention) 10.64 GCV, NCV CS, T1, T2, T3 CS, D, PS 57 57 57 CR, M, T1, T2, T3 CS, D, PS 57 CR, M, T1, T2, T3 CS, D 57 57 57 57 CR, T1, T2 CS, D
Estonia 4.63 NCV T1, T2, T3 CS, D, PS 55 55 NO NO T1, T2, T3 CS, D, PS 55 T1, T2 CS, D 55 55 55 55 T2 CS
European Union (KP) 17.79 NA NA 57 57 56 61 NA NA 56 NA NA 56 56 56 56 56
European Union (Convention) 17.82 NA NA 57 57 56 61 NA NA 56 NA NA 56 56 56 56 56
Finland 8.89 NCV T3 CS, D, PS 55 55 55 NO CS, M, T3 CS, D, PS 55 CS, M, T1, T3 CS, D 55 55 55 55 T1 CS 55
France (KP) 15.94 NA NA 56 56 56 NO NA NA 57 NA NA 57 57 57 57
France (Convention) 15.72 NA NA 56 56 56 NO NA NA 57 NA NA 206 57 NO 57
Germany 15.75 NCV CS CS 56 56 56 61 CS CS, D 56 CS, T1, T2, T3 CS, M 56 56 56 56 CS CS, M 56
Greece 5.05 NCV T1, T2 D, PS 56 56 IE, NO 57 T1, T2 CS, D, PS 56 T1, T2 CS, D 56 56 56 IE, NO
Hungary 26.57 NCV T1, T2, T3 CS, D, PS 56 56 56 56 T1, T2, T3 CS, D, PS 56 T1, T2 CS, D 56 56 56 56 NA NA
Iceland – T1, T2 D NO NO T1 D NO T1, T2 D NO NO NO NO
Ireland 14.73 NCV T1, T3 CS, D, PS 56 57 9 NO T1, T2, T3 CS, D, PS 57 T1, T2 CS, D 57 57 57 NO
Italy 27.95 NCV T3 CS 57 57 57 57 T2 CS 57 T2 CS 57 57 57 57 T2 CS
Japan 19.40 GCV CS, T2 CS 51 51 51 52 CS, T2 CS 52 T2 CS 52 52 52 52
Kazakhstan 13.86 NCV T1, T3 D, PS 56 56 56 56 T1, T3 D, PS 56 T1, T3 D, PS 56 56 56 56 T1, T3 D, PS 56
Latvia 21.37 NCV T1, T2 CS, D 54 54 NO 54 T1, T2, T3 CS, D, PS 54 T1, T2 CS, D 54 54 54 54 T1 D
Liechtenstein 22.88 NCV T2 CS 56 56 NA, NO NO T1, T2 CS, D 56 T1, T2 CS, D 112 112 112 NO
Lithuania 13.27 NCV T1, T2, T3 CS, D, PS 55 55 55 55 T2 CS 55 T2 CS 55 55 55 55 T2 CS
Luxembourg 19.62 NCV T2 CS 57 57 NO NO T1, T2 CS, D, PS 57 T1, T2 CS, D 57 57 57 NO NA NA
Malta 0.03 NCV T1, T3 D, PS NO NO NO NO T1 D 63 T1 D 63 63 63 63 NA NA
Monaco
Netherlands 34.15 NCV CS, T2 CS, D 57 56 56 62 T2 CS, D 56 T2 CS, D 56 56 56 56 T2 D
New Zealand 9.86 GCV T1 CS 53 53 53 54 T1 CS 54 T1 CS 54 54 54 54
Norway 23.27 NCV T1, T2, T3 CS, PS 58 56 NO 58 T1, T2, T3 CS, PS 59 T1, T2 CS, PS 56 56 56 56 T1, T2 CS, D
Poland 6.41 NCV T1, T2 CS, D 56 56 56 56 T1, T2 CS, D 56 T1, T2 CS, D 56 56 56 56
Portugal 11.29 NCV T2 CR, D, PS 55 56 54 NO T2, T3 CR, D, OTH, PS 56 T1, T2 CR, D 56 56 56 56
Romania 17.98 NCV T1, T2 CS, D 56 56 56 56 T1, T2 CS, D 56 D, T1, T2 CS, D 56 56 56 56 T1, T2 CS, D NO
Russian Federation 24.54 NCV T1, T2 CS, D 54 54 54 54 T1, T2 CS, D 54 T1, T2 CS, D 54 54 54 54 T1, T2 CS, D 54
Slovakia 18.58 NCV T2, T3 CS, PS 56 56 56 56 T2 CS 56 T1, T2 CS, D 56 56 56 56 T2 CS, D 56
Slovenia 8.65 NCV T1, T2 CS, D, PS 55 55 NO 55 T1, T2, T3 CS, D, PS 55 T1, T2 CS, D 55 55 55 NO T1 D
Spain 16.08 NCV T2 CS, OTH, PS 58 60 55 56 T2 CS, D, M, OTH, PS 56 T2, T3 CS, M, OTH 56 56 56 56 NA NA
Sweden 3.24 NCV T2 CS 59 57 62 C, NO T1, T2, T3 CS, PS 57 M, T1, T2 CS 57 57 57 57 T1 CS
Switzerland 12.78 NCV CS, T2 CS 57 57 NO CS, T2 CS 57 CS, T2 CS 57 57 57 57 T2 CS
Turkey 20.38 NCV T2, T3 CS, D 58 58 55 T1, T2 CS, D 57 T1, T2 CS, D 57 57 57
Ukraine 19.94 NCV T1, T2, T3 CS, D 54 55 55 52 T1, T2 CS, D 54 T1, T2 CS, D 55 55 55 55 T1 D
United Kingdom of Great
Britain and Northern Ireland
26.69 NCV T1, T2 CS 58 56 56 63 T1, T2, T3 CS, D 57 T1, T2, T3 CS, D 57 57 57 57 T1 CS
United States of America 19.72 GCV T2 CS 50 50 50 50 T2 CS 50 T2 CS, D 50 50 50 50 CS, T2 CS 22
d Information on methods and emission factors in this table is as reported by Parties in table Summary 3 of the CRF. It may not reflect the actual method or type of emission factor used for all subcategories within the category 1.A.2 Manufacturing industries and Construction.
e Information on methods and emission factors in this table is as reported by Parties in table Summary 3 of the CRF. It may not reflect the actual method or type of emission factor used for all subcategories within the category 1.A.4 Other sectors.
f Information on methods and emission factors in this table is as reported by Parties in table Summary 3 of the CRF. It may not reflect the actual method or type of emission factor used for all subcategories within the category 1.A.5 Other.
Energy industries Manufacturing industries and construction Other sectors
CO2 IEF
c Information on methods and emission factors in this table is as reported by Parties in table Summary 3 of the CRF. It may not reflect the actual method or type of emission factor used for all subcategories within the category 1.A.1 Energy industries.
Methods and EF usedc CO2 IEF Method and EF used
dMethods and EF used
eMethod and EF used
f
a The national total includes indirect CO2 emissions from the atmospheric oxidation of CH4, CO and NMVOCs for the following Parties: Canada, Czech Republic, Denmark (KP), Denmark (Convention), European Union (KP), European Union (Convention), Finland, France (KP), France (Convention), Ireland, Latvia, Netherlands, Portugal and Switzerland.
b The following Parties reported energy data on a gross calorific value (GCV) basis: Australia, Canada, Denmark (Convention), Japan, New Zealand, United States of America. Hence, reported IEFs are about 5 per cent lower for liquid, solid and other fuels, and about 10 per cent lower for gaseous fuels than would have been the case if the data were given on a
net calorific value (NCV) basis.
EF
Note: This table includes data from categories 1.A.1 Energy industries, 1.A.2 Manufacturing industries and Construction, 1.A.4 Other sectors and 1.A.5 Other.
Share of
national
totala
IEF in
CRF
based on
GCV or
NCVb
Methods EF Methods
Other
Methods EF Methods EF
(t/TJ) (t/TJ)
19

Table 1.5
Stationary combustion: other fossil fuels - CO2 (2014)
CO2 IEF CO2 IEF
Total
Public
electricity and
heat production
Petroleum
refining
Manufacture of
solid fuels and
other energy
industries
Total TotalCommercial /
InstitutionalResidential
Agriculture /
Forestry /
Fishing
Stationary
% (t/TJ) (t/TJ)
Australia – GCV T2 CS, PS NO NO NO NO T2 CS NO T2 CS NA, NO NO NO NA, NO T1 CS
Austria 2.81 NCV NA NA 59 59 NO NO NA NA 65 NA NA 68 68 NO NO
Belarus – NCV T1 D NO NO NO NO T1 D IE, NO T1 D NO NO NO NO T1 D
Belgium 2.32 NCV CS, T1, T3 D, PS 99 99 NO NO CS, T1, T3 D, PS 76 CS, T1, T3 D 66 66 NO NO T1 D
Bulgaria 0.09 NCV T1, T2 CS, D NO NO NO NO T1, T2 CS, D 87 T1, T2 CS, D NO NO NO NO T1, T2 CS, D
Canada 0.04 GCV T2 CS NA, NO NA, NO NO NO T2 CS 78 T2 CS NO NO NO NO T3 CS
Croatia 0.27 NCV T1 D NO NO NO NO T1 D 143 T1 D NO NO NO NO NO NO
Cyprus 0.67 NCV CS CS NO NO NO CS, T1 CS, D 143 T1 D NO NO T1 D
Czech Republic 0.52 NCV T1, T2 CS, D 145 145 NO NO T1, T2 CS, D 93 T1, T2 CS, D NO NO NO NO D, T1 D
Denmark (KP) 3.03 NCV T1, T2, T3 CS, D, PS 88 88 NO NO CR, M, T1, T2, T3 CS, D, PS 88 CR, M, T1, T2, T3 CS, D 82 82 NO NO CR, T2 CS
Denmark (Convention) 3.07 GCV, NCV CS, T1, T2, T3 CS, D, PS 88 88 NO CR, M, T1, T2, T3 CS, D, PS 88 CR, M, T1, T2, T3 CS, D 82 82 NO NO CR, T1, T2 CS, D
Estonia 1.41 NCV T1, T2, T3 CS, D, PS 56 56 NO NO T1, T2, T3 CS, D, PS 80 T1, T2 CS, D NO NO NO NO T2 CS
European Union (KP) 1.49 NA NA 81 81 100 143 NA NA 69 NA NA 112 112 IE, NO IE, NO
European Union (Convention) 1.49 NA NA 82 81 100 143 NA NA 69 NA NA 112 112 IE, NO IE, NO
Finland 1.20 NCV T3 CS, D, PS 69 69 NO NO CS, M, T3 CS, D, PS 82 CS, M, T1, T3 CS, D NO NO NO NO T1 CS NO
France (KP) 2.26 NA NA 108 108 50 NO NA NA 52 NA NA NO NO NO NO
France (Convention) 2.23 NA NA 108 108 50 NO NA NA 52 NA NA NO NO NO NO
Germany 2.76 NCV CS CS 84 84 NA, NO NA, NO CS CS, D 74 CS, T1, T2, T3 CS, M NA, NO NA, NO NA, NO NA, NO CS CS, M
Greece 0.03 NCV T1, T2 D, PS NO NO NO NO T1, T2 CS, D, PS 89 T1, T2 CS, D IE, NO IE, NO IE, NO IE, NO
Hungary 0.58 NCV T1, T2, T3 CS, D, PS 105 105 NO NO T1, T2, T3 CS, D, PS 67 T1, T2 CS, D NO NO NO NO NA NA
Iceland – T1, T2 D T1 D NO T1, T2 D NO NO NO NO
Ireland 0.40 NCV T1, T3 CS, D, PS 86 86 NO NO T1, T2, T3 CS, D, PS 91 T1, T2 CS, D NO NO NO NO
Italy 1.22 NCV T3 CS 93 93 NO NO T2 CS 64 T2 CS 114 114 NO NO T2 CS
Japan 1.16 GCV CS, T2 CS 29 29 47 46 CS, T2 CS 43 T2 CS NO NO NO NO
Kazakhstan 0.00 NCV T1, T3 D, PS IE, NA IE, NA IE, NA IE, NA T1, T3 D, PS 73 T1, T3 D, PS 73 73 NA 73 T1, T3 D, PS
Latvia 0.96 NCV T1, T2 CS, D NO NO NO NO T1, T2, T3 CS, D, PS 86 T1, T2 CS, D NO NO NO NO T1 D
Liechtenstein – NCV T2 CS NA, NO NA, NO NO T1, T2 CS, D NA, NO T1, T2 CS, D NO NO NO
Lithuania 0.43 NCV T1, T2, T3 CS, D, PS 109 109 NO NO T2 CS NO T2 CS NO NO NO NO T2 CS
Luxembourg 1.06 NCV T2 CS 96 96 NO NO T1, T2 CS, D, PS 86 T1, T2 CS, D NO NO NO NO NA NA
Malta – NCV T1, T3 D, PS NO NO NO NO T1 D IE, NO T1 D IE, NO NO NO IE NA NA
Monaco
Netherlands 1.51 NCV CS, T2 CS, D 83 83 NO NO T2 CS, D NO T2 CS, D NO NO NO NO T2 D
New Zealand – GCV T1 CS NO NO NO NO T1 CS NO T1 CS NO NO NO NO
Norway 2.17 NCV T1, T2, T3 CS, PS 48 48 NO T1, T2, T3 CS, PS 59 T1, T2 CS, PS 79 79 NO T1, T2 CS, D NO
Poland 0.75 NCV T1, T2 CS, D 121 121 NO 143 T1, T2 CS, D 133 T1, T2 CS, D 109 109 IE, NO NO
Portugal 1.31 NCV T2 CR, D, PS 106 106 NO T2, T3 CR, D, OTH, PS 54 T1, T2 CR, D NO NO NO NO
Romania 0.40 NCV T1, T2 CS, D 84 84 NO NO T1, T2 CS, D 84 D, T1, T2 CS, D 87 87 NO NO T1, T2 CS, D NO
Russian Federation 0.92 NCV T1, T2 CS, D 143 143 143 143 T1, T2 CS, D 143 T1, T2 CS, D 143 143 NA, NO 143 T1, T2 CS, D 142
Slovakia 0.85 NCV T2, T3 CS, PS 76 76 NO NO T2 CS 87 T1, T2 CS, D NO NO NO NO T2 CS, D NO
Slovenia 0.52 NCV T1, T2 CS, D, PS 73 73 NO NO T1, T2, T3 CS, D, PS 54 T1, T2 CS, D NO NO NO NO T1 D
Spain 0.71 NCV T2 CS, OTH, PS 69 64 101 NO T2 CS, D, M, OTH, PS 50 T2, T3 CS, M, OTH NO NO NO NO NA NA
Sweden 4.35 NCV T2 CS 88 88 NO T1, T2, T3 CS, PS 64 M, T1, T2 CS 60 60 NO NO T1 CS
Switzerland 5.51 NCV CS, T2 CS 89 89 NO CS, T2 CS 69 CS, T2 CS NO NO T2 CS
Turkey 0.27 NCV T2, T3 CS, D 143 143 NO T1, T2 CS, D 139 T1, T2 CS, D NO NO
Ukraine 0.05 NCV T1, T2, T3 CS, D 73 73 NA, NO 73 T1, T2 CS, D 73 T1, T2 CS, D 73 73 NA, NO NA, NO T1 D
United Kingdom of Great
Britain and Northern Ireland
0.44 NCV T1, T2 CS 39 39 NO NO T1, T2, T3 CS, D 44 T1, T2, T3 CS, D NO NO NO NO T1 CS
United States of America 0.14 GCV T2 CS 7.1 7.1 NA, NO NA, NO T2 CS NA, NO T2 CS, D NA, NO NA, NO NA, NO NA, NO CS, T2 CS 39
d Information on methods and emission factors in this table is as reported by Parties in table Summary 3 of the CRF. It may not reflect the actual method or type of emission factor used for all subcategories within the category 1.A.2 Manufacturing industries and Construction.
e Information on methods and emission factors in this table is as reported by Parties in table Summary 3 of the CRF. It may not reflect the actual method or type of emission factor used for all subcategories within the category 1.A.4 Other sectors.
f Information on methods and emission factors in this table is as reported by Parties in table Summary 3 of the CRF. It may not reflect the actual method or type of emission factor used for all subcategories within the category 1.A.5 Other.
Energy industries Manufacturing industries and construction Other sectors
CO2 IEF
c Information on methods and emission factors in this table is as reported by Parties in table Summary 3 of the CRF. It may not reflect the actual method or type of emission factor used for all subcategories within the category 1.A.1 Energy industries.
Methods and EF usedc CO2 IEF Methods and EF used
dMethods and EF used
eMethod and EF used
f
a The national total includes indirect CO2 emissions from the atmospheric oxidation of CH4, CO and NMVOCs for the following Parties: Canada, Czech Republic, Denmark (KP), Denmark (Convention), European Union (KP), European Union (Convention), Finland, France (KP), France (Convention), Ireland, Latvia, Netherlands, Portugal and Switzerland.
b The following Parties reported energy data on a gross calorific value (GCV) basis: Australia, Canada, Denmark (Convention), Japan, New Zealand, United States of America. Hence, reported IEFs are about 5 per cent lower for liquid, solid and other fuels, and about 10 per cent lower for gaseous fuels than would have been the case if the data were given on a
net calorific value (NCV) basis.
EF
Note: This table includes data from categories 1.A.1 Energy industries, 1.A.2 Manufacturing industries and Construction, 1.A.4 Other sectors and 1.A.5 Other.
Share of
national
totala
IEF in
CRF
based on
GCV or
NCVb Methods EF Methods
Other
Methods EF Methods EF
(t/TJ) (t/TJ)
20

Table 1.6
Road transportation - CO2, N2O (2014)
Gasoline Diesel oil Gasoline Diesel oil
(%) (%)
IPCC default EFc
NCV69.3
(67.5 to 73.0)
74.1
(72.6 to 74.8)NCV
8.0
(0.96 to 24)
3.9
(1.3 to 12)
Australia 14.77 T2 CS, D GCV 67 70 0.23 T1, T3 CS, D GCV 5.1 1.6
Austria 27.90 NA NA NCV 76 74 0.24 NA NA NCV 0.70 2.6
Belarus 1.46 T1 D NCV 69 74 0.04 T1 D NCV 25 3.9
Belgium 21.33 M, T1, T3 OTH NCV 71 74 0.22 M, T3 CS, OTH NCV 0.74 2.8
Bulgaria 13.89 T2 CR NCV 72 75 0.12 T2 CR NCV 2.6 1.7
Canada 18.42 T1, T2, T3 CS GCV 66 70 0.32 T1, T3 CS GCV 3.6 3.9
Croatia 23.33 T1 D NCV 69 74 0.20 T1, T3 CR, D NCV 1.9 2.1
Cyprus 20.96 T1 D NCV 69 74 0.57 T1 D NCV 8.0 3.9
Czech Republic 12.80 T1 CS, D NCV 69 74 0.48 T1, T2 CS, D NCV 19 5.2
Denmark (KP) 21.95 CR, M, T2 CS NCV 73 74 0.24 CR, M, T3 CR NCV 1.1 3.2
Denmark (Convention) 22.17 CR, M, T1, T2 CS, D GCV,NCV 73 74 0.24 CR, M, T1, T3 CR, D GCV,NCV 1.2 3.2
Estonia 10.17 T1, T2 CS, D NCV 73 73 0.09 T1, T3 CS, D NCV 1.5 2.4
European Union (KP) 19.50 NA NA 72 74 0.20 NA NA 1.6 2.9
European Union (Convention) 19.51 NA NA 72 74 0.20 NA NA 1.6 2.9
Finland 17.34 M CS NCV 73 73 0.12 M D NCV 1.1 1.7
France (KP) 26.71 NA NA 71 75 0.32 NA NA 1.8 3.0
France (Convention) 26.55 NA NA 71 75 0.32 NA NA 1.9 3.0
Germany 17.01 CS, M, T2, T3 CS, D NCV 73 74 0.16 CS, M, T2, T3 CS, M NCV 0.67 3.1
Greece 14.94 T1, T2, T3 CS, D NCV 73 73 0.11 M, T1 D, M NCV 1.8 1.7
Hungary 18.76 T1, T2 CS, D NCV 73 75 0.18 T1, T3 D, M NCV 1.8 2.6
Iceland 16.63 NA NA NCV 69 74 0.73 NA NA NCV 16 3.9
Ireland 18.41 T2, T3 CS, M NCV 70 73 0.18 T3 M NCV 1.3 2.7
Italy 23.21 T3 CS NCV 73 74 0.21 T3 M NCV 1.2 2.5
Japan 13.68 T2 CS GCV 69 69 0.11 T3 CS, D GCV 1.5 2.5
Kazakhstan 5.93 T2 D NCV 70 48 0.04 T2 D NCV 0.47 2.1
Latvia 23.42 T1, T2 CS, D, OTH NCV 71 74 0.24 T1, T2 CR, OTH NCV 1.8 2.6
Liechtenstein 35.94 T2 CS NCV 74 74 0.22 T2 CS, D NCV 0.59 2.5
Lithuania 23.76 T1, T2 CS, D NCV 73 73 0.18 T1, T3 CR, D NCV 3.0 1.5
Luxembourg 56.01 T1, T2 CS, D NCV 71 71 0.46 T3 M NCV 0.75 2.2
Malta 17.91 T3 CR NCV 75 74 0.33 T3 CR NCV 6.1 3.5
Monaco
Netherlands 15.51 T1, T2 CS NCV 72 74 0.13 T1, T2 CS, D NCV 1.1 2.6
New Zealand 15.60 T1 CS GCV 67 70 0.15 D, T3 CS, D GCV 2.7 1.6
Norway 19.01 T2 CS NCV 71 74 0.13 T2 CS NCV 0.96 1.8
Poland 11.14 T1, T2 CS, D NCV 70 72 0.14 T1 D NCV 2.8 3.6
Portugal 23.25 T2 D NCV 69 73 0.22 T3 CR NCV 1.6 2.3
Romania 13.52 T1, T3 D, OTH NCV 71 77 0.15 T1, T3 D, OTH NCV 2.8 2.6
Russian Federation 5.70 CR, T1, T2 CR, CS, D NCV 73 74 0.07 CR, T1, T2, T3 CR, CS, D NCV 3.6 1.9
Slovakia 15.22 M D NCV 71 75 0.13 M D NCV 1.8 2.0
Slovenia 31.82 M M NCV 69 74 0.31 M M NCV 0.69 2.7
Spain 22.74 T3 M NCV 71 73 0.23 T3 M NCV 1.2 2.7
Sweden 30.24 T1 CS NCV 72 72 0.25 M CS, D, M NCV 0.60 2.6
Switzerland 32.04 NA NA NCV 74 73 0.19 NA NA NCV 0.59 2.5
Turkey 14.05 T1, T2 CS, D NCV 69 74 0.22 T1 D NCV 8.0 3.9
Ukraine 7.35 T1 D NCV 69 74 0.14 T1 D NCV 5.6 3.9
United Kingdom of Great
Britain and Northern Ireland20.59 T1, T3 CS, OTH NCV 70 73 0.18 T3 CR, CS NCV 0.78 2.9
United States of America 20.90 T1, T2 CS GCV 68 70 0.18 M, T1, T2 CS, D, M GCV 2.6 0.22
c Source of default emission factors: 2006 IPCC Guidelines for National Greenhouse Gas Inventories Volume 2 Chapter 3 Mobile Combustion. CO2 table 3.2.1; N2O table 3.2.2.
IEF in CRF
based on
GCV or
NCVb
Methods EF
IEF in CRF
based on
GCV or
NCVb
(t/TJ) (kg/TJ)
a The national total includes indirect CO2 emissions from the atmospheric oxidation of CH4, CO and NMVOCs for the following Parties: Canada, Czech Republic, Denmark (KP), Denmark (Convention), European Union (KP), European Union
(Convention), Finland, France (KP), France (Convention), Ireland, Latvia, Netherlands, Portugal and Switzerland.b The following Parties reported energy data on a gross calorific value (GCV) basis: Australia, Canada, Denmark (Convention), Japan, New Zealand, United States of America. Hence, reported IEFs are about 5 per cent lower for liquid, solid and
other fuels, and about 10 per cent lower for gaseous fuels than would have been the case if the data were given on a net calorific value (NCV) basis.
CO2 emissions N2O emissions
Share of
national
totala
Methods and EF used CO2 IEFShare of
national
totala
Methods and EF used N2O IEF
Methods EF
21

Table 1.7
Domestic aviation and navigation - CO2 (2014)
Jet keroseneAviation
gasolineResidual fuel oil Gas/diesel oil
(%) (%)
IPCC default EFb
71.5
(69.8 to 74.4)
70
(67.5 to 73.0)
77.4
(75.5 to 78.8)
74.1
(72.6 to 74.8)
Australia T2 CS 1.65 70 67 0.30 74 70
Austria NA NA 0.07 73 76 0.01 NO 74
Belarus T1 D 0.01 72 NO 0.67 NO 74
Belgium T1, T3 CS, D 0.02 72 70 0.36 IE 71
Bulgaria T1, T2 D 0.05 72 69 0.02 NO 74
Canada T2, T3 CS 0.97 68 71 0.62 74 70
Croatia T1 D 0.13 72 70 0.60 NO 74
Cyprus T1 D 0.01 71 NO 0.02 NO 74
Czech Republic T1 D 0.01 71 70 0.01 NO 74
Denmark (KP) CR, M, T2 CS 0.27 72 73 0.71 78 74
Denmark (Convention) CR, M, T1, T2 CS, D 0.35 72 72 0.89 78 74
Estonia T2 CS, D 0.01 NO 73 0.15 NO 73
European Union (KP) 0.36 72 70 0.36 78 74
European Union 0.35 72 70 0.36 78 74
Finland CS, M, OTH, T3 CS 0.33 73 71 0.70 78 74
France (KP) 0.98 72 71 0.27 78 75
France (Convention) 0.98 72 71 0.31 78 75
Germany CS, T1, T3 CS, D, M 0.25 73 70 0.21 81 74
Greece T1, T2 CS, D 0.54 70 69 1.44 78 77
Hungary T1 D 0.00 71 70 0.03 NO 74
Iceland T1 D 0.87 71 69 0.44 77 73
Ireland T2, T3 CS 0.02 71 70 0.38 NO 73
Italy T1, T2 CS 0.46 72 70 0.98 77 74
Japan T2 CS 0.75 68 69 0.81 IE 69
Kazakhstan T2 CS, D 0.17 73 69 0.03 NO 73
Latvia T1, T2 CS, D 0.03 73 70 0.11 NO 74
Liechtenstein T1 CS 0.03 73 NO – NO NO
Lithuania T2 CS 0.01 72 72 0.08 NO 73
Luxembourg T1, T2 CS, D 0.00 NO 69 0.01 NO 74
Malta D, T1 D 0.14 72 70 3.30 77 74
Monaco
Netherlands T2 CS, D 0.02 72 72 0.54 NO 74
New Zealand T1 CS 1.04 68 66 0.39 73 NO
Norway T1, T2 CS, D, PS 2.36 73 71 2.76 79 74
Poland T1 D 0.04 72 70 0.00 77 74
Portugal T1, T2, T3 D 0.52 71 69 0.26 77 73
Romania T1, T2 CS, D, OTH 0.07 72 70 0.11 NO 74
Russian Federation T1, T1b D 0.39 72 NO 0.08 77 74
Slovakia T1, T3 D 0.01 73 71 0.01 NO 76
Slovenia T1 D 0.01 NO 70 – NO IE
Spain T1, T2 CS, D, M 0.80 73 73 0.30 77 73
Sweden T1 CS 0.95 71 70 0.74 78 74
Switzerland NA NA 0.29 73 IE 0.23 NO 73
Turkey T2 CS, D 0.87 71 NO 0.29 78 74
Ukraine T1, T3 D, OTH 0.03 72 70 0.02 77 74
United Kingdom of Great
Britain and Northern Ireland T2, T3 CS 0.36 72 69 0.43 78 74
United States of America T1, T2 CS 1.90 68 66 0.34 71 68
(t/TJ)
Methods and EF usedDomestic aviation Domestic navigation
Share of
national
totala
CO2 IEF Share of
national
totala
CO2 IEF
Methods EF
(t/TJ)
a The national total includes indirect CO2 emissions from the atmospheric oxidation of CH4, CO and NMVOCs for the following Parties: Canada, Czech Republic, Denmark (KP),
Denmark (Convention), European Union (KP), European Union (Convention), Finland, France (KP), France (Convention), Ireland, Latvia, Netherlands, Portugal and Switzerland.
b Source of default emission factors: 2006 IPCC Guidelines for National Greenhouse Gas Inventories Volume 2 Chapter 3 Mobile Combustion. Table 3.6.4 for Jet kerosense,
Aviation gasoline; Table 3.5.2 for Residual oil Gas/diesel oil.
22

Table 1.8
Domestic and international aviation - activity data (2014)
CRF IEAa,b,d Difference CRF IEA
a,c,d Difference CRF IEAa,b,d Difference CRF IEA
a,c,d Difference CRF IEAa,b,c,d Difference
(%) (%) (%) (%) (%)
Australia 121 331 124 378 2.51 2 452 2 275 –7.25 170 880 163 894 –4.09 NO 0 – 294 663 290 546 –1.40
Austria 582 1 204 106.74 99 88 –11.16 27 177 26 961 –0.80 NO 0 – 27 859 28 253 1.42
Belarus 99 946 855.95 NO 0 – 5 722 4 730 –17.34 NO 0 – 5 821 5 676 –2.49
Belgium 341 0 – 42 88 110.54 56 678 55 685 –1.75 0.23 0 – 57 062 55 773 –2.26
Bulgaria 344 344 –0.00 44 44 0.01 7 095 7 095 –0.00 NO 0 – 7 483 7 483 –0.00
Canada 103 699 206 677 99.30 1 775 1 254 –29.34 168 915 30 729 –81.81 53 0 – 274 442 238 660 –13.04
Croatia 382 387 1.19 45 44 –1.32 5 073 4 945 –2.52 4.5 0 – 5 504 5 376 –2.33
Cyprus 8.4 0 – NO 0 – 10 859 9 933 –8.53 NO 0 – 10 867 9 933 –8.60
Czech Republic 12 688 5412.96 88 88 0.49 12 241 12 169 –0.59 NO 0 – 12 341 12 945 4.89
Denmark (KP) 1 862 – 39 – 37 221 – 3.0 – 39 125 –
Denmark (Convention) 2 431 1 333 –45.16 45 44 –2.56 37 233 37 324 0.24 3.0 0 – 39 712 38 701 –2.55
Estonia NO 0 – 17 0 – 1 700 1 720 1.17 NO 0 – 1 717 1 720 0.17
European Union (KP) 211 278 – 3 353 – 1 897 735 – 55 – 2 112 421 –
European Union (Convention) 206 819 217 967 5.39 3 224 3 432 6.46 1 889 769 1 839 970 –2.64 69 0 – 2 099 881 2 061 369 –1.83
Finland 2 600 2 580 –0.77 33 44 34.16 26 240 26 058 –0.69 NO 0 – 28 873 28 682 –0.66
France (KP) 62 268 – 857 – 228 187 – NO – 291 311 –
France (Convention) 63 184 32 680 –48.28 857 792 –7.57 231 628 235 769 1.79 NO 0 – 295 669 269 241 –8.94
Germany 29 702 30 100 1.34 472 528 11.86 332 168 336 518 1.31 NO 0 – 362 342 367 146 1.33
Greece 7 733 7 439 –3.80 90 88 –1.78 40 203 32 551 –19.03 NO 0 – 48 026 40 078 –16.55
Hungary 16 0 – 0.066 0 – 7 148 7 353 2.87 2.2 0 – 7 166 7 353 2.62
Iceland 542 516 –4.88 22 44 98.66 7 826 7 611 –2.75 0.089 0 – 8 391 8 171 –2.62
Ireland 100 258 158.49 32 88 175.51 31 219 30 272 –3.03 NO 0 – 31 350 30 618 –2.34
Italy 26 774 26 961 0.70 90 88 –2.14 131 354 128 785 –1.96 NO 0 – 158 218 155 834 –1.51
Japan 149 190 143 335 –3.92 58 45 –23.46 279 106 268 157 –3.92 NO 0 – 428 354 411 536 –3.93
Kazakhstan 7 193 3 698 –48.59 290 176 –39.34 12 788 9 718 –24.01 NA 0 – 20 271 13 592 –32.95
Latvia 43 43 –0.00 4.0 0 – 4 580 4 558 –0.48 NO 0 – 4 627 4 601 –0.56
Liechtenstein 0.85 – NO – 16 – NO – 17 –
Lithuania 8.0 0 – 19 0 – 3 241 3 225 –0.49 NO 0 – 3 268 3 225 –1.32
Luxembourg NO 0 – 7.2 0 – 16 997 16 942 –0.33 0.80 0 – 17 005 16 942 –0.37
Malta 56 43 –23.17 1.5 0 – 4 642 4 644 0.04 NO 0 – 4 700 4 687 –0.27
Monaco
Netherlands 510 387 –24.13 61 44 –28.16 151 422 149 683 –1.15 NO 0 – 151 993 150 114 –1.24
New Zealand 11 944 10 903 –8.72 440 446 1.30 37 657 35 200 –6.53 NO 0 – 50 041 46 548 –6.98
Norway 17 100 17 071 –0.17 72 88 22.15 21 162 21 113 –0.23 NO 0 – 38 334 38 272 –0.16
Poland 1 695 903 –46.71 220 220 0.01 23 684 24 467 3.31 NO 0 – 25 598 25 590 –0.03
Portugal 4 752 5 375 13.10 18 44 142.96 41 944 41 323 –1.48 41 0 – 46 755 46 742 –0.03
Romania 972 860 –11.56 44 44 0.10 12 681 7 654 –39.64 NO 0 – 13 697 8 558 –37.52
Russian Federation 152 183 237 102 55.80 NO 440 – 151 255 237 059 56.73 NO 0 – 303 438 474 601 56.41
Slovakia 56 0 – 1.8 0 – 1 661 1 462 –11.97 1.9 0 – 1 720 1 462 –15.00
Slovenia NO 0 – 21 44 110.34 1 017 1 075 5.75 NO 0 – 1 038 1 119 7.85
Spain 36 304 68 886 89.75 130 132 1.48 187 780 152 908 –18.57 NO 0 – 224 215 221 926 –1.02
Sweden 7 137 3 741 –47.58 75 88 16.94 31 691 30 229 –4.61 NO 0 – 38 903 34 058 –12.45
Switzerland 1 921 2 279 18.65 IE 176 – 65 006 65 790 1.21 IE 0 – 66 927 68 245 1.97
Turkey 57 243 41 624 –27.29 NO 0 – 138 775 109 220 –21.30 NO 0 – 196 018 150 844 –23.05
Ukraine 1 283 0 – 23 0 – 13 269 0 – NO 0 – 14 575 0 –
United Kingdom of Great
Britain and Northern Ireland 25 423 33 755 32.77 798 792 –0.80 455 066 448 662 –1.41 5.9 0 – 481 293 483 209 0.40
United States of America 1 949 937 2 396 938 22.92 22 846 21 549 –5.68 1 039 303 634 569 –38.94 NA 0 – 3 012 086 3 053 055 1.36
c UNFCCC has included the quantities reported in IEA for 'aviation gasoline' and 'motor gasoline'.
IEA data for Denmark do not include Faroe Islands and Greenland.
IEA data for France includes data for Monaco, but excludes data for the following overseas territories: Guadeloupe, Guyana, Martinique, New Caledonia, French Polynesia, Reunion and Saint Pierre Miquelon.
IEA data for the Netherlands are only for the European part.
Domestic aviation International aviationTotal jet kerosene and aviation gasoline
Jet kerosene Aviation gasoline Jet kerosene Aviation gasoline
b UNFCCC has included the quantities reported in IEA for 'kerosene type jet fuel' and 'gasoline type jet fuel'.
d Geographical coverage of IEA data:
No IEA data for Liechtenstein are available. These data are not included in the data of Switzerland.
(TJ) (TJ) (TJ) (TJ) (TJ)
a Data provided by IEA on 27 May 2016. Data of OECD countries correspond to the preliminary 2016 edition of the IEA World Energy Balances, while non-OECD countries’ data are still provisional.
23

Table 1.9
Domestic and international navigation - activity data (2014)
CRF IEAa,b Difference CRF IEA
a,b Difference CRF IEAa,b Difference CRF IEA
a,b Difference CRF IEAa,b Difference CRF IEA
a,b Difference
(%) (%) (%) (%) (%) (%)
Australia 4 335 2 002 –53.82 6 435 8 051 25.11 27 659 28 712 3.81 1 834 1 448 –21.02 31 994 30 715 –4.00 8 269 9 500 14.88
Austria NO 0 – 59 43 –27.47 NO 0 – 860 852 –0.91 NO 0 – 919 895 –2.61
Belarus NO 0 – 8 303 85 –98.97 NO 0 – NO 0 – NO 0 – 8 303 85 –98.97
Belgium IE 0 – 5 826 6 859 17.73 204 319 199 720 –2.25 25 704 25 560 –0.56 204 319 199 720 –2.25 31 530 32 419 2.82
Bulgaria NO 0 – 116 0 – 1 040 1 040 0.00 2 355 2 386 1.31 1 040 1 040 0.00 2 471 2 386 –3.44
Canada 34 638 31 235 –9.82 28 426 27 179 –4.39 15 453 13 949 –9.73 1 459 1 406 –3.66 50 091 45 185 –9.79 29 885 28 585 –4.35
Croatia NO 0 – 1 841 1 832 –0.49 NO 0 – NO 0 – NO 0 – 1 841 1 832 –0.49
Cyprus NO 0 – 20 0 – 6 181 6 120 –0.99 3 440 3 408 –0.93 6 181 6 120 –0.99 3 460 3 408 –1.49
Czech Republic NO 0 – 129 128 –0.92 NO 0 – NO 0 – NO 0 – 129 128 –0.92
Denmark (KP) 2 132 – 2 690 – 16 714 – 12 643 – 18 846 – 15 333 –
Denmark (Convention) 2 814 520 –81.52 3 148 5 112 62.39 17 016 17 960 5.55 13 547 12 737 –5.97 19 830 18 480 –6.81 16 695 17 849 6.92
Estonia NO 0 – 434 383 –11.65 11 279 11 240 –0.35 2 116 2 130 0.66 11 279 11 240 –0.35 2 550 2 513 –1.43
European Union (KP) 56 350 – 124 778 – 1 446 607 – 293 901 – 1 502 957 – 418 680 –
European Union (Convention) 56 238 40 720 –27.59 124 594 124 307 –0.23 1 444 319 1 444 200 –0.01 292 319 292 662 0.12 1 500 557 1 484 920 –1.04 416 913 416 969 0.01
Finland 1 118 1 120 0.19 2 718 2 854 5.01 2 311 2 600 12.50 1 082 1 406 29.97 3 429 3 720 8.49 3 800 4 260 12.12
France (KP) 857 – 4 466 – 72 987 – 7 510 – 73 844 – 11 976 –
France (Convention) 1 897 2 440 28.59 5 828 5 197 –10.83 74 027 71 400 –3.55 8 218 3 578 –56.45 75 924 73 840 –2.75 14 046 8 776 –37.52
Germany 6 174 0 – 18 416 12 482 –32.22 69 100 74 640 8.02 13 589 20 874 53.61 75 273 74 640 –0.84 32 006 33 356 4.22
Greece 11 006 10 800 –1.87 7 731 7 966 3.05 66 501 66 120 –0.57 10 856 11 246 3.60 77 507 76 920 –0.76 18 586 19 213 3.37
Hungary NO 0 – 252 256 1.43 NE 0 – NE 0 – NE, NO 0 – 252 256 1.43
Iceland 86 80 –7.33 184 170 –7.56 1 472 320 –78.26 1 582 639 –59.61 1 558 400 –74.33 1 766 809 –54.18
Ireland NO 600 – 3 035 43 –98.60 843 800 –5.09 4 770 4 558 –4.44 843 1 400 66.09 7 805 4 601 –41.05
Italy 23 568 14 240 –39.58 26 174 26 327 0.58 52 073 73 800 41.72 5 068 4 856 –4.17 75 641 88 040 16.39 31 242 31 183 –0.19
Japan IE 97 213 – 5 403 41 492 667.94 IE 143 605 – 1 323 3 877 192.94 IE 240 818 – 6 726 45 369 574.49
Kazakhstan NO 0 – 1 309 213 –83.73 0 0 0 0 – 1 309 213 –83.73
Latvia NO 0 – 170 170 0.24 6 780 6 680 –1.47 2 932 2 939 0.25 6 780 6 680 –1.47 3 102 3 110 0.25
Liechtenstein NO – NO – NO – NO – NO – NO –
Lithuania NO 0 – 199 213 7.03 130 120 –7.70 347 341 –1.79 130 120 –7.70 546 554 1.43
Luxembourg NO 0 – 15 0 – NO 0 – 1.6 0 – NO 0 – 16 0 –
Malta 358 40 –88.84 949 383 –59.59 42 987 42 840 –0.34 8 641 7 881 –8.80 43 346 42 880 –1.07 9 590 8 264 –13.82
Monaco
Netherlands NO 0 – 12 617 12 823 1.63 482 831 471 080 –2.43 57 314 57 169 –0.25 482 831 471 080 –2.43 69 931 69 992 0.09
New Zealand 4 338 2 343 –45.99 NO 2 513 – 10 601 9 841 –7.18 2 098 2 215 5.58 14 939 12 184 –18.45 2 098 4 729 125.38
Norway 1 251 0 – 15 239 23 047 51.24 5 975 3 120 –47.78 9 067 2 897 –68.05 7 226 3 120 –56.82 24 306 25 943 6.74
Poland 19 0 – 141 128 –9.65 2 920 2 920 –0.00 3 248 3 195 –1.63 2 939 2 920 –0.66 3 389 3 323 –1.97
Portugal 1 582 2 120 33.99 636 1 406 120.88 23 394 22 840 –2.37 3 309 2 471 –25.34 24 976 24 960 –0.06 3 946 3 877 –1.75
Romania NO 0 – 1 578 1 576 –0.10 NO 0 – 3 369 3 365 –0.10 NO 0 – 4 947 4 942 –0.10
Russian Federation 8 978 8 960 –0.20 19 208 19 255 0.24 594 072 258 760 –56.44 66 931 365 721 446.41 603 050 267 720 –55.61 86 139 384 976 346.92
Slovakia NO 0 – 59 0 – NO 0 – 192 0 – NO 0 – 251 0 –
Slovenia NO 0 – IE 0 – 2 383 2 320 –2.64 NO 0 – 2 383 2 320 –2.64 IE, NO 0 –
Spain 3 496 3 480 –0.45 10 109 10 096 –0.12 270 894 269 680 –0.45 54 605 53 846 –1.39 274 389 273 160 –0.45 64 714 63 943 –1.19
Sweden 2 024 1 880 –7.12 2 069 1 321 –36.16 62 229 57 920 –6.92 13 709 13 334 –2.73 64 253 59 800 –6.93 15 777 14 654 –7.12
Switzerland NO 0 – 1 032 298 –71.11 NO 0 – 309 213 –31.10 NO 0 – 1 341 511 –61.89
Turkey 1 228 9 880 704.26 16 854 10 352 –38.58 37 572 37 200 –0.99 4 386 4 345 –0.93 38 800 47 080 21.34 21 240 14 697 –30.81
Ukraine 131 360 174.93 630 1 448 130.07 203 0 – 856 0 – 334 360 7.68 1 486 1 448 –2.52
United Kingdom of Great
Britain and Northern Ireland 3 928 3 480 –11.41 22 099 26 710 20.87 47 238 42 360 –10.33 54 725 54 528 –0.36 51 166 45 840 –10.41 76 824 81 238 5.75
United States of America 81 619 20 502 –74.88 260 446 143 775 –44.80 389 502 423 346 8.69 86 564 181 178 109.30 471 121 443 848 –5.79 347 010 324 953 –6.36
IEA data for France includes data for Monaco, but excludes data for the following overseas territories: Guadeloupe, Guyana, Martinique, New Caledonia, French Polynesia, Reunion and Saint Pierre Miquelon.
IEA data for the Netherlands are only for the European part.
a Data provided by IEA on 27 May 2016. Data of OECD countries correspond to the preliminary 2016 edition of the IEA World Energy Balances, while non-OECD countries’ data are still provisional.
b Geographical coverage of IEA data:
IEA data for Denmark does not include Faroe Islands and Greenland.
No IEA data for Liechtenstein are available. These data are not included in the data of Switzerland.
(TJ) (TJ) (TJ) (TJ) (TJ) (TJ)
Domestic Navigation International Navigation Total
Residual fuel oil Gas / diesel oil Residual fuel oil Gas / diesel oil Residual fuel oil Gas / diesel oil
24

Table 1.10
Fugitive emissions from fuels: coal mining and handling - CH4 (2014)
IEAb
Underground
mines
Surface
minesTotal Total Difference
Mining
activities
Post-mining
activities
Mining
activities
Post-mining
activities
(%) (%)
IPCC default EFc
12.06
(6.70-16.75)
1.68
(0.60-2.68)
0.8
(0.20-1.34)
0.07
(0-0.13)
Australia 4.43 T2, T3 CS, PS 120 505 625 489 –21.84 5.3 0.36 0.46 IE, NA
Austria – NA NA NO NO NO 0.001 – NO NO NO NO
Belarus – NA NA NO NO NO 1.4 – NO NO NO NO
Belgium – NA NA NO NO NO 0 – NO NO NO NO
Bulgaria 1.46 T1 D 0.47 31 31 31 0 12 1.7 0.80 0.067
Canada 0.18 CS CS 1.1 90 91 69 –23.97 2.0 IE, NA 0.54 IE, NA
Croatia – NA NA NO NO NO 0 – NO NO NO NO
Cyprus – NA NA NO NO NO 0 – NO NO NO NO
Czech Republic 2.49 T1, T2 CS, D 8.7 38 47 47 0 8.8 1.6 0.77 0.067
Denmark (KP) – NA NA NO NO NO – NO NO NO NO
Denmark (Convention) – NA NA NO NO NO 0 – NO NO NO NO
Estonia – NA NA NO NO NO 21 – NO NO NO NO
European Union (KP) 0.53 95 405 500 – 6.0 1.5 0.43 0.026
European Union (Convention) 0.53 95 405 500 539 7.82 6.0 1.5 0.43 0.026
Finland – NA NA NO NO NO 6.7 – NO NO NO NO
France (KP) 0.00 NA NA NO NO NO – NO NO NO NO
France (Convention) 0.00 NA NA NO NO NO 0 – NO NO NO NO
Germany 0.30 T2, T3 CS 7.6 178 186 187 0.38 13 0.58 0.011 IE, NA
Greece 1.09 T1 D NO 51 51 51 0 NO NO 0.87 IE, NO
Hungary 0.11 CS, T1, T2 CS, D 0.60 9.0 9.6 9.6 0 0.62 0.062 NO NO
Iceland – NA NA NO NO NO 0 – NO NO NO NO
Ireland 0.03 T1 D NO NO NO 4.6 – NO NO NO NO
Italy 0.01 T1 D 0.086 NO 0.086 0.086 0 10 0.90 NO NO
Japan 0.04 T1, T2, T3 CS, D 0.54 0.78 1.3 0 – 2.8 1.7 0.80 0.067
Kazakhstan 8.55 T1, T2, T3 CR, CS 11 103 114 114 0.00 26 0.65 7.6 NO
Latvia – NA NA NO NO NO 0.005 – NO NO NO NO
Liechtenstein – NA NA NO NO NO – NO NO NO NO
Lithuania – NA NA NO NO NO 0.1 – NO NO NO NO
Luxembourg – NA NA NO NO NO 0 – NO NO NO NO
Malta – NA NA NA NA NA 0 – NO NO NO NO
Monaco
Netherlands – NA NA NO NO NO 0 – NO NO NO NO
New Zealand 0.24 T1 D 0.23 3.7 4.0 4.0 0.02 15 1.6 1.0 0.067
Norway 0.20 T2 CS 0.12 2.4 2.5 1.7 –32.91 7.2 IE, NO 0.54 IE, NO
Poland 3.11 T1 D 66 64 130 136 4.96 4.6 1.7 0.80 0.067
Portugal 0.01 T1 D NO NO NO 0 – NO NO NO NO
Romania 0.54 T1 D 0.30 23 24 24 0.01 12 1.7 0.80 0.067
Russian Federation 2.14 T1, T2 CS, D 105 254 359 334 –6.91 12 2.0 3.7 0.13
Slovakia 0.94 T2 CS 2.2 NO 2.2 2.2 0.01 6.4 0.60 NO NO
Slovenia 1.30 T2, T3 CS, D, PS 3.1 NO 3.1 3.1 –0.01 2.0 0.67 NO NO
Spain 0.07 CS, NE, T2 CS 2.3 2.8 5.1 3.9 –22.98 2.6 0.79 0.079 0.024
Sweden – NA NA NO NO NO 0.45 – NO NO NO NO
Switzerland – NA NA NO NO NO 0 – NO NO NO NO
Turkey 1.25 T1 D 17 48 65 65 0 12 1.7 0.001 0.000
Ukraine 5.20 T1, T2, T3 CS, D, M 68 C C 46 – 11 1.2 0.80 0.067 United Kingdom of Great
Britain and Northern Ireland 0.31 T2, T3 CS 3.7 8.0 12 12 –0.01 14 1.2 0.34 IE, NO
United States of America 1.05 T2, T3 CS 322 584 906 906 –0.00 8.2 0.84 0.66 0.14
(kg/t)
b Data provided by IEA on 27 May 2016. Data of OECD countries correspond to the preliminary 2016 edition of the IEA World Energy Balances, while non-OECD countries’ data are still provisi onal.
c Source of default emission factors: 2006 IPCC Guidelines for National Greenhouse Gas Inventories Volume 2 Chapter 4 Fugitive Emissions, pages 4.12 to 4.19. (Tier 1).
Share of
national
totala
Methods and EF usedActivity data CH4 IEF
CRF Underground mines Surface mines
Methods EF
(Mt)
a The national total includes indirect CO2 emissions from the atmospheric oxidation of CH4, CO and NMVOCs for the following Parties: Canada, Czech Republic, Denmark (KP), Denmark (Convention), European Union (KP), European
Union (Convention), Finland, France (KP), France (Convention), Ireland, Latvia, Netherlands, Portugal and Switzerland.
25
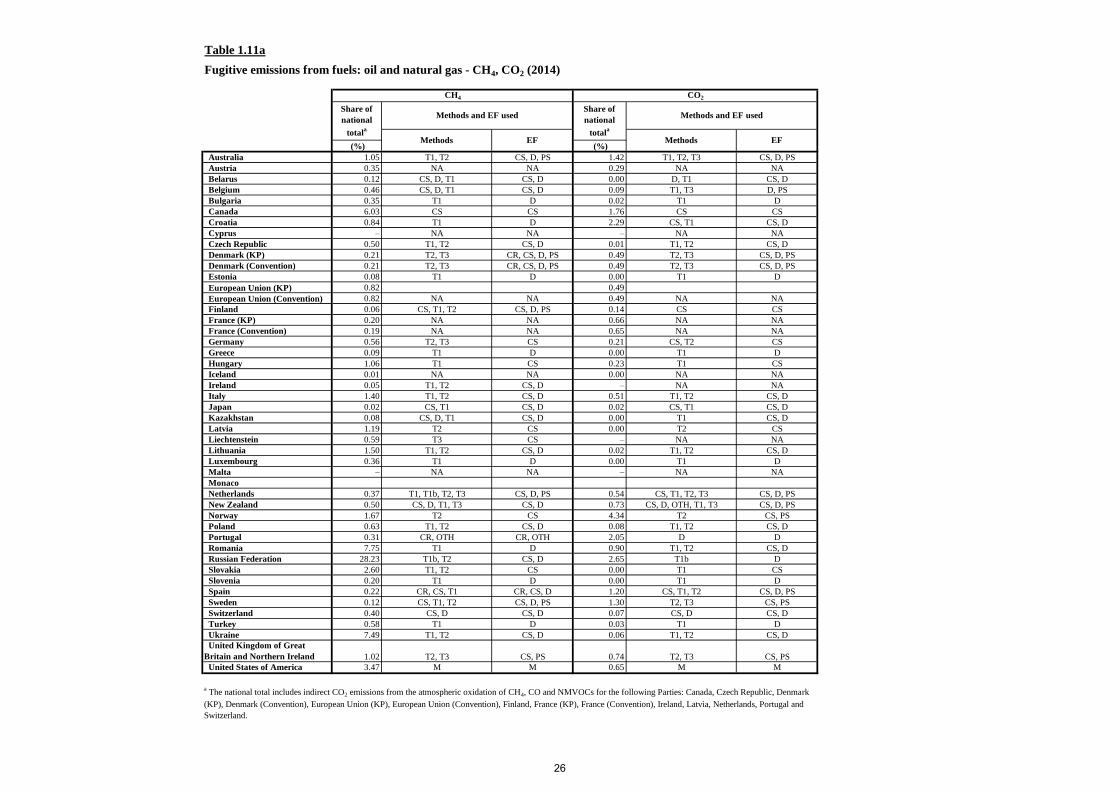
Table 1.11a
Fugitive emissions from fuels: oil and natural gas - CH4, CO2 (2014)
(%) (%)
Australia 1.05 T1, T2 CS, D, PS 1.42 T1, T2, T3 CS, D, PS
Austria 0.35 NA NA 0.29 NA NA
Belarus 0.12 CS, D, T1 CS, D 0.00 D, T1 CS, D
Belgium 0.46 CS, D, T1 CS, D 0.09 T1, T3 D, PS
Bulgaria 0.35 T1 D 0.02 T1 D
Canada 6.03 CS CS 1.76 CS CS
Croatia 0.84 T1 D 2.29 CS, T1 CS, D
Cyprus – NA NA – NA NA
Czech Republic 0.50 T1, T2 CS, D 0.01 T1, T2 CS, D
Denmark (KP) 0.21 T2, T3 CR, CS, D, PS 0.49 T2, T3 CS, D, PS
Denmark (Convention) 0.21 T2, T3 CR, CS, D, PS 0.49 T2, T3 CS, D, PS
Estonia 0.08 T1 D 0.00 T1 D
European Union (KP) 0.82 0.49
European Union (Convention) 0.82 NA NA 0.49 NA NA
Finland 0.06 CS, T1, T2 CS, D, PS 0.14 CS CS
France (KP) 0.20 NA NA 0.66 NA NA
France (Convention) 0.19 NA NA 0.65 NA NA
Germany 0.56 T2, T3 CS 0.21 CS, T2 CS
Greece 0.09 T1 D 0.00 T1 D
Hungary 1.06 T1 CS 0.23 T1 CS
Iceland 0.01 NA NA 0.00 NA NA
Ireland 0.05 T1, T2 CS, D – NA NA
Italy 1.40 T1, T2 CS, D 0.51 T1, T2 CS, D
Japan 0.02 CS, T1 CS, D 0.02 CS, T1 CS, D
Kazakhstan 0.08 CS, D, T1 CS, D 0.00 T1 CS, D
Latvia 1.19 T2 CS 0.00 T2 CS
Liechtenstein 0.59 T3 CS – NA NA
Lithuania 1.50 T1, T2 CS, D 0.02 T1, T2 CS, D
Luxembourg 0.36 T1 D 0.00 T1 D
Malta – NA NA – NA NA
Monaco
Netherlands 0.37 T1, T1b, T2, T3 CS, D, PS 0.54 CS, T1, T2, T3 CS, D, PS
New Zealand 0.50 CS, D, T1, T3 CS, D 0.73 CS, D, OTH, T1, T3 CS, D, PS
Norway 1.67 T2 CS 4.34 T2 CS, PS
Poland 0.63 T1, T2 CS, D 0.08 T1, T2 CS, D
Portugal 0.31 CR, OTH CR, OTH 2.05 D D
Romania 7.75 T1 D 0.90 T1, T2 CS, D
Russian Federation 28.23 T1b, T2 CS, D 2.65 T1b D
Slovakia 2.60 T1, T2 CS 0.00 T1 CS
Slovenia 0.20 T1 D 0.00 T1 D
Spain 0.22 CR, CS, T1 CR, CS, D 1.20 CS, T1, T2 CS, D, PS
Sweden 0.12 CS, T1, T2 CS, D, PS 1.30 T2, T3 CS, PS
Switzerland 0.40 CS, D CS, D 0.07 CS, D CS, D
Turkey 0.58 T1 D 0.03 T1 D
Ukraine 7.49 T1, T2 CS, D 0.06 T1, T2 CS, D
United Kingdom of Great
Britain and Northern Ireland 1.02 T2, T3 CS, PS 0.74 T2, T3 CS, PS
United States of America 3.47 M M 0.65 M M
CH4 CO2
Share of
national
totala
Methods and EF usedShare of
national
totala
Methods and EF used
Methods EF Methods EF
a The national total includes indirect CO2 emissions from the atmospheric oxidation of CH4, CO and NMVOCs for the following Parties: Canada, Czech Republic, Denmark
(KP), Denmark (Convention), European Union (KP), European Union (Convention), Finland, France (KP), France (Convention), Ireland, Latvia, Netherlands, Portugal and
Switzerland.
26

Table 1.11b
Fugitive emissions from fuels: oil and natural gas - oil - CH4, CO2 (2014)
CH4 IEFa
CO2 IEFa
CH4 IEFa
CO2 IEFa
CH4 IEFa
CO2 IEFa
CH4 IEFa
CO2 IEFa
Unit Description Unit Description Unit Description Unit Description
IPCC default EFb
10^3 m^3 total oil production(5.4)(PL)
(25)(TT)
AustraliaNO NO t Quantity of Oil Flared 2 673 NA, NO PJ Crude Oil and ORF
Produced
555 NA, NO PJ Crude oil transport
domestic
567 79 684 PJ Crude Oil refined and
stored
Austria IE IE, NO Mt Mt crude oil IE IE, NO Mt Mt crude oil 5.4 0.49 Mt 1000 m3 crude oil 31 663 NA, NO Mt Mt crude oil Input
Belarus NO NO NE number of wells drilled 29 891 5 566 NE PJ of oil produced 111 10 NE PJ oil loaded in tankers 1 400 NA NE PJ oil refined
Belgium NO NO PJ NO NO PJ 150 14 PJ 52 NA, NO PJ
Bulgaria 194 9 102 103m3 2 200 280 103m3 25 2.3 103m3 22 NO 103m3
CanadaIE IE, NA NA NA 1 852 1 363 10^3 m^3 Total Crude Oil Production 0.078 0.12 10^3 m^3 Total crude oil production 30 7.1 TJ Refinery energy
consumption
Croatia 194 9 102 1000 m3 total oil production 2 546 41 225 1000 m3 total oil production 5.4 0.49 1000 m3 total oil transported by
pipelines
22 NA, NO 1000 m3 oil refined
CyprusNO NO NO NO NO NO NE NE, NO NE NO NO NO Crude Oil refined (10^3
m3)
Czech RepublicNO NO PJ (e.g. number of wells drilled) 4 746 7 576 PJ (e.g. PJ of oil produced) 146 13 PJ (e.g. PJ oil loaded in
tankers)
585 NE, NO PJ (e.g. PJ oil refined)
Denmark (KP) NO NO m3 (e.g. numbers of wells drilled) 0.087 0.001 Mg Oil produced IE IE, NO Mg Oil produced 0.090 NA Mg Oil refined
Denmark (Convention)NO NO dnm:m3 grl:NO
fro:WasNull
0.087 0.001 dnm:Mg grl:NO
fro:WasNull
IE, NO IE, NO dnm:Mg grl:NO
fro:WasNull
0.090 NA, NO dnm:Mg grl:NO
fro:WasNull
Estonia NO NO NA Exploration NO NO NA Production NO NO NA Transport NO NO NA Refining/Storage
European Union (KP) NE NE NE NE NE NE NE NE
European Union (Convention) NE NE NE NE NE NE NE NE
Finland NO NO NO NO NO NO NO NO NO 25 NO kt kt oil refined
France (KP) NO NO PJ NO 54 578 7 201 PJ Oil produced 61 5.6 PJ Oil loaded 5.9 1 092 985 PJ Oil refined
France (Convention) NO NO PJ NO 54 578 7 201 PJ Oil produced 61 5.6 PJ Oil loaded 5.9 1 092 985 PJ Oil refined
Germany 64 0.48 number number of wells drilled 0.20 0.12 t oil produced 0.006 NA, NO t oil transported 0.089 3.2 t oil refined
Greece NO NO 0.69 0.050 kt 27 NA, NO kt 26 IE, NO kt
Hungary IE IE, NO NA 1 808 130 1000 m3 conventional oil production
(thousand m3)
10 46 1000 m3 Oil transported by pipeline
(thousand m3)
22 NA, NO 1000 m3 Oil refined (thousand m3)
Iceland NO NO NO NO NO NO NO NO
Ireland NO NO PJ NO NO PJ NO NO PJ 110 NO PJ
Italy NO NO NA Wells drilled 1 872 321 Gg Oil produced 6.2 0.56 Gg Oil transported 8.7 22 158 Gg Oil refined
Japan IE IE, NO Activity data 1 314 983 94 971 106 m3 Oil produced 74 494 5 153 106 m3 Oil & condensate produced 2 628 NE, NO 106m3 Oil refined
Kazakhstan NO NO na 2 720 28 na 5.5 4.8 NA 0.1 NA NA
Latvia NO NO kt Exploration NO NO kt Production NO NO kt Transport NO NO kt Refining/Storage
Liechtenstein NO NO no number of wells drilled NO NO no oil produced NO NO no oil loaded in tankers NO NO no oil refined
Lithuania 270 5 700 Number Wells drilled, number 1.5 0.11 thous.m3 Oil produced, thous.m3 5.4 0.49 thous.m3 Oil transported, thous.m3 745 NO PJ Oil refining, PJ
Luxembourg NO NO NA number of wells drilled NO NO NA oil produced NO NO NA oil loaded in tankers NO NO NA oil refined
Malta NO NO NO number of wells drilled NO NO NO oil produced NO NO NO oil loaded in tankers NO NO NO oil refined
Monaco
Netherlands IE IE, NO PJ IE IE, NO PJ Mg 79 396 986 PJ
New Zealand 0.000 0.028 number of wells drilled 0.001 0.000 m3 0.030 0.003 m3 0.022 NA, NO m3
Norway IE IE, NO PJ IE IE, NO 10^3 m^3 Oil produced 1 589 26 863 PJ Oil loaded in tankers 8 335 1 469 690 PJ Oil refined
Poland NA NA NA NA 61 800 6 315 000 PJ Production 6.3 0.57 oil ltransported by pipeline 1 126 NA PJ oil refined
Portugal NO NO NO NO NO NO 52 486 NO Mt Petroleum Products
Transported
18 826 21 113 000 Mt Petroleum Products Stored
Romania 48 309 2 282 527 oil produced 445 120 56 551 oil produced 149 13 oil refined 880 IE, NO oil refined
Russian Federation 1 702 80 417 10^3 m3 Oil produced 19 600 2 490 10^3 m3 Oil and Condensate
produced
5.4 0.49 10^3 m3 Oil transpoted by pipeline 22 NE, NO 10^3 m3 Oil refined
Slovakia NO NO NO 3 600 260 kt Production 5.4 0.49 kt Transfer 41 NO kt Refining/Storage
Slovenia NO NO 1000 m3 NO NO 1000 m3 Conventional oil produced NA 430 1000 m3 Consumption of LPG NO NA, NO 1000 m3 Oil refined
Spain NO NO number 1 706 000 317 998 Tg Crude oil produced 27 000 NA, NO Tg Transport of crude oil 382 50 735 162 Tg Oil refined
Sweden 1.00 199 213 TJ Amount of feedstock for
hydrogen production
NO NO NA 745 NE, NO PJ Amount of transported
crude oil
20 881 13 392 332 Mt Amount of consumed crude
oil
Switzerland NO NO NO NO 152 NA, NO PJ 1 042 NA, NO PJ Crude oil used
Turkey NO NO NO 3 600 260 10^3 m^3 oil production 3.6 140 10^3 m^3 oil transported by pipeline 4.1 NA, NO 10^3 m^3 (petroleum refining)
Ukraine 950 2 109 Number number of wells drilled and
operated
30 001 2 150 10^3 m^3 oil produced 5.4 0.49 10^3 m^3 Crude oil transported by
pipeline
880 NA, NE PJ Oil refined
United Kingdom of Great
Britain and Northern Ireland
25 3 200 t Exploration drilling: fuel use 4 257 35 389 PJ Oil produced 0.012 NO t Oil loading 2.3 NO PJ Refinery throughput
United States of America IE NA NA 847 468 201 451 10^6 Bbl(oil US) 1 397 NA 10^6 Bbl(oil US) 4 060 505 938 10^6 Bbl(oil US)
Activity data Activity data Activity data Activity data
Oil
Exploration Production Transport Refining (R) / Storage (S)
kg/unit kg/unit kg/unit kg/unit
a The units of the implied emission factors (IEF) vary from Party to Party depending on the unit of the activity data used. The unit of the IEF is kg/unit of activity data.
b Source of default emission factors: 2006 IPCC Guidelines for National Greenhouse Gas Inventories Volume 2 Chapter 4 Fugitive Emissions. Table 4.2.4. Tier 1 Emission Factors in developed coutries. Values converted from Gg to kg.
27

Table 1.11c
Fugitive emissions from fuels: oil and natural gas - natural gas - CH4, CO2 (2014)
CH4 IEFa
CO2 IEFa
CH4 IEFa
CO2 IEFa
CH4 IEFa
CO2 IEFa
CH4 IEFa
CO2 IEFa
CH4 IEFa
CO2 IEFa
Unit Description Unit Description Unit Description Unit Description Unit Description
IPCC default EFb (380 to
2300)(140 to 820) 10^6 m^3 Gas produced
(150 to
1030)(12 to 320) 10^6 m^3 Gas produced
(66-480)(T)
(25)(S)
(0.88)(T)
(0.11)(S)10^6 m^3 marketable gas 1 100 51 10^6 m^3 utility sales
Australia 1 368 IE, NO PJ Natural gas produced IE IE, NO NA NA 414 20 km Length of Pipeline 144 831 8 234 PJ Utility sales IE IE, NO NA NA
Austria 4 023 113 873 Mm3 Mm3 natural gas NA 63 352 Mm3 Mm3 natural gas 539 25 km km pipeline length 51 2.3 km km distribution network
length
NO NO Mm3 Mm3 natural gas stored
Belarus 126 818 4 154 NE PJ gas produced IE IE, NO NE 38 483 1 181 NE PJ gas consumed IE IE, NA NE PJ gas consumed NO NO NE PJ gas consumed
Belgium NO NO PJ NO NO PJ 11 371 NA, NO PJ 28 210 907 PJ NO NO PJ Bulgaria 1 340 48 106m3 590 166 106m3 273 0.16 106m3 1 100 51 106m3 NO NO NO
Canada 488 13 Gl Gross new production of
Natural Gas
57 39 Gl Gross new production of
Natural Gas
8.9 0.12 10^9 m^3 km Transmission - Cubic Metre
KM
6.3 0.40 10^9 m^3 km Distribution - Cubic Metre
KM
1 339 260 number Number of Spills + Total
Wells
Croatia 1 341 228 542 1000000 m3 gas produced 592 43 166 1000000 m3 gas produced 480 4.1 1000000 m3 marketable gas 1 100 51 1000000 m3 utility sales NO NO NO Cyprus NO NO NO NO NO NO NO NO NO NO NO NO NO NO NO
Czech Republic 38 649 15 PJ (e.g. PJ gas produced) NA NA, NO PJ 4 769 19 PJ (e.g. PJ gas consumed) 141 339 563 PJ (e.g. PJ gas consumed) IE IE, NO PJ (e.g. PJ gas consumed)
Denmark (KP) 380 14 10^6 m3 Gas produced NA NA 10^6 m3 Gas produced 29 0.87 10^6 m3 Gas transmission 66 1.9 10^6 m3 Gas distributed NO NO m3 Incl. In transmission
Denmark (Convention) 380 14 dnm:10^6 m3
grl:NO
NA, NO NA, NO dnm:10^6 m3
grl:NO
29 0.87 dnm:10^6 m3
grl:NO
66 1.9 dnm:10^6 m3
grl:NO
NO NO dnm:m3 grl:NO
fro:WasNull
EstoniaNO NO NA Production NO NO NA Processing 2 218 30 PJ Amount of the transmission of
Natural Gas
36 960 1 714 PJ Amount of natural gas
distributed
NO NO NA Other
European Union (KP) NE NE NE NE NE NE NE NE NE NE
European Union (Convention) NE NE NE NE NE NE NE NE NE NE Finland NO NO NO NA NO NA 1 508 NE, NO PJ PJ gas consumed 100 221 NE, NO PJ PJ gas distributed NO NO NO France (KP) IE IE, NO PJ NO 304 5 361 447 PJ Gas processed 9 418 116 PJ Gas consumed 14 891 183 PJ Gas consumed NO NO PJ NO
France (Convention) IE IE, NO PJ NO 304 5 361 447 PJ Gas processed 9 418 116 PJ Gas consumed 14 891 183 PJ Gas consumed NO NO PJ NO
Germany 0.17 0.11 1000 m³ gas produced 0.11 138 1000 m³ gas produced 2 146 NE, NO km length of transmission
pipelines
175 NE, NO km length of distribution
pipelines
19 NA, NO TJ gas consumed
Greece 1 930 214 mil_m3 IE IE, NO mil_m3 298 0.99 mil m3 1 100 51 mil m3 IE IE, NO
Hungary 1 340 48 million m3 Gas production (million
m3)
954 251 million m3 Sweet gas plants-raw gas
feed (million m3)
298 0.99 million m3 Marketable gas (million m3) 1 100 51 million m3 Utility sales (million m3) NO NO NO
Iceland NO NO NO NO NO NO NO NO NO
Ireland 70 643 NO PJ IE NO PJ IE NO PJ 11 085 NO PJ NO NO PJ
Italy 906 82 Mm3 Gas produced 406 320 Mm3 Gas produced 508 11 Mm3 Gas transported 5 528 123 Mm3 Gas distributed NO NO NA other
Japan 2 188 77 106m3 Gas produced 755 235 106m3 Gas produced 193 NA, NO 106m3 Gas sold 9.5 NA, NO 106m3 Town gas sold IE NA, NO Activity data
Kazakhstan 2.9 0.095 NA NA NA NA 0.88 0.005 NA 1.8 0.026 NA NA NA NA
Latvia NO NO m3 Production NO NO m3 Processing 0.68 0.002 m3 Transmission and storage 0.68 0.002 m3 Distribution 0.68 0.002 m3 Other
Liechtenstein NO NO no gas produced NO NO NO gas produced 165 NO km gas consumed 51 NO TJ gas consumed NO NO TJ gas produced
Lithuania NO NO NO NO NO NO 970 900 800 thous.t Natural gas leakages 970 900 800 thous.t Natural gas leakages IE NA, NO thous.t Natural gas leakages
Luxembourg NO NO NA gas produced NO NO NA NO 13 0.024 TJ gas consumed 30 1.4 TJ gas consumed NO NO NA NO
Malta NO NO NO gas produced NO NO NO NO NO NO NO gas consumed NO NO NO gas consumed NO NO NO
Monaco
Netherlands PJ IE IE, NO PJ PJ 10^3 km IE NE, NO PJ
New Zealand 954 34 Mm3 NO NA NA 447 303 52 947 TJ 14 025 2 195 TJ NA NA NA
Norway IE IE, NO 10^6 m^3 Gas produced IE IE, NO PJ NO NO PJ NE NO PJ NO NO PJ
Poland 66 880 2 384 PJ Production 29 951 33 472 PJ 13 958 26 PJ gas consumed 31 986 1 483 PJ gas consumed 727 3.2 PJ NA
Portugal NO NO NO NO NO NO 1 704 4 682 ton NG Imported NO NO ton NG
Distributued
NO NO NO
Romania 12 190 97 gas produced IE IE, NO gas produced and processed 633 1.4 gas produced 1 800 96 gas supplied 139 510 NO gas consumed
Russian Federation 12 190 97 10^6 m3 Natural Gas produced 790 250 10^6 m3 Natural Gas produced 6 045 1.6 10^6 m3 Marketable gas 1 800 95 10^6 m3 Gas consumed NE NE, NO NA
Slovakia 2 300 82 mil m3 Production/Processing 1 030 320 mil m3 480 0.88 mil m3 Transfer 1 100 51 mil m3 Distribution 25 0.11 mil m3 Storage
Slovenia 1.3 0.048 1000 m3 Gas production NO NO 1000 m3 0.38 0.001 1000 m3 Marketable gas 1.1 0.051 1000 m3 Utility sale NO NO 1000 m3
Spain 70 658 2 440 PJ PJ gas produced (NCV) IE IE, NO PJ 1 335 41 PJ PJ gas (NCV) 23 703 728 PJ PJ gas consumed (NCV) NE NE, NO (e.g. PJ gas consumed)
Sweden NO NO NA NO NO NA 6.8 0.15 km Length of gas transmission
network
NA NA NA NO NO NA
Switzerland NO NO PJ gas produced NO NO 17 888 000 NA, NO PJ See documentation box 17 888 000 NA, NO PJ NO NA, NO PJ
Turkey 2 300 82 10^6 m^3 Natural gas production 1 030 320 10^6 m^3 Natural gas production 462 0.85 10^6 m^3 Natural gas transmission by
pipeline
1 100 51 10^6 m^3 Natural gas distribution NO NO NO
Ukraine 12 190 97 10^6 m^3 Natural Gas Produced 790 250 10^6 m^3 Natural Gas Processed 1 031 457 7 056 Mt gas transmitted NA NA 10^3 km Length of natural gas
distribution network
222 299 487 PJ Residential and Non-
residential Gas Consumed
United Kingdom of Great
Britain and Northern Ireland
IE IE, NO PJ Gas produced 2 190 221 187 PJ Gas produced 11 0.46 GWh Natural gas supply 327 13 GWh Natural gas supply NO NO NA
United States of America 171 628 956 894 10^9 ft^4 IE IE, NA NA 48 030 1 449 10^9 ft^4 16 634 524 10^9 ft^4 NA NA NA
a The units of the implied emission factors (IEF) vary from Party to Party depending on the unit of the activity data used. The unit of the IEF is kg/unit of activity data.
b Source of default emission factors: 2006 IPCC Guidelines for National Greenhouse Gas Inventories Volume 2 Chapter 4 Fugitive Emissions. Table 4.2.4. Tier 1 Emission Factors in developed coutries. Values converted from Gg to kg.
Activity data Activity data Activity data Activity data Activity data
kg/unit kg/unit kg/unit kg/unit kg/unit
Natural Gas
Production Processing Transmission and Storage Distribution Other
28

Table 1.11d
Fugitive emissions from fuels: oil and natural gas - venting and flaring - CH4, CO2 (2014)
CH4 IEFa
CO2 IEFa
CH4 IEFa
CO2 IEFa
CH4 IEFa
CH4 IEFa
CO2 IEFa
CH4 IEFa
CO2 IEFa
CH4 IEFa
CO2 IEFa
unit Description unit Description kg/unit unit Description unit Description unit Description unit Description
IPCC default EFb
AustraliaIE IE, NO NA NA 33 333 2 800 000 kt Quantity of Gas Flared 13 753 PJ Natural gas, crude oil
and ORF produced
4 565 2 588 410 kt Natural gas, crude oil
and ORF produced
NO NO NA NA NO NO NA NA
Austria NO NO NA NO NO NA NO NA NO NO NA NO NO NA NO NO NA
Belarus NA NA, NO NA PJ oil produced NA NA, NO NA PJ gas consumption NA NA PJ gas produced NA NA, NO NA PJ gas consumption NA NA, NO NA Venting 0.003 0.51 na Flaring
Belgium NO NO PJ NO NO PJ 13 PJ NO NO PJ NO NO PJ IE NA PJ
Bulgaria 8 700 1 800 103m3 21 34 000 103m3 182 106m3 2.8 4 200 106m3 NO NO NO NO NO NO
Canada 4 408 22 929 10^3 m^3 Total crude oil production 5 961 1 736 472 Gl Flared Gas 1 557 Gl Gross new production
of Natural Gas
2 659 438 469 Gl Flared Gas 50 1.1 number Number of wells
drilled
131 21 953 number Number of wells drilled
Croatia 25 2.3 1000 m3 IE IE, NO 1000 m3 IE 1000000 m3 IE IE, NO 1000000 m3 NO NO NO NO NO NO
Cyprus NE NE, NO NE NE, NO NO NO NO NO NO NO NO
Czech Republic 235 390 48 701 PJ (e.g. PJ oil produced) 568 919 913 PJ (e.g. PJ gas consumption) NO PJ (e.g. PJ gas produced) NO NO PJ (e.g. PJ gas
consumption)
NO NO PJ NO NO PJ
Denmark (KP)NO NO GJ (e.g. PJ oil produced) 0.018 53 GJ Refinery gas consumption 15 GJ Venting in gas
terminals
0.10 57 GJ Gas consumption NO NO GJ 0.23 59 GJ
Denmark (Convention)NO NO dnm:GJ grl:NO
fro:WasNull
0.018 53 dnm:GJ grl:NO
fro:WasNull
15 dnm:GJ grl:NO
fro:WasNull
0.10 57 dnm:GJ grl:NO
fro:WasNull
NO NO dnm:GJ grl:NO
fro:WasNull
0.23 59 dnm:GJ grl:NO
fro:WasNull Estonia NO NO NA Oil NO NO NA Oil NO NA Gas NO NO NA Gas NO NO NA Combined NO NO NA Combined
European Union (KP) NE NE NE NE NE NE NE NE NE NE NE
European Union (Convention) NE NE NE NE NE NE NE NE NE NE NE
Finland NO NO NO 0.73 52 985 TJ used fuels, TJ NO NO NO NO NO NO NO NO NO NO NO
France (KP) 19 942 2 631 PJ Oil produced 25 146 007 PJ Consumption IE Gg Gas produced 6 220 2 190 432 Gg Consumption NO NO PJ Oil and Gas produced NO NO PJ Consumption
France (Convention) 19 942 2 631 PJ Oil produced 25 146 007 PJ Consumption IE Gg Gas produced 6 220 2 190 432 Gg Consumption NO NO PJ Oil and Gas produced NO NO PJ Consumption
Germany IE IE, NO 1.1 3 795 kt oil refined IE IE 1.8 m^3 gas flared IE IE, NO IE IE, NO
Greece 844 111 kt 29 48 045 kt 182 mil m3 2.8 4 200 mil_m3 NO NO NO NO
Hungary 720 95 1000 m3 Conventional oil
production (thousand m3)
331 67 509 1000 m3 Conventional oil
production (thousand m3)
1 662 million m3 Sour gas plants-raw
gas feed (million m3)
2.7 4 051 million m3 Gas production
(million m3)
IE IE, NO NO IE IE, NO NA
Iceland NO NO NO NO NO NO NO NO NO NO NO
Ireland NO NO PJ NO NO PJ IE PJ NO NO PJ Natural gas flaring NO NO PJ NO NO PJ
Italy 180 2 061 Gg Oil produced 343 48 072 Gg Oil produced NA Mm3 Gas produced 2 036 4 200 Mm3 Gas produced NO NO NA Combined NO NO NO Combined
Japan 720 000 95 000 106 m3 Oil produced 25 000 41 000 000 106 m3 Oil produced IE 106m3 Gas produced in
relevant facilities
2.0 3 000 106m3 Gas produced IE IE, NO Activity data 271 5 700 wells Number of wells tested
Kazakhstan NA NA NA NA NA, NO NA NA NA NA NA NA NA NA na
Latvia NO NO kt Oil NO NO kt Oil 0.68 m3 Gas NO NO kt Gas NO NO kt Combined NO NO kt Combined
Liechtenstein NO NO no oil produced NO NO no gas consumed NO no gas produced NO NO no gas consumed NO NO no gas produced NO NO no Gas/Oil Produced
Lithuania 720 95 thous.m3 Oil produced, thous.m3 25 41 000 thous.m3 Oil produced, thous.m3 IE thous.t NO NO NO NO NO NO NO NO NO
Luxembourg NO NO NA oil produced NO NO NA gas consumed NO NA gas produced NO NO NA gas consumed NO NO NA combined oil and gas
production
NO NO NA combined oil and gas
consumption
Malta NO NO NO oil produced NO NO NO gas consumed NO NO gas produced NO NO NO gas consumed NO NO NO NO NO NO NO NO
Monaco
Netherlands 10^6 m^3 10^6 m^3 PJ PJ IE IE PJ IE IE PJ
New Zealand IE IE NA IE IE NA IE NA IE IE NA 15 861 NA, NO TJ 424 52 315 TJ
Norway IE IE, NO PJ 9 456 75 650 118 PJ Oil flared IE PJ 82 896 72 790 383 PJ Gas flared 2 880 16 899 PJ Oil and gas produced IE IE, NO PJ
Poland 825 164 Gg oil produced 47 619 29 Gg oil produced IE NA NA 1 200 12 951 10^6m3 gas production NO NA, NO NA NA NO NA, NO NA NA
Portugal NO NO NO 1 399 2 543 462 kt fuel flared Flared Amount NO NO NO NO NO NO NO NO NO NO NO
Romania 293 769 61 028 oil produced 710 1 149 538 gas consumed 392 gas produced 11 1 800 gas consumed NA NA, NO gas and oil produced NA NA, NO gas and oil combined
Russian Federation 10 350 2 150 10^3 m3 Oil and Condensate
produced
12 000 2 000 036 10^6 m3 Associated gas flaring IE 10^6 m3 Marketable Gas 2.3 3 550 10^6 m3 Natural Gas production NE NE, NO NA NE NE, NO NA
Slovakia 720 95 kt Venting oil 25 41 000 kt Flaring oil 2 851 mil m3 Venting gas 2.0 3 000 mil m3 Flaring gas NO NO NA NO NO NA
Slovenia NA NA, NO 1000 m3 Conventional oil produced NA NA, NO 1000 m3 Conventional oil produced 0.25 1000 m3 Marketable gas 0.001 1.2 1000 m3 Gas production NO NO 1000 m3 NO NO 1000 m3
Spain NO NO (e.g. PJ oil produced) 500 3 394 127 Tg (e.g. PJ gas consumption) 16 933 208 PJ gas produced 5 538 81 597 982 PJ (e.g. PJ gas
consumption)
NO NO NO NO PJ
Sweden IE IE, NO NA 1.00 54 310 TJ Amount of gas flared NE NA 1.0 56 950 NA IE IE, NO NA NA NA, NO NA
Switzerland NO NO NA NA (please specify) NO NO NO NO NO NO NO
Turkey 720 95 10^3 m^3 (Oil production 219 50 102 10^3 m^3 Oil production 32 071 10^6 m^3 Natural gas production 2.0 3 000 10^6 m^3 Natural gas production NO NO NO NO NO NO
Ukraine 855 113 10^3 m^3 oil produced 30 48 500 10^3 m^3 oil produced IE NA gas transmission 2.3 3 550 10^6 m^3 Natural Gas Produced IE IE, NA NA __ IE IE, NA NA __
United Kingdom of Great
Britain and Northern Ireland
NA NA NA 10 2 547 Amount of gas flared NA NA 8.2 2 143 t Amount of gas flared IE IE, NO NA IE IE, NO NA
United States of America IE IE, NA NA IE IE, NA NA IE NA IE IE, NA NA IE IE, NA NA IE 54 706 667 10^9 ft^4
Activity data
Venting and flaring
Oil Gas Combined
Venting Flaring Venting Flaring Venting Flaring
Activity data Activity data Activity data Activity data Activity data
b Source of default emission factors: 2006 IPCC Guidelines for National Greenhouse Gas Inventories Volume 2 Chapter 4 Fugitive Emissions. Table 4.2.4. Tier 1 Emission Factors in developed coutries. Values converted from Gg to kg.
kg/unit kg/unit kg/unit kg/unit kg/unit
a The units of the implied emission factors (IEF) vary from Party to Party depending on the unit of the activity data used. The unit of the IEF is kg/unit of activity data.
29

Table 1.12
CO2 transport and storage (2014)
CO2 IEF Activity data CO2 IEF Activity data CO2 IEF Activity data
kg/kt (kt) kg/kt (kt) kg/kt (kt)
IPCC default EFa
(0.00014 to
0.014
Gg/year/km)
10^3 m^3 n.a. 10^3 m^3 n.a. 10^3 m^3
Australia NO NO NO NO NO NO
Austria NO NO NO NO NO NO
Belarus NO NO NO NO NO NO
Belgium NO NO NO NO NO NO
Bulgaria NO NO NO NO NO NO
Canada 46 2 175 NO NO NA NA
Croatia NO NO NO NO NO NO
Cyprus NO NO NO NO
Czech Republic NO NO NO NO NO NO
Denmark (KP) NO NO NO NO NO NO
Denmark (Convention) NO NO NO NO NO NO
Estonia NO NO NO NO NO NO
European Union (KP) NO NO NE, NO NE, NO NO NO
European Union (Convention) NO NO NE, NO NE, NO NO NO
Finland NO NO NO NO NO NO
France (KP) NO NO NO NO NO NO
France (Convention) NO NO NO NO NO NO
Germany NO NO NE, NO NE, NO
Greece NO NO NO NO
Hungary NO NO NO NO NO NO
Iceland NO NO
Ireland NO NO NO NO NO NO
Italy NO NO NO NO NO NO
Japan NO NO NE, NO NO
Kazakhstan
Latvia NO NO NO NO NO NO
Liechtenstein NO NO NO NO NO NO
Lithuania NO NO NO NO NO NO
Luxembourg NO NO NO NO NO NO
Malta NO NO NO NO
Monaco
Netherlands NO NO NO NO NO NO
New Zealand NO NO NO NO
Norway NO NO IE 2 490
Poland NO NO NO NO NO NO
Portugal NO NO NO NO NO NO
Romania NO NO NO NO
Russian Federation NA, NO NO NO NO NO NO
Slovakia NO NO NO NO NO NO
Slovenia NO NO NO NO NO NO
Spain NO NO NO NO NO NO
Sweden NO NO NO NO
Switzerland NO NO NO NO
Turkey NA, NO NA, NO NE, NO NE, NO NO NO
Ukraine NA NA NA NA NA NA
United Kingdom of Great
Britain and Northern Ireland
NO NO NO NO
United States of America NA, NE NE NE NE
Transport of CO2 Injection and storage Other
a Source of default emission factors: 2006 IPCC Guidelines for National Greenhouse Gas Inventories Volume 2 Chapter 5 Carbon Dioxide Transport, Injection and
Geological Storage. Table 5.2. Tier 1 Emission Factors for pipeline transport of CO2 from a CO2 capture site to the final storage site.
30

Figure 2.1
Contribution of subsectors to total GHG emissions in the Industrial processes and product use sectora, b
b Indirect CO2 emissions are excluded from the totals in this graph.
a In accordance with the UNFCCC reporting guidelines on annual inventories of Annex I Parties the year 1990 should be the base year for the estimation and reporting of inventories. However, in accordance with decisions 9/CP.2, 11/CP.4, and 7/CP.12 some Parties with economies in transition use base years other than 1990: Bulgaria (1988), Croatia (1990), Hungary (average
of 1985 to 1987), Poland (1988), Romania (1989) and Slovenia (1986).
0%
10%
20%
30%
40%
50%
60%
70%
80%
90%
100%
Aust
rali
a B
ase
yea
r
Aust
rali
a 201
4
Aust
ria
Bas
e yea
r
Aust
ria
201
4
Bel
arus
Bas
e y
ear
Bel
arus
20
14
Bel
giu
m B
ase
yea
r
Bel
giu
m 2
014
Bulg
aria
Bas
e y
ear
Bulg
aria
2014
Can
ada
Bas
e y
ear
Can
ada
2014
Cro
atia
Bas
e yea
r
Cro
atia
201
4
Cyp
rus
Bas
e y
ear
Cyp
rus
20
14
Cze
ch R
epu
bli
c B
ase
yea
r
Cze
ch R
epu
bli
c 2
014
Den
mar
k (
KP
) B
ase
yea
r
Den
mar
k (
KP
) 201
4
Den
mar
k (
Con
ven
tion
) B
ase
yea
r
Den
mar
k (
Con
ven
tion
) 201
4
Est
on
ia B
ase
yea
r
Est
on
ia 2
014
Eu
rop
ean U
nio
n (
KP
) B
ase
yea
r
Eu
rop
ean U
nio
n (
KP
) 2
014
Eu
rop
ean U
nio
n (
Conv
enti
on)
Bas
e…
Eu
rop
ean U
nio
n (
Conv
enti
on)
2014
Fin
land B
ase
yea
r
Fin
land 2
014
Fra
nce
(K
P)
Bas
e y
ear
Fra
nce
(K
P)
2014
Fra
nce
(C
onven
tio
n)
Bas
e y
ear
Fra
nce
(C
onven
tio
n)
20
14
Ger
man
y B
ase
yea
r
Ger
man
y 2
014
Gre
ece
Bas
e y
ear
Gre
ece
20
14
Hung
ary B
ase
yea
r
Hung
ary 2
01
4
Ice
lan
d B
ase
yea
r
Ice
lan
d 2
01
4
Ire
land B
ase
yea
r
Ire
land 2
014
Ita
ly B
ase
yea
r
Ita
ly 2
01
4
Jap
an B
ase
yea
r
Jap
an 2
014
Kaz
akhst
an B
ase
yea
r
Kaz
akhst
an 2
014
Lat
via
Bas
e yea
r
Lat
via
201
4
Lie
chte
nst
ein B
ase
yea
r
Lie
chte
nst
ein 2
01
4
Lit
huan
ia B
ase
yea
r
Lit
huan
ia 2
014
Lu
xem
bou
rg B
ase
yea
r
Lu
xem
bou
rg 2
01
4
Mal
ta B
ase
yea
r
Mal
ta 2
014
Mon
aco B
ase
yea
r
Mon
aco 2
01
4
Net
her
lan
ds
Bas
e yea
r
Net
her
lan
ds
2014
New
Zea
lan
d B
ase
yea
r
New
Zea
lan
d 2
01
4
Norw
ay B
ase
yea
r
Norw
ay 2
014
Pola
nd B
ase
yea
r
Pola
nd 2
01
4
Port
ug
al B
ase
yea
r
Port
ug
al 2
014
Rom
ania
Bas
e y
ear
Rom
ania
20
14
Russ
ian F
eder
atio
n B
ase
yea
r
Russ
ian F
eder
atio
n 2
014
Slo
vak
ia B
ase
yea
r
Slo
vak
ia 2
01
4
Slo
ven
ia B
ase
yea
r
Slo
ven
ia 2
01
4
Spai
n B
ase
yea
r
Spai
n 2
014
Sw
eden
Bas
e yea
r
Sw
eden
2014
Sw
itze
rlan
d B
ase
yea
r
Sw
itze
rlan
d 2
01
4
Tu
rkey
Bas
e yea
r
Tu
rkey
20
14
Ukra
ine
Bas
e y
ear
Ukra
ine
2014
Unit
ed K
ingdo
m B
ase
yea
r
Unit
ed K
ingdo
m 2
014
Unit
ed S
tate
s of
Am
eric
a B
ase
yea
r
Unit
ed S
tate
s of
Am
eric
a 2014
Per
centa
ge
Mineral Industry Chemical Industry Metal Industry Non-energy products from fuels and solvent use Electronics Industry Product uses as substitutes for ODS Other product manufacture and use
31

Table 2.1
Mineral industry - CO2 (2014)
Value
(%) (kt) (t/t) (%) (t/t) (%) (t/t)
IPCC default EFc
0.59-0.86 0.2
Australia T2 CS 0.60 Clinker Production 5 739 0.55 0.23 0.77 – IE, NO
Austria NA NA 2.15 Cement clinker 3 143 0.52 0.77 0.75 0.05 0.07
Belarus T1, T2 D 2.89 Used clincer production data 5 100 0.52 0.62 0.74 0.08 0.17
Belgium T3 CS, PS 2.32 Clinker Production 4 831 0.55 1.44 0.78 0.14 0.10
Bulgaria T1, T2 CS, D, PS 1.60 1 717 0.53 0.36 0.78 0.12 0.14
Canada T1, T2 CS, D 0.80 clinker production 10 930 0.55 0.19 0.76 0.01 0.42
Croatia T2, T3 CS, D 5.35 clinker production 2 278 0.54 0.31 0.58 0.13 0.11
Cyprus CS, T1 CS, D 11.60 Clinker production 1 823 0.53 0.03 0.75 – NO
Czech Republic T1, T3 D, PS 1.18 clinker production 2 792 0.53 0.50 0.77 0.09 0.10
Denmark (KP) CS, T2, T3 CS, D, PS 1.73 Production of Clinker 1 644 0.54 0.11 0.79 0.02 0.04
Denmark (Convention) CS, T1, T2, T3 CS, D, PS 1.73 Production of Clinker 1 644 0.54 0.11 0.79 0.02 0.04
Estonia T1, T2, T3 D, PS 2.00 Clinker production 720 0.59 0.16 0.70 0.04 0.12
European Union (KP) 1.74 140 126 0.53 0.46 0.71 0.09 0.14
European Union (Convention) 1.75 140 126 0.53 0.46 0.71 0.09 0.14
Finland T1, T2, T3 CS 0.80 Produced clinker 941 0.50 0.65 0.79 0.00 0.40
France (KP) NA NA 1.52 Clinker production 13 146 0.53 0.47 0.66 0.11 0.19
France (Convention) NA NA 1.50 Clinker production 13 146 0.53 0.46 0.66 0.11 0.19
Germany T1, T2 CS, D 1.41 produced clinker 23 871 0.53 0.55 0.75 0.10 0.12
Greece CS, T1 CS, D, PS 3.77 clinker production 7 234 0.53 0.29 0.87 0.02 0.15
Hungary CS, T3 CS, D 0.99 Clinker production (kt) 1 095 0.52 0.25 0.74 0.10 0.13
Iceland NA NA – clinker production NO NO – NO
Ireland T3 PS 2.51 clinker production 2 682 0.54 0.32 0.73 – NO
Italy T2 CS, PS 1.99 Clinker production 15 833 0.53 0.44 0.72 0.13 0.12
Japan CS, T2 CS 1.95 Production of clinker 51 573 0.51 0.43 0.43 0.01 0.47
Kazakhstan CR, T1, T2 CR, D, PS 1.02 6 083 0.52 0.22 0.74 – NO
Latvia T1, T2, T3 D, OTH, PS 4.89 (produced clinker) 1 093 0.51 0.00 0.55 0.01 0.06
Liechtenstein NA NA – Production NO NO – NO – NO
Lithuania CS, T1, T2 CS, D, PS 2.09 Clinker production 754 0.53 0.22 0.77 0.04 0.14
Luxembourg CS, T2 CS, PS 3.28 clinker production 731 0.48 – NO 0.57 0.14
Malta T1 D – (not occuring) NO NO – NO – NO
Monaco
Netherlands CS, T1 CS, D, PS 0.15 559 0.51 – IE, NO 0.05 0.07
New Zealand CS, T1 CS, D 0.76 Clinker production C C 0.19 0.77 – IE, NO
Norway T1, T3 CS, D, PS 1.37 Production quantity 1 375 0.53 0.42 0.75 0.01 0.46
Poland T1, T2 CS, D 1.70 Clinker production 11 866 0.54 0.36 0.73 0.07 0.10
Portugal T1, T3 OTH 4.80 Clinker Production 5 968 0.52 0.54 0.66 0.24 0.09
Romania CS, OTH, T2 CS, D, PS 2.68 clinker production 5 467 0.54 0.87 0.77 0.05 0.15
Russian Federation T1, T2 CS, D 0.94 Clinker production 50 164 0.53 0.33 0.77 0.03 0.10
Slovakia T2, T3 PS 3.12 Cement clinker 2 415 0.52 1.64 0.78 0.03 0.42
Slovenia T2, T3 CS, D 2.52 Clinker produced 807 0.52 0.34 0.74 0.05 0.13
Spain D, T1, T2 CS, D, PS 2.70 Clinker production 16 917 0.53 0.42 0.73 0.14 107
Sweden CS, D CS, D 2.57 Amount of produced clinker 2 602 0.54 0.76 0.75 0.03 NE
Switzerland CS, T2, T3 CS, D, PS 3.81 clinker production 3 502 0.53 0.11 C 0.01 0.05
Turkey T1, T2 CS, D 7.29 Clinker Production 63 642 0.54 1.06 0.75 0.13 0.15
Ukraine T1, T2, T3 CS, D 0.93 clinker production 6 065 0.54 0.67 0.77 0.07 0.18
United Kingdom of Great
Britain and Northern Ireland T3 CS 0.80 Clinker production 7 197 0.59 0.24 0.45 0.07 0.20
United States of America CS, T2, T3 D 0.55 Clinker Production 74 946 0.52 0.20 0.75 0.02 0.42
Share of
national
totala
c Source of default emission factors: 2006 IPCC Guidelines for National Greenhouse Gas Inventories Volume 3 Chapter 2 Mineral Industry Emissions. Lime production table 2.4; glass production section 2.4.1.2.
a The national total includes indirect CO2 emissions from the atmospheric oxidation of CH4, CO and NMVOCs for the following Parties: Canada, Czech Republic, Denmark (KP), Denmark (Convention), European
Union (KP), European Union (Convention), Finland, France (KP), France (Convention), Ireland, Latvia, Netherlands, Portugal and Switzerland.b The CRF requests Parties to specify the activity data used (e.g. cement or clinker) for estimating the emissions from cement production. The descriptions included in this column are as reported in the CRF by Parties.
Glass production
Share of
national
totala
CO2 IEF
Cement production
Methods
Lime production
Share of
national
totala
CO2 IEF
EF Descriptionb
Methods and EF usedActivity data
CO2 IEF
32
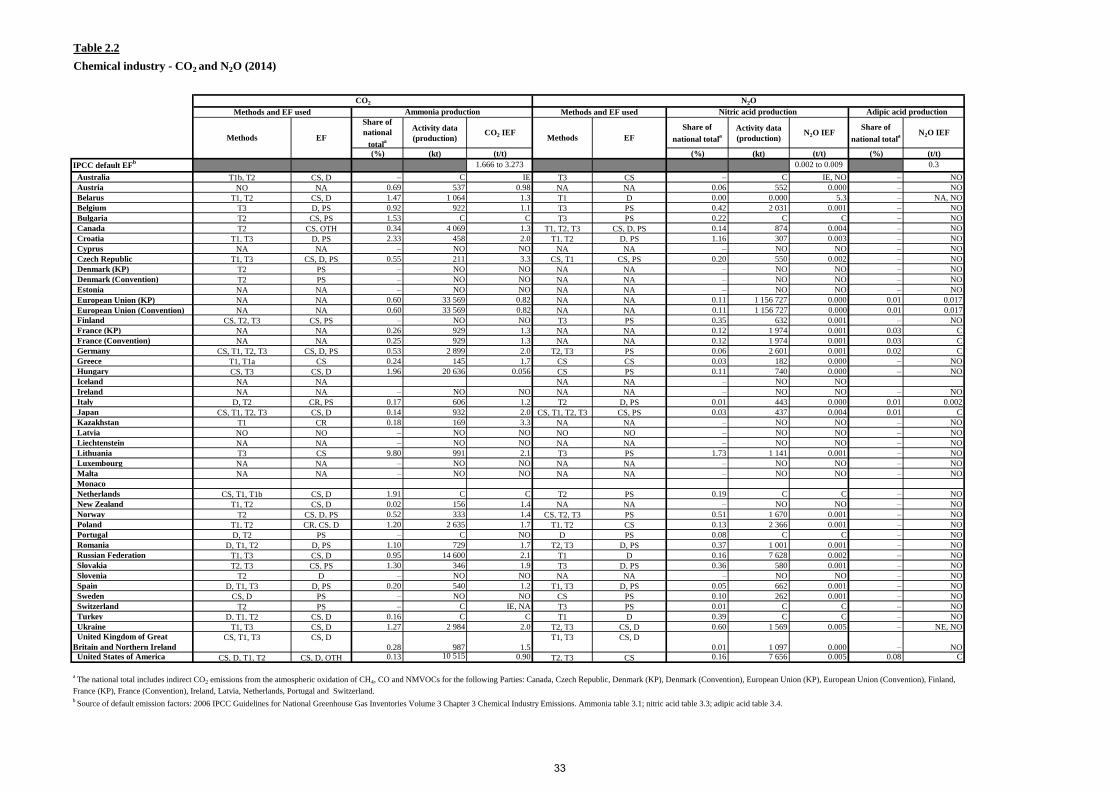
Table 2.2
Chemical industry - CO2 and N2O (2014)
Share of
national
totala
Activity data
(production)CO2 IEF
Share of
national totala
Activity data
(production)N2O IEF
Share of
national totala N2O IEF
(%) (kt) (t/t) (%) (kt) (t/t) (%) (t/t)
IPCC default EFb 1.666 to 3.273 0.002 to 0.009 0.3
Australia T1b, T2 CS, D – C IE T3 CS – C IE, NO – NO
Austria NO NA 0.69 537 0.98 NA NA 0.06 552 0.000 – NO
Belarus T1, T2 CS, D 1.47 1 064 1.3 T1 D 0.00 0.000 5.3 – NA, NO
Belgium T3 D, PS 0.92 922 1.1 T3 PS 0.42 2 031 0.001 – NO
Bulgaria T2 CS, PS 1.53 C C T3 PS 0.22 C C – NO
Canada T2 CS, OTH 0.34 4 069 1.3 T1, T2, T3 CS, D, PS 0.14 874 0.004 – NO
Croatia T1, T3 D, PS 2.33 458 2.0 T1, T2 D, PS 1.16 307 0.003 – NO
Cyprus NA NA – NO NO NA NA – NO NO – NO
Czech Republic T1, T3 CS, D, PS 0.55 211 3.3 CS, T1 CS, PS 0.20 550 0.002 – NO
Denmark (KP) T2 PS – NO NO NA NA – NO NO – NO
Denmark (Convention) T2 PS – NO NO NA NA – NO NO – NO
Estonia NA NA – NO NO NA NA – NO NO – NO
European Union (KP) NA NA 0.60 33 569 0.82 NA NA 0.11 1 156 727 0.000 0.01 0.017
European Union (Convention) NA NA 0.60 33 569 0.82 NA NA 0.11 1 156 727 0.000 0.01 0.017
Finland CS, T2, T3 CS, PS – NO NO T3 PS 0.35 632 0.001 – NO
France (KP) NA NA 0.26 929 1.3 NA NA 0.12 1 974 0.001 0.03 C
France (Convention) NA NA 0.25 929 1.3 NA NA 0.12 1 974 0.001 0.03 C
Germany CS, T1, T2, T3 CS, D, PS 0.53 2 899 2.0 T2, T3 PS 0.06 2 601 0.001 0.02 C
Greece T1, T1a CS 0.24 145 1.7 CS CS 0.03 182 0.000 – NO
Hungary CS, T3 CS, D 1.96 20 636 0.056 CS PS 0.11 740 0.000 – NO
Iceland NA NA NA NA – NO NO
Ireland NA NA – NO NO NA NA – NO NO – NO
Italy D, T2 CR, PS 0.17 606 1.2 T2 D, PS 0.01 443 0.000 0.01 0.002
Japan CS, T1, T2, T3 CS, D 0.14 932 2.0 CS, T1, T2, T3 CS, PS 0.03 437 0.004 0.01 C
Kazakhstan T1 CR 0.18 169 3.3 NA NA – NO NO – NO
Latvia NO NO – NO NO NO NO – NO NO – NO
Liechtenstein NA NA – NO NO NA NA – NO NO – NO
Lithuania T3 CS 9.80 991 2.1 T3 PS 1.73 1 141 0.001 – NO
Luxembourg NA NA – NO NO NA NA – NO NO – NO
Malta NA NA – NO NO NA NA – NO NO – NO
Monaco
Netherlands CS, T1, T1b CS, D 1.91 C C T2 PS 0.19 C C – NO
New Zealand T1, T2 CS, D 0.02 156 1.4 NA NA – NO NO – NO
Norway T2 CS, D, PS 0.52 333 1.4 CS, T2, T3 PS 0.51 1 670 0.001 – NO
Poland T1, T2 CR, CS, D 1.20 2 635 1.7 T1, T2 CS 0.13 2 366 0.001 – NO
Portugal D, T2 PS – C NO D PS 0.08 C C – NO
Romania D, T1, T2 D, PS 1.10 729 1.7 T2, T3 D, PS 0.37 1 001 0.001 – NO
Russian Federation T1, T3 CS, D 0.95 14 600 2.1 T1 D 0.16 7 628 0.002 – NO
Slovakia T2, T3 CS, PS 1.30 346 1.9 T3 D, PS 0.36 580 0.001 – NO
Slovenia T2 D – NO NO NA NA – NO NO – NO
Spain D, T1, T3 D, PS 0.20 540 1.2 T1, T3 D, PS 0.05 662 0.001 – NO
Sweden CS, D PS – NO NO CS PS 0.10 262 0.001 – NO
Switzerland T2 PS – C IE, NA T3 PS 0.01 C C – NO
Turkey D, T1, T2 CS, D 0.16 C C T1 D 0.39 C C – NO
Ukraine T1, T3 CS, D 1.27 2 984 2.0 T2, T3 CS, D 0.60 1 569 0.005 – NE, NO
United Kingdom of Great
Britain and Northern Ireland
CS, T1, T3 CS, D
0.28 987 1.5
T1, T3 CS, D
0.01 1 097 0.000 – NO United States of America CS, D, T1, T2 CS, D, OTH 0.13 10 515 0.90 T2, T3 CS 0.16 7 656 0.005 0.08 C
Methods EF Methods
b Source of default emission factors: 2006 IPCC Guidelines for National Greenhouse Gas Inventories Volume 3 Chapter 3 Chemical Industry Emissions. Ammonia table 3.1; nitric acid table 3.3; adipic acid table 3.4.
EF
CO2 N2O
Methods and EF used Ammonia production Methods and EF used Nitric acid production Adipic acid production
a The national total includes indirect CO2 emissions from the atmospheric oxidation of CH4, CO and NMVOCs for the following Parties: Canada, Czech Republic, Denmark (KP), Denmark (Convention), European Union (KP), European Union (Convention), Finland,
France (KP), France (Convention), Ireland, Latvia, Netherlands, Portugal and Switzerland.
33

Table 2.3
Metal industry - CO2 (2014)
Activity Data
(production)CO2 IEF
Activity Data
(production)CO2 IEF
Share of
national
totalb
Activity Data
(production)CO2 IEF
(%) (kt) t/t (kt) t/t (%) (kt) t/t
IPCC default EFc
1.46 (BOF)
0.08 (EAF)
1.72 (OHF) 1.35
1.6 (Prebake)
1.7 (Soderberg)
Australia T1b, T2 CS 1.17 4 446 NA, NO NO NO 0.57 1 778 1.7
Austria NA NA 13.30 7 185 1.4 6 015 IE, NO 0.01 C C
Belarus D, T1 D 0.01 IE IE, NA NO NA, NO – NO NO
Belgium CS, T3 PS 3.33 7 420 0.50 4 388 IE, NA – NO NO
Bulgaria T1, T2 CS, D 0.07 634 0.063 NO NO – C NO
Canada T1, T2, T3 CS, D, OTH 1.15 12 951 0.066 6 728 1.1 0.64 2 860 878 0.002
Croatia T2 CS 0.12 175 0.16 NO NO – NO NO
Cyprus NA NA – NO NO NO NO – NO NO
Czech Republic CS, T1, T2 D, PS 5.16 5 404 IE, NA 4 170 IE, NA – NO NO
Denmark (KP) T1 D – NO NO NO NO – NO NO
Denmark (Convention) T1 D – NO NO NO NO – NO NO
Estonia NA NA – NO NO NO NO – NO NO
European Union (KP) 1.46 157 484 0.27 79 134 0.098 0.10 2 532 1.7
European Union (Convention) 1.46 157 484 0.27 79 134 0.098 0.07 1 693 1.9
Finland CS, T2, T3 CS 3.44 3 808 0.53 NO IE, NO – NO NO
France (KP) NA NA 0.52 16 368 0.075 10 441 0.11 0.13 384 1.6
France (Convention) NA NA 0.51 16 368 0.075 10 441 0.11 0.13 384 1.6
Germany T1, T2, T3 CS, D 1.77 42 943 0.37 27 945 IE, NO 0.08 531 1.4
Greece CS, T1 CS, D, PS 0.07 1 022 0.069 NO NO 0.27 173 1.6
Hungary T3 PS 1.58 1 152 0.12 801 1.7 – NO NO
Iceland T2, T3 D, PS – NO NA, NO NO NA, NO 27.83 839 1.5
Ireland NA NA – NO NO NO NO – NO NO
Italy T1, T2 CR, CS, D, PS 0.33 23 715 0.035 6 371 0.086 – NO NO
Japan T2 OTH 0.45 NE NE 13 488 0.44 – NA IE, NE
Kazakhstan CR, CS, D, T1, T2 CR, CS, D 2.25 3 538 0.15 3 185 1.6 0.12 210 1.8
Latvia T2 D, PS 0.00 0.093 0.11 NO NO – NO NO
Liechtenstein NA NA – NO NO NO NO – NO NO
Lithuania T2 D 0.01 NO NO NO NO – NO NO
Luxembourg CS, T2 CS 0.95 2 193 0.047 NO NO – NO NO
Malta NA NA – NO NO NO NO – NO NO
Monaco
Netherlands T1a, T2 CS, D 0.51 7 013 0.004 NA IE, NO 0.00 2.2 1.4
New Zealand T1, T2, T3 CS, D 2.14 C C NA NA 0.66 327 1.6
Norway T2, T3 CS, PS 0.05 586 0.046 NO NO 3.32 1 173 1.5
Poland T1, T2, T3 CS, D 0.55 IE IE 4 637 0.16 – NO NA, NO
Portugal T2 D, PS 0.10 2 053 0.030 NO NO – NO NO
Romania D, T3 CS, D, PS 2.77 3 275 0.93 1 631 IE, NO 0.29 195 1.6
Russian Federation T1, T2, T3 CS, D, PS 2.70 70 547 0.10 51 460 1.3 0.21 C C
Slovakia T1, T2, T3 D, PS 9.96 4 439 0.91 24 IE, NO 0.65 168 1.6
Slovenia T1, T2 CS, D, PS 0.32 649 0.081 NO NA, NO 0.72 84 1.4
Spain D, T1, T2, T3 CS, D, PS 0.58 14 341 0.047 C C 0.18 C C
Sweden CS, D, T2 PS 4.06 1 665 0.10 3 006 0.59 0.32 114 1.5
Switzerland CS, T3 CS, PS 0.02 1 315 0.008 NO NO – NO NO
Turkey T1, T2, T3 CS, D 2.53 34 236 0.29 4 066 IE, NO 0.01 C C
Ukraine T1, T3 CS, D 11.75 27 144 0.11 24 801 1.4 – NO NO
United Kingdom of Great
Britain and Northern Ireland T1, T2 CS 0.91 12 032 0.013 9 705 0.19 0.01 42 1.5 United States of America T1, T2 CS, D, OTH 0.79 55 174 0.14 29 375 0.52 0.04 1 710 1.7
c Source of default emission factors: 2006 IPCC Guidelines for National Greenhouse Gas Inventories Volume 3 Chapter 4 Metal Industry Emissions. Iron and steel table 4.1; Alumnium table 4.10.
Pig iron
b In addition to data reported here, CO2 emission estimates from direct reduced iron (2.C.1.c) were reported by European Union (KP), European Union (Convention), Netherlands, Russian Federation, Sweden and United
States of America; CO2 emission estimates from sinter (2.C.1.d) were reported by Belgium, European Union (KP), European Union (Convention), Hungary, Kazakhstan, Poland, Spain, Turkey, United Kingdom and United
States of America; CO2 emission estimates from pellet (2.C.1.e) were reported by European Union (KP), European Union (Convention), Kazakhstan, Russian Federation and Sweden.
Methods and EF usedIron and steel
a
Aluminium production
Methods EF
Share of
national
totalb
Steel
a The national total includes indirect CO2 emissions from the atmospheric oxidation of CH4, CO and NMVOCs for the following Parties: Canada, Czech Republic, Denmark (KP), Denmark (Convention), European Union
(KP), European Union (Convention), Finland, France (KP), France (Convention), Ireland, Latvia, Netherlands, Portugal and Switzerland.
34

Table 2.4
HFCs, PFCs, SF6 and NF3 (2014)
IPCC default EF
Australia NA NA T1c CS NA NA NA NA NA NA NA NA M CS, D NA NA NA NA NA NA
Austria NA NA NA NA NA NA NA NA NA NA
Belarus
Belgium NA NA NA NA NA NA T2, T3 D, PS T2, T3 D, PS T2, T3 D, PS T2 CS, D, PS T2 CS, D, PS NA NA NA NA
Bulgaria NO NO NO NO NO NO T2 D T2 D NO NO NO NO
Canada NA NA T1, T2, T3 CS, D, OTH T3 D T2 D T2 D T2 CS, D T2 CS, D T2 D NA NA T2 D
Croatia NA NA NA NA NA NA NA NA NA NA NA NA T1a, T2 D T1a D NA NA NA NA
Cyprus NA NA
Czech Republic NA NA NA NA NA NA T2 D T2 D T2 D D, T1 CS, D D, T1 CS, D
Denmark (KP) NA NA NA NA T2 D NA NA NA NA T2 D T2 D
Denmark (Convention) NA NA NA NA NA NA T2 D NA NA NA NA T1, T2 D T2 D
Estonia NA NA NA NA NA NA NA NA NA NA NA NA T2 CS NA NA NA NA NA NA
European Union (KP)
European Union (Convention)
Finland NA NA NA NA T2 D NA NA T2 D T2 NA NA NA NA NA
France (KP) NA NA NA NA NA NA NA NA NA NA NA NA NA NA
France (Convention) NA NA NA NA NA NA NA NA NA NA NA NA NA NA
Germany D D T3 CS CS, D D T3 PS T3 PS D, T3 CS, PS CS, T2 CS, D T2 CS, D CS CS NA NA
Greece NA NA T3 PS NA NA NA NA NA NA NA NA CS, T2 D T2 D NA NA NA NA
Hungary NA NA NA NA NA NA NA NA NA NA NA NA CS, T1, T2 CS, D CS, T2 CS, D NA NA NO NO
Iceland T2 D NA D
Ireland NA NA NA NA NA NA NA NA NA NA NA NA NA NA NA NA NA NA NA NA
Italy T2 PS NA NA NA NA T2 CS T2 CS T2 CS T2 CS, D
Japan CS CS T2 CS CS CS T2 CS T2 CS T2 CS CS CS, OTH CS CS CS CS
Kazakhstan NA NA NA NA NA NA NA NA NA NA NA NA NA NA NA NA NA NA NA NA
Latvia NO NO NO NO NO NO NA NA NA NA NA NA T1a, T2 CS, D, OTH NO NO NA NA NA NA
Liechtenstein CS CS CS CS
Lithuania NA NA NA NA NA NA T3 PS T2 PS T1a, T1b, T2 CS, D, PS NA NA NA NA NA NA
Luxembourg NA NA NA NA NA NA NA NA NA NA NA NA T1, T2, T3 CS, M, PS T3 PS NA NA
Malta NA NA NA NA NA NA NA NA NA NA NA NA CS, T1, T2 CS, D NA NA CS CS
Monaco
Netherlands NA NA T2 CS NA NA T2 CS NA NA NA NA T2 CS NA NA NA NA NA NA
New Zealand T2 NA NA T1a, T2 CS, D NA NA T1 D
Norway NA NA NA NA T2 CS NA NA T1, T2 CS, D T1, T2 CS, D NA NA NA NA
Poland NA NA NA NA T1 D NO NO NO NO NO NO T1a, T1b, T2 D IE, T2 D, IE NA NA NA NA
Portugal NO NO NO NO NO NO NO NO NO NO NO NO IE, NO IE, NO IE, NO IE, NO NO NO NO NO
Romania NA NA NA NA NA NA NA NA NA NA NA NA T2 D NA NA NA NA NA NA
Russian Federation T2 D, PS OTH OTH NA NA NA NA NA NA NA NA
Slovakia T3 PS NA NA T1a, T2 CS, D NA NA
Slovenia NA NA T3 CS, D NA NA NA NA NA NA NA NA T1, T2 CS, D NO NO NA NA NA NA
Spain NA NA T2 D NA NA NA NA NA NA NA NA T1a, T2 CS, D T1a, T2 CS, D NA NA NA NA
Sweden NA NA NA NA D D NA NA NA NA CS, T2 CS, D, PS CS CS, D NA NA NA NA
Switzerland NA NA T3 CS NA NA T2 D T2 D T2 D T1, T2 CS, D T1, T2 CS, D T2 D T2 CS, D
Turkey NA NA
Ukraine NA NA NA NA NA NA NA NA NA NA NA NA T1a, T2 D NE NA NA NA NA NA
United Kingdom of Great
Britain and Northern Ireland T2 PS T2 PS T2 PS NA NA NA NA T2 D CS, T1a, T2, T3 CS, OTH NA NA NA NA T2, T3 CS, D
United States of America M, T3 CS, M T2 CS M, T3 CS, M M, T2 CS, M M, T2 CS, M M, T2 CS, M M, T2 CS, M M, T2 CS, M NA NA NA NA
EFEF
Electronic industry
HFCs PFCs
Methods
NF3
Methods Methods EF
Metal industry
PFCs
Methods
SF6
EF
Other product manufacture and use
HFCs PFCs
MethodsEF Methods EF
Product uses as substitutes for ODS
Methods
PFCs SF6HFCs
EFEFMethods EF Methods Methods EF
35

Figure 3.1
Contribution of subsectors to total GHG emissions in the Agriculture sectora, b
b Indirect CO2 emissions are excluded from the totals in this graph.
a In accordance with the UNFCCC reporting guidelines on annual inventories of Annex I Parties the year 1990 should be the base year for the estimation and reporting of inventories. However, in accordance with decisions 9/CP.2, 11/CP.4, and 7/CP.12 some Parties with economies in transition use base years other than 1990: Bulgaria (1988), Croatia (1990), Hungary (average of 1985 to
1987), Poland (1988), Romania (1989) and Slovenia (1986).
0%
10%
20%
30%
40%
50%
60%
70%
80%
90%
100%
Aust
rali
a B
ase
yea
r
Aust
rali
a 201
4
Aust
ria
Bas
e yea
r
Aust
ria
201
4
Bel
arus
Bas
e y
ear
Bel
arus
20
14
Bel
giu
m B
ase
yea
r
Bel
giu
m 2
014
Bulg
aria
Bas
e y
ear
Bulg
aria
20
14
Can
ada
Bas
e y
ear
Can
ada
2014
Cro
atia
Bas
e yea
r
Cro
atia
201
4
Cyp
rus
Bas
e y
ear
Cyp
rus
20
14
Cze
ch R
epu
bli
c B
ase
yea
r
Cze
ch R
epu
bli
c 2
014
Den
mar
k (
KP
) B
ase
yea
r
Den
mar
k (
KP
) 201
4
Den
mar
k (
Con
ven
tion
) B
ase
yea
r
Den
mar
k (
Con
ven
tion
) 201
4
Est
on
ia B
ase
yea
r
Est
on
ia 2
014
Eu
rop
ean U
nio
n (
KP
) B
ase
yea
r
Eu
rop
ean U
nio
n (
KP
) 2
014
Eu
rop
ean U
nio
n (
Conv
enti
on)…
Eu
rop
ean U
nio
n (
Conv
enti
on)
2014
Fin
land B
ase
yea
r
Fin
land 2
014
Fra
nce
(K
P)
Bas
e y
ear
Fra
nce
(K
P)
20
14
Fra
nce
(C
onven
tio
n)
Bas
e y
ear
Fra
nce
(C
onven
tio
n)
20
14
Ger
man
y B
ase
yea
r
Ger
man
y 2
014
Gre
ece
Bas
e y
ear
Gre
ece
20
14
Hung
ary B
ase
yea
r
Hung
ary 2
01
4
Ice
lan
d B
ase
yea
r
Ice
lan
d 2
01
4
Ire
land B
ase
yea
r
Ire
land 2
014
Ita
ly B
ase
yea
r
Ita
ly 2
01
4
Jap
an B
ase
yea
r
Jap
an 2
014
Kaz
akhst
an B
ase
yea
r
Kaz
akhst
an 2
014
Lat
via
Bas
e yea
r
Lat
via
201
4
Lie
chte
nst
ein B
ase
yea
r
Lie
chte
nst
ein 2
01
4
Lit
huan
ia B
ase
yea
r
Lit
huan
ia 2
014
Lu
xem
bou
rg B
ase
yea
r
Lu
xem
bou
rg 2
01
4
Mal
ta B
ase
yea
r
Mal
ta 2
014
Mon
aco B
ase
yea
r
Mon
aco 2
01
4
Net
her
lan
ds
Bas
e yea
r
Net
her
lan
ds
2014
New
Zea
lan
d B
ase
yea
r
New
Zea
lan
d 2
01
4
Norw
ay B
ase
yea
r
Norw
ay 2
014
Pola
nd B
ase
yea
r
Pola
nd 2
01
4
Port
ug
al B
ase
yea
r
Port
ug
al 2
014
Rom
ania
Bas
e y
ear
Rom
ania
20
14
Russ
ian F
eder
atio
n B
ase
yea
r
Russ
ian F
eder
atio
n 2
014
Slo
vak
ia B
ase
yea
r
Slo
vak
ia 2
01
4
Slo
ven
ia B
ase
yea
r
Slo
ven
ia 2
01
4
Spai
n B
ase
yea
r
Spai
n 2
014
Sw
eden
Bas
e yea
r
Sw
eden
2014
Sw
itze
rlan
d B
ase
yea
r
Sw
itze
rlan
d 2
01
4
Tu
rkey
Bas
e yea
r
Tu
rkey
20
14
Ukra
ine
Bas
e y
ear
Ukra
ine
20
14
Unit
ed K
ingdo
m B
ase
yea
r
Unit
ed K
ingdo
m 2
014
Unit
ed S
tate
s of
Am
eric
a B
ase
yea
r
Unit
ed S
tate
s of
Am
eric
a 20
14
Per
cen
tag
e
Enteric fermentation Manure management Rice cultivation Agricultural soils Prescribed burning of savannahs Field burning of agricultural residues Liming Urea application Other carbon-containing fertilizers Other
36

Table 3.1
Enteric fermentation - CH4 (2014)
Option C
Dairy cattleNon-dairy
cattle
Mature dairy
cattle
Other mature
cattle
Growing
cattleOther
CRF FAOb Difference CRF FAO
b Difference CRF FAOb Difference
(%) (%) (%) (kg/head/yr) (%) (kg/head/yr)
IPCC default EFc,d
46-128 27-60 5-8 1.0-1.5
Australia 10.11 CS, T1, T2 CS, D 29 103 29 103 0.00 55 72 612 72 612 –0.00 6.8 2 308 2 308 –0.01 1.6
Austria 5.40 1 961 1 958 –0.15 130 60 349 357 2.39 8.0 2 868 2 896 0.96 1.5
Belarus 9.64 T1, T2 CS, D 4 343 4 364 0.50 126 56 213 73 –66.02 11 3 109 2 924 –5.93 1.5
Belgium 3.92 T1, T2 CS, D 2 516 2 477 –1.53 140 50 111 112 0.93 8.0 6 516 6 350 –2.55 1.5
Bulgaria 2.60 T1, T2 CS, D 564 576 2.02 110 62 41 1 352 1 370 1.27 7.1 570 586 2.92 1.5
Canada 3.36 T1, T2 CS, D 12 755 12 220 –4.19 155 69 986 875 –11.27 8.0 13 120 13 055 –0.50 1.5
Croatia 4.17 T1, T2 CS, D 443 441 –0.47 105 59 48 605 605 0.02 7.9 551 1 156 109.94 1.4
Cyprus 2.78 T1, T2 CS, D 60 61 2.25 115 57 322 322 0 8.0 342 342 –0.00 1.5
Czech Republic 2.24 T1, T2 CS, D 1 374 1 374 0 141 55 225 225 0 8.0 1 617 1 617 0 1.5
Denmark (KP) 7.11 T1, T2 CS, D, OTH 1 615 – 155 38 220 – 6.7 12 332 – 1.1
Denmark (Convention) 7.15 T1, T2 CS, D, OTH 1 617 1 566 –3.12 155 38 318 245 –22.70 7.4 12 332 12 332 0 1.1
Estonia 2.66 D, T1, T2 CS, D, OTH 265 261 –1.25 143 60 39 86 82 –4.59 8.0 358 359 0.22 1.0
European Union (KP) 4.36 76 580 – 160 57 98 725 – 8.1 142 925 – 1.2
European Union (Convention) 4.36 76 580 89 443 16.80 160 57 97 966 97 757 –0.21 8.1 142 889 149 036 4.30 1.2
Finland 3.53 CS, OTH, T1, T2 CS, D, OTH 914 914 0 149 53 138 138 0 8.4 1 245 1 245 0 1.0
France (KP) 7.35 19 267 – 122 51 7 209 – 9.5 13 323 – 0.79
France (Convention) 7.28 19 357 19 248 –0.56 122 51 7 212 7 208 –0.05 9.5 13 410 13 323 –0.65 0.79
Germany 2.76 T1, T2, T3 CS, D 12 742 12 742 –0.00 136 43 1 892 1 601 –15.41 6.2 23 667 28 339 19.74 1.1
Greece 3.98 T1, T2 CS, D 694 659 –5.04 119 60 8 802 9 072 3.07 9.5 864 1 046 21.06 1.5
Hungary 3.49 T1, T2 CS, D 791 782 –1.10 131 55 1 237 1 214 –1.84 8.0 3 067 3 004 –2.06 1.5
Iceland 6.40 NA NA 74 74 –0.00 94 48 19 759 487 –35.94 8.3 36 29 –21.02 1.5
Ireland 18.22 CS, T1, T2 CS, D 6 800 6 926 1.85 111 47 5 032 5 097 1.29 5.5 1 530 1 555 1.64 1.3
Italy 3.29 T1, T2 CS, D 5 756 6 125 6.42 139 47 7 166 7 166 0 8.0 8 676 8 676 0.00 1.5
Japan 0.53 CS, T1 CS, D 3 860 3 962 2.65 99 55 17 13 –22.68 8.0 9 536 9 537 0.01 1.4
Kazakhstan 5.12 T1, T2 CS, D 6 714 5 851 –12.85 94 51 17 897 15 198 –15.08 6.6 1 106 922 –16.60 1.0
Latvia 7.67 T1, T2 CS, D, OTH 422 407 –3.70 136 78 29 93 85 –8.32 8.0 349 368 5.18 1.5
Liechtenstein 6.60 D, T2 CS, D 6.2 6.2 0 135 87 41 3.6 3.6 0 8.5 1.7 1.7 0 1.1
Lithuania 8.56 T1, T2 CS, D, OTH 737 714 –3.14 125 56 124 100 –19.62 12 714 755 5.66 1.0
Luxembourg 3.86 T1, T2 CS, D 199 199 0 82 8.7 8.7 0 9.8 87 87 0 1.5
Malta 1.20 T1, T2 CS, D 15 15 0 122 31 11 11 0 14 47 47 0 1.5
Monaco
Netherlands 4.40 T1, T2, T3 CS, D 4 068 4 169 2.47 127 79 36 959 1 076 12.25 8.0 12 238 12 238 –0.00 1.5
New Zealand 35.32 T1, T2 CS, D 10 368 10 368 0 82 58 29 803 29 803 0 12 287 287 0 1.1
Norway 4.23 T1, T2 CS, D 760 839 10.45 146 110 54 1 535 2 284 48.82 14 574 831 44.67 1.5
Poland 3.24 T2, T3 CS, D 5 920 5 920 0 79 201 223 10.68 8.0 11 724 11 724 0 1.5
Portugal 5.31 T1, T2 CS, D 1 502 1 549 3.11 135 63 2 067 2 032 –1.67 9.5 2 056 2 126 3.40 1.2
Romania 9.02 T2 CS 1 998 2 022 1.23 97 64 9 518 9 136 –4.02 18 5 042 5 180 2.74 1.5
Russian Federation 1.78 CS, T1, T2 CS, D 20 156 19 564 –2.94 115 61 24 033 22 247 –7.43 8.0 19 857 19 081 –3.91 1.3
Slovakia 2.57 T1, T2 CS, D 466 468 0.49 110 55 391 400 2.24 9.4 642 637 –0.73 1.5
Slovenia 5.46 T1, T2 CS, D 468 461 –1.64 74 83 109 30.42 8.0 281 288 2.50 1.5
Spain 3.56 CS, T1, T2 CS, D 6 044 6 079 0.58 103 41 15 432 15 432 –0.00 7.8 25 990 26 568 2.22 0.89
Sweden 5.77 CS, T1 CS, D 1 493 1 493 0 134 55 589 589 0 8.0 1 377 1 377 0 1.5
Switzerland 6.91 T2 CS 1 563 1 563 0 137 107 39 403 403 0 8.5 1 498 1 498 0 1.1
Turkey 5.87 T1 D 14 223 14 123 –0.70 84 47 31 140 31 115 –0.08 5.1 2.7 2.7 0 1.0
Ukraine 3.31 T1, T2, T3 CS 4 295 4 534 5.56 123 83 67 1 030 1 067 3.52 8.7 7 752 7 922 2.19 1.5
United Kingdom of Great
Britain and Northern Ireland 4.52 T1, T2 CS, D 9 837 9 837 –0.00 131 65 33 743 33 743 –0.00 5.0 4 815 4 815 –0.01 1.5
United States of America 4.59 M, T1, T2 CS, D, M 94 021 88 526 –5.84 135 5 245 5 245 0 8.0 64 230 67 726 5.44 1.5
Western Europe Eastern Europe Oceania Latin America Asia
Africa and
Middle East
Indian
Subcontenent
Dairy cattle 117 99 90 72 68 46 58
Other cattle 57 58 60 56 47 31 27
Activity data (population size)
Option A Option B
Activity data (population size)CH4 IEF
d For dairy and other cattle, 2006 IPCC default emission factors (in kg CH4/head/year) are provided by regions as shown below (see footnote c for source reference).
Activity data (population size)CH4 IEF
Methods EFCH4 IEF
(thousands of head) (kg/head/yr) (thousands of head) (thousands of head)
Share of national
totala
Methods and EF used
Cattle Sheep Swine
b Source of international statistics: FAOSTAT data, downloaded on 30 May 2016 from http://faostat3.fao.org/home/E.
c Source of default emission factors: 2006 IPCC Guidelines for National Greenhouse Gas Inventories Volume 4 Chapter 10: Emissions from Livestock and Manure Management. Dairy and Other cattle table 10.11; Sheep and Swine Table 10.10.
a The national total includes indirect CO2 emissions from the atmospheric oxidation of CH4, CO and NMVOCs for the following Parties: Canada, Czech Republic, Denmark (KP), Denmark (Convention), European Union (KP), European Union (Convention), Finland, France (KP), France (Convention), Ireland, Latvia, Netherlands, Portugal and Switzerland.
37

Table 3.2
Manure management - CH4 (2014)
Option C
Dairy cattle Non-dairy cattleMature dairy
cattle
Other mature
cattleGrowing cattle Other
(%)
IPCC default EFb
1-112 0 to 26 0.10 to 0.37 0 to 45
Australia 0.49 CS, T2, T3 CS, D 1.5 0.002 23
Austria 0.57 12 5.0 0.19 1.2
Belarus 0.86 T1, T2 CS, D 5.1 2.4 0.67 4.9
Belgium 1.10 T1, T2 CS, D 28 3.5 0.19 4.5
Bulgaria 0.46 T1, T2 CS, D 3.2 1.3 0.84 0.21 15
Canada 0.50 T1, T2 CS, D 35 3.3 0.29 5.1
Croatia 0.77 T2 CS 17 8.1 8.1 0.12 2.9
Cyprus 1.59 T1, T2 D 10 4.4 0.28 14
Czech Republic 0.61 T1, T2 CS, D 22 9.1 0.19 6.0
Denmark (KP) 4.30 CS, T2 CS, D 30 13 1.8 4.4
Denmark (Convention) 4.30 CS, T2 CS, D 30 13 1.3 4.4
Estonia 0.40 D, T1, T2 CS, D 13 1.9 3.3 0.19 4.1
European Union (KP) 1.05 26 6.4 0.34 5.7
European Union (Convention) 1.05 26 6.4 0.33 5.7
Finland 0.77 T2 CS 27 5.8 0.25 3.3
France (KP) 1.31 23 5.1 0.21 4.7
France (Convention) 1.31 23 5.2 0.21 4.7
Germany 0.69 T2 CS, D 21 6.9 0.21 4.0
Greece 0.81 T1, T2 CS, D 13 3.5 1.0 16
Hungary 1.14 T1, T2 CS, D 31 8.8 0.30 3.8
Iceland 1.09 NA NA 28 11 4.2 0.63 6.0
Ireland 2.14 T1, T2 CS, D 10 4.4 0.39 5.1
Italy 0.73 T1, T2 CS, D 13 6.8 0.21 6.5
Japan 0.17 CS, T1 CS, D 59 2.2 0.28 0.52
Kazakhstan 0.21 T1, T2 CS, D 4.8 0.84 0.10 4.0
Latvia 0.88 T1, T2 CS, D 15 1.9 1.1 0.19 2.4
Liechtenstein 1.33 T2 D 27 15 6.9 1.3 4.6
Lithuania 1.23 T1, T2 CS, D 9.6 5.9 0.45 4.0
Luxembourg 0.57 T1, T2 CS, D 9.9 0.21 5.2
Malta 0.43 T1, T2 D 21 IE 0.28 6.2
Monaco
Netherlands 2.33 T2 CS, D 42 9.1 8.6 0.19 6.8
New Zealand 1.43 T1, T2 CS, D 5.6 0.78 0.12 5.9
Norway 0.58 T1, T2 CS, D 30 10 5.5 0.19 4.2
Poland 0.42 T1, T2 CS, D 6.1 0.19 2.0
Portugal 1.80 T1, T2 CS, D 11 2.1 0.40 18
Romania 1.44 T2 CS 4.3 2.5 0.56 9.4
Russian Federation 0.15 CS, T1, T2 CS, D 5.1 3.0 0.19 3.6
Slovakia 0.47 T1, T2 CS, D 13 2.1 0.29 6.5
Slovenia 1.46 T1, T2 CS, D 17 0.24 4.1
Spain 2.38 CS, T1, T2 CS, D 73 2.6 0.23 8.8
Sweden 0.48 T1, T2 CS, D 8.8 3.7 0.19 1.3
Switzerland 1.61 T2 CS, D 27 17 6.7 1.3 4.3
Turkey 0.68 T1 D 19 1 0.12 4.0
Ukraine 0.43 T2 CS 8.1 7.5 3.5 0.24 2.5
United Kingdom of Great
Britain and Northern Ireland 0.66 T1, T2 CS, D 18 8.8 0.20 5.2
United States of America 0.87 M, T1, T2 CS, D, M 15 0.54 14
cool temperate warm cool temperate warm cool temperate warm
North America 48-58 63-98 105-112 1 2 2 10-23 13-39 22-45
Western Europe 21-29 34-75 83-92 6-8 10-21 24-26 6-12 9-27 19-33
Eastern Europe 11-15 20-37 42-46 6-8 9-19 21-23 3-5 4-12 10-17
Oceania 23-26 27-30 31 1 2 2 11-22 13-24 13-24
Latin America 1 1 2 1 1 1 1 1 2
Africa 1 1 1 0 1 1 0-1 1 1-2
Middle East 2 2 2-3 1 1 1 1-2 2-5 5-6
Asia 9-12 13-26 28-31 1 1 1 2 3-6 6-7
Indian Subcontinent 5 5 5-6 2 2 2 2-3 3-5 6
cool temperate warm
Developed countries 0.19 0.28 0.37
Developed countries 0.10 0.15 0.20
Sheep
(kg/head/yr)
b Source of default emission factors: 2006 IPCC Guidelines for National Greenhouse Gas Inventories Volume 4 Chapter 10 Emissions from Livestock and Manure Management. Dairy, Other cattle and Swine table 10.14; Sheep
table 10.15. Default emission factors are provided according to climate regions (cool, temperate, warm), as shown below.
Default IPCC emission factors according to climate regionsb
a The national total includes indirect CO2 emissions from the atmospheric oxidation of CH4, CO and NMVOCs for the following Parties: Canada, Czech Republic, Denmark (KP), Denmark (Convention), European Union (KP),
European Union (Convention), Finland, France (KP), France (Convention), Ireland, Latvia, Netherlands, Portugal and Switzerland.
Dairy cattle Other cattle Swine
Share of
national
totala
Methods and EF used
Cattle
Sheep SwineOption A Option B
Methods EFCH4 IEF
38

Table 3.3
Manure management - N2O (2014)
Option C
Dairy cattleNon-dairy
cattle
Mature dairy
cattle
Other mature
cattle
Growing
cattleOther Dairy cattle
Non-dairy
cattleSheep Swine
Other
livestock
(%)
IPCC default EFb
0.35 to 0.70 0.31 to 0.79
Australia 45 0.17 CS, T2, T3 D NA 0.079 0.004
Austria 101 46 0.57 0.70 0.36 0.051 0.045 0.003
Belarus 7 709 3 679 414 1.39 T1, T2 CS, D 0.61 0.51 0.47 0.077 0.008
Belgium 118 54 0.64 T2 D 0.76 0.57 0.017 0.037 0.001
Bulgaria 100 67 40 0.77 T1 D 0.038 0.029 0.017
Canada 102 45 0.63 T1 D 1.3 0.67 0.046 0.029 0.017
Croatia 89 50 50 0.60 T2 CS, D 0.011 0.016 0.005
Cyprus 96 42 0.87 T1 D 0.72 0.32 0.097 0.063 0.016
Czech Republic 150 74 1.04 T1, T2 CS, D 3.3 0.95 0.035 0.37 0.009
Denmark (KP) 143 42 1.46 T2 D 1.0 0.35 0.029 0.071 0.009
Denmark (Convention) 248 90 1.46 T2 CS, D 1.0 0.35 0.033 0.071 0.009
Estonia 118 48 38 0.32 T1, T2 CS, D 0.085 0.018 0.007
European Union (KP) 105 51 0.52 0.72 0.25 0.016 0.053
European Union (Convention) 105 51 0.52 0.72 0.25 0.015 0.053
Finland 131 51 0.48 T2 D 0.78 0.41 0.077 0.031 0.008
France (KP) 113 59 0.51 0.15 0.087 0.034 0.004 0.001
France (Convention) 113 59 0.50 0.15 0.088 0.034 0.004 0.001
Germany 119 42 0.43 T2 CS, D 0.78 0.40 0.076 0.080 0.004
Greece 99 52 0.32 D D 0.71 0.26 0.012 0.11 0.003
Hungary 106 51 0.80 T1, T2 CS, D 1.1 0.47 0.077 0.063 0.004
Iceland 95 42 15 0.92 NA NA 0.14 0.014 0.034
Ireland 101 51 0.85 T2 CS, D 0.12 0.13 0.008 0.026 0.003
Italy 116 51 0.51 T2 CS, D 0.65 0.29 0.013 0.075 0.006
Japan 84 51 0.33 CS, T1 CS, D 1.8 1.2 IE 0.42 0.006
Kazakhstan 70 50 1.15 T1 D 1.5 0.47 0.13 0.63 0.036
Latvia 114 62 20 0.92 T1, T2 D 0.081 0.054 0.008
Liechtenstein 115 80 36 0.67 0.091 0.005 0.011
Lithuania 108 37 0.88 T1, T2 D 0.51 0.22 0.045 0.013 0.002
Luxembourg 59 0.32 T2 D 0.025 0.056 0.015
Malta 70 89 0.43 T1, T2 D 1.4 0.80 0.23 0.033 0.004
Monaco
Netherlands 0.35 CS CS IE IE
New Zealand 119 75 0.11 T1 CS NO NO NO 0.15 0.001
Norway 128 65 42 0.20 T1, T2 CS, D 0.033 0.037 0.002
Poland 55 0.55 T1, T2 CS, D 0.044 0.081 0.001
Portugal 119 50 0.30 T2 CS, D 0.53 0.041 0.012 0.003 0.005
Romania 54 38 0.67 T2 D 0.21 0.12 0.014 0.045 0.006
Russian Federation 99 60 0.33 T1 CS, D 0.63 0.36 0.080 0.17 0.007
Slovakia 104 39 0.46 T2 CS 0.69 0.28 0.21 0.090 0.004
Slovenia 58 0.59 T1, T2 CS, D 0.23 0.17 0.017
Spain 111 42 0.71 NA NA 0.90 0.065 0.007 0.035 0.014
Sweden 128 42 0.62 T2 CS 0.77 0.26 0.025 0.074 0.008
Switzerland 115 80 33 0.76 CS D 0.089 0.004 0.005
Turkey 71 40 0.54 T1 D 0.076 0.57 NO 0.070 0.003
Ukraine 75 68 30 0.35 T2 CS 0.019 0.094 0.002
United Kingdom of Great
Britain and Northern Ireland 128 54 0.28 T2 D 0.52 0.26 0.003 0.078 0.001
United States of America 62 0.25 M, T1, T2, T3 CS, D, M 0.20 0.096 0.77
IPCC defaults:
North
America
Western
Europe
Eastern
Europe Oceania Latin America Africa Middle East Asia
Dairy cattle 0.44 0.48 0.35 0.44 0.48 0.6 0.7 0.47
Non-dairy cattle 0.31 0.33 0.35 0.5 0.36 0.63 0.79 0.34
Sheep 0.42 0.85 0.9 1.13 1.17 1.17 1.17 1.17
Swine 0.5 0.68 0.74 0.73 1.64 1.64 1.64 0.5
Poultry 0.83 0.83 0.82 0.82 0.82 0.82 0.82 0.82
b Source of default N excretion rates: 2006 IPCC Guidelines for National Greenhouse Gas Inventories Volume 4 Chapter 10 Emissions from Livestock and Manure Management, table 10.19, page 10.59. Default values are provided by regions as shown below. The unit
of the IPCC defaults is kg N (1000 kg animal mass)-1
day-1
.
N excretion rates
Share of national
totala
Methods and EF used
N2O IEF
Option A Option B
(kg N / head / year) Methods EF (kg N2O/head/yr)
a The national total includes indirect CO2 emissions from the atmospheric oxidation of CH4, CO and NMVOCs for the following Parties: Canada, Czech Republic, Denmark (KP), Denmark (Convention), European Union (KP), European Union (Convention), Finland,
France (KP), France (Convention), Ireland, Latvia, Netherlands, Portugal and Switzerland.
39

Table 3.4
Agriculture soils - N2O (2014)
Activity data
Use of synthetic
fertilizers
(%) (kg N / year) (%) (kg N / year)(kg N2O-N / kg
N)(kg N / year) (kg N2O-N / kg N)
IPCC default EF
8 (2-24)c, 16 (5-48)
d
0.01 (0.002-
0.05)e
0.0075 (0.0005-0.025)e
Australia CS, T1, T2 CS, D 1.93 1 407 441 099 0.004 0.009 0.005 0.010 2.0 8.0 0.53 502 298 046 0.003 611 898 477 0.008
Austria NA NA 2.16 111 810 000 0.010 0.010 0.016 0.010 0.010 NO 0.43 30 307 139 0.010 52 387 323 0.008
Belarus T1, T1a, T1b D 11.43 456 100 000 0.010 0.010 0.020 0.010 NA 8.0 – IE IE IE IE
Belgium T1 D 2.31 144 785 342 0.010 0.010 0.020 0.010 0.010 8.0 0.64 40 303 415 0.010 362 985 171 0.003
Bulgaria T1 D 3.79 174 002 000 0.010 0.010 0.012 0.010 NE NO 1.00 19 077 122 0.010 136 974 553 0.008
Canada T1, T2 CS, D 2.48 2 473 000 000 0.009 0.012 0.002 0.009 0.014 8.0 0.60 373 412 457 0.010 772 161 532 0.008
Croatia T1 D 3.18 80 707 112 0.010 0.010 0.012 0.010 0.010 8.0 1.03 16 015 768 0.010 45 743 734 0.008
Cyprus T1 D 1.30 6 693 000 0.010 0.010 NO 0.010 NE NO 0.13 669 300 0.010 2 157 482 0.008
Czech Republic T1, T2 CS, D 1.90 240 935 400 0.010 0.010 0.018 0.010 NO NO 0.62 64 705 074 0.010 137 213 511 0.008
Denmark (KP) CS, D, T1, T2 D 6.31 186 799 000 0.010 0.010 0.018 0.010 0.010 11 1.00 32 322 993 0.010 165 268 000 0.005
Denmark (Convention) CS, D, T1, T2 CS, D 6.32 186 970 580 0.010 0.010 0.018 0.010 0.010 11 1.00 32 373 241 0.010 165 324 441 0.005
Estonia CS, D, T1, T2 D 2.26 35 806 000 0.010 0.010 0.019 0.010 NO 8.0 0.55 7 938 763 0.010 22 649 879 0.008
European Union (KP) NA NA 3.12 10 888 303 647 0.010 0.010 0.015 0.010 0.008 7.0 0.73 2 079 932 369 0.010 6 373 615 548 0.007
European Union (Convention) NA NA 3.12 10 875 352 647 0.010 0.010 0.015 0.010 0.008 7.1 0.73 2 074 931 983 0.010 6 363 956 469 0.007
Finland T1, T2 CS, D 5.13 147 373 000 0.010 0.010 0.017 0.010 NO 9.7 0.66 9 467 675 0.010 98 552 227 0.008
France (KP) NA NA 6.02 2 189 758 942 0.010 0.010 0.019 0.010 NO 8.0 1.54 399 146 367 0.010 1 472 303 207 0.008
France (Convention) NA NA 5.95 2 195 838 375 0.010 0.010 0.019 0.010 NO 8.0 1.52 400 254 518 0.010 1 476 390 766 0.008
Germany T1, T2 CS, D 2.38 1 675 289 000 0.010 0.010 0.019 0.010 NO 5.1 0.57 391 017 197 0.010 932 493 176 0.007
Greece T1 D 2.43 180 931 000 0.010 0.010 0.011 0.010 NO 8.0 0.86 72 194 888 0.010 152 782 663 0.008
Hungary T1 D 5.26 326 752 530 0.010 0.010 0.014 0.010 0.010 NO 0.45 36 129 082 0.010 24 362 277 0.008
Iceland T1b, T2 CS, D 4.88 12 951 000 0.012 0.012 0.020 0.013 NE 0.96 2.97 5 000 386 0.010 9 659 079 0.025
Ireland T1 CS, D 9.47 331 782 000 0.010 0.010 0.019 0.010 0.010 4.3 0.81 40 992 664 0.010 80 145 460 0.008
Italy CS, T1 CS, D 1.67 505 126 000 0.010 0.010 0.011 0.010 NO 8.0 0.56 138 141 953 0.010 480 017 952 0.007
Japan CS, T2 CS, D 0.28 409 725 234 0.007 0.006 0.008 0.010 0.004 1.4 0.14 138 196 515 0.010 370 830 122 0.008
Kazakhstan T1, T2 CR, CS, D 3.48 80 600 000 0.010 0.011 0.014 0.010 0.010 NO 0.34 105 436 758 0.010 1 656 240 000 0.001
Latvia T1 D 12.57 72 900 000 0.010 0.010 0.019 0.010 NO 12 1.72 12 077 570 0.010 39 715 502 0.008
Liechtenstein T1b D 2.34 168 552 0.010 0.010 0.019 0.010 NO 8.0 0.93 104 604 0.026 173 003 0.007
Lithuania T1 D 7.27 154 000 000 0.010 0.010 0.019 0.010 0.010 0.008 2.15 25 248 665 0.010 83 623 410 0.008
Luxembourg T1 D 1.05 13 944 450 0.010 0.010 0.010 0.010 NO NO 0.39 3 429 609 0.010 7 239 309 0.007
Malta T1 D 0.67 635 630 0.010 0.010 NO 0.010 NO NO 0.25 600 450 0.010 4 276 418 0.002
Monaco
Netherlands T1, T1b, T2 CS, D 2.42 213 231 045 0.013 0.009 0.033 0.012 NO 7.5 0.30 47 240 435 0.011 91 189 101 0.008
New Zealand T1, T2 CS, D 8.76 376 890 000 0.005 0.010 0.008 0.010 0.010 8.0 1.75 196 159 522 0.010 143 241 348 0.008
Norway T1 CS, D 2.62 102 126 000 0.010 0.010 0.015 0.010 IE 13 0.42 13 836 781 0.010 45 138 715 0.007
Poland T1 CS, D 2.85 1 098 455 000 0.010 0.010 0.019 0.010 0.010 8.0 0.69 172 176 616 0.010 517 903 655 0.008
Portugal T1, T2 CS, D 2.69 129 566 172 0.010 0.010 0.018 0.010 NO 0.70 24 685 511 0.011 91 056 909 0.008
Romania T1 D 3.31 272 700 000 0.010 0.010 0.015 0.010 NO 8.0 0.32 74 874 239 0.010 NO NO
Russian Federation CS, T1, T2 CS, D 2.01 1 194 487 400 0.014 0.010 0.018 0.010 0.010 8.0 0.35 495 967 772 0.010 2 114 304 709 0.008
Slovakia T1, T2 CS, D 3.04 119 036 050 0.010 0.010 0.014 0.010 NO NO 0.94 22 621 049 0.010 78 214 070 0.008
Slovenia T1 D 2.00 28 612 000 0.010 0.010 0.017 0.010 NO 8.0 0.67 8 940 767 0.010 19 605 773 0.008
Spain CS, T1a, T1b D 3.17 1 101 895 000 0.010 0.010 0.020 0.010 NA NO 0.99 252 370 790 0.010 586 987 732 0.008
Sweden CS, T1, T2 CS, D 5.51 181 090 000 0.010 0.010 0.017 0.010 0.010 13 0.54 21 619 264 0.010 54 262 708 0.008
Switzerland CS, T1b D 2.28 49 504 320 0.010 0.010 0.019 0.010 0.010 8.0 1.03 27 876 023 0.026 44 035 294 0.007
Turkey T1 D 2.47 1 486 568 332 0.010 0.010 0.014 0.010 0.010 NE 0.76 212 236 163 0.010 726 294 056 0.008
Ukraine CS, T2 CS 6.68 1 052 799 000 0.010 0.010 0.019 0.010 0.010 8.0 1.63 213 369 246 0.010 1 355 441 254 0.008
United Kingdom of Great
Britain and Northern Ireland
CS, T1, T1a, T2 CS, D 2.21 1 150 736 973 0.009 0.005 0.004 0.010 0.006 8.0 0.51 111 252 870 0.010 624 532 174 0.008
United States of America D, T3 D, M 3.71 11 459 419 388 0.011 0.012 0.005 0.007 0.009 9.0 0.81 3 749 670 960 0.011 13 861 563 628 0.006
b Source of default emission factors: 2006 IPCC Guidelines for National Greenhouse Gas Inventories, table 11.1, page 11.11. IEFs for N-fixing crops and crop residues are shown in the unit kg N2O-N/kg N. The unit of the IPCC default emission factor is also kg N2O-N/kg N.
c For cultivation of histosols (drained/managed organic soils), the two default values refer to temperate. The values in parenthesis indicate the range as presented in 2006 IPCC Guidelines for National Greenhouse Gas Inventories, table 11.1, page 11.11.
d For cultivation of histosols (drained/managed organic soils), the two default values refer to temperate tropical. The values in parenthesis indicate the range as presented in 2006 IPCC Guidelines for National Greenhouse Gas Inventories, table 11.1, page 11.11.
e Source of default emission factor: 2006 IPCC Guidelines for National Greenhouse Gas Inventories, table 11.3, page 11.24.
Methods EF
N2O IEF
(kg N2O-N / kg N)
0.01 (0.003-0.03)b
Share of
national
totala
Atmospheric deposition Nitrogen leaching and run-off
N2O IEF Activity data N2O IEF
a The national total includes indirect CO2 emissions from the atmospheric oxidation of CH4, CO and NMVOCs for the following Parties: Canada, Czech Republic, Denmark (KP), Denmark (Convention), European Union (KP), European Union (Convention), Finland, France (KP), France (Convention), Ireland, Latvia, Netherlands, Portugal
and Switzerland.
Activity data N2O IEF
Methods and EF used
Direct N2O emissions from managed soils Indirect N2O emissions from managed soils
Share of
national
totala
Inorganic N fertilizersOrganic N
fertilizers
Urine and dung
deposited by grazing
animals
Crop
residue
Loss/gain of soil
organic matter
Cultivation of organic
soils
40

Table 4.1a
Methods and emission factors used (2014)
Method EF Method EF Method EF Method EF Method EF Method EF Method EF Method EF Method EF
Australia CS, T2, T3 CS, M CS CS CS, T2 CS CS, T3 CS, M CS CS CS, T2 CS T3 CS, M CS CS CS, T2 CS
Austria NO NA NO NO NA NA NA NO NO NA NA NA NA
Belarus T1, T2 CS, D T1 D T1 D T1 D NA NA
Belgium CS, T1, T2 CS NA NA T1 D CS, T1, T2 CS NA NA T1 D CS, T1, T2 CS NA NA T1 D
Bulgaria T1, T3 CS, D T1 D T1 D T1, T3 CS, D T1, T3 CS NA NA
Canada T3 CS T2 CS T2 CS T2, T3 CS T2 CS T2 CS NA NA NA NA NA NA
Croatia T2 CS, D T1 D T1 D T1 CS, D NA NA T1 CS, D T1 CS, D T1 D T1 D
Cyprus NA NA T1 T1 NA NA
Czech Republic T2 CS, D T2 CS, D T2 CS, D T1, T2 CS, D NA NA T1, T2 CS, D T1, T2 CS, D NA NA NA NA
Denmark (KP) T1, T2, T3 CS, D NA NA T1 D NA NA NA NA T1 D T1, T2 CS, D T1 D T1 D
Denmark (Convention) T1, T2, T3 CS, D NA NA T1 D NA NA NA NA T1 D T1, T2 CS,D T1 D T1 D
Estonia T1, T2, T3 D, OTH T2 NA T2 NA T1, T2 D NA NA T1 D T1, T2, T3 D, OTH T2 D T2 D
European Union (KP) NA NA
European Union (Convention) NA NA
Finland T2, T3 CS, D T2 CS, D T2 CS, D T2, T3 CS, D T2 D T2 CS, D T2, T3 CS, D T2 D T2 CS, D
France (KP) NA NA NA NA
France (Convention) NA NA NA NA
Germany CS, T2 CS T2 CS, D CS, T2 CS, D T2 CS T2 CS T2 CS T2 CS T2 CS T2 CS, D
Greece OTH, T1, T2 CS, D, OTH T1 D T1 D T1, T2 CS, D NA NA T1 D T1, T2 CS, D T1 D T1 D
Hungary T1, T2 CS, D T1, T2 CS, D T1, T2 CS, D T1, T2 CS, D T1 D T1 D T1, T2 CS, D T1 D T1 D
Iceland T1, T2, T3 CS, D T1 D T1, T2 D T1, T2 CS, D T1 D NA NA T1, T2, T3 CS, D T1, T2 CS, D T2 CS, D
Ireland CS, T1, T2, T3 CS D, T1 CS, D D, T1 CS, D CS, D, T1 D D, T1 D D, T1 D D, T1, T3 CS, D D, T1 D D, T1 D
Italy T1, T2, T3 CS, D T2 CS, D T2 CS, D T1, T2 CS, D T1 D T1 D T1, T2, T3 CS, D T1 CS T1 CS
Japan T1, T2, T3 CS, D T1 D T1, T2 CS, D T1, T2 CS, D CS CS T1, T2 CS, D
Kazakhstan T1, T2 CS, D T1 D T1 D T2 CS T2 CS, D T1, T2 CS, D T1 D T1 D
Latvia T1, T2 CS, D T1, T2 D T1, T2 D T1, T2 CS, D T1 D T1 D T1, T2 CS, D D,T1 D D D
Liechtenstein T2 CS NA NA T2 CS T2 CS T2 CS T2 CS
Lithuania T1, T2 CS, D T1, T2 D T1, T2 D T1, T2 CS, D T1, T2 CS, D T1, T2 CS, D T1, T2 CS, D T1, T2 CS, D T1, T2 CS, D
Luxembourg T1, T2 CS, D NA NA NA NA T1 CS, D NA NA T1 D T1 CS, D NA NA NA NA
Malta D D D D D D NO NO NO NO NO NO NO NO NO NO NE, NO NE, NO
Monaco
Netherlands T1, T2 CS, D T1 CS, D T1 CS, D CS, T1 CS, D NA NA D, T1 CS CS, T1, T2 CS, D CS D CS, D, T1 CS, D
New Zealand T1, T2, T3 CS, D T1, T2 CS, D T1, T2 CS, D T1, T2, T3 CS, D NA NA T1, T2 CS, D T1, T2, T3 CS, D T1, T2 CS, D T1, T2 CS, D
Norway T1, T2, T3 CS, D T1 D T1 D T1, T2, T3 CS, D NA NA T1 D T1, T2, T3 CS, D NA NA NA NA
Poland D, T2 CS, D D, T2 CS, D D, T2 CS, D T1, T2 D NO NO T1 D D, T1, T2 CS, D D, T1 CS, D D, T1 CS, D
Portugal CS, T2 CS, D D D D D D D D D D D D D
Romania T1, T2, T3 CS, D T1 D T1 D T1 D T1 D T1 D T1, T2 CS, D T1 D T1 D
Russian Federation CS, T2 CS, D T1, T2 CS, D T1, T2 CS, D CS, T1 CS, D T1 D NA NA CS, T1, T3 CS T1 D T1 D
Slovakia T2 CS, D T2 D T2 D T2 CS NA NA T2 CS T2 CS NA NA T2 D
Slovenia CS, D, T1, T2, T3 CS, D D, T1 D D, T1 D D, T1, T2 CS, D NA NA D, T1 D D, T1, T2, T3 CS, D NA NA
Spain CS, T1, T2 CS, D CS D CS, T1 D T1, T2 CS, D NA NA T1 D CS, T1, T2 CS, D CS D CS, T1 D
Sweden T2, T3 CS T1 D T1 CS, D T2, T3 CS T1 CS T1 CS T2, T3 CS T1 CS, D T1 D
Switzerland T2 CS T1 D T1 D T2 CS NA NA T1 D T2 CS T1 D T1 D
Turkey T2 CS, D T2 D T2 D T1, T2 D NA NA D, T1, T2 CS, D NA NA
Ukraine CS, T1, T2 CS, D CS, T1 D CS, T1 D CS, T1, T3 CS, D CS, T1 D CS, T1 D CS, T1, T3 CS, D T1 D T1 D United Kingdom of Great
Britain and Northern Ireland CS, D, T3 CS D CS D, T1 CS CS, D, T1, T3 CS, D D CS D CS, D CS, D, T1, T3 CS, D D CS D CS, D
United States of America T2, T3 CS, D T2 D T1, T2 D T2, T3 CS NA NA NA NA T2, T3 CS NA NA NA NA
CH4 N2O
Forest Land Cropland Grassland
CO2 CH4 N2O CO2 CH4 N2O CO2
41

Table 4.1b
Methods and emission factors used (2014)
Method EF Method EF Method EF Method EF Method EF Method EF Method EF Method EF Method EF Method EF
Australia IE, NE IE, NE IE, NE IE, NE IE, NE IE, NE IE, NE IE, NE NE NE IE, NE IE, NE NA NA NA NA NA NA T2, T3 D, M
Austria NA NA NA NA NA NA NA NA NA NA
Belarus T2 CS NA NA NA NA NA NA NA NA NA NA NA NA
Belgium CS, T1 CS NA NA T1 D CS, T1 CS NA NA T1 D NA NA NA NA NA NA T2 D
Bulgaria NA NA NA NA T1 NA NA NA T2 CS NA NA T1, T2 D
Canada T2, T3 CS NA NA NA NA T2, T3 CS NA NA NA NA T3 CS
Croatia T1 D NA NA T1 D T1, T2 CS, D NA NA T1 D NA NA NA NA NA NA T2 D
Cyprus NA NA NA NA NA NA T1 NA
Czech Republic T1, T2 CS, D NA NA NA NA T2 CS NA NA D D T2 CS NA NA NA NA T1, T2 D
Denmark (KP) T1, T2 D T1 D T1 D NA NA NA NA T1 D NA NA NA NA NA NA
Denmark (Convention) T1, T2 D T1 D T1 D NA NA NA NA T1 D NA NA NA NA NA NA NA NA
Estonia T2 CS, D T2 CS T2 CS T2 OTH NA NA NA NA T2 OTH NA NA NA NA T2, T3 CS, D
European Union (KP) NA NA NA NA
European Union (Convention) NA NA NA NA
Finland T1, T2, T3 CS, D T1, T2 CS, D T1, T2, T3 CS, D T2, T3 CS, D T2 D T1, T2 D T2 D T2 D T2 D T2 D
France (KP) NA NA NA NA NA NA NA NA NA NA NA NA
France (Convention) NA NA NA NA NA NA NA NA NA NA NA NA
Germany T2 CS T2 CS T2 CS T2 CS NA NA T2 CS NA NA NA NA NA NA CS, T2 D
Greece T1 D NA NA NA NA T1, T2 CS, D NA NA NA NA T1, T2 CS, D NA NA NA NA T2 D
Hungary T1, T2 CS, D NA NA T1 D T1,T2 CS,D NA NA T1 D T2 CS, D NA NA T1 D T2 D
Iceland RA, T1, T2 CS, D RA, T1, T2 CS, D T2 CS, D T1, T2, T3 CS NA NA NA NA NA NA
Ireland D, T1, T3 CS, D D, T1 D D,T1 D D, T1, T3 CS, D, OTH T1 D T1, T3 CS T1 D T2 D
Italy T1 D NA NA NA NA T1 D, OTH NA NA T1 D NA NA NA NA NA NA T2 CS
Japan NA NA T2 CS, D NA NA T2 CS, D T2, T3 CS, D
Kazakhstan NA NA T1 D NA NA NA NA T2 CS
Latvia T1, T2 CS, D T1 D T1 D T2 CS NA NA T1 D NA NA NA NA NA NA T2 CS
Liechtenstein T2 CS T2 CS T2 CS T2 CS T2 CS T2 CS T2 CS
Lithuania T1 D NA NA T1 D T1, T2 CS, D NA NA T1, T2 D T1, T2 CS, D NA NA T1, T2 D T1 D
Luxembourg T1 CS, D NA NA NA NA T1 CS, D NA NA NA NA T1 CS NA NA NA NA NA NA
Malta NO NO NO NO NO NO NA NA NA NA NA NA NO NO
Monaco
Netherlands T1, T2 CS, D D, T1 CS T1 CS, D T1 CS T1 CS, D T1 CS T1 D
New Zealand T1, T2 CS, D NA NA T1, T2 CS, D T1,T2 CS, D NA NA T1, T2 CS, D T1, T2 CS, D NA NA T1, T2 CS, D T2 CS, D
Norway T1, T2, T3 CS, D NA NA NA NA T1, T2, T3 CS, D T1 D T1, T2, T3 CS, D T2 D
Poland NO NO NO NO NO NO T1, T2 CS, D NA NA NA NA NO NA NO NA NO NA NA NA
Portugal NA NA NA NA NA NA D D
Romania T1 D T1 D T1, T2 D T1 D T1 D T1 D T1 D T1 D T1 D T2 CS
Russian Federation T1 D T1 D T1 D CS, T1, T2 CS NA NA T1 D T1 CS NA NA T1 D T1 D
Slovakia NA NA NA NA NA NA T2 CS NA NA T2 D T2 CS NA NA T2 D T2 D
Slovenia D, T1, T2 CS, D NA NA D, T2 CS, D NA NA D, T2 CS, D NA NA NA NA D, T1 D
Spain T1, T2 CS, D NA NA T1 D T1, T2 CS, D NA NA T1 D T1, T2 CS, D NA NA T1 D T1 D
Sweden T1 CS T1 CS T1 CS T2, T3 CS NA NA T1 CS, D NA NA NA NA NA NA T3 CS
Switzerland NA NA NA NA T1 D NA NA NA NA NA NA T2 CS NA NA T1 D T2 D
Turkey NA NA NA NA CS D NA NA NA NA NA NA D D
Ukraine CS, T1 CS, D CS, T1 D CS, T1 D CS, T1 CS, D NA NA T1 D CS, T1 CS, D NA NA T1 D T2 D
United Kingdom of Great
Britain and Northern Ireland D D NA NA D CS CS, D, T3 CS, D D CS D CS, D D D NA NA NA NA CS, T3 CS United States of America T1 D NA NA NA NA T2, T3 NA NA NA T2, T3 NA T3 CS
CO2 CH4 N2O CO2
Wetlands Settlements Other Land Harvested Wood Products
CO2 CH4 N2O CO2 CH4 N2O
42

Table 4.2
Forest land - AD, IEFs, carbon stock changes in pools and net CO2 emissions/removals (2014)a, b
Gains Losses Net Change Mineral soils Organic soils Gains Losses Net Change Mineral soils Organic soils
IPCC default EF
Australia 0.072 IE 0.072 –0.008 0.001 0.002 IE 0.64 IE, NO 0.64 0.13 0.12 -0.27 NO
Austria 2.4 -2.1 0.31 0.059 IE, NE -0.18 NO 1.7 -0.52 1.2 0.016 1.2 0.73 NO
Belarus 1.5 -0.98 0.56 NE NE NE NE NE, NO NE, NO NE, NO NE, NO NE, NO NE, NO NE, NO
Belgium 1.1 -0.16 0.94 –0.012 0.004 0.53 NO 2.6 0 2.6 NO NO 1.6 NO
Bulgaria 0.72 IE, NO 0.72 NO NO NO NO 2.2 -0.35 1.9 NO 0.27 -1.2 NO
Canada 3.5 -3.3 0.19 0.20 -0.13 0.032 IE 3.7 -1.4 2.3 0.2 -0.13 0.032 IE, NO
Croatia 1.7 -1.00 0.75 NO NO NO NO 1.3 -0.76 0.49 NO IE, NO 0.73 NO
Cyprus 1.2 -0.011 1.2 NO NO NO NO
Czech Republic 3.0 -2.2 0.79 NO NO NO NO 1.9 NO 1.9 0.007 0.56 0.13 NO
Denmark (KP) 1.6 IE 1.6 0.13 0.40 NA -1.30 NO -1.3 -1.3 –0.001 0.022 0.11 -1.3
Denmark (Convention) 1.6 IE, NO 1.6 0.13 0.40 NA, NO -1.30 NO -1.3 -1.3 –0.001 0.022 0.11 -1.3
Estonia IE –0.018 –0.018 –0.013 NO 0.16 -0.17 3.8 IE 3.8 0.011 0.30 -0.38 -0.30
European Union (KP) 1.3 -0.68 0.62 0.016 –0.007 0.080 -0.42 1.8 -0.48 1.3 0.038 0.20 0.32 -0.63
European Union (Convention) 1.3 -0.69 0.62 0.016 –0.007 0.080 -0.42 1.8 -0.48 1.3 0.038 0.20 0.32 -0.64
Finland 1.6 -1.3 0.34 IE IE 0.16 -0.30 1.5 –0.015 1.5 NA IE, NA 0.063 -1.9
France (KP) 1.8 -1.0 0.80 –0.033 NO NO NO 1.4 -0.17 1.3 0.045 0.25 0.24 -2.0
France (Convention) 1.8 -1.0 0.80 –0.033 NO NO NO 1.4 -0.17 1.3 0.045 0.25 0.24 -2.0
Germany 1.0 IE 1.0 –0.052 –0.013 0.41 -2.2 3.6 -0.36 3.3 0.034 0.47 -0.37 -2.2
Greece 0.17 IE, NO 0.17 NA, NO NA, NO NA, NO NA, NO 0.90 -0.48 0.41 NE, NO NE,NO NE,NO NO
Hungary 0.47 IE, NO 0.47 NO NO NO -2.6 1.9 –0.040 1.9 IE, NE, NO IE, NE, NO 0.34 NO
Iceland 0.10 IE 0.10 IE, NE NE NE -0.37 1.1 –0.028 1.1 IE, NA, NO 0.14 0.40 -0.37
Ireland 5.5 -5.7 -0.27 IE 0.57 NO -0.47 4.9 -2.5 2.4 IE, NO 1.05 NO -0.73
Italy 2.4 -1.5 0.93 0.008 0.014 NA, NO NO 2.6 -1.6 1.00 0.008 0.014 0.20 NO
Japan 0.70 IE, NA 0.70 –0.023 0.004 0.026 NO 2.9 –0.003 2.9 -0.022 0.004 0.026 NO
Kazakhstan 0.024 NO 0.024 IE NE NE NO NO NO NO NO NO NO NO
Latvia 2.7 -2.7 0.047 0.33 NO NO -2.6 0.46 IE, NE, NO 0.46 0.11 0.097 NE, NO -0.89
Liechtenstein 2.5 -2.5 –0.038 0.016 IE NO NO 1.2 NO 1.2 NO NO NO NO
Lithuania 1.1 IE 1.1 0.079 NO NO IE 1.6 IE 1.6 NO 1.20 NO IE
Luxembourg 3.1 -1.9 1.3 NO NO NO NO 3.1 –0.061 3.1 0.28 0.96 1.7 NO
Malta 0.78 0 0.78 0 0 0 NO NO NO NO 0 0 0 NO
Monaco
Netherlands 2.7 -0.79 1.9 0.016 NO NO NO 1.8 -0.31 1.5 NO NO –0.014 -0.22
New Zealand 1.2 -0.84 0.33 0.008 –0.002 0.000 -0.11 8.2 -3.8 4.4 0.78 -0.22 -0.36 -0.68
Norway 0.93 -0.36 0.57 0.023 0.11 0.003 -0.27 0.58 –0.090 0.49 0.023 0.12 0.0002 -0.27
Poland 0.90 IE 0.90 NO NO 0.11 -0.68 1.0 NO 1.0 NO NO 0.11 -0.68
Portugal 2.0 -1.3 0.69 IE –0.002 0.004 NO 2.3 -0.40 1.9 IE –0.011 0.38 NO
Romania 1.6 -0.73 0.90 NO NO NO -0.68 1.1 IE 1.1 0.084 NO 1.8 NO
Russian Federation 0.30 -0.09 0.21 0.021 0.006 0.027 -0.71 0.011 –0.004 0.008 0.001 0.000 0.002 NA,NO
Slovakia 2.5 -1.9 0.59 NO NO NO NO 1.6 NO 1.6 NO 0.42 1.2 NO
Slovenia 1.5 IE 1.5 –0.001 NO NO NO 0.99 NA, NO 0.99 NA, NO NA, NO 1.7 NA, NO
Spain 0.51 IE 0.51 NE NE NE NO 1.1 IE, NO 1.1 0.16 0.10 0.65 NO
Sweden 0.37 IE 0.37 0.085 –0.075 0.14 -0.38 0.74 IE 0.74 0.025 0.33 -0.075 -0.37
Switzerland 2.9 -2.4 0.53 0.003 –0.146 0.001 -2.6 1.4 -0.82 0.55 0.19 1.3 0.58 -2.5
Turkey 0.87 -0.39 0.48 NE NE NE NE 0.45 –0.093 0.36 NE 0.31 2.4 NE
Ukraine 1.7 -0.33 1.4 0.29 0.020 NO -0.68 0.56 –0.008 0.55 0.053 0.12 0.004 NO
United Kingdom of Great
Britain and Northern Ireland 2.6 -1.3 1.2 IE 0.23 0.23 0.77 0.93 –0.019 0.91 IE, NO 0.034 1.1 2.6
United States of America 0.39 IE 0.39 0.054 0.033 0.15 IE NA NA NA NA NA 0.10 NO
Forest land remaining forest land Land converted to forest land
IEF (t C/ha)
CSCc in living biomass/area
d
Net CSCc in dead
wood/area
Net CSCc in
litter/area
Net CSCc in soils/area
e,fCSC
c in living biomass/area
d
Net CSCc in dead
wood/area
Net CSCc in
litter/area
f Parties who wish to do so may report annual on-site CO2-C emissions/removals and off-site CO2-C emissions from drained and rewetted organic soils here.
Net CSCc in soils/area
e,f
a The signs for estimates of gains in carbon stocks are positive (+) and of losses in carbon stocks are negative (–).
b Where Parties directly estimate emissions and removals rather than carbon stock changes, they may use notation keys only in the stock change columns.
c CSC = carbon stock change.
d Carbon stock gains and losses should be listed separately except in cases where, due to the methods used, it is technically impossible to separate information on gains and losses.
e When Parties cannot estimate carbon stock changes for organic and mineral soil separately, these should be reported under mineral soils.
43

Table 4.3
Cropland - AD, IEFs, carbon stock changes in pools and net CO2 emissions/removals (2014)a, b
Gains Losses Net Change Mineral soils Organic soils Gains Losses Net Change Mineral soils Organic soils
IPCC default EF
Australia IE 0.000 0.000 NA 0.011 IE IE, NE, NO -0.28 -0.28 -0.21 -0.19 IE, NE, NO
Austria 0.12 -0.14 –0.023 NO 0.11 NO 0.31 -0.28 0.027 –0.039 -0.98 NO
Belarus 2.1 -0.59 1.5 NE, NO NE NE NE, NO NE, NO NE, NO NE, NO NE NE
Belgium NO 0.000 0.000 NO 0.29 -10.0 NO -0.11 -0.11 –0.011 -1.3 NO
Bulgaria 0.11 -0.15 –0.036 NO –0.001 NO 0.24 -0.26 –0.027 NO -0.17 NO
Canada 0.001 –0.001 0.000 -0.009 0.073 -5.0 NE, NO -0.89 -0.89 -1.48 1.07 C, IE, NE, NO
Croatia 0.18 -0.16 0.017 NO 0.000 -10.0 0.63 -0.13 0.50 NO -0.90 NO
Cyprus NE NE NE NE NE NO NE NE NE NE NE NO
Czech Republic NO 0.000 0.000 NO 0.007 NO 0.005 -0.16 -0.16 –0.004 -0.33 NO
Denmark (KP) 0.084 -0.12 –0.038 NO -0.14 -9.3 1.1 -0.80 0.34 NA,NO 0.020 NO,IE
Denmark (Convention) 0.084 -0.12 –0.038 NO -0.14 -9.3 1.1 -0.80 0.34 NA, NO 0.020 -5.0
Estonia IE –0.001 –0.001 NO 0.097 -5.0 IE, NO -0.13 -0.13 –0.008 -1.4 -5.0
European Union (KP) 0.033 –0.031 0.002 0.000 0.001 -5.0 0.11 -0.23 -0.12 –0.014 -0.88 -6.8
European Union (Convention) 0.033 –0.031 0.002 0.000 0.001 -4.8 0.11 -0.23 -0.12 –0.014 -0.88 -6.8
Finland 0.000 0.000 0.000 NE 0.006 -6.5 0.20 -1.6 -1.4 –0.008 -0.77 -6.8
France (KP) 0.096 –0.096 0 NO NO NO NO -0.16 -0.16 –0.018 -1.2 -3.5
France (Convention) 0.096 –0.096 0 NO NO NO NO -0.16 -0.16 –0.018 -1.2 -3.5
Germany NO NO NO NO NO -8.1 0.34 -0.36 –0.019 –0.009 -0.79 -8.1
Greece 0.056 –0.012 0.044 NO NO -10.0 NO -0.60 -0.60 NO -0.72 NO
Hungary 0.008 –0.009 –0.001 NO 0.036 NO 0.13 -0.13 0.006 –0.019 -0.81 NO
Iceland NO NO NO NO NE -7.9 0.11 -0.77 -0.67 IE, NA 0.10 -7.9
Ireland 0.036 –0.033 0.003 NO –0.002 NO NO NO NO NO NO NO
Italy 0.000 –0.069 –0.069 NO NO -10.0 NO NO NO NO -1.1 NO
Japan IE –0.009 –0.009 NA -0.17 -2.4 IE, NA -1.1 -1.1 -0.49 IE IE
Kazakhstan 0.044 NO 0.044 NE -0.37 NO NO NO NO NO NO NO
Latvia 0.002 –0.001 0.001 0.000 NO -7.9 NO -0.35 -0.35 -0.14 -1.1 -7.9
Liechtenstein NO NO NO NO NO -9.5 0.18 -0.25 –0.079 NO -0.27 -11.4
Lithuania 0.005 –0.002 0.003 NO 0.011 -5.0 NO -0.12 -0.12 NO -1.2 -5.0
Luxembourg 0.014 –0.023 –0.009 NO 0.001 NO 0.10 -0.19 –0.088 –0.025 -1.1 NO
Malta 0.22 NE 0.22 0 0 NO IE, NO IE, NO IE, NO IE, NO IE, NO NO
Monaco
Netherlands NE NE NE NE NO -4.0 0.54 -0.76 -0.22 –0.034 -0.79 -4.1
New Zealand 0.013 –0.009 0.004 0 –0.001 -9.9 0.40 -0.25 0.15 –0.016 -0.56 -10.0
Norway 0.005 –0.002 0.003 NO 0.000 -7.9 0.018 -0.94 -0.92 -1.9 1.0 -7.9
Poland 0.034 IE 0.034 NO –0.002 -1.0 NO NO NO NO –0.054 NO
Portugal 0.031 –0.014 0.018 NO 0.007 NO 0.14 -0.33 -0.19 –0.061 -0.71 NO
Romania 0.033 IE 0.033 –0.002 0.075 -2.5 0.22 -0.30 –0.081 –0.026 –0.076 NO
Russian Federation 0.014 0 0.014 NO -0.20 -5.9 NO NO NO NO NO NO
Slovakia 0.17 –0.016 0.15 NO 0.008 NO NO –0.059 –0.059 –0.020 -0.69 NO
Slovenia 0.38 -0.25 0.14 NA, NO –0.001 -10.0 0.014 -0.77 -0.76 –0.045 -0.37 NO
Spain IE –0.011 –0.011 NE 0.025 NO 0.029 –0.019 0.010 –0.003 -0.71 NO
Sweden 0.025 IE 0.025 0.000 –0.087 -6.2 0.095 -0.57 -0.47 –0.077 -0.30 -6.2
Switzerland 0.025 NO 0.025 NO NO -9.5 0.028 -0.11 –0.083 –0.002 -0.25 -8.8
Turkey 0.073 -0.39 -0.32 0 1.2 -9.5 0.27 -1.4 -1.09 0.20 -0.13 NE, NO
Ukraine 0.044 NO 0.044 NO -0.34 -10.0 NO NO NO NO -0.13 NO
United Kingdom of Great
Britain and Northern Ireland 0.003 0.000 0.003 NO -0.32 -5.0 IE, NO –0.029 –0.029 0.000 -1.3 -5.0
United States of America NE NE NE NE 16 –0.050 NA -0.27 -0.27 NE -0.15 -8.9
g No reporting on DOM pools is required for category cropland remaining cropland.
h When Parties cannot estimate carbon stock changes for organic and mineral soil separately, these should be reported under mineral soils.
i Parties who wish to do so may report annual on-site CO2-C emissions/removals and off-site CO2-C emissions from drained and rewetted organic soils here.
a The signs for estimates of gains in carbon stocks are positive (+) and of losses in carbon stocks are negative (–).
b Where Parties directly estimate emissions and removals rather than carbon stock changes, they may use notation keys only in the stock change columns.
c CSC = carbon stock change.
d Carbon stock gains and losses should be listed separately except in cases where, due to the methods used, it is technically impossible to separate information on gains and losses.
e For category cropland remaining cropland this column only includes changes in perennial woody biomass.
f DOM = dead organic matter.
Cropland remaining cropland Land converted to cropland
IEF (t C/ha)
CSCc in living biomass/area
d,e
Net CSCc in
DOMf/area
g
Net CSCc in soils/area
h,iCSC
c in living biomass/area
d,e
Net CSCc in
DOMf/area
g
Net CSCc in soils/area
h,i
44

Table 4.4
Grassland - AD, IEFs, carbon stock changes in pools and net CO2 emissions/removals (2014)a, b
Gains Losses Net Change Mineral soils Organic soils Increase Decrease Net Change Mineral soils Organic soils
IPCC default EF
Australia 0.003 –0.002 0.001 IE 0.003 IE IE, NE, NO -0.18 -0.18 -0.15 -0.23 IE, NE, NO
Austria NO NO NO NO 0.002 -0.25 0.29 -1.00 -0.70 -0.40 0.89 NO
Belarus NE, NO NE, NO NE, NO NE, NO NE, NO NE, NO NE, NO NE, NO NE, NO NE, NO NE, NO NE, NO
Belgium NO NO NO NO 0.095 -2.5 NO –0.034 –0.034 0.001 1.3 NO
Bulgaria NO NO NO NO NO NO 1.3 -1.3 0.092 NO 1.2 NO
Canada NA, NO NA, NO NA, NO NA, NO NE, NO NE, NO NO NO NO NO NO NO
Croatia NO NO NO NO NO -2.5 0.55 -1.4 -0.84 NO 1.1 NO
Cyprus NE NO NE NE NE NE NE NO
Czech Republic NO NO NO NO 0.090 NO 0.045 –0.045 0.000 –0.001 0.47 NO
Denmark (KP) NO -0.37 -0.37 NO NO -8.4 0.55 -0.91 -0.36 –0.038 –0.022 -8.4
Denmark (Convention) 0.000 -0.19 -0.19 NO NO -6.3 0.55 -0.91 -0.36 –0.038 –0.022 -8.4
Estonia 0.080 IE 0.080 0.006 NO -0.78 0.18 -0.49 -0.31 -0.11 0.86 -5.1
European Union (KP) 0.066 –0.053 0.013 0.001 0.020 -3.2 0.11 -0.25 -0.14 –0.026 0.76 -3.4
European Union (Convention) 0.071 –0.057 0.014 0.002 0.021 -4.7 0.11 -0.26 -0.14 –0.027 0.77 -3.1
Finland 0.39 NE 0.39 NE NA -3.5 0.13 -0.24 -0.11 NA, NE, NO 0.078 -3.5
France (KP) 0.16 -0.16 0 NO NO NO NO -0.12 -0.12 –0.016 1.1 -2.4
France (Convention) 0.16 -0.16 0 NO NO NO NO -0.12 -0.12 –0.016 1.1 -2.4
Germany 0.041 –0.009 0.032 NO –0.001 -6.2 0.43 -0.45 –0.021 –0.069 0.82 -6.4
Greece NO 0.000 0.000 NO NO NO NO -0.15 -0.15 NO 0.71 NO
Hungary NO NO NO NO 0.000 NO 0.15 -0.26 -0.11 –0.011 0.85 NO
Iceland 0.000 IE, NO 0.000 0.000 0.000 -5.7 0.086 IE, NA, NO 0.086 0.001 0.48 -5.7
Ireland NO NO NO NO 0.012 -3.9 0.31 -0.13 0.18 –0.009 NO -5.1
Italy 0.43 -0.35 0.075 0.004 NA, NO -2.5 NO –0.044 –0.044 NO 1.1 NO
Japan NA NA NA NA 0.036 -0.14 0.23 -0.30 –0.072 -0.13 IE, NO IE, NO
Kazakhstan NO –0.003 –0.003 IE 0.012 NO NO NO NO NO NO NO
Latvia 0.028 –0.008 0.020 0.004 NO -6.1 NE, NO NE, NO NE, NO NE, NO 1.1 -4.1
Liechtenstein 0.076 –0.065 0.011 NO 0.008 -8.9 0.42 -1.4 -1.0 -0.41 0.11 -9.4
Lithuania NO NO NO NO NO -0.25 0.002 NO 0.002 NO 1.4 -0.25
Luxembourg NO NO NO NO NO NO 0.048 -0.30 -0.25 –0.057 1.4 NO
Malta NO NO NO NO NO NO NO NO NO NO NO NO
Monaco
Netherlands NE NE NE NE 0.000 -4.6 0.63 -0.79 -0.16 -0.16 0.68 -4.2
New Zealand 0.003 –0.003 0.001 0.000 0.000 -2.2 0.25 -7.4 -7.1 -0.66 0.53 -2.1
Norway 0.12 –0.070 0.047 NO –0.041 -6.1 0.39 -0.87 -0.48 -3.1 2.0 -6.1
Poland NO NO NO NO –0.015 -0.25 0.23 IE, NO 0.23 IE, NO 0.95 NO
Portugal NO NO NO NO 0.20 NO 0.047 -0.19 -0.14 –0.046 -0.44 NO
Romania 0.095 NE, NO 0.095 NO NO 0.25 0.003 -0.38 -0.38 –0.008 0.13 NO
Russian Federation NA NA NA NA 0.029 -5.8 0.21 NA, NO 0.21 0.17 0.40 -7.8
Slovakia NO NO NO NO NO NO 0.002 –0.064 –0.062 –0.009 0.71 NO
Slovenia NA NA NA NA NA NA 0.21 -0.93 -0.73 -0.12 0.34 NA, NO
Spain NE NE NE NE NE NO IE, NO -0.84 -0.84 -0.13 0.34 NO
Sweden 0.072 IE 0.072 0.25 0.14 -1.6 0.13 -0.67 -0.54 -0.24 0.079 -3.0
Switzerland 0.015 –0.008 0.006 NO 0.010 -9.1 0.14 -0.94 -0.81 -0.35 0.53 -9.0
Turkey NE NE NE NE NE -0.93 0.67 -0.45 0.21 -0.25 -1.2 NE
Ukraine NO NO NO NO 0.008 -2.5 NO NO NO NO NO NO
United Kingdom of Great
Britain and Northern Ireland 0.002 –0.002 0.000 NO 0.11 IE, NO 0.033 –0.041 –0.008 –0.006 0.64 -0.25 United States of America NE NE NE NE 0.001 -3.1 NA -0.72 -0.72 NE 0.15 -3.1
g When Parties cannot estimate carbon stock changes for organic and mineral soil separately, these should be reported under mineral soils.
h Parties who wish to do so may report annual on-site CO2-C emissions/removals and off-site CO2-C emissions from drained and rewetted organic soils here.
a The signs for estimates of gains in carbon stocks are positive (+) and of losses in carbon stocks are negative (–).
b Where Parties directly estimate emissions and removals rather than carbon stock changes, they may use notation keys only in the stock change columns.
c CSC = carbon stock change.
d Carbon stock gains and losses should be listed separately except in cases where, due to the methods used, it is technically impossible to separate information on gains and losses.
e DOM = dead organic matter.
f No reporting on DOM pools is required for category grassland remaining grassland.
Grassland remaining grassland Land converted to grassland
IEF (Mg C/ha)
CSCc in living biomass/area
d
Net CSCc in
DOMe/area
f
Net CSCc in soils/area
g,hCSC
c in living biomass/area
d
Net CSCc in
DOMe/area
f
Net CSCc in soils/area
g,h
45

Table 4.5
Land Area (2014)
Area (kha) CRF Total FAOa Difference FAO
a Difference
Forest land Cropland Grassland Wetlands Settlements Other landTotal country
area% Forest %
Australia 106 790 37 303 543 389 1.0 1.0 1.0 687 485 774 122 12.60 124 135 16.24
Austria 4 024 1 421 1 463 150 550 778 8 387 8 388 0.01 3 865 –3.94
Belarus 8 168 1 474 2 844 11 NE NE, NO 12 496 20 760 66.13 8 594 5.21
Belgium 724 978 640 53 662 NO 3 058 3 053 –0.16 683 –5.79
Bulgaria 3 874 4 053 2 036 231 863 806 11 863 11 100 –6.43 3 789 –2.20
Canada 231 742 50 263 7 138 522 936 NE, NO 290 600 998 467 243.59 347 162 49.81
Croatia 2 361 1 598 1 189 75 315 177 5 715 5 659 –0.97 1 921 –18.63
Cyprus 155 442 235 NE, NO NE, NO NE, NO 831 925 11.26 173 11.50
Czech Republic 2 666 3 218 997 165 735 105 7 887 7 887 0.00 2 663 –0.13
Denmark (KP) 615 2 598 427 120 519 26 4 306
Denmark (Convention) 615 2 598 669 121 525 216 386 220 914 4 309 –98.05 602 –2.12
Estonia 2 310 1 024 322 506 311 50 4 523 4 523 0.01 2 233 –3.33
European Union (KP) 165 637 126 974 96 079 24 642 29 664 16 898 459 896
European Union (Convention) 165 496 126 837 89 438 24 023 29 624 12 916 448 334 438 349 -2.23 160 343 -3.11
Finland 21 894 2 489 241 6 448 1 460 1 311 33 843 33 842 –0.00 22 218 1.48
France (KP) 23 746 17 818 14 568 1 158 5 617 953 63 860
France (Convention) 23 746 17 818 14 568 1 158 5 617 953 63 860 54 909 –14.02 16 763 –29.41
Germany 11 155 13 491 6 534 729 3 851 20 35 780 35 717 –0.18 11 415 2.33
Greece 3 456 3 467 5 166 301 535 272 13 198 13 196 –0.02 3 994 15.55
Hungary 2 061 5 175 1 221 263 581 2.5 9 303 9 303 –0.00 2 060 –0.08
Iceland 137 126 5 377 619 28 3 982 10 269 10 300 0.30 47 –65.89
Ireland 755 673 4 319 1 140 119 106 7 112 7 028 –1.18 743 –1.58
Italy 9 324 8 880 8 413 519 2 343 655 30 134 30 134 0.00 9 189 –1.44
Japan 25 114 4 307 948 1 338 3 807 2 284 37 797 37 796 –0.00 24 961 –0.61
Kazakhstan 125 480 35 854 187 210 NO 206 24 649 373 399 272 490 –27.02 3 309 –97.36
Latvia 3 299 1 716 737 446 254 5.4 6 457 6 449 –0.13 3 355 1.69
Liechtenstein 6.2 1.7 5.0 0.37 1.8 1.0 16 16 –0.44 6.9 11.96
Lithuania 2 197 2 155 1 471 342 352 11 6 528 6 530 0.04 2 176 –0.96
Luxembourg 96 62 74 1.2 26 0.055 259 259 0.15 87 –9.81
Malta 0.63 1.4 10 0.025 9.0 0.39 22 32 48.63 0.35 –44.36
Monaco
Netherlands 398 954 1 323 825 614 37 4 151 4 150 –0.03 375 –5.86
New Zealand 9 916 477 14 729 685 225 894 26 925 26 771 –0.57 10 152 2.38
Norway 12 119 931 229 3 778 696 14 626 32 378 38 518 18.96 12 108 –0.09
Poland 9 383 14 011 4 153 1 366 2 250 105 31 268 31 268 0.00 9 393 0.11
Portugal 4 364 2 389 663 195 491 1 138 9 239 9 222 –0.19 3 205 –26.56
Romania 7 001 8 689 4 983 1 089 1 677 399 23 839 23 839 –0.00 6 723 –3.98
Russian Federation 898 425 91 529 128 813 225 238 10 117 358 871 1 712 995 1 709 825 –0.19 815 013 –9.28
Slovakia 2 017 1 532 865 94 234 161 4 904 4 904 0.00 1 940 –3.84
Slovenia 1 206 259 398 15 117 32 2 027 2 027 –0.01 1 248 3.42
Spain 15 359 20 070 12 276 419 1 364 1 164 50 651 50 594 –0.11 18 350 19.47
Sweden 28 400 2 856 489 7 197 1 865 4 309 45 116 44 742 –0.83 28 073 –1.15
Switzerland 1 252 398 1 383 188 322 587 4 129 4 129 –0.01 1 246 –0.44
Turkey 22 064 769 449 NE, NO 35 NE, NO 23 317 78 356 236.05 11 510 –47.83
Ukraine 10 631 34 883 7 848 3 403 2 550 1 034 60 349 60 355 0.01 9 613 –9.57
United Kingdom of Great Britain
and Northern Ireland 2 669 4 798 15 519 174 1 974 291 25 425 24 361 –4.18 3 110 16.54 United States of America 272 690 163 686 268 839 5.3 10 699 NA 715 918 983 151 37.33 309 545 13.52
a Source of international statistics: FAOSTAT data, downloaded on 30 May 2016 from http://faostat3.fao.org/home/E. At the time of download data for 2014 was not available, therefore, data for 2013 is shown in this table.
46
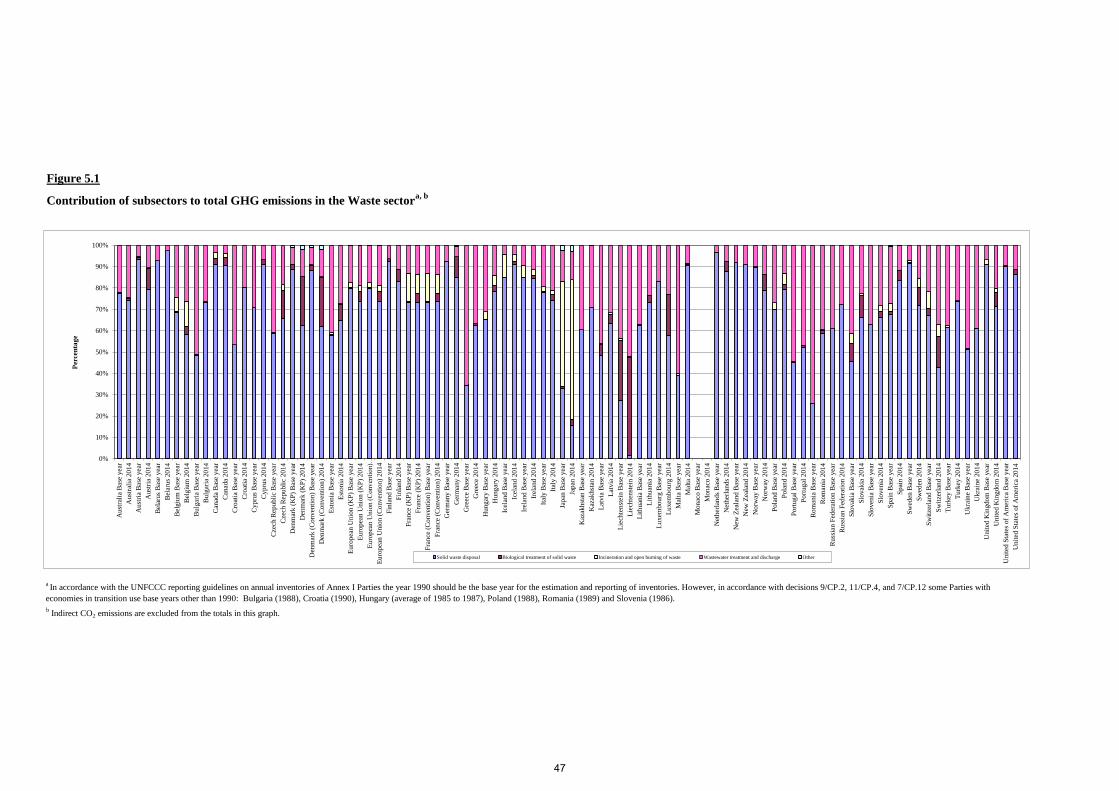
Figure 5.1
Contribution of subsectors to total GHG emissions in the Waste sectora, b
b Indirect CO2 emissions are excluded from the totals in this graph.
a In accordance with the UNFCCC reporting guidelines on annual inventories of Annex I Parties the year 1990 should be the base year for the estimation and reporting of inventories. However, in accordance with decisions 9/CP.2, 11/CP.4, and 7/CP.12 some Parties with
economies in transition use base years other than 1990: Bulgaria (1988), Croatia (1990), Hungary (average of 1985 to 1987), Poland (1988), Romania (1989) and Slovenia (1986).
0%
10%
20%
30%
40%
50%
60%
70%
80%
90%
100%
Aust
rali
a B
ase
yea
r
Aust
rali
a 201
4
Aust
ria
Bas
e yea
r
Aust
ria
201
4
Bel
arus
Bas
e y
ear
Bel
arus
20
14
Bel
giu
m B
ase
yea
r
Bel
giu
m 2
014
Bulg
aria
Bas
e y
ear
Bulg
aria
20
14
Can
ada
Bas
e y
ear
Can
ada
2014
Cro
atia
Bas
e yea
r
Cro
atia
201
4
Cyp
rus
Bas
e y
ear
Cyp
rus
20
14
Cze
ch R
epu
bli
c B
ase
yea
r
Cze
ch R
epu
bli
c 2
014
Den
mar
k (
KP
) B
ase
yea
r
Den
mar
k (
KP
) 201
4
Den
mar
k (
Con
ven
tion
) B
ase
yea
r
Den
mar
k (
Con
ven
tion
) 201
4
Est
on
ia B
ase
yea
r
Est
on
ia 2
014
Eu
rop
ean U
nio
n (
KP
) B
ase
yea
r
Eu
rop
ean U
nio
n (
KP
) 2
014
Eu
rop
ean U
nio
n (
Conv
enti
on)…
Eu
rop
ean U
nio
n (
Conv
enti
on)
2014
Fin
land B
ase
yea
r
Fin
land 2
014
Fra
nce
(K
P)
Bas
e y
ear
Fra
nce
(K
P)
20
14
Fra
nce
(C
onven
tio
n)
Bas
e y
ear
Fra
nce
(C
onven
tio
n)
20
14
Ger
man
y B
ase
yea
r
Ger
man
y 2
014
Gre
ece
Bas
e y
ear
Gre
ece
20
14
Hung
ary B
ase
yea
r
Hung
ary 2
01
4
Ice
lan
d B
ase
yea
r
Ice
lan
d 2
01
4
Ire
land B
ase
yea
r
Ire
land 2
014
Ita
ly B
ase
yea
r
Ita
ly 2
01
4
Jap
an B
ase
yea
r
Jap
an 2
014
Kaz
akhst
an B
ase
yea
r
Kaz
akhst
an 2
014
Lat
via
Bas
e yea
r
Lat
via
201
4
Lie
chte
nst
ein B
ase
yea
r
Lie
chte
nst
ein 2
01
4
Lit
huan
ia B
ase
yea
r
Lit
huan
ia 2
014
Lu
xem
bou
rg B
ase
yea
r
Lu
xem
bou
rg 2
01
4
Mal
ta B
ase
yea
r
Mal
ta 2
014
Mon
aco B
ase
yea
r
Mon
aco 2
01
4
Net
her
lan
ds
Bas
e yea
r
Net
her
lan
ds
2014
New
Zea
lan
d B
ase
yea
r
New
Zea
lan
d 2
01
4
Norw
ay B
ase
yea
r
Norw
ay 2
014
Pola
nd B
ase
yea
r
Pola
nd 2
01
4
Port
ug
al B
ase
yea
r
Port
ug
al 2
014
Rom
ania
Bas
e y
ear
Rom
ania
20
14
Russ
ian F
eder
atio
n B
ase
yea
r
Russ
ian F
eder
atio
n 2
014
Slo
vak
ia B
ase
yea
r
Slo
vak
ia 2
01
4
Slo
ven
ia B
ase
yea
r
Slo
ven
ia 2
01
4
Spai
n B
ase
yea
r
Spai
n 2
014
Sw
eden
Bas
e yea
r
Sw
eden
2014
Sw
itze
rlan
d B
ase
yea
r
Sw
itze
rlan
d 2
01
4
Tu
rkey
Bas
e yea
r
Tu
rkey
20
14
Ukra
ine
Bas
e y
ear
Ukra
ine
20
14
Unit
ed K
ingdo
m B
ase
yea
r
Unit
ed K
ingdo
m 2
014
Unit
ed S
tate
s of
Am
eric
a B
ase
yea
r
Unit
ed S
tate
s of
Am
eric
a 20
14
Percenta
ge
Solid waste disposal Biological treatment of solid waste Incineration and open burning of waste Wastewater treatment and discharge Other
47

Table 5.1a
Solid waste disposal on land, biological treatment of solid waste, incineration and open burning of waste and wastewater treatment and discharge (2014)
Managed Unmanaged Uncategorized
(%) (kg CO2 eq.) (t/t) (t/t) (t/t) (%) (kg CO2 eq.) g/kg g/kg (%) (kg CO2 eq.)
IPCC default EF
Australia T2, T3 D 1.71 380 0.019 NO NO T1 CS 0.02 4.4 0.75 NO T1 CS 0.00 0.46
Austria NA NA 1.84 164 0.33 NO NO 0.10 9.2 1.8 43 NA NA 0.12 11
Belarus T1 CS, D 9.17 889 NO 0.060 NE NA NA – – NO NO NA NA – –
Belgium T2 D 0.93 95 0.040 NO NO T1 CS 0.02 2.2 0.75 NO T1 CS 0.03 3.4
Bulgaria T2 CS, D 5.42 431 0.020 0.11 NO T1 D 0.01 0.81 4.0 NO T1 D 0.01 0.58
Canada CS CS 3.46 728 0.054 IE 0.37 T1 D 0.07 15 4.0 NA, NE T1 D 0.07 14
Croatia T2 CS 5.19 281 0.042 0.028 NO T1 D 0.02 0.88 4.0 0.80 T1 D 0.01 0.48
Cyprus NA NA 5.43 538 IE, NO IE 0.046 T1 D 0.08 7.7 4.0 NO T1 D 0.06 5.5
Czech Republic T1 CS, D 2.65 316 0.052 NO NO CS, D, T1 CS, D 0.49 59 4.0 IE, NE T1 D 0.03 3.5
Denmark (KP) CS, T2 CS, D 1.61 147 0.013 NO NO CS, T1 CS, OTH 0.35 32 3.8 NO CS, T1 CS, OTH 0.24 22
Denmark (Convention) CS, T2 CS, D 1.62 146 0.013 0.024 NO CS, T1 CS, OTH 0.35 32 3.8 NO CS, T1 CS, OTH 0.24 22
Estonia T2 D 1.04 166 0.30 NO NO T1 D 0.07 11 4.0 IE, NO T1 D 0.05 7.9
European Union (KP) 2.52 1.6 0.044 0.24 0.16 0.09 0.057 2.4 76 0.07 0.044
European Union (Convention) 2.51 1.6 0.044 0.24 0.16 0.09 0.057 2.4 76 0.07 0.044
Finland T2 CS, D 3.09 364 718 0.021 NO NO T1 D 0.13 14 951 5.6 1.2 T1 D 0.09 10 973
France (KP) NA NA 3.12 0.22 0.040 NO NO 0.06 0.004 1.1 2.8 NA NA 0.11 0.007
France (Convention) NA NA 3.11 0.22 0.041 NO NO 0.06 0.004 1.1 2.8 NA NA 0.11 0.007
Germany T2 CS 1.02 113 0.44 NO NO T2 CS 0.08 8.8 1.4 3.5 T2 CS 0.03 3.8
Greece T2 CS, D 3.14 278 0.022 0.38 NO D D 0.02 1.7 4.0 NO D D 0.02 1.6
Hungary T2 D 5.85 339 0.050 IE, NO NO CS, T1 D 0.17 10 10 NE, NO T1 D 0.06 3.4
Iceland T2 CS, D 5.05 706 0.056 0.045 NA T2 CS, D 0.04 6.1 4.0 NO T1 D 0.04 5.5
Ireland T2 CS, D 2.16 273 0.11 NO NO T1 D 0.02 2.9 4.0 NO T1 D 0.02 2.6
Italy T2 CS 3.22 222 0.050 NO NO CS, D CS, D 0.02 1.0 0.029 2.0 D D 0.12 7.9
Japan T3 CS 0.24 26 0.23 NO 0.74 D, T1 D 0.03 2.8 10 NO D, T1 D 0.02 2.0
Kazakhstan NA M 1.29 236 0.031 NO 0.036 NA NA – – NO NA NA – –
Latvia T2 CS, D 4.65 264 0.024 NO NO D D 0.20 11 4.0 NO D D 0.14 8.0
Liechtenstein T2 CS 0.03 1.7 NO NO NO CS CS 0.75 41 17 NO CS CS 0.13 6.9
Lithuania T2 D 4.36 285 0.056 0.15 NO T1 D 0.11 7.0 4.0 NE, NO T1 D 0.08 5.0
Luxembourg T2 D 0.27 46 0.035 NO NO T1 D 0.05 8.8 4.0 NE, NO T1 D 0.04 6.3
Malta M, T2 M, PS 4.74 329 0.022 NA NO T1 D 0.03 2.0 NO 0.80 NA NA – –
Monaco
Netherlands T2 CS 1.68 187 IE NA, NO NO NA NA 0.04 4.5 NO NA NA NA 0.04 4.9
New Zealand T2 CS, D 4.58 816 0.017 0.015 NO NA NA – – NE, NO NO NA NA – –
Norway T2 D 2.20 229 11 NO NO T1 D 0.12 12 4.0 1.0 T1 D 0.10 10
Poland T2 CS, D 2.25 222 0.033 NO NO T1 D 0.03 3.4 4.0 NA, NO T1 D 0.02 2.4
Portugal T2 CS, D 5.74 357 0.039 NO NA, NO T1 D 0.04 2.5 4.0 1.0 T1 D 0.02 1.5
Romania T2 CS, D 3.09 170 0.012 0.13 NA T1 D 0.04 2.2 4.0 NO T1 D 0.04 1.9
Russian Federation T2 CS, D 2.88 561 0.051 0.024 NO T1 D 0.00 0.33 8.0 T1 D 0.00 0.29
Slovakia T2 CS, D 2.58 193 0.021 0.14 NO T1 D 0.21 16 4.0 NO T1 D 0.19 14
Slovenia T2 CS, D 1.98 159 0.063 NO NO T1 D 0.04 3.4 4.0 NO T1 D 0.03 2.4
Spain T2 CS, D, OTH 3.97 281 0.039 NO NO T1 D 0.13 9.0 4.0 6.3 T1 D 0.10 7.3
Sweden T2 CS, D 2.01 112 0.062 NO NO T1, T2 CS, D 0.15 8.6 11 114 T1 D 0.08 4.6
Switzerland CS, D CS, D 0.75 45 NO NO NO CS CS 0.22 13 5.0 0.22 CS CS 0.03 2.0
Turkey T2 CS, D 2.54 155 0.027 IE, NO NO T1 D 0.00 0.12 4.0 NO T1 D 0.00 0.11
Ukraine T3 CS, D 1.86 146 0.019 0.024 NA T1 D 0.00 0.15 4.0 NA T1 D 0.00 0.13
United Kingdom of Great
Britain and Northern Ireland T2 CS 2.59 211 0.040 NO NO T2 D 0.14 12 10 3.3 T2 D 0.10 8.0 United States of America M M 2.10 458 0.014 NA NA D D 0.03 6.4 4.0 NE D D 0.03 5.7
b Calculated using population data from CRF Table 5.D. World Bank population data was used for Netherlands as it was not presented in CRF Table 5.D.
0.30 NA
0.60 0.12 0.30 NE
0.86 NA, NO
0.07 NO
0.30 NO
a The national total includes indirect CO2 emissions from the atmospheric oxidation of CH4, CO and NMVOCs for the following Parties: Canada, Czech Republic, Denmark (KP), Denmark (Convention), European Union (KP), European Union (Convention), Finland, France (KP), France (Convention), Ireland, Latvia, Netherlands, Portugal and Switzerland.
0.30 NO
0.24 NO
0.30 0.000
0.30 NO
0.30 NO
0.60
NE NO
0.30 NO
0.24 NA, NO
NO NA, NO
NO NA
0.24 NO
0.24 NO
0.24 NE, NO
0.60 NO
NO
0.24 NO
0.30 NO
0.30 NO
0.20 NA, NO
0.074 0.067
0.30 NO
0.60 NE, NO
0.38 NA, NE
0.22 NA
0.22 NO
0.24 IE
0.23 0.041
0.23 0.041
0.24 IE, NO
0.32 NA, NO
0.32 NA, NO
0.30 NA, NE
0.24 IE, NA
0.24 NO
Share of
national totala
Emissions per
capitab
EF
NO NO
0.096 NO
0.24 NO
g/kg g/kg
0.007 NO
0.25 NA, NO
Solid waste disposal Biological treatment of solid waste
CH4 CH4 N2O
Methods and EF used Share of
national
totala
Emissions per
capitab
CH4 IEF Methods and EF usedIEF
CompostingAnaerobic
digestionComposting Anaerobic digestion
Methods EF Methods EF Methods
Share of
national
totala
Emissions per
capitab
IEFMethods and EF used
48

Table 5.1b
Solid waste disposal on land, biological treatment of solid waste, incineration and open burning of waste and wastewater treatment and discharge (2014)
(%) (kg CO2 eq.) kg/t kg/t (%) (kg CO2 eq.) kg/kg kg/kg (%) (kg CO2 eq.)kg N2O-N/kg N
kg N2O-N/kg
N
IPCC default EFd
0.005
Australia 23 23 T2 CS 0.01 1.3 1 440 NO T2, T3 CS, D 0.48 107 0.073 0.071 CS D 0.08 19 0.013 IE
Austria 8.5 8.5 NA NA 0.00 0.24 2 030 NO NA NA 0.03 3.0 0.16 IE, NA, NO NA NA 0.21 19 0.030 IE
Belarus 9.5 9.5 NA NA – – NO NO NA NA – – NE NE T1 D 0.25 24 0.010 NE
Belgium 11 11 T1, T3 PS 0.19 20 6 214 NO CR, T1 CR, D 0.18 19 NE NA D D 0.24 24 NE NA
Bulgaria 7.2 7.2 T1 D 0.02 1.6 1 570 NO T2 D 1.71 136 0.15 0.054 T1 D 0.25 20 0.005 NA
Canada 36 36 T1, T2 CS, D 0.06 12 377 NO CS, T3 CS, D, PS 0.05 11 NA NA D D 0.09 19 0.010 NE
Croatia 4.2 4.2 T1 D 0.00 0.011 882 NO T1, T2 D 0.91 49 0.090 0.003 T1 D 0.36 20 0.005 NA
Cyprus 0.85 1.2 NA NA – – NO NO T1 D 0.21 20 0.032 0.008 OTH, T1 D, OTH 0.19 19 0.005 NE
Czech Republic 11 11 T1 D 0.10 13 1 642 NO T1, T2 CS, D 0.58 69 0.18 NE T1 CS, D 0.16 19 0.005 NE
Denmark (KP) 5.6 NA NA – – NO NO CS CS 0.21 19 0.071 NO,IE CS CS 0.12 11 0.037 IE
Denmark (Convention) 5.7 5.6 T1 CS 0.01 0.55 293 154 CS CS 0.21 19 0.071 IE, NA, NO CS, T1 CS, D 0.13 11 0.031 IE
Estonia 1.3 1.3 T1, T2 D 0.00 0.75 1 932 344 T1 D 0.29 47 0.069 0.20 T1 D 0.14 23 0.005 NO
European Union (KP) 66 621 0.08 0.053 606 40 0.47 0.30 0.10 0.058 0.17 0.11 0.005 0.012
European Union (Convention) 66 621 508 0.08 0.052 607 30 0.47 0.30 0.10 0.058 0.17 0.11 0.005 0.012
Finland 0.005 5.5 NA NA – – IE, NO NE, NO CS, T2 CS, D 0.29 34 479 0.046 0.001 CS, T1 D 0.13 15 162 0.005 0.005
France (KP) 66 200 NA NA 0.38 0.026 785 100 0.47 0.033 0.083 0.49 0.10 0.007 0.002 NA
France (Convention) 66 767 66 NA NA 0.37 0.026 785 100 0.48 0.033 0.084 0.49 0.10 0.007 0.002 NO
Germany 81 81 NA NA – – NA, NO NO CS, D CS, D 0.01 0.78 0.17 0.001 CS, D CS, D 0.05 5.4 0.006 IE
Greece 11 11 D CS, D 0.00 0.27 140 NO D D 1.52 134 0.092 0.25 D CS 0.32 28 0.005 IE
Hungary 9.9 9.9 T2 D 0.35 20 2 043 NO T1, T2 D 0.66 38 0.099 0.013 D D 0.39 23 0.005 NE
Iceland 0.33 0.33 T2 D 0.16 22 292 NO T1 CS, D 0.09 13 0.024 IE, NO T1 D 0.15 21 0.005 IE
Ireland 4.6 4.6 T1 D 0.06 7.8 2 933 505 NA NA 0.09 11 0.013 IE, NO NA NA 0.20 26 0.005 IE
Italy 61 61 D CS 0.05 3.8 983 NO T1 D 0.60 41 0.15 0.25 T1 CR, D 0.32 22 0.005 1.0
Japan 128 127 CS CS 0.91 96 586 NO CS CS 0.12 13 NA NA CS CS 0.08 8.8 NA 0.003
Kazakhstan 17 17 NA NA – – NO D D 0.38 69 0.48 NA, NO D D 0.15 28 0.64 NE
Latvia 2.0 2.0 D D 0.00 0.28 1 141 NO D CS 2.18 124 0.100 0.065 D D 0.15 8.3 0.002 0.000
Liechtenstein 0.037 0.037 CS CS 0.01 0.59 NO 255 CS CS 0.47 26 NA IE, NO D D 0.53 29 NA IE, NO
Lithuania 2.9 2.9 T1 D 0.01 0.67 1 008 NO T1 D 1.15 75 0.093 IE, NA T1 D 0.24 15 0.005 NA
Luxembourg 0.63 0.56 NA NA – – IE, NO NO T1 CS 0.04 6.1 1.0 NO T1, T3 D, PS 0.07 12 0.004 0.003
Malta 0.43 0.43 T1 D 0.03 1.8 129 NO D CS 0.04 3.1 0.005 IE, NO D D 0.39 27 0.005 IE
Monaco 0.038
Netherlands 17 NA NA – – IE, NA NO T2 CS 0.11 12 0.052 0.002 T1 D 0.04 4.2 0.008 NE
New Zealand 4.6 4.5 D D 0.00 0.41 4.4 NO T1 CS 0.30 53 0.036 0.016 CS, T1 CS, D 0.16 28 0.005 0.017
Norway 5.1 5.1 D OTH – – IE, NO NE, NO T1 CS, D 0.12 12 NE NE CS, T1 CS, D 0.26 27 0.014 NE
Poland 38 38 T1, T2 CS, D 0.14 14 845 NA T1 CS, D 0.18 17 0.064 0.031 NA NA 0.19 19 0.005 NA
Portugal 10 10 T1, T2 CS, D 0.04 2.5 1 068 NO T2 CS, D 4.50 280 0.16 0.035 T2 CS, D 0.62 39 0.005 NE
Romania 20 20 D D 0.01 0.44 291 NO D D 1.60 88 0.14 0.016 D D 0.47 26 0.005 NE
Russian Federation 144 144 NA NA – – IE T1, T2 CS, D 1.00 195 0.41 0.078 T2 CS, D 0.11 21 0.003 NE
Slovakia 5.4 5.4 T2 CS, D 0.02 1.1 25 NO CS, T2 D 0.76 57 0.27 0.025 CS, T2 CS, D 0.12 9.1 0.005 0.007
Slovenia 2.1 2.1 T1, T2 D 0.08 6.7 1 610 NO T1 CS, D 0.55 44 0.10 0.013 T1 D 0.29 24 0.005 NA
Spain 46 46 NA NA – – IE, NO NO T1, T2 CS, D 0.27 19 0.045 0.11 D D 0.29 21 0.005 NE
Sweden 9.7 9.7 NE NE 0.11 5.9 229 NE T2 CS 0.05 2.8 0.21 1.6 T1 CS, D 0.38 21 0.020 0.005
Switzerland 8.2 8.2 CS CS 0.02 1.2 70 NO CS, D CS, D 0.36 21 0.22 IE CS CS 0.30 18 0.005 IE
Turkey 77 76 T2 CS, D 0.00 0.001 IE, NO 21 T2 CS 0.50 31 0.076 0.013 T1 D 0.40 24 0.005 IE
Ukraine 45 45 T1, T2 CS, D 0.00 0.32 191 NA T2 CS, D 0.87 69 0.10 0.048 CS, T1 CS, D 0.31 24 0.006 0.005
United Kingdom of Great
Britain and Northern Ireland 65 65 T1, T2 CS, D 0.06 4.7 602 261 CS, T1 CS, D 0.65 53 0.020 0.18 T1 D 0.08 6.4 0.003 NE United States of America 323 319 NA NA – – IE, NA NA D CS, D 0.21 46 0.11 0.028 D CS, D 0.07 15 0.005 NA
c Calculated using population data from CRF Table 5.D. World Bank population data was used for Netherlands as it was not presented in CRF Table 5.D.
Wastewater treatment and discharge
CO2 CH4 N2O
b The national total includes indirect CO2 emissions from the atmospheric oxidation of CH4, CO and NMVOCs for the following Parties: Canada, Czech Republic, Denmark (KP), Denmark (Convention), European Union (KP), European Union (Convention), Finland, France (KP), France (Convention), Ireland, Latvia, Netherlands, Portugal and Switzerland.
Methods and EF usedEmissions per
capitac
IEF
Domestic
a Source of population data: World Bank http://databank.worldbank.org/data/home.aspx, downloaded 10 May 2016.
Industrial
Methods and EF usedShare of national
totalb
EFCRF
Methods and EF usedEmissions per
capitac
CH4 IEF
Activity data
Incineration and open burning of waste
d Source of default emission factors: 2006 IPCC Guidelines for National Greenhouse Gas Inventories Volume 5 Chapter 6 Wastewater Treatment and Discharge, page 6.28.
World Banka Methods EF Methods EF Methods
Emissions per
capitac
N2O IEF
Population (million)
Waste incinerationOpen burning of
wasteDomestic Industrial
Share of national
totalb
Share of national
totalb
49

Table 6.1
Minimum value for
'tree crown cover'
(%)b
Minimum 'tree
height' (m)b
Minimum area for
'Forest land' (ha)b
Cropland
Managementc
Grazing Land
Managementc
Revegetationc Wetland drainage
and rewettingc
Harvest Wood
Productsc
Accounting
periodd
FM CAPe
(Mt CO2 eq)
Forest
Management
Reference Level
(FMRL)f
(Mt CO2 eq/yr)
Australia 20 2 0.2 X X X X Annually/CP 117.21 -0.99
Austria 30 2 0.05 X CP 22.08 -0.69
Belarus
Belgium 20 5 0.5 X CP 20.45 -2.50
Bulgaria 10 5 0.1 X CP 34.06 -8.15
Croatia 10 2 0.1 X CP -5.38
Cyprus 10 5 0.3 X CP 1.557 -0.16
Czech Republic 30 2 0.05 X CP -4.69
Denmark (KP) 10 5 0.5 X X X Annually 0.33
Estonia 30 2 0.5 X CP 11.19 -2.74
European Union (KP)
Finland 10 5 0.5 X CP 19.98 -31.44
France (KP) 10 5 0.5 X CP 153.47 -45.62
Germany 10 5 0.1 X X X CP 349.96 -22.42
Greece 25 2 0.3 X CP -1.66
Hungary 30 5 0.5 X Annually 30.68 -1.04
Iceland 10 2 0.5 X X
Ireland 20 5 0.1 X X X CP -0.14
Italy 10 5 0.5 X X X CP 146.14 -22.17
Japan 30 5 0.3 X X X X
Kazakhstan
Latvia 20 5 0.1 X CP 7.35 -6.38
Liechtenstein 20 3 0.06 X CP 0.06 0.00
Lithuania 30 5 0.1 X CP 13.19 -5.34
Luxembourg 10 5 0.5
Malta
Monaco 10 5 0.5
Netherlands 20 5 0.5 X CP -1.43
New Zealand 30 5 1 X
Norway 10 5 0.5 X X X CP 14.54 -13.01
Poland 10 2 0.1 X CP 162.36 -27.13
Portugal 10 5 1 X X X CP 16.95 -3.39
Romania 10 5 0.25 X X CP -15.79
Russian Federation 18 5 1 X
Slovakia 20 5 0.3 X CP -1.08
Slovenia 30 2 0.25 X CP 5.69 -3.17
Spain 20 3 1 X X CP -23.10
Sweden 10 5 0.5 X CP 20.15 -34.07
Switzerland 20 3 0.06 X CP 15.04 -1.68
Ukraine 30 5 0.1 X CP -62.14 United Kingdom of Great
Britain and Northern Ireland 20 2 0.1 X X X X CP -13.93
Selected values (forest parameters), elected activities under Article 3.4, accounting period, forest management capa
a As either reported by a Party in its report to facilitate the calculation of the assigned amount for the second commitment period under the Kyoto Protocol, submitted in accordance with decisions 2/CMP.8, annex I, and 6/CMP.9 and subsequently reviewed under Article 8 of
the Kyoto Protocol and recorded in the compilation and accounting database, or included in a decision of the COP/MOP. These parameters are fixed for the second commitment period under the Kyoto Protocol.
b As reported by Party in accordance with paragraph 8(b) of the annex to decision 13/CMP.1 or paragraph 1(f) of Annex I to decision 2/CMP.8 and paragraph 21 of the annex to decision 2/CMP.7.
c An “X” indicates if any activity under Article 3.4 was elected for reporting, in accordance with paragraph 8 of the annex to decision 2/CMP.7 and paragraph 1(g) of Annex I to decision 2/CMP.8.
d Parties specified in their report to facilitate the calculation of the assigned amount for the second commitment period under the Kyoto Protocol whether they intend to account for activities under Article 3, paragraph 3 and 4, of the Kyoto Protocol 'annually' or over the second
commitment period, in accordance to paragraph 1(h) of Annex I to decision 2/CMP.8.
e In accordance with paragraph 13 of the annex to decision 2/CMP.7, for the second commitment period, additions to the assigned amount of a Party resulting from forest management under Article 3, paragraph 4, and from forest management project activities undertaken
under Article 6, shall not exceed 3.5 per cent of the base year greenhouse gas emissions excluding land use, land-use change and forestry pursuant to Article 3, paragraphs 7 and 8, or any amendments thereto, times eight. The FM CAP was calculated on the basis of the base
year or period emissions reported in the annual greenhouse gas inventory report due by 15 April 2015, as included in the information communicated as part of the report to facilitate the calculation of a Party’s assigned amount for the second commitment period, and takes into
account any corrections or adjustments made during the review process of that report under Article 8 of the Kyoto Protocol.
f The forest management reference level as inscribed in the appendix to the annex to decision 2/CMP.7, and any technical corrections applied for the submission used for the calculation of the initial assigned amount.
50
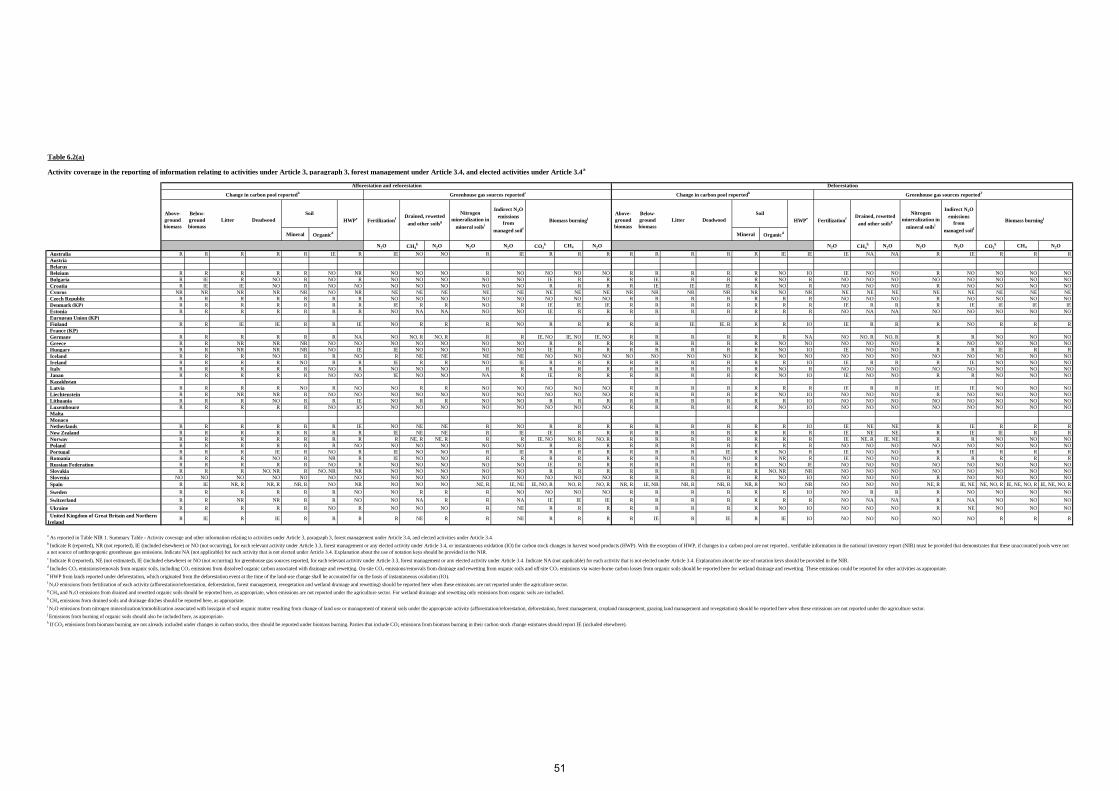
Table 6.2(a)
Activity coverage in the reporting of information relating to activities under Article 3, paragraph 3, forest management under Article 3.4, and elected activities under Article 3.4a
Mineral Organicd Mineral Organic
d
N2O CH4h N2O N2O N2O CO2
k CH4 N2O N2O CH4h N2O N2O N2O CO2
k CH4 N2O
Australia R R R R R IE R IE NO NO R IE R R R R R R R R IE IE IE NA NA R IE R R R
Austria
Belarus
Belgium R R R R R NO NR NO NO NO R NO NO NO NO R R R R R NO IO IE NO NO R NO NO NO NO
Bulgaria R IE R NO R NO R NO NO NO NO NO IE R R R IE R R R NO R NO NO NO NO NO NO NO NO
Croatia R IE IE NO R NO NO NO NO NO NO NO R R R R IE IE IE R NO R NO NO NO R NO NO NO NO
Cyprus NR NR NR NR NR NO NR NE NE NE NE NE NE NE NE NR NR NR NR NR NO NR NE NE NE NE NE NE NE NE
Czech Republic R R R R R R R NO NO NO NO NO NO NO NO R R R R R R R NO NO NO R NO NO NO NO
Denmark (KP) R R R R R R R IE R R NO R IE IE IE R R R R R R R IE R R R IE IE IE IE
Estonia R R R R R R R NO NA NA NO NO IE R R R R R R R R R NO NA NA NO NO NO NO NO
European Union (KP)
Finland R R IE IE R R IE NO R R R NO R R R R R IE IE, R R R IO IE R R R NO R R R
France (KP)
Germany R R R R R R NA NO NO, R NO, R R R IE, NO IE, NO IE, NO R R R R R R NA NO NO, R NO, R R R NO NO NO
Greece R R NR NR NR NO NO NO NO NO NO NO R R R R R R R R NO NO NO NO NO R NO NO NO NO
Hungary R R NR NR NR NO IE IE NO NO NO NO IE R R R R R R R NO IO IE NO NO R R IE R R
Iceland R R R NO R R NO R NE NE NE NE NO NO NO NO NO NO NO R NO NO NO NO NO NO NO NO NO NO
Ireland R R R R NO R R IE R R NO IE R R R R R R R R R IO IE R R R IE NO NO NO
Italy R R R R R NO R NO NO NO R R R R R R R R R R NO R NO NO NO NO NO NO NO NO
Japan R R R R R NO NO IE NO NO NA R IE R R R R R R R NO IO IE NO NO R R NO NO NO
Kazakhstan
Latvia R R R R NO R NO NO R R NO NO NO NO NO R R R R R R R IE R R IE IE NO NO NO
Liechtenstein R R NR NR R NO NO NO NO NO NO NO NO NO NO R R R R R NO IO NO NO NO R NO NO NO NO
Lithuania R R R NO R R IE NO R R NO NO R R R R R R R R R IO NO NO NO NO NO NO NO NO
Luxembourg R R R R R NO IO NO NO NO NO NO NO NO NO R R R R R NO IO NO NO NO NO NO NO NO NO
Malta
Monaco
Netherlands R R R R R R IE NO NE NE R NO R R R R R R R R R IO IE NE NE R IE R R R
New Zealand R R R R R R R IE NE NE R IE IE R R R R R R R R R IE NE NE R IE IE R R
Norway R R R R R R R R NE, R NE, R R R IE, NO NO, R NO, R R R R R R R R IE NE, R IE, NE R R NO NO NO
Poland R R R R R R NO NO NO NO NO NO R R R R R R R R R R NO NO NO NO NO NO NO NO
Portugal R R R IE R NO R IE NO NO R IE R R R R R R IE R NO R IE NO NO R IE R R R
Romania R R R NO R NR R IE NO NO R R R R R R R R NO R NR R IE NO NO R R R R R
Russian Federation R R R R R NO R NO NO NO NO NO IE R R R R R R R NO IE NO NO NO NO NO NO NO NO
Slovakia R R R NO, NR R NO, NR NR NO NO NO NO NO R R R R R R R R NO, NR NR NO NO NO NO NO NO NO NO
Slovenia NO NO NO NO NO NO NO NO NO NO NO NO NO NO NO R R R R R NO IO NO NO NO R NO NO NO NO
Spain R IE NR, R NR, R NR, R NO NR NO NO NO NE, R IE, NE IE, NO, R NO, R NO, R NR, R IE, NR NR, R NR, R NR, R NO NR NO NO NO NE, R IE, NE NE, NO, R IE, NE, NO, R IE, NE, NO, R
Sweden R R R R R R NO NO R R R NO NO NO NO R R R R R R IO NO R R R NO NO NO NO
Switzerland R R NR NR R R NO NO NA R R NA IE IE IE R R R R R R R NO NA NA R NA NO NO NO
Ukraine R R R R R NO R NO NO NO R NE R R R R R R R R NO IO NO NO NO R NE NO NO NO
United Kingdom of Great Britain and Northern
IrelandR IE R IE R R R R NE R R NE R R R R IE R IE R IE IO NO NO NO NO NO R R R
i N2O emissions from nitrogen mineralization/immobilization associated with loss/gain of soil organic matter resulting from change of land use or management of mineral soils under the appropriate activity (afforestation/reforestation, deforestation, forest management, cropland management, grazing land management and revegetation) should be reported here when these emissions are not reported under the agriculture sector.
j Emissions from burning of organic soils should also be included here, as appropriate.
k If CO2 emissions from biomass burning are not already included under changes in carbon stocks, they should be reported under biomass burning. Parties that include CO2 emissions from biomass burning in their carbon stock change estimates should report IE (included elsewhere).
a As reported in Table NIR 1. Summary Table - Activity coverage and other information relating to activities under Article 3, paragraph 3, forest management under Article 3.4, and elected activities under Article 3.4.
b Indicate R (reported), NR (not reported), IE (included elsewhere) or NO (not occurring), for each relevant activity under Article 3.3, forest management or any elected activity under Article 3.4, or instantaneous oxidation (IO) for carbon stock changes in harvest wood products (HWP). With the exception of HWP, if changes in a carbon pool are not reported , verifiable information in the national inventory report (NIR) must be provided that demonstrates that these unaccounted pools were not
a net source of anthropogenic greenhouse gas emissions. Indicate NA (not applicable) for each activity that is not elected under Article 3.4. Explanation about the use of notation keys should be provided in the NIR.c Indicate R (reported), NE (not estimated), IE (included elsewhere) or NO (not occurring) for greenhouse gas sources reported, for each relevant activity under Article 3.3, forest management or any elected activity under Article 3.4. Indicate NA (not applicable) for each activity that is not elected under Article 3.4. Explanation about the use of notation keys should be provided in the NIR.
d Includes CO2 emissions/removals from organic soils, including CO2 emissions from dissolved organic carbon associated with drainage and rewetting. On-site CO2 emissions/removals from drainage and rewetting from organic soils and off-site CO2 emissions via water-borne carbon losses from organic soils should be reported here for wetland drainage and rewetting. These emissions could be reported for other activities as appropriate.
e HWP from lands reported under deforestation, which originated from the deforestation event at the time of the land-use change shall be accounted for on the basis of instantaneous oxidation (IO).
f N2O emissions from fertilization of each activity (afforestation/reforestation, deforestation, forest management, revegetation and wetland drainage and rewetting) should be reported here when these emissions are not reported under the agriculture sector.
g CH4 and N2O emissions from drained and rewetted organic soils should be reported here, as appropriate, when emissions are not reported under the agriculture sector. For wetland drainage and rewetting only emissions from organic soils are included.
Nitrogen
mineralization in
mineral soilsi
Indirect N2O
emissions
from
managed soilf
Biomass burningj
Above-
ground
biomass
h CH4 emissions from drained soils and drainage ditches should be reported here, as appropriate.
Drained, rewetted
and other soilsg
Nitrogen
mineralization in
mineral soilsi
Indirect N2O
emissions
from
managed soilf
Biomass burningj
Below-
ground
biomass
Litter Deadwood
Soil
HWPe
Afforestation and reforestation Deforestation
Change in carbon pool reportedb
Greenhouse gas sources reportedc
Change in carbon pool reportedb
Greenhouse gas sources reported3
Above-
ground
biomass
Below-
ground
biomass
Litter Deadwood
Soil
HWPe
Fertilizationf
Fertilizationf
Drained, rewetted
and other soilsg
51

Table 6.2(b)
Activity coverage in the reporting of information relating to activities under Article 3, paragraph 3, forest management under Article 3.4, and elected activities under Article 3.4a
Mineral Organicd Mineral Organic
d
N2O CH4h N2O N2O N2O CO2
k CH4 N2O CH4h N2O CO2
k CH4 N2O
Australia R R R R R IE R IE NA NA R IE R R R R R R R R IE NA R R R R
Austria
Belarus
Belgium R R R R R NO R NO NO NO R NO NO NO NO NA NA NA NA NA NA NA NA NA NA NA
Bulgaria R IE NO NO NO NO R NO NO NO NO NO IE R R NA NA NA NA NA NA NA NA NA NA NA
Croatia R IE NO NO NO NO R NO NO NO NO NO R R R NA NA NA NA NA NA NA NA NA NA NA
Cyprus NR NR NR NR NO NO NR NE NE NE NE NE R R R NR NR NR NR NR NO NE NE NE NE NE
Czech Republic R R IE R R R R NO NO NO NO NO R R R NA NA NA NA NA NA NA NA NA NA NA
Denmark (KP) R R R R R R R IE R R NO IE IE R R R IE NO NO R R R IE NO NO NO
Estonia R R R R R R R NO NA NA NO NO IE R R NA NA NA NA NA NA NA NA NA NA NA
European Union (KP)
Finland R R IE IE R R R IE, R NO, R NO, R NO NO R R R NA NA NA NA NA NA NA NA NA NA NA
France (KP)
Germany R R R R R R R NO NO, R NO, R R R IE, NO NO, R NO, R R R IE IE, NO R R NO, R R NO NO NO
Greece R R NR NR NR NO R NO NO NO NO NO IE R R NA NA NA NA NA NA NA NA NA NA NA
Hungary R R NR NR NR R R IE NO NO NO NO IE R R NA NA NA NA NA NA NA NA NA NA NA
Iceland R R R NE R R NE NO R R NE NE NO NO NO NA NA NA NA NA NA NA NA NA NA NA
Ireland R R R R NA R R IE R R NO IE R R R R IE NO NO R NO NO IE NO R R
Italy R R R R NR NR R NO NO NO NO NO R R R R R NO NO R R NO NO R R R
Japan R R R R R NO R R NO NO R R IE R R R R NR NR R R R R IE R R
Kazakhstan
Latvia R R R R NO R R NO R R R R R R R NA NA NA NA NA NA NA NA NA NA NA
Liechtenstein R R NR NR NR NO R NO NO NO NO NO NO NO NO NA NA NA NA NA NA NA NA NA NA NA
Lithuania R R R R NO R R NO R R NO NO R R R NA NA NA NA NA NA NA NA NA NA NA
Luxembourg R R R R R NO IO NO NO NO NO NO NO NO NO NR NR NR NR NR NO NO NO NO NO NO
Malta
Monaco
Netherlands R R R R R R R NO NE NE R NO R R R NA NA NA NA NA NA NA NA NA NA NA
New Zealand R R R R R R R NO NE NE R IE IE R R NA NA NA NA NA NA NA NA NA NA NA
Norway R R R R R R R R NE, R NE, R R R IE NE, R NE, R NE, R NE, R NO, R NO, R R R NE, R R NO NO NO
Poland R R R R R R R NO R NO NO NO R R R NA NA NA NA NA NA NA NA NA NA NA
Portugal R R R IE R NO R IE NO NO R IE R R R R R R NO R NO NO R R R R
Romania R R R NO R NR R IE NO NO R R R R R R R NR NR R NO NO R R R R
Russian Federation R R R R R R R NO R R NO NO R R R NA NA NA NA NA NA NA NA NA NA NA
Slovakia R R NO, NR NO, NR NO, NR NO, NR R NO NO NO NO NO R R R NA NA NA NA NA NA NA NA NA NA NA
Slovenia R R NR R NR NO R NO NO NO NO NO R R R NA NA NA NA NA NA NA NA NA NA NA
Spain NR, R IE, NR NR, R NR, R NR, R NO R NO NO NO NE, R IE, NE IE, NE, R NO, R NO, R NR, R IE, NR NR, R NR, R R NO NO NE, R NE, NO IE, NE, NO IE, NE, NO
Sweden R R R R R R R R R R R R R R R NA NA NA NA NA NA NA NA NA NA NA
Switzerland R R R R R R R NO NA R NO NA IE R R NA NA NA NA NA NA NA NA NA NA NA
Ukraine R R R R R R R NO NO R NO NO R R R NA NA NA NA NA NA NA NA NA NA NA
United Kingdom of Great Britain and Northern
IrelandR IE R IE R R R NO NE R R NO R R R R IE NE NE R NO NE R NE R R
Forest management
a As reported in Table NIR 1. Summary Table - Activity coverage and other information relating to activities under Article 3, paragraph 3, forest management under Article 3.4.
Below-
ground
biomass
b Indicate R (reported), NR (not reported), IE (included elsewhere) or NO (not occurring), for each relevant activity under Article 3.3, forest management or any elected activity under Article 3.4, or instantaneous oxidation (IO) for carbon stock changes in harvest wood products (HWP). With the exception of HWP, if changes in a carbon pool are not reported , verifiable information in the national inventory report (NIR)
must be provided that demonstrates that these unaccounted pools were not a net source of anthropogenic greenhouse gas emissions. Indicate NA (not applicable) for each activity that is not elected under Article 3.4. Explanation about the use of notation keys should be provided in the NIR.
Biomass burningj
Greenhouse gas sources reportedc
Change in carbon pool reportedb
Nitrogen
mineralization in
mineral soilsi
Cropland management
Change in carbon pool reportedb
Greenhouse gas sources reportedc
Above-
ground
biomass
HWPe
Nitrogen
mineralization in
mineral soilsi
Soil
Deadwood
Drained,
rewetted
and other
soilsg
i N2O emissions from nitrogen mineralization/immobilization associated with loss/gain of soil organic matter resulting from change of land use or management of mineral soils under the appropriate activity (afforestation/reforestation, deforestation, forest management, cropland management, grazing land management and revegetation) should be reported here when these emissions are not reported under the agriculture
sector.
Biomass burningj
Drained, rewetted
and other soilsg
Above-
ground
biomass
Below-
ground
biomass
Fertilizationf
Indirect N2O
emissions
from managed
soilf
Litter
g CH4 and N2O emissions from drained and rewetted organic soils should be reported here, as appropriate, when emissions are not reported under the agriculture sector. For wetland drainage and rewetting only emissions from organic soils are included.
Soil
Litter
h CH4 emissions from drained soils and drainage ditches should be reported here, as appropriate.
Deadwood
k If CO2 emissions from biomass burning are not already included under changes in carbon stocks, they should be reported under biomass burning. Parties that include CO2 emissions from biomass burning in their carbon stock change estimates should report IE (included elsewhere).
c Indicate R (reported), NE (not estimated), IE (included elsewhere) or NO (not occurring) for greenhouse gas sources reported, for each relevant activity under Article 3.3, forest management or any elected activity under Article 3.4. Indicate NA (not applicable) for each activity that is not elected under Article 3.4. Explanation about the use of notation keys should be provided in the NIR.
d Includes CO2 emissions/removals from organic soils, including CO2 emissions from dissolved organic carbon associated with drainage and rewetting. On-site CO2 emissions/removals from drainage and rewetting from organic soils and off-site CO2 emissions via water-borne carbon losses from organic soils should be reported here for wetland drainage and rewetting. These emissions could be reported for other activities
as appropriate.e HWP from lands reported under deforestation, which originated from the deforestation event at the time of the land-use change shall be accounted for on the basis of instantaneous oxidation (IO).
f N2O emissions from fertilization of each activity (afforestation/reforestation, deforestation, forest management, revegetation and wetland drainage and rewetting) should be reported here when these emissions are not reported under the agriculture sector.
j Emissions from burning of organic soils should also be included here, as appropriate.
52
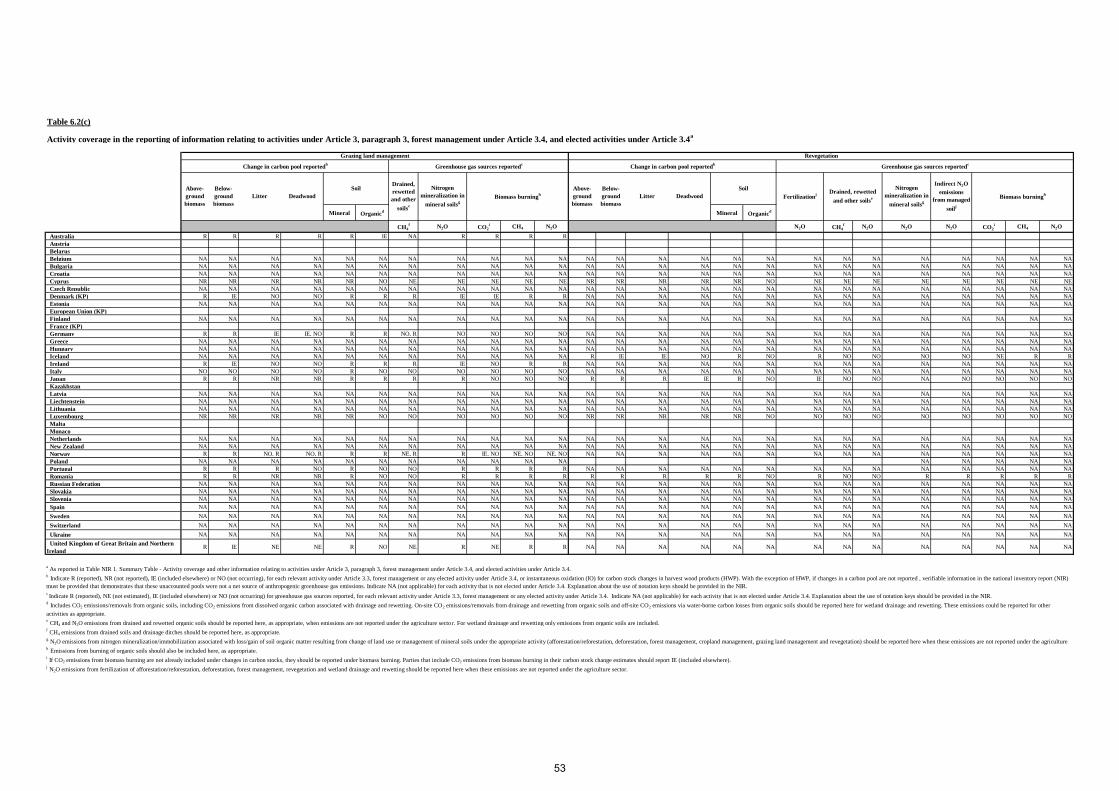
Table 6.2(c)
Activity coverage in the reporting of information relating to activities under Article 3, paragraph 3, forest management under Article 3.4, and elected activities under Article 3.4a
Mineral Organicd Mineral Organic
d
CH4f N2O CO2
i CH4 N2O N2O CH4f N2O N2O N2O CO2
i CH4 N2O
Australia R R R R R IE NA R R R R
Austria
Belarus
Belgium NA NA NA NA NA NA NA NA NA NA NA NA NA NA NA NA NA NA NA NA NA NA NA NA NA
Bulgaria NA NA NA NA NA NA NA NA NA NA NA NA NA NA NA NA NA NA NA NA NA NA NA NA NA
Croatia NA NA NA NA NA NA NA NA NA NA NA NA NA NA NA NA NA NA NA NA NA NA NA NA NA
Cyprus NR NR NR NR NR NO NE NE NE NE NE NR NR NR NR NR NO NE NE NE NE NE NE NE NE
Czech Republic NA NA NA NA NA NA NA NA NA NA NA NA NA NA NA NA NA NA NA NA NA NA NA NA NA
Denmark (KP) R IE NO NO R R R IE IE R R NA NA NA NA NA NA NA NA NA NA NA NA NA NA
Estonia NA NA NA NA NA NA NA NA NA NA NA NA NA NA NA NA NA NA NA NA NA NA NA NA NA
European Union (KP)
Finland NA NA NA NA NA NA NA NA NA NA NA NA NA NA NA NA NA NA NA NA NA NA NA NA NA
France (KP)
Germany R R IE IE, NO R R NO, R NO NO NO NO NA NA NA NA NA NA NA NA NA NA NA NA NA NA
Greece NA NA NA NA NA NA NA NA NA NA NA NA NA NA NA NA NA NA NA NA NA NA NA NA NA
Hungary NA NA NA NA NA NA NA NA NA NA NA NA NA NA NA NA NA NA NA NA NA NA NA NA NA
Iceland NA NA NA NA NA NA NA NA NA NA NA R IE IE NO R NO R NO NO NO NO NE R R
Ireland R IE NO NO R R R IE NO R R NA NA NA NA NA NA NA NA NA NA NA NA NA NA
Italy NO NO NO NO R NO NO NO NO NO NO NA NA NA NA NA NA NA NA NA NA NA NA NA NA
Japan R R NR NR R R R R NO NO NO R R R IE R NO IE NO NO NA NO NO NO NO
Kazakhstan
Latvia NA NA NA NA NA NA NA NA NA NA NA NA NA NA NA NA NA NA NA NA NA NA NA NA NA
Liechtenstein NA NA NA NA NA NA NA NA NA NA NA NA NA NA NA NA NA NA NA NA NA NA NA NA NA
Lithuania NA NA NA NA NA NA NA NA NA NA NA NA NA NA NA NA NA NA NA NA NA NA NA NA NA
Luxembourg NR NR NR NR NR NO NO NO NO NO NO NR NR NR NR NR NO NO NO NO NO NO NO NO NO
Malta
Monaco
Netherlands NA NA NA NA NA NA NA NA NA NA NA NA NA NA NA NA NA NA NA NA NA NA NA NA NA
New Zealand NA NA NA NA NA NA NA NA NA NA NA NA NA NA NA NA NA NA NA NA NA NA NA NA NA
Norway R R NO, R NO, R R R NE, R R IE, NO NE, NO NE, NO NA NA NA NA NA NA NA NA NA NA NA NA NA NA
Poland NA NA NA NA NA NA NA NA NA NA NA NA NA NA NA NA
Portugal R R R NO R NO NO R R R R NA NA NA NA NA NA NA NA NA NA NA NA NA NA
Romania R R NR NR R NO NO R R R R R R R R R NO R NO NO R R R R R
Russian Federation NA NA NA NA NA NA NA NA NA NA NA NA NA NA NA NA NA NA NA NA NA NA NA NA NA
Slovakia NA NA NA NA NA NA NA NA NA NA NA NA NA NA NA NA NA NA NA NA NA NA NA NA NA
Slovenia NA NA NA NA NA NA NA NA NA NA NA NA NA NA NA NA NA NA NA NA NA NA NA NA NA
Spain NA NA NA NA NA NA NA NA NA NA NA NA NA NA NA NA NA NA NA NA NA NA NA NA NA
Sweden NA NA NA NA NA NA NA NA NA NA NA NA NA NA NA NA NA NA NA NA NA NA NA NA NA
Switzerland NA NA NA NA NA NA NA NA NA NA NA NA NA NA NA NA NA NA NA NA NA NA NA NA NA
Ukraine NA NA NA NA NA NA NA NA NA NA NA NA NA NA NA NA NA NA NA NA NA NA NA NA NA
United Kingdom of Great Britain and Northern
IrelandR IE NE NE R NO NE R NE R R NA NA NA NA NA NA NA NA NA NA NA NA NA NA
j N2O emissions from fertilization of afforestation/reforestation, deforestation, forest management, revegetation and wetland drainage and rewetting should be reported here when these emissions are not reported under the agriculture sector.
g N2O emissions from nitrogen mineralization/immobilization associated with loss/gain of soil organic matter resulting from change of land use or management of mineral soils under the appropriate activity (afforestation/reforestation, deforestation, forest management, cropland management, grazing land management and revegetation) should be reported here when these emissions are not reported under the agriculture
h Emissions from burning of organic soils should also be included here, as appropriate.
i If CO2 emissions from biomass burning are not already included under changes in carbon stocks, they should be reported under biomass burning. Parties that include CO2 emissions from biomass burning in their carbon stock change estimates should report IE (included elsewhere).
c Indicate R (reported), NE (not estimated), IE (included elsewhere) or NO (not occurring) for greenhouse gas sources reported, for each relevant activity under Article 3.3, forest management or any elected activity under Article 3.4. Indicate NA (not applicable) for each activity that is not elected under Article 3.4. Explanation about the use of notation keys should be provided in the NIR.
d Includes CO2 emissions/removals from organic soils, including CO2 emissions from dissolved organic carbon associated with drainage and rewetting. On-site CO2 emissions/removals from drainage and rewetting from organic soils and off-site CO2 emissions via water-borne carbon losses from organic soils should be reported here for wetland drainage and rewetting. These emissions could be reported for other
activities as appropriate.e
CH4 and N2O emissions from drained and rewetted organic soils should be reported here, as appropriate, when emissions are not reported under the agriculture secto r. For wetland drainage and rewetting only emissions from organic soils are included.f
CH4 emissions from drained soils and drainage ditches should be reported here, as appropriate.
b Indicate R (reported), NR (not reported), IE (included elsewhere) or NO (not occurring), for each relevant activity under Article 3.3, forest management or any elected activity under Article 3.4, or instantaneous oxidation (IO) for carbon stock changes in harvest wood products (HWP). With the exception of HWP, if changes in a carbon pool are not reported , verifiable information in the national inventory report (NIR)
must be provided that demonstrates that these unaccounted pools were not a net source of anthropogenic greenhouse gas emissions. Indicate NA (not applicable) for each activity that is not elected under Article 3.4. Explanation about the use of notation keys should be provided in the NIR.
Below-
ground
biomass
Litter Deadwood
SoilDrained, rewetted
and other soilse
Nitrogen
mineralization in
mineral soilsg
Indirect N2O
emissions
from managed
soilj
Biomass burningh
a As reported in Table NIR 1. Summary Table - Activity coverage and other information relating to activities under Article 3, paragraph 3, forest management under Article 3.4, and elected activities under Article 3.4.
Fertilizationj
Drained,
rewetted
and other
soilse
Nitrogen
mineralization in
mineral soilsg
Biomass burningh
Above-
ground
biomass
Above-
ground
biomass
Below-
ground
biomass
Litter Deadwood
Soil
Grazing land management Revegetation
Change in carbon pool reportedb
Greenhouse gas sources reportedc
Change in carbon pool reportedb
Greenhouse gas sources reportedc
53

Table 6.2(d)
Activity coverage in the reporting of information relating to activities under Article 3, paragraph 3, forest management under Article 3.4, and elected activities under Article 3.4a
Mineral Organicd
N2O CH4h N2O N2O CO2
j CH4 N2O
Australia
Austria
Belarus
Belgium NA NA NA NA NA NA NA NA NA NA NA NA
Bulgaria NA NA NA NA NA NA NA NA NA NA NA NA
Croatia NA NA NA NA NA NA NA NA NA NA NA NA
Cyprus NR NR NR NR NO NE NE NE NE NE NE NE
Czech Republic NA NA NA NA NA NA NA NA NA NA NA NA
Denmark (KP) NA NA NA NA NA NA NA NA NA NA NA NA
Estonia NA NA NA NA NA NA NA NA NA NA NA NA
European Union (KP)
Finland NA NA NA NA NA NA NA NA NA NA NA NA
France (KP)
Germany NA NA NA NA NA NA NA NA NA NA NA NA
Greece NA NA NA NA NA NA NA NA NA NA NA NA
Hungary NA NA NA NA NA NA NA NA NA NA NA NA
Iceland NA NA NA NA NA NA NA NA NA NA NA NA
Ireland NA NA NA NA NA NA NA NA NA NA NA NA
Italy NA NA NA NA NA NA NA NA NA NA NA NA
Japan NA NA NA NA NA NA NA NA NA NA NA NA
Kazakhstan
Latvia NA NA NA NA NA NA NA NA NA NA NA NA
Liechtenstein NA NA NA NA NA NA NA NA NA NA NA NA
Lithuania NA NA NA NA NA NA NA NA NA NA NA NA
Luxembourg NR NR NR NR NO NO NO NO NO NO NO NO
Malta
Monaco
Netherlands NA NA NA NA NA NA NA NA NA NA NA NA
New Zealand NA NA NA NA NA NA NA NA NA NA NA NA
Norway NA NA NA NA NA NA NA NA NA NA NA NA
Poland NA NA NA NA NA NA NA NA NA NA NA
Portugal NA NA NA NA NA NA NA NA NA NA NA NA
Romania NA NA NA NA NA NA NA NA NA NA NA NA
Russian Federation NA NA NA NA NA NA NA NA NA NA NA NA
Slovakia NA NA NA NA NA NA NA NA NA NA NA NA
Slovenia NA NA NA NA NA NA NA NA NA NA NA NA
Spain NA NA NA NA NA NA NA NA NA NA NA NA
Sweden NA NA NA NA NA NA NA NA NA NA NA NA
Switzerland NA NA NA NA NA NA NA NA NA NA NA NA
Ukraine NA NA NA NA NA NA NA NA NA NA NA NA
United Kingdom of Great Britain and Northern
IrelandNR NR NR NR NR NE NE NE NE NE NE NE
j If CO2 emissions from biomass burning are not already included under changes in carbon stocks, they should be reported under biomass burning. Parties that include CO2 emissions from biomass burning in their carbon stock change estimates
should report IE (included elsewhere).
Wetland drainage and rewetting
Change in carbon pool reportedb
Greenhouse gas sources reportedc
Fertilizatione
Drained, rewetted
and other soilsf
Indirect N2O
emissions
from managed
soile
Biomass burningi
Above-
ground
biomass
Deadwood
Soil
a As reported in Table NIR 1. Summary Table - Activity coverage and other information relating to activities under Article 3, paragraph 3, forest management under Article 3.4, and elected activities under Article 3.4.
b Indicate R (reported), NR (not reported), IE (included elsewhere) or NO (not occurring), for each relevant activity under Article 3.3, forest management or any elected activity under Article 3.4, or instantaneous oxidation (IO) for carbon stock
changes in harvest wood products (HWP). With the exception of HWP, if changes in a carbon pool are not reported , verifiable information in the national inventory report (NIR) must be provided that demonstrates that these unaccounted pools
were not a net source of anthropogenic greenhouse gas emissions. Indicate NA (not applicable) for each activity that is not elected under Article 3.4. Explanation about the use of notation keys should be provided in the NIR.c Indicate R (reported), NE (not estimated), IE (included elsewhere) or NO (not occurring) for greenhouse gas sources reported, for each relevant activity under Article 3.3, forest management or any elected activity under Article 3.4. Indicate
NA (not applicable) for each activity that is not elected under Article 3.4. Explanation about the use of notation keys should be provided in the NIR.
d Includes CO2 emissions/removals from organic soils, including CO2 emissions from dissolved organic carbon associated with drainage and rewetting. On-site CO2 emissions/removals from drainage and rewetting from organic soils and off-site
CO2 emissions via water-borne carbon losses from organic soils should be reported here for wetland drainage and rewetting. These emissions could be reported for other activities as appropriate.
i Emissions from burning of organic soils should also be included here, as appropriate.
Below-
ground
biomass
e N2O emissions from fertilization of each activity (afforestation/reforestation, deforestation, forest management, revegetation and wetland drainage and rewetting) should be reported here when these emissions are not reported under the
agriculture sector. f CH4 and N2O emissions from drained and rewetted organic soils should be reported here, as appropriate, when emissions are not reported under the agriculture sector. For wetland drainage and rewetting only emissions from organic soils are
included.g CH4 emissions from drained soils and drainage ditches should be reported here, as appropriate.
h N2O emissions from nitrogen mineralization/immobilization associated with loss/gain of soil organic matter resulting from change of land use or management of mineral soils under the appropriate activity (afforestation/reforestation,
deforestation, forest management, cropland management, grazing land management and revegetation) should be reported here when these emissions are not reported under the agriculture sector.
Litter
54

Table 6.3(a)
Afforestation and reforestation - area and implied carbon stock change factors from the change in carbon stocks for 2014a
TotalMineral
Soils
Organic
Soilb Total
Mineral
Soils
Organic
Soilb
Gains Losses Net change Gains Losses Net change Mineral Organice, f
Australia 3 190 3 190 IE, NA 0.47 IE, NA 0.47 0.17 IE, NA 0.17 0.12 0.14 -0.27 NA, NO NA NA NA
Austria 211 211 NO 1.4 -0.45 0.96 0.36 –0.097 0.26 0.89 0.016 0.53 NO
Belarus
Belgium 38 38 NA, NO 1.8 NA, NO 1.8 0.35 NA, NO 0.35 NA, NO NA, NO 1.4 NA, NO NA NA NA
Bulgaria 251 251 NO 2.5 -0.30 2.2 IE, NO IE, NO IE, NO 0.23 NO -1.0 NO NO NO NO
Croatia 52 52 NA, NO 1.3 -0.75 0.53 NA, IE NA, IE NA, IE NA, IE NA, NO 0.72 NA, NO NA NA NA
Cyprus NE, NO NE NO NE NE NE NE NE NE NE NE NE NO NE, NO NE NO
Czech Republic 55 55 NO 1.7 NO 1.7 0.35 NO 0.35 0.50 0.007 0.12 NO NO NO NO
Denmark (KP) 87 77 9.4 0.29 –0.035 0.26 0.046 IE 0.046 0.15 0.001 0.089 -1.3
Estonia 34 26 8.1 1.4 IE, NO 1.4 0.57 IE, NO 0.57 0.30 –0.003 -0.55 -0.48 NO NO NO
European Union (KP)
Finland 170 104 66 1.1 –0.008 1.1 0.38 –0.003 0.38 IE IE 0.092 -1.5
France (KP) 1 433 1 433 IE, NO 1.3 -0.21 1.1 0.47 IE, NO 0.47 0.17 0.032 0.18 IE, NO NO NO NO
Germany 520 476 44 3.0 -0.17 2.9 0.61 –0.089 0.52 0.47 0.034 -0.27 -2.2 NA NA NA
Greece 33 33 NO 2.0 -1.1 0.93 0.38 -0.21 0.17 NA, NE NA, NE NA, NE NA NO NO NO
Hungary 173 173 NA, NO 1.4 –0.033 1.3 0.34 –0.002 0.34 NA, NE NA, NE NA, NE NA, NO NA NA NA
Iceland 43 40 3.1 0.70 IE, NO 0.70 0.18 IE, NO 0.18 0.16 NO 0.40 -0.49 NO NO NO
Ireland 305 137 168 4.0 -2.3 1.7 0.90 -0.19 0.71 0.78 0.27 NA, NO -0.73 NA NA NA
Italy 1 860 1 860 NO 2.1 -1.3 0.82 0.44 -0.27 0.16 0.015 0.009 0.15 NA, NO NO NO NO
Japan 35 35 NA, NO 2.3 0.000 2.3 0.60 –0.001 0.60 0.24 0.83 0.080 NA, NO NA NA NA
Kazakhstan
Latvia 41 40 0.80 0.47 -0.16 0.31 0.11 –0.036 0.071 0.081 0.097 NA, NO 2.6 NA NA NA
Liechtenstein 0.036 0.036 NO 1.3 NO 1.3 0.42 NO 0.42 NO NO 0.38 NO NO NO NO
Lithuania 41 35 6.5 1.2 IE, NA 1.2 0.28 IE, NA 0.28 1.1 NA, NO -0.63 -2.2 NA NA NA
Luxembourg 8.8 8.8 NO 3.1 –0.037 3.1 0.62 IE, NO 0.62 0.58 0.17 1.0 NO NO NO NO
Malta
Monaco
Netherlands NO NO NO NO NO NO NO NO NO NO NO NO NO NO
New Zealand 646 644 1.8 7.1 -0.19 6.9 1.5 –0.053 1.4 –0.195 –0.311 -0.41 -0.68
Norway 57 51 6.1 0.64 –0.089 0.55 0.20 –0.027 0.17 2.2 0.022 -0.53 -0.93
Poland 721 703 18 0.82 0.82 0.22 NO 0.22 NO NO 0.062 -0.68
Portugal 604 604 NO 2.1 -0.36 1.7 0.41 -0.17 0.24 –0.008 IE 0.26 NO NO NO NO
Romania 32 32 IE, NO 1.8 IE, NO 1.8 IE, NO IE, NO IE, NO 0.050 IE, NO 1.1 IE, NO NO NO NO
Russian Federation 578 578 NO 1.9 -0.62 1.3 0.46 -0.15 0.31 0.041 0.29 0.50 NO NO NO NO
Slovakia 39 39 NA, NO 1.1 NA, NO 1.1 0.25 NA, NO 0.25 0.41 NA, NO 1.3 NA, NO NA NA NA
Slovenia NO NO NO NA NA NA NA NA NA NA NA NA NA NO NO NO
Spain NA 1 235 NA, NO NA IE, NA NA IE, NA IE, NA IE, NA NA NA 0.54 NA, NO NA NA NA
Sweden 336 309 27 0.89 IE, NO 0.89 0.30 IE, NO 0.30 0.30 0.025 -0.15 -2.5 NO NO NO
Switzerland 2.5 2.5 0.012 2.1 -1.1 0.97 0.69 -0.29 0.40 –0.078 –0.001 0.44 -2.6
Ukraine 302 302 NA, NO 0.50 –0.007 0.49 0.11 IE, NA, NO 0.11 0.17 0.066 0.061 NA, NO NA NA NA
United Kingdom of Great
Britain and Northern Ireland 351 324 27 1.5 -0.10 1.4 IE, NA IE, NA IE, NA 0.093 IE, NA 1.00 2.3 NA NA NA
Area subject to natural
disturbances
(kha)
Net CSC in
litterc
Net CSC in
dead woodc
Area subject to the activity Implied carbon stock change factor (t C/ha)
CSC in above-ground biomassc, d
CSC in below-ground biomassc, d
Net CSC in soilc
d Carbon stock gains and losses should be listed separately except in cases where, due to the methods used, it is technically impossible to separate information on gains and losses. In that case, net gains should be reported in the “Gains” column and
net losses should be reported in the “Losses” column. The notation key included elsewhere (IE) should be filled in, in the other column.e The value reported here is an emission and not a carbon stock change.
f CO2 emissions from dissolved organic carbon from drained and CO2 emissions/removals from rewetted organic soils may also be included here.
(kha)
a As both afforestation and reforestation under Article 3.3 are subject to the same provisions specified in the annex to decision 2/CMP.7, they can be reported together.
b A Party should report on-site CO2 emissions from drained organic soils here. A Party may also choose to include emissions and removals from rewetted and other organic soils, including off-site CO2 emissions, here. A Party should provide detailed
information on methodologies, emissions and removals from these subdivisions in the NIR.c Carbon stock changes (CSC). The signs for estimates of gains in carbon stocks are positive (+) and of losses in carbon stocks are negative (-).
55

Table 6.3(b)
TotalMineral
Soils
Organic
SoilTotal
Mineral
Soils
Organic
Soil
Gains Losses Net change Gains Losses Net change Mineral Organicc, d
Australia 8 603 8 603 IE, NO IE, NO -0.32 -0.32 IE, NO –0.138 -0.14 –0.077 -0.22 -0.28 IE, NO NO NO NO
Austria 72 72 NO 0.21 -0.90 -0.69 0.052 –0.222 -0.17 -0.54 0.0004 -0.57 NO
Belarus
Belgium 27 27 NA, NO NA, NO -1.1 -1.1 NA, NO -0.22 -0.22 0.010 -0.11 -1.6 NA, NO NA NA NA
Bulgaria 4.4 4.4 NO 0.034 -1.9 -1.8 IE, NO IE, NO IE, NO -0.19 –0.094 -3.3 NO NO NO NO
Croatia 4.4 4.4 NA, NO 0.68 -0.27 0.42 IE, NA IE, NA IE, NA IE, NA IE, NA -2.9 NA,NO NA NA NA
Cyprus NE, NO NE NO NE NE NE NE NE NE NE NE NE NO NE, NO NE NO
Czech Republic 17 17 NO NA, NO -2.7 -2.7 NA, NO -0.54 -0.54 -0.37 –0.075 –0.041 NA, NO NO NO NO
Denmark (KP) 3.4 3.2 0.16 0.55 -6.2 -5.7 IE, NO -1.2 -1.2 -1.9 -0.17 0.099 -6.0 NO NO NO
Estonia 21 16 4.3 IE, NA -1.7 -1.7 IE, NA -0.40 -0.40 -1.0 –0.064 -0.69 -0.80 NA NA NA
European Union (KP)
Finland 384 297 87 0.047 -1.0 -0.96 0.017 -0.30 -0.29 IE –0.013 -0.36 -5.0
France (KP) 1 081 1 081 IE NO -1.5 -1.5 NO -0.35 -0.35 -0.17 –0.055 -0.63 IE NO NO NO
Germany 279 259 20 0.29 -1.3 -1.0 0.11 -0.23 -0.12 -0.52 –0.056 0.15 -4.9 NA NA NA
Greece 5.2 5.2 NO NA, NO –0.082 -0.08 NA, NO –0.031 –0.031 –0.032 –0.004 -2.2 NA, NO NO NO NO
Hungary 11 11 NO IE, NO -1.6 -1.6 IE, NO -0.41 -0.41 -0.47 -0.14 -0.83 NO NO NO NO
Iceland 0.049 0.049 NO NO IE, NO IE, NO NO IE, NO IE, NO NO IE, NO -0.61 NO NO NO NO
Ireland 17 10 6.8 0.003 -0.64 -0.64 0.014 -0.14 -0.12 –0.080 –0.027 -0.37 -1.1 NA NA NA
Italy 48 48 NO NA, NO -3.6 -3.6 NA, NO -0.76 -0.76 -0.23 -0.11 -6.4 NA, NO NO NO NO
Japan 359 358 0.60 0.001 -0.80 -0.79 0.004 -0.21 -0.20 -0.15 -0.36 -0.11 NA, NO NA NA NA
Kazakhstan
Latvia 51 37 14 NO -2.9 -2.9 NO -0.65 -0.65 -0.70 -0.73 -0.75 -5.9 NO NO NO
Liechtenstein 0.17 0.17 NO 0.42 -3.7 -3.3 0.14 -1.2 -1.1 -0.82 -0.43 -1.2 NO NO NO NO
Lithuania 2.0 1.7 0.31 IE, NO -12.9 -12.9 IE, NO -3.0 -3.0 -5.0 -0.67 -15 -15 NO NO NO
Luxembourg 5.8 5.8 NO 0.073 -0.72 -0.65 IE, NA -0.16 -0.16 -0.13 –0.038 -1.0 NO, NA NO NO NO
Malta
Monaco
Netherlands NO NO NO NO NO NO NO NO NO NO NO NO NO NO NO NO
New Zealand 182 182 0.77 0.090 -6.9 -6.8 0.19 -1.5 -1.3 -0.39 -0.36 0.54 -2.3 NA NA NA
Norway 146 135 10 0.054 -1.1 -1.0 0.017 -0.30 -0.29 -2.4 -0.20 0.19 -7.9
Poland 17 17 NO NO -1.9 -1.9 NO -0.38 -0.38 –0.001 –0.007 -1.8 NO
Portugal 355 355 NO 0.078 -0.37 -0.29 0.042 –0.079 –0.037 –0.025 IE -1.1 NO NO NO NO
Romania 365 365 NA, NO NA, NO -3.9 -3.9 IE, NA IE, NA IE, NA -0.33 IE, NA -1.6 NA, NO NO NA NA
Russian Federation 15 15 IE, NO NO -48 -48 NO -13 -13 -9.2 -13 -21 NO NO NO NO
Slovakia 8.4 8.4 NA, NO NA, NO -1.5 -1.5 NA, NO -0.33 -0.33 -0.15 –0.087 –0.025 NA, NO NA NA NA
Slovenia 26 26 NO NO -3.1 -3.1 NO -0.28 -0.28 -0.34 -0.15 -1.6 NA 1.7 1.7 NO
Spain NA 111 NA, NO IE, NA, NO NA NA NA,NO,IE NA,NO,IE NA,NO,IE NA NA -0.34 NA,NO NA NA NA
Sweden 284 272 12 IE, NO -0.77 -0.77 IE, NO -0.26 -0.26 -1.1 0.001 -0.80 -1.3 NO NO NO
Switzerland 6.2 6.1 0.025 0.000 -2.9 -2.9 0.000 -0.90 -0.90 -1.0 -0.23 -0.99 -6.1
Ukraine 50 50 NA, NO NA, NO –0.027 –0.027 NA, NO –0.009 –0.009 0.000 0.000 –0.009 NA, NO NA NA NA
United Kingdom of Great
Britain and Northern Ireland 54 54 IE, NA, NO 0.001 -1.59 -1.6 IE, NA, NO IE, NA, NO IE, NA, NO -0.25 IE, NA, NO -1.6 IE, NA, NO NA NA NA
d CO2 emissions from dissolved organic carbon from drained and CO2 emissions/removals from rewetted organic soils may also be included here.
Area subject to natural
disturbance
(kha)
a Carbon stock change (CSC). The signs for estimates of gains in carbon stocks are positive (+) and of losses in carbon stocks are negative (-).
b Carbon stock gains and losses should be listed separately except in cases where, due to the methods used, it is technically impossible to separate information on gains and losses. In that case, net gains should be reported in the "Gains" column and
net losses should be reported in the "Losses" column. The notation key IE should be filled in, in the other column.
c The value reported here is an emission and not a carbon stock change.
Deforestation - area and implied carbon stock change factors from the change in carbon stocks for 2014
Area subject to the activity Implied carbon stock change factor (t C/ha)
Net CSC in soila
(kha)
CSC in above-ground biomassa, b
CSC in below-ground biomassa, b
Net CSC
in littera
Net CSC in
dead wooda
56

Table 6.3(c)
TotalMineral
Soils
Organic
SoilTotal
Mineral
Soils
Organic
SoilTotal
Mineral
Soils
Organic
SoilTotal
Mineral
Soils
Organic
Soil
Gains Losses Net change Gains Losses Net change Mineral Organicd, e
Australia 10 976 10 976 IE, NA 0.54 IE, NA 0.54 0.13 IE, NA 0.13 -0.10 -0.24 0.018 IE, NA NA NA NA NA NA NA IE IE NA
Austria 3 813 3 813 NA, NO 1.9 -1.7 0.26 0.45 -0.42 0.032IE, NA, NE, NO 0.057 -0.18 NA, NO NA NA NA NA NA NA NO NO NO
Belarus
Belgium 687 687 NA, NO 0.92 -0.13 0.79 0.057 –0.026 0.031 0.004 –0.012 0.53 NA NA NA NA NA NA NA
Bulgaria 3 619 3 619 NO 0.55 IE, NO 0.55 IE, NO IE, NO IE, NO NO NO NO NO NO NO NO NO NO NO NO NO NO
Croatia 2 310 2 310 NA, NO 1.7 -1.0 0.74 IE, NA IE, NA IE, NA NA, NO NA, NO NA, NO NA, NO NA NA NA NA NA NA NA NA NA
Cyprus NE, NO NE NO NE NE NE NE NE NE NE NE NE NO NE, NO NE NO NE, NO NE NO NE, NO NE NO
Czech Republic 2 611 2 592 19 2.4 -1.8 0.60 0.49 -0.37 0.12 NO NO NO NO NO NO NO NO NO NO NO NO NO
Denmark (KP) 528 502 26 1.2 IE, NA 1.2 0.26 IE, NA 0.26 0.39 0.13 NA, NO -1.3 NA NA NA NA NA NA NA NA NA
Estonia 2 276 465 1 811 IE, NA –0.017 –0.017 IE, NA IE, NA IE, NA NE, NA –0.012 0.61 –0.044 NA NA NA NA NA NA NA NA NA
European Union (KP)
Finland 21 692 15 801 5 891 1.3 -1.0 0.28 0.35 -0.30 0.053 IE, NA, NO IE, NA, NO 0.16 -0.30 NA NA NA NA NA NA NO NO NO
France (KP) 21 553 21 553 IE 1.4 -0.85 0.59 0.41 -0.21 0.21 0.001 –0.034 –0.003 IE IE IE IE IE IE IE IE IE IE
Germany 10 635 10 534 101 0.90 IE, NA 0.90 0.13 IE, NA 0.13 –0.013 –0.052 0.41 -2.2 NA NA NA NA NA NA NA NA NA
Greece 1 234 1 234 NA, NO 0.45 –0.094 0.35 0.15 –0.030 0.12 NA, NE, NO NA, NE, NO NA, NE, NO NA, NO NA NA NA NA NA NA NO NO NO
Hungary 1 768 1 761 6.5 0.38 IE, NA 0.38 0.13 IE, NA 0.13 NE, NA NE, NA NE, NA -2.6 NA NA NA NA NA NA NA NA NA
Iceland 94 93 0.49 0.19 –0.014 0.18 0.047 IE, NE 0.047 0.006 IE, NO 0.015 -0.37 NO NO NO NO NO NO NO NO NO
Ireland 449 181 268 4.3 -5.1 -0.78 1.1 -0.61 0.51 0.47 0.093 NA, NO -0.47 NO NO NO NO NO NO NA NA NA
Italy 7 464 7 464 NA, NO 2.3 -1.4 0.89 0.47 -0.29 0.18 0.002 0.001 NA, NE, NO NA, NO NA NA NA NA NA NA NO NO NO
Japan 16 088 16 042 46 0.70 –0.024 0.68 0.18 –0.006 0.17 0.004 –0.036 0.024 NA, NO NA NA NA NA NA NA NA NA NA
Kazakhstan
Latvia 3 258 2 772 486 2.1 -2.1 0.036 0.48 -0.47 0.008 NA, NO 0.31 NA, NO -2.6 NO NO NO NO NO NO NA NA NA
Liechtenstein 6.1 6.1 NO 1.7 -1.9 -0.17 0.56 -0.62 –0.057 NO NO NO NO NO NO NO NO NO NO NO NO NO
Lithuania 2 156 1 818 339 0.92 IE, NA, NO 0.92 0.22 IE, NA, NO 0.22 0.043 0.078 NA, NO -1.5 IE IE IE NO NO NO NA NA NA
Luxembourg 87 87 NO 2.5 -1.6 0.92 0.54 -0.34 0.20 NO 0 NO NO NO NO NO NO NO NO NO NO NO
Malta
Monaco
Netherlands NO NO NO NO NO NO NO NO NO NO NO NO NO NO NO NO NO NO NO
New Zealand 9 270 9 252 18 0.99 -0.92 0.065 0.22 -0.19 0.022 –0.005 0.097 0.000 -0.11 NO NO NO NO NO NO NA NA NA
Norway 12 063 11 345 718 0.74 -0.29 0.45 0.19 –0.074 0.11 0.11 0.023 0.003 -0.26 NA NA NA NA NA NA NA NA NA
Poland 8 661 8 424 238 0.71 IE, NA, NO 0.71 0.19 IE, NA, NO 0.19 NA, NO NA, NO 0.11 -0.68 NO NO NO NO NO NO NA NA NA
Portugal 3 760 3 760 NO 1.6 -1.2 0.44 0.33 -0.15 0.18 –0.003 IE, NO –0.005 NO NO NO NO NO NO NO NO NO NO
Romania 7 064 6 969 95 1.7 -0.69 0.98 IE, NA, NO IE, NA, NO IE, NA, NO 0.004 NA, NO 0.085 -0.68 NA NA NA NA NA NA NO NO NO
Russian Federation 618 008 616 058 1 950 0.28 –0.073 0.21 0.078 –0.038 0.040 0.004 0.023 0.007 -0.71 IE IE IE NO NO NO NA NA NA
Slovakia 1 985 1 985 NA, NO 2.1 -1.6 0.48 0.42 -0.32 0.099 NA, NO NA, NO NA, NO NA, NO NA NA NA NA NA NA NA NA NA
Slovenia 1 067 1 066 0.72 1.3 IE, NA 1.3 0.29 IE, NA 0.29 NA, NO –0.001 NA, NO NA, NO NO NO NO NO NO NO NO NO NO
Spain NA, NO 14 439 NA, NO NA, NO IE, NA, NO NA, NO IE, NA, NO IE, NA, NO IE, NA, NO NA, NO NA, NO –0.002 NA, NO NO NO NO NO NO NO NA NA NA
Sweden 28 393 24 626 3 768 0.27 IE, NO 0.27 0.092 IE, NO 0.092 –0.071 0.083 0.14 -0.38 NO NO NO NO NO NO NO NO NO
Switzerland 1 251 1 247 3.7 2.2 -1.8 0.42 0.63 -0.53 0.10 -0.14 0.004 0.001 -2.7
Ukraine 9 354 9 161 193 1.7 -0.36 1.3 0.25 IE, NA 0.25 0.022 0.32 NA, NO -0.68 NA NA NA NA NA NA NA NA NA
United Kingdom of Great
Britain and Northern Ireland 2 321 2 096 225 2.5 -1.4 1.2 IE, NA, NO IE, NA, NO IE, NA, NO 0.24 IE, NA, NO 0.20 0.68 NA NA NA NA NA NA NO NO NO
Forest management - area and implied carbon stock change factors from the change in carbon stocks for 2014a
(kha)
Area subject to the activity Implied carbon stock change factor (t C/ha)Area subject to newly established
forest(CEF-ne)
Area subject to natural
disturbances
(kha) (kha) (kha)
Net CSC in
litterb
Area subject to harvested and
converted forest plantations (CEF-
hc)
e CO2 emissions from dissolved organic carbon from drained and CO2 emissions/removals from rewetted organic soils may also be included here.
b The signs for estimates of gains in carbon stocks are positive (+) and of losses in carbon stocks are negative (-).
CSC in above-ground biomassb, c
CSC in above-ground biomassb, c
d The value reported here is an emission or removal and not a carbon stock change.
Net CSC in
dead woodb
Net CSC in soilb
c Carbon stock gains and losses should be listed separately except in cases where, due to the methods used, it is technically impossible to separate information on gains and losses. In that case, net gains should be
a For forest management,information reported here refers to anthropogenic carbon stock change for the inventory year for all geographical locations that encompass land subject to forest management under Article 3.4. Newly established forest will reach at least the equivalent carbon stock that was contained in the harvested
forest plantation at the time of harvest, and, if not, a debit would be generated under Article 3.4. Reporting is required by Parties which apply the provision to exclude emissions from natural disturbances in accordance with paragraphs 33 and 34 in the annex to decision 2/CMP.7.
57

Table 6.3(d)
TotalMineral
Soils
Organic
Soil
Gains Losses Net change Gains Losses Net change Mineral Organicd
Australia 42 286 42 286 IE 0.001 0.000 0.001 0.001 IE 0.001 -0.001 0.000 0.006 IE, NO
Austria NO
Belarus
Belgium NA NA NA NA NA NA NA NA NA NA NA NA NA
Bulgaria
Croatia NA NA NA NA NA NA NA NA NA NA NA NA NA
Cyprus
Czech Republic NA NA NA NA NA NA NA NA NA NA NA NA NA
Denmark (KP) 2 564 2 474 90 0.11 -0.10 0.003 0.023 –0.048 –0.025 NO NO -0.14 -7.3
Estonia NA NA NA NA NA NA NA NA NA NA NA NA NA
European Union (KP)
Finland NA NA NA NA NA NA NA NA NA NA NA NA NA
France (KP) NE NE NE NE NE NE NE NE NE NE NE NE NE
Germany 14 616 14 209 408 0.019 –0.015 0.005 0.006 –0.011 –0.005 IE, NO IE, NO –0.053 -7.5
Greece NA NA NA NA NA NA NA NA NA NA NA NA NA
Hungary NA NA NA NA NA NA NA NA NA NA NA NA NA
Iceland NA
Ireland 675 675 NO 0.036 –0.033 0.003 IE IE IE NO NO –0.002 NO
Italy 8 863 8 863 NO 0.000 –0.069 –0.069 IE, NO IE, NO IE, NO NA NO NO NO
Japan 3 904 3 729 175 0.000 –0.006 –0.006 0.000 –0.004 –0.004 NA NA -0.19 -2.4
Kazakhstan
Latvia NA NA NA NA NA NA NA NA NA NA NA NA NA
Liechtenstein NO NO NO NO NO NO NO NO NO NO NO NO NO
Lithuania NA NA NA NA NA NA NA NA NA NA NA NA NA
Luxembourg NA NA NA NA NA NA NA NA NA NA NA NA NA
Malta
Monaco
Netherlands
New Zealand
Norway 937 877 60 0.000 -0.003 -0.003 0.000 –0.001 –0.001 NO NO –0.001 -8.1
Poland NA NA NA NA NA NA NA NA NA NA NA NA NA
Portugal 2 337 2 337 0.032 –0.018 0.013 0.010 –0.010 –0.001 –0.003 IE –0.041
Romania NA NA NA NA NA NA NA NA NA NA NA NA NA
Russian Federation NA NA NA NA NA NA NA NA NA NA NA NA NA
Slovakia NA NA NA NA NA NA NA NA NA NA NA NA NA
Slovenia NA NA NA NA NA NA NA NA NA NA NA NA NA
Spain 20 164 20 164 NO IE –0.014 –0.014 IE IE IE 0.000 0 0.010 NO
Sweden NA NA NA NA NA NA NA NA NA NA NA NA NA
Switzerland
Ukraine NA NA NA NA NA NA NA NA NA NA NA NA NA
United Kingdom of Great
Britain and Northern Ireland 5 178 5 085 93 0.003 –0.007 –0.004 NE,IE NE,IE NE,IE NE NE -0.39 NE,NO
d The value reported here is an emission or removal and not a carbon stock change.
Cropland management - area and implied carbon stock change factors from the change in carbon stocks for 2014a
Area subject to the activity Implied carbon stock change factor (t C/ha)
CSC in above-ground biomassb, c
CSC in below-ground biomassb, c
Net CSC in
litterb
Net CSC in
dead woodb
Net CSC in soilb
(kha)
a For those Parties where Cropland management has been elected, this table contains information on anthropogenic carbon stock change for the inventory year for all geographic locations that encompass land subject
to cropland management under Article 3.4.
b The signs for estimates of gains in carbon stocks are positive (+) and of losses in carbon stocks are negative (-).
c Carbon stock gains and losses should be listed separately except in cases where, due to the methods used, it is technically impossible to separate information on gains and losses. In that case, net gains should be
reported in the "Gains" column and net losses should be reported in the "Losses" column. The notation key IE should be filled in, in the other column.
58

Table 6.3(e)
TotalMineral
Soils
Organic
Soil
Gains Losses Net change Gains Losses Net change Mineral Organicd
Australia 42 286 42 286 IE 0.000 IE 0.000 IE IE IE IE, NA IE, NA IE, NA IE, NO
Austria NO
Belarus
Belgium NA NA NA NA NA NA NA NA NA NA NA NA NA
Bulgaria
Croatia NA NA NA NA NA NA NA NA NA NA NA NA NA
Cyprus
Czech Republic NA NA NA NA NA NA NA NA NA NA NA NA NA
Denmark (KP) 2 753 2 632 121 0.036 -0.037 -0.001 0.007 -0.009 -0.002 NO NO -0.15 -9.3
Estonia NA NA NA NA NA NA NA NA NA NA NA NA NA
European Union (KP)
Finland
France (KP) NO NO NO NO NO NO NO NO NO NO NO NO NO
Germany 14 092 13 777 315 0.013 –0.018 –0.005 0.005 –0.011 –0.006 IE, NO IE, NO –0.053 -7.7
Greece NA NA NA NA NA NA NA NA NA NA NA NA NA
Hungary
Iceland NA
Ireland 698 698 NO 0.034 –0.035 –0.001 IE IE IE NO NO 0.003 NO
Italy 10 704 10 704 NO 0.003 –0.021 –0.018 IE, NO IE, NO IE, NO NA NO NO NO
Japan 4 597 4 406 190 0.000 –0.010 –0.010 0.0001 –0.007 –0.007 NA NA –0.506 -2.4
Kazakhstan
Latvia NA NA NA NA NA NA NA NA NA NA NA NA NA
Liechtenstein
Lithuania
Luxembourg NA NA NA NA NA NA NA NA NA NA NA NA NA
Malta
Monaco
Netherlands
New Zealand
Norway 938 880 58 0.000 –0.003 –0.002 0.000 –0.001 –0.001 NO NO 0.002 -7.9
Poland NA NA NA NA NA NA NA NA NA NA NA NA NA
Portugal 2 974 2 974 0.016 –0.004 0.012 0.003 –0.002 0.002 –0.029 IE -0.29
Romania NA NA NA NA NA NA NA NA NA NA NA NA NA
Russian Federation NA NA NA NA NA NA NA NA NA NA NA NA NA
Slovakia NA NA NA NA NA NA NA NA NA NA NA NA NA
Slovenia NA NA NA NA NA NA NA NA NA NA NA NA NA
Spain 20 999 20 999 NO 0.016 IE 0.016 IE IE IE –0.000 0 –0.002 NO
Sweden NA NA NA NA NA NA NA NA NA NA NA NA NA
Switzerland
Ukraine NA NA NA NA NA NA NA NA NA NA NA NA NA
United Kingdom of Great
Britain and Northern Ireland 5 427 5 334 93 0.001 –0.013 –0.013 NE,IE NE,IE NE,IE NE NE –0.004 NE,NO
Cropland management - area and implied carbon stock change factors from the change in carbon stocks for the base yeara
Area subject to the activity Implied carbon stock change factor (t C/ha)
a For those Parties where Cropland management has been elected, contains information on anthropogenic carbon stock change for the inventory year for all geographic locations that encompass land subject to cropland
management under Article 3.4.
b The signs for estimates of gains in carbon stocks are positive (+) and of losses in carbon stocks are negative (-).
d The value reported here is an emission or removal and not a carbon stock change.
CSC in above-ground biomassb, c
CSC in below-ground biomassb, c
Net CSC in
litterb
Net CSC in
dead woodb
Net CSC in soilb
(kha)
c Carbon stock gains and losses should be listed separately except in cases where, due to the methods used, it is technically impossible to separate information on gains and losses. In that case, net gains should be
reported in the "Gains" column and net losses should be reported in the "Losses" column. The notation key IE should be filled in, in the other column.
59
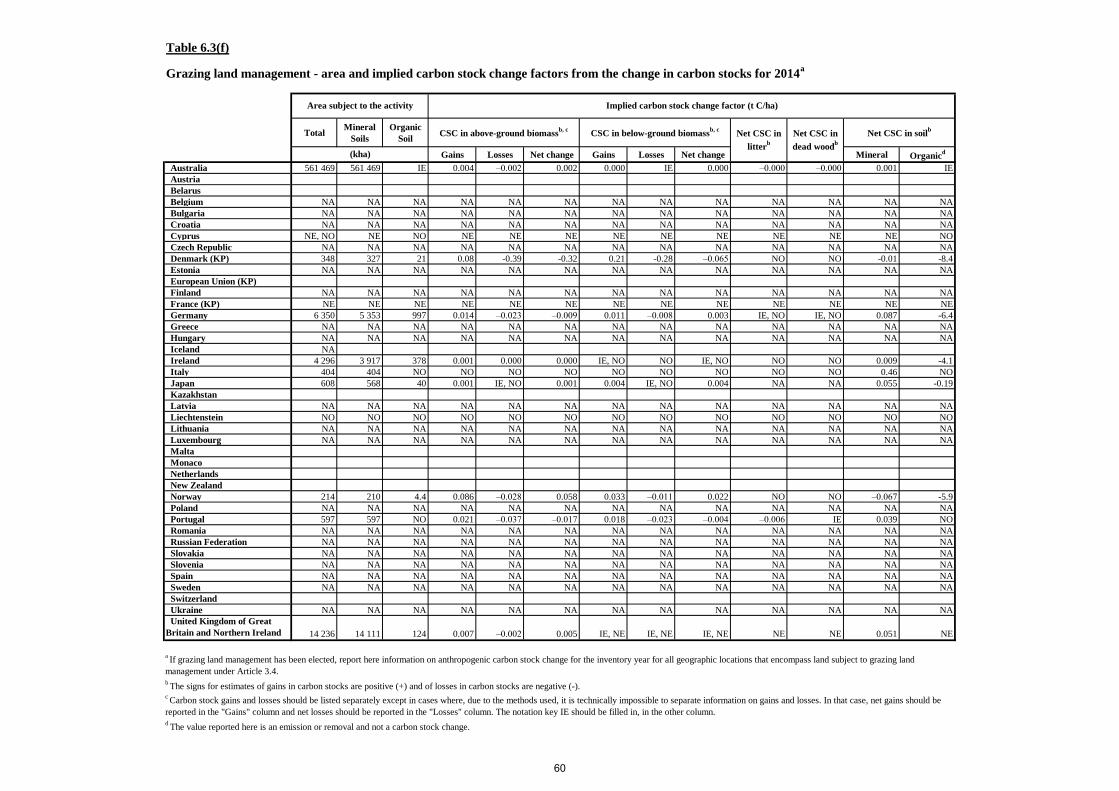
Table 6.3(f)
TotalMineral
Soils
Organic
Soil
Gains Losses Net change Gains Losses Net change Mineral Organicd
Australia 561 469 561 469 IE 0.004 –0.002 0.002 0.000 IE 0.000 –0.000 –0.000 0.001 IE
Austria
Belarus
Belgium NA NA NA NA NA NA NA NA NA NA NA NA NA
Bulgaria NA NA NA NA NA NA NA NA NA NA NA NA NA
Croatia NA NA NA NA NA NA NA NA NA NA NA NA NA
Cyprus NE, NO NE NO NE NE NE NE NE NE NE NE NE NO
Czech Republic NA NA NA NA NA NA NA NA NA NA NA NA NA
Denmark (KP) 348 327 21 0.08 -0.39 -0.32 0.21 -0.28 –0.065 NO NO -0.01 -8.4
Estonia NA NA NA NA NA NA NA NA NA NA NA NA NA
European Union (KP)
Finland NA NA NA NA NA NA NA NA NA NA NA NA NA
France (KP) NE NE NE NE NE NE NE NE NE NE NE NE NE
Germany 6 350 5 353 997 0.014 –0.023 –0.009 0.011 –0.008 0.003 IE, NO IE, NO 0.087 -6.4
Greece NA NA NA NA NA NA NA NA NA NA NA NA NA
Hungary NA NA NA NA NA NA NA NA NA NA NA NA NA
Iceland NA
Ireland 4 296 3 917 378 0.001 0.000 0.000 IE, NO NO IE, NO NO NO 0.009 -4.1
Italy 404 404 NO NO NO NO NO NO NO NO NO 0.46 NO
Japan 608 568 40 0.001 IE, NO 0.001 0.004 IE, NO 0.004 NA NA 0.055 -0.19
Kazakhstan
Latvia NA NA NA NA NA NA NA NA NA NA NA NA NA
Liechtenstein NO NO NO NO NO NO NO NO NO NO NO NO NO
Lithuania NA NA NA NA NA NA NA NA NA NA NA NA NA
Luxembourg NA NA NA NA NA NA NA NA NA NA NA NA NA
Malta
Monaco
Netherlands
New Zealand
Norway 214 210 4.4 0.086 –0.028 0.058 0.033 –0.011 0.022 NO NO –0.067 -5.9
Poland NA NA NA NA NA NA NA NA NA NA NA NA NA
Portugal 597 597 NO 0.021 –0.037 –0.017 0.018 –0.023 –0.004 –0.006 IE 0.039 NO
Romania NA NA NA NA NA NA NA NA NA NA NA NA NA
Russian Federation NA NA NA NA NA NA NA NA NA NA NA NA NA
Slovakia NA NA NA NA NA NA NA NA NA NA NA NA NA
Slovenia NA NA NA NA NA NA NA NA NA NA NA NA NA
Spain NA NA NA NA NA NA NA NA NA NA NA NA NA
Sweden NA NA NA NA NA NA NA NA NA NA NA NA NA
Switzerland
Ukraine NA NA NA NA NA NA NA NA NA NA NA NA NA
United Kingdom of Great
Britain and Northern Ireland 14 236 14 111 124 0.007 –0.002 0.005 IE, NE IE, NE IE, NE NE NE 0.051 NE
Grazing land management - area and implied carbon stock change factors from the change in carbon stocks for 2014a
Area subject to the activity Implied carbon stock change factor (t C/ha)
d The value reported here is an emission or removal and not a carbon stock change.
a If grazing land management has been elected, report here information on anthropogenic carbon stock change for the inventory year for all geographic locations that encompass land subject to grazing land
management under Article 3.4.b
The signs for estimates of gains in carbon stocks are positive (+) and of losses in carbon stocks are negative (-). c Carbon stock gains and losses should be listed separately except in cases where, due to the methods used, it is technically impossible to separate information on gains and losses. In that case, net gains should be
reported in the "Gains" column and net losses should be reported in the "Losses" column. The notation key IE should be filled in, in the other column.
CSC in above-ground biomassb, c
CSC in below-ground biomassb, c
Net CSC in
litterb
Net CSC in
dead woodb
Net CSC in soilb
(kha)
60

Table 6.3(g)
TotalMineral
Soils
Organic
Soil
Gains Losses Net change Gains Losses Net change Mineral Organicd
Australia 564 613 564 613 IE 0.002 –0.002 0.000 IE IE IE IE IE IE, NA IE
Austria
Belarus
Belgium NA NA NA NA NA NA NA NA NA NA NA NA NA
Bulgaria NA NA NA NA NA NA NA NA NA NA NA NA NA
Croatia NA NA NA NA NA NA NA NA NA NA NA NA NA
Cyprus NE, NO NE NO NE NE NE NE NE NE NE NE NE NO
Czech Republic NA NA NA NA NA NA NA NA NA NA NA NA NA
Denmark (KP) 411 388 23 0.011 –0.055 –0.043 0.030 –0.046 –0.016 NO NO 0.00 -8.4
Estonia NA NA NA NA NA NA NA NA NA NA NA NA NA
European Union (KP)
Finland
France (KP) NO NO NO NO NO NO NO NO NO NO NO NO NO
Germany 6 936 5 841 1 095 0.023 –0.039 –0.015 0.019 –0.014 0.005 IE, NO IE, NO 0.11 -6.8
Greece NA NA NA NA NA NA NA NA NA NA NA NA NA
Hungary
Iceland NA
Ireland 3 865 3 860 345 0.000 0.000 0.000 IE, NO IE, NO IE, NO NO NO –0.001 -5.3
Italy 3.0 3.0 NO NO NO NO NO NO NO NO NO 0.31 NO
Japan 647 607 40 0.005 IE 0.005 0.020 IE 0.020 NA NA -0.39 -0.19
Kazakhstan
Latvia NA NA NA NA NA NA NA NA NA NA NA NA NA
Liechtenstein
Lithuania
Luxembourg NA NA NA NA NA NA NA NA NA NA NA NA NA
Malta
Monaco
Netherlands
New Zealand
Norway 230 225 4.5 NO NO NO NO NO NO NO NO 0.032 -6.1
Poland NA NA NA NA NA NA NA NA NA NA NA NA NA
Portugal 529 529 NO 0.025 –0.063 –0.039 0.044 –0.033 0.011 –0.064 IE -0.65 NO
Romania NA NA NA NA NA NA NA NA NA NA NA NA NA
Russian Federation NA NA NA NA NA NA NA NA NA NA NA NA NA
Slovakia NA NA NA NA NA NA NA NA NA NA NA NA NA
Slovenia NA NA NA NA NA NA NA NA NA NA NA NA NA
Spain NA NA NA NA NA NA NA NA NA NA NA NA NA
Sweden NA NA NA NA NA NA NA NA NA NA NA NA NA
Switzerland
Ukraine NA NA NA NA NA NA NA NA NA NA NA NA NA
United Kingdom of Great
Britain and Northern Ireland 14 371 14 246 124 0.005 –0.006 –0.001 NE,IE NE,IE NE,IE NE NE 0.000 NE
d The value reported here is an emission or removal and not a carbon stock change.
Grazing land management - area and implied carbon stock change factors from the change in carbon stocks for the base yeara
Area subject to the activity Implied carbon stock change factor (t C/ha)
CSC in above-ground biomassb, c
Net CSC in
litterb
Net CSC in
dead woodb
Net CSC in soilb
a If grazing land management has been elected, report here information on anthropogenic carbon stock change for the inventory year for all geographic locations that encompass land subject to grazing land
management under Article 3.4.
b The signs for estimates of gains in carbon stocks are positive (+) and of losses in carbon stocks are negative (-).
c Carbon stock gains and losses should be listed separately except in cases where, due to the methods used, it is technically impossible to separate information on gains and losses. In that case, net gains should be
reported in the "Gains" column and net losses should be reported in the "Losses" column. The notation key IE should be filled in, in the other column.
CSC in below-ground biomassb, c
(kha)
61
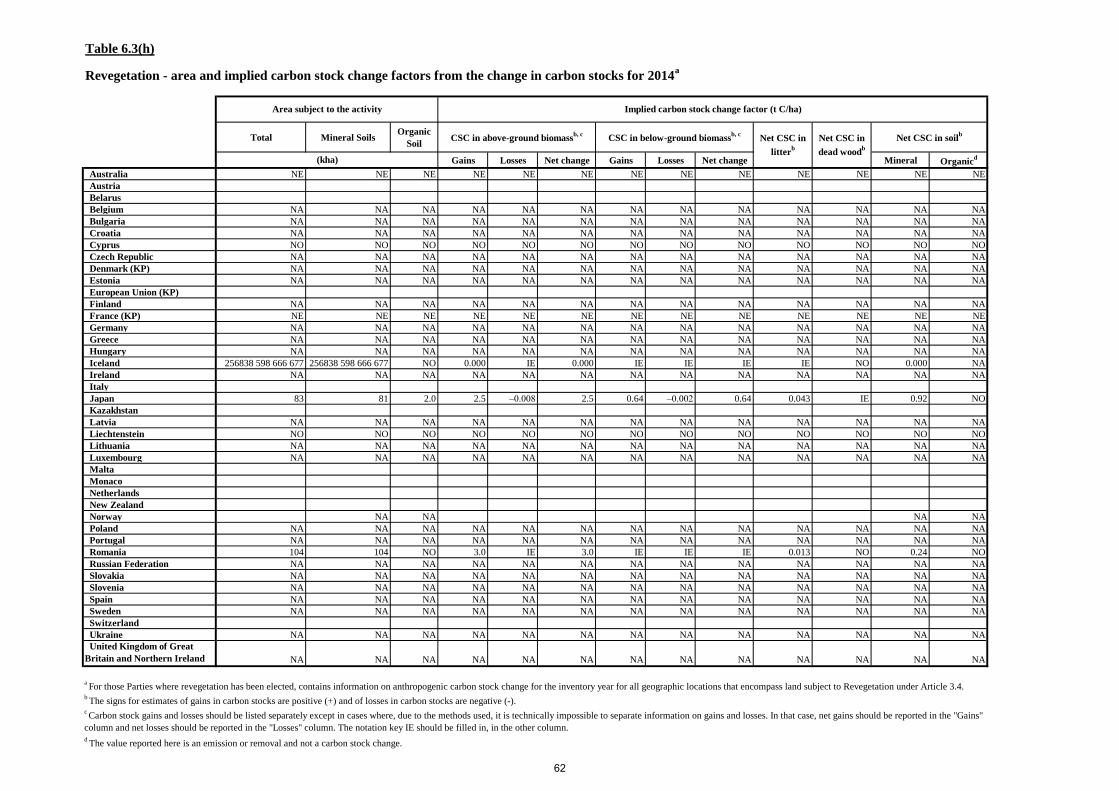
Table 6.3(h)
Total Mineral SoilsOrganic
Soil
Gains Losses Net change Gains Losses Net change Mineral Organicd
Australia NE NE NE NE NE NE NE NE NE NE NE NE NE
Austria
Belarus
Belgium NA NA NA NA NA NA NA NA NA NA NA NA NA
Bulgaria NA NA NA NA NA NA NA NA NA NA NA NA NA
Croatia NA NA NA NA NA NA NA NA NA NA NA NA NA
Cyprus NO NO NO NO NO NO NO NO NO NO NO NO NO
Czech Republic NA NA NA NA NA NA NA NA NA NA NA NA NA
Denmark (KP) NA NA NA NA NA NA NA NA NA NA NA NA NA
Estonia NA NA NA NA NA NA NA NA NA NA NA NA NA
European Union (KP)
Finland NA NA NA NA NA NA NA NA NA NA NA NA NA
France (KP) NE NE NE NE NE NE NE NE NE NE NE NE NE
Germany NA NA NA NA NA NA NA NA NA NA NA NA NA
Greece NA NA NA NA NA NA NA NA NA NA NA NA NA
Hungary NA NA NA NA NA NA NA NA NA NA NA NA NA
Iceland 256838 598 666 677 256838 598 666 677 NO 0.000 IE 0.000 IE IE IE IE NO 0.000 NA
Ireland NA NA NA NA NA NA NA NA NA NA NA NA NA
Italy
Japan 83 81 2.0 2.5 –0.008 2.5 0.64 –0.002 0.64 0.043 IE 0.92 NO
Kazakhstan
Latvia NA NA NA NA NA NA NA NA NA NA NA NA NA
Liechtenstein NO NO NO NO NO NO NO NO NO NO NO NO NO
Lithuania NA NA NA NA NA NA NA NA NA NA NA NA NA
Luxembourg NA NA NA NA NA NA NA NA NA NA NA NA NA
Malta
Monaco
Netherlands
New Zealand
Norway NA NA NA NA
Poland NA NA NA NA NA NA NA NA NA NA NA NA NA
Portugal NA NA NA NA NA NA NA NA NA NA NA NA NA
Romania 104 104 NO 3.0 IE 3.0 IE IE IE 0.013 NO 0.24 NO
Russian Federation NA NA NA NA NA NA NA NA NA NA NA NA NA
Slovakia NA NA NA NA NA NA NA NA NA NA NA NA NA
Slovenia NA NA NA NA NA NA NA NA NA NA NA NA NA
Spain NA NA NA NA NA NA NA NA NA NA NA NA NA
Sweden NA NA NA NA NA NA NA NA NA NA NA NA NA
Switzerland
Ukraine NA NA NA NA NA NA NA NA NA NA NA NA NA
United Kingdom of Great
Britain and Northern Ireland NA NA NA NA NA NA NA NA NA NA NA NA NA
d The value reported here is an emission or removal and not a carbon stock change.
b The signs for estimates of gains in carbon stocks are positive (+) and of losses in carbon stocks are negative (-).
(kha)
a For those Parties where revegetation has been elected, contains information on anthropogenic carbon stock change for the inventory year for all geographic locations that encompass land subject to Revegetation under Article 3.4.
c Carbon stock gains and losses should be listed separately except in cases where, due to the methods used, it is technically impossible to separate information on gains and losses. In that case, net gains should be reported in the "Gains"
column and net losses should be reported in the "Losses" column. The notation key IE should be filled in, in the other column.
Revegetation - area and implied carbon stock change factors from the change in carbon stocks for 2014a
Area subject to the activity Implied carbon stock change factor (t C/ha)
CSC in above-ground biomassb, c
CSC in below-ground biomassb, c
Net CSC in
litterb
Net CSC in
dead woodb
Net CSC in soilb
62

Table 6.3(i)
TotalMineral
Soils
Organic
Soil
Gains Losses Net change Gains Losses Net change Mineral Organicd
Australia NE NE NE NE NE NE NE NE NE NE NE NE NE
Austria
Belarus
Belgium NA NA NA NA NA NA NA NA NA NA NA NA NA
Bulgaria NA NA NA NA NA NA NA NA NA NA NA NA NA
Croatia NA NA NA NA NA NA NA NA NA NA NA NA NA
Cyprus NO NO NO NO NO NO NO NO NO NO NO NO NO
Czech Republic NA NA NA NA NA NA NA NA NA NA NA NA NA
Denmark (KP) NA NA NA NA NA NA NA NA NA NA NA NA NA
Estonia NA NA NA NA NA NA NA NA NA NA NA NA NA
European Union (KP)
Finland
France (KP) NO NO NO NO NO NO NO NO NO NO NO NO NO
Germany NA NA NA NA NA NA NA NA NA NA NA NA NA
Greece NA NA NA NA NA NA NA NA NA NA NA NA NA
Hungary
Iceland 167 167 NO 0.057 IE, NA 0.057 IE, NA IE, NA IE, NA IE, NA NA, NO 0.51 NA
Ireland NA NA NA NA NA NA NA NA NA NA NA NA NA
Italy
Japan 5.9 5.7 0.14 2.2 –0.023 2.2 0.58 –0.006 0.57 0.043 IE 0.88 NO
Kazakhstan
Latvia NA NA NA NA NA NA NA NA NA NA NA NA NA
Liechtenstein
Lithuania
Luxembourg NA NA NA NA NA NA NA NA NA NA NA NA NA
Malta
Monaco
Netherlands
New Zealand
Norway NA NA NA NA
Poland NA NA NA NA NA NA NA NA NA NA NA NA NA
Portugal NA NA NA NA NA NA NA NA NA NA NA NA NA
Romania 92 92 NO 3.0 IE 3.0 IE IE IE 0.073 NO 2.1 NO
Russian Federation NA NA NA NA NA NA NA NA NA NA NA NA NA
Slovakia NA NA NA NA NA NA NA NA NA NA NA NA NA
Slovenia NA NA NA NA NA NA NA NA NA NA NA NA NA
Spain NA NA NA NA NA NA NA NA NA NA NA NA NA
Sweden NA NA NA NA NA NA NA NA NA NA NA NA NA
Switzerland
Ukraine NA NA NA NA NA NA NA NA NA NA NA NA NA
United Kingdom of Great
Britain and Northern Ireland NA NA NA NA NA NA NA NA NA NA NA NA NA
d The value reported here is an emission or removal and not a carbon stock change.
(kha)
Revegetation - area and implied carbon stock change factors from the change in carbon stocks for the base yeara
Area subject to the activity Implied carbon stock change factor (t C/ha)
CSC in above-ground biomassb, c
CSC in below-ground biomassb, c
Net CSC in
litterb
Net CSC in
dead woodb
Net CSC in soilb
b The signs for estimates of gains in carbon stocks are positive (+) and of losses in carbon stocks are negative (-).
a For those Parties where revegetation has been elected, contains information on anthropogenic carbon stock change for the inventory year for all geographic locations that encompass land subject to Revegetation
under Article 3.4.
c Carbon stock gains and losses should be listed separately except in cases where, due to the methods used, it is technically impossible to separate information on gains and losses. In that case, net gains should be
reported in the "Gains" column and net losses should be reported in the "Losses" column. The notation key IE should be filled in, in the other column.
63

Table 6.3(j)
TotalMineral
Soils
Organic
Soil
Gains Losses Net change Gains Losses Net change Mineral Organicd
Australia NA NA NA NA NA NA NA NA NA NA NA NA NA
Austria
Belarus
Belgium NA NA NA NA NA NA NA NA NA NA NA NA NA
Bulgaria NA NA NA NA NA NA NA NA NA NA NA NA NA
Croatia NA NA NA NA NA NA NA NA NA NA NA NA NA
Cyprus NA NA NA NA NA NA NA NA NA NA NA NA NA
Czech Republic NA NA NA NA NA NA NA NA NA NA NA NA NA
Denmark (KP) NA NA NA NA NA NA NA NA NA NA NA NA NA
Estonia NA NA NA NA NA NA NA NA NA NA NA NA NA
European Union (KP)
Finland NA NA NA NA NA NA NA NA NA NA NA NA NA
France (KP) NE NE NE NE NE NE NE NE NE NE NE NO NE
Germany NA NA NA NA NA NA NA NA NA NA NA NA NA
Greece NA NA NA NA NA NA NA NA NA NA NA NA NA
Hungary NA NA NA NA NA NA NA NA NA NA NA NA NA
Iceland NA
Ireland NA NA NA NA NA NA NA NA NA NA NA NA
Italy
Japan NA NA NA NA NA NA NA NA NA NA NA NA NA
Kazakhstan
Latvia NA NA NA NA NA NA NA NA NA NA NA NA NA
Liechtenstein NO NO NO NO NO NO NO NO NO NO NO NO NO
Lithuania NA NA NA NA NA NA NA NA NA NA NA NA NA
Luxembourg NA NA NA NA NA NA NA NA NA NA NA NA NA
Malta
Monaco
Netherlands
New Zealand
Norway NA NA NA NA NA NA NA NA NA NA NA NA NA
Poland NA NA NA NA NA NA NA NA NA NA NA NA NA
Portugal NA NA NA NA
Romania NA NA NA NA NA NA NA NA NA NA NA NA NA
Russian Federation NA NA NA NA NA NA NA NA NA NA NA NA NA
Slovakia NA NA NA NA NA NA NA NA NA NA NA NA NA
Slovenia NA NA NA NA NA NA NA NA NA NA NA NA NA
Spain NA NA NA NA NA NA NA NA NA NA NA NA NA
Sweden NA NA NA NA NA NA NA NA NA NA NA NA NA
Switzerland
Ukraine NA NA NA NA NA NA NA NA NA NA NA NA NA
United Kingdom of Great
Britain and Northern Ireland NE NE NE NE NE NE NE NE NE NE NE NE NE
d The value reported here is an emission or removal and not a carbon stock change.
b The signs for estimates of gains in carbon stocks are positive (+) and of losses in carbon stocks are negative (-).
Wetland drainage and rewetting - area and implied carbon stock change factors from the change in carbon stocks for 2014a
Area subject to the activity Implied carbon stock change factor (t C/ha)
CSC in above-ground biomassb, c
CSC in below-ground biomassb, c
Net CSC in
litterb
Net CSC in
dead woodb
Net CSC in soilb
(kha)
a For those Parties where revegetation has been elected, contains information on anthropogenic carbon stock change for the inventory year for all geographic locations that encompass land subject to Revegetation
under Article 3.4.
c Carbon stock gains and losses should be listed separately except in cases where, due to the methods used, it is technically impossible to separate information on gains and losses. In that case, net gains should be
reported in the "Gains" column and net losses should be reported in the "Losses" column. The notation key IE should be filled in, in the other column.
64
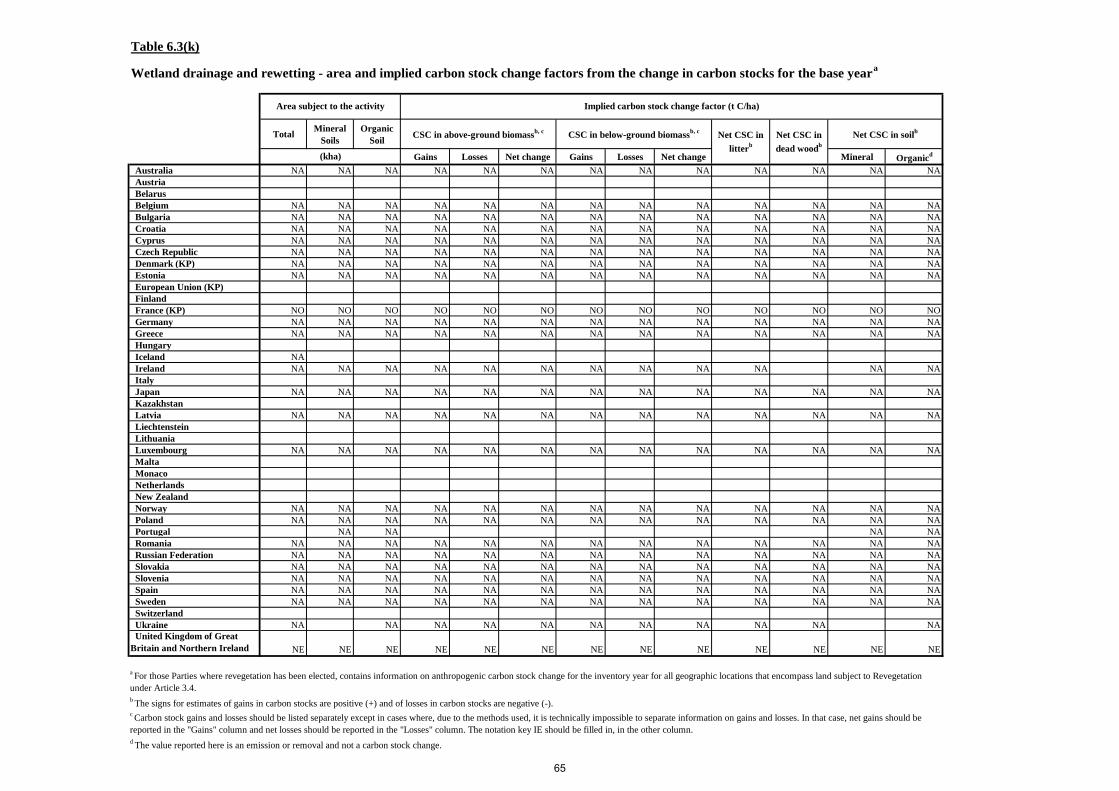
Table 6.3(k)
TotalMineral
Soils
Organic
Soil
Gains Losses Net change Gains Losses Net change Mineral Organicd
Australia NA NA NA NA NA NA NA NA NA NA NA NA NA
Austria
Belarus
Belgium NA NA NA NA NA NA NA NA NA NA NA NA NA
Bulgaria NA NA NA NA NA NA NA NA NA NA NA NA NA
Croatia NA NA NA NA NA NA NA NA NA NA NA NA NA
Cyprus NA NA NA NA NA NA NA NA NA NA NA NA NA
Czech Republic NA NA NA NA NA NA NA NA NA NA NA NA NA
Denmark (KP) NA NA NA NA NA NA NA NA NA NA NA NA NA
Estonia NA NA NA NA NA NA NA NA NA NA NA NA NA
European Union (KP)
Finland
France (KP) NO NO NO NO NO NO NO NO NO NO NO NO NO
Germany NA NA NA NA NA NA NA NA NA NA NA NA NA
Greece NA NA NA NA NA NA NA NA NA NA NA NA NA
Hungary
Iceland NA
Ireland NA NA NA NA NA NA NA NA NA NA NA NA
Italy
Japan NA NA NA NA NA NA NA NA NA NA NA NA NA
Kazakhstan
Latvia NA NA NA NA NA NA NA NA NA NA NA NA NA
Liechtenstein
Lithuania
Luxembourg NA NA NA NA NA NA NA NA NA NA NA NA NA
Malta
Monaco
Netherlands
New Zealand
Norway NA NA NA NA NA NA NA NA NA NA NA NA NA
Poland NA NA NA NA NA NA NA NA NA NA NA NA NA
Portugal NA NA NA NA
Romania NA NA NA NA NA NA NA NA NA NA NA NA NA
Russian Federation NA NA NA NA NA NA NA NA NA NA NA NA NA
Slovakia NA NA NA NA NA NA NA NA NA NA NA NA NA
Slovenia NA NA NA NA NA NA NA NA NA NA NA NA NA
Spain NA NA NA NA NA NA NA NA NA NA NA NA NA
Sweden NA NA NA NA NA NA NA NA NA NA NA NA NA
Switzerland
Ukraine NA NA NA NA NA NA NA NA NA NA NA
United Kingdom of Great
Britain and Northern Ireland NE NE NE NE NE NE NE NE NE NE NE NE NE
d The value reported here is an emission or removal and not a carbon stock change.
b The signs for estimates of gains in carbon stocks are positive (+) and of losses in carbon stocks are negative (-).
Wetland drainage and rewetting - area and implied carbon stock change factors from the change in carbon stocks for the base yeara
Area subject to the activity Implied carbon stock change factor (t C/ha)
CSC in above-ground biomassb, c
CSC in below-ground biomassb, c
Net CSC in
litterb
Net CSC in
dead woodb
Net CSC in soilb
(kha)
a For those Parties where revegetation has been elected, contains information on anthropogenic carbon stock change for the inventory year for all geographic locations that encompass land subject to Revegetation
under Article 3.4.
c Carbon stock gains and losses should be listed separately except in cases where, due to the methods used, it is technically impossible to separate information on gains and losses. In that case, net gains should be
reported in the "Gains" column and net losses should be reported in the "Losses" column. The notation key IE should be filled in, in the other column.
65

Table 6.4
Afforestation and
ReforestationDeforestation
c Forest management RevegetationWetland drainage
and rewettingd
N2O-N per unit of
fertilizer
N2O-N per unit of
fertilizer
N2O-N per unit of
fertilizer
N2O-N per unit of
fertilizer
N2O-N per unit of
fertilizer
kg N2O-N/kg N kg N2O-N/kg N kg N2O-N/kg N kg N2O-N/kg N kg N2O-N/kg N
Australia IE IE IE NE NA
Austria
Belarus
Belgium NO IE NO NA NA
Bulgaria NO NO NO NA
Croatia NO NO NO NA NA
Cyprus NE NE NE NO NE
Czech Republic NO NO NO NA NA
Denmark (KP) IE NO IE NA NA
Estonia NO NO NO NA NA
European Union (KP)
Finland NA IE 0.010 NA NA
France (KP) NO NO NE NE NE
Germany NO NO NO NA NA
Greece NA NA NA NA NA
Hungary IE IE IE NA NA
Iceland 0.011
Ireland IE IE IE NA NA
Italy NO NO NO
Japan IE IE 0.97 IE NA
Kazakhstan
Latvia NO IE NO NA NO
Liechtenstein NO NO NO NO NO
Lithuania NO NO NO NA NA
Luxembourg NO NO NO NA NA
Malta
Monaco
Netherlands NO IE NO
New Zealand IE IE IE
Norway 0.000 IE 0.000 NA NA
Poland NO NO NO NA NA
Portugal IE IE IE NA NA
Romania IE IE IE IE IE
Russian Federation NO NO NO NA NA
Slovakia NO NO NO NA NA
Slovenia NA NA NA NA NA
Spain NO NO NO NA NA
Sweden NO NO 0.000 NA NA
Switzerland NO NA NO NA NA
Ukraine NA NA NA NA NA
United Kingdom of Great
Britain and Northern Ireland 0.006 NO NO NA NE
d Only N2O emissions which have not been reported under agriculture should be included here.
Direct and indirect N2O emissions from N fertilization for 2014a, b
a N2O emissions from fertilization for cropland management, grazing land management and revegetation as well as from fertilization of areas categorized
as cropland or grassland underdeforestation should be reported in the agriculture sector. If a Party is not able to separate fertilizer applied to forest land
from agriculture, it may report all N2O emissions from fertilization in the agriculture sector. In this case, reporting of N2O emissions from fertilization
should not be included under afforestation/reforestation, deforestation or forest management, revegetation or wetland drainage and rewetting, as
appropriate, to avoid double counting.
b Direct and indirect N2O emissions from fertilization are estimated following section 11.2 of the 2006 IPCC guidelines based on the amount of fertilizer
applied to land under forest management. The indirect N2O emissions from afforestation and reforestation and land under forest management are estimated
as part of the total indirect emissions in the agriculture sector based on the total amount of fertilizer used in the country. Parties should show that double
counting of N2O emissions from fertilization with agriculture sector estimates has been avoided.
c Only for areas that have been subsequently reforested.
66

Table 6.5
CH4 and N2O emissions from drained and rewetted organic soils for 2014a, b, c
N2O-N CH4 N2O-N CH4 N2O-N CH4 N2O-N CH4 N2O-N CH4 N2O-N CH4 N2O-N CH4
khakg N2O-
N/hakg CH4/ha kha
kg N2O-
N/hakg CH4/ha kha
kg N2O-
N/hakg CH4/ha kha kg N2O-N/ha kg CH4/ha kha
kg N2O-
N/hakg CH4/ha kha
kg N2O-
N/hakg CH4/ha kha
kg N2O-
N/hakg CH4/ha
Australia NA NA NA NA NA NA NA NA NA NA NA NA NA NE NE NE NA NA NA
Austria
Belarus
Belgium NO NO NO NO NO NO NO NO NO NA NA NA NA NA NA NA NA NA NA
Bulgaria NO NO NO NO NO NO NO NO NO NA NA NA NA NA NA NA NA NA NA
Croatia NO NO NO NA NA NA NA NA NA NA NA NA NA NA NA NA NA NA NA
Cyprus NO NO NO NO NO NO NO NO NE, NO NE, NO NO NO NO NO NO NO
Czech Republic NO NO NO NO NO NO NO NO NO NA NA NA NA NA NA NA NA NA NA
Denmark (KP) 9.4 1.4 4.0 0.16 14 12 19 1.9 58 90 41 24 41 NA NA NA NA NA NA
Estonia NA NA NA NA NA NA NA NA NA NA NA NA NA NA NA NA NA NA NA
European Union (KP)
Finland 64 0.79 3.3 35 1.5 19 4 293 0.54 7.8 NA NA NA NA NA NA NA NA NA NA
France (KP) NE, NO NE, NO NE, NO NE, NO NE, NO NE, NO NE, NO NE, NO NE, NO NE NE NE NE NE NE NE NE NE NE
Germany 44 1.4 4.6 20 1.6 18 101 1.4 4.6 408 24 997 20 NA NA NA NA NA NA
Greece NO NA NA NO NA NA NO NA NA NA NA NA NA NA NA NA NA NA NA
Hungary NO NO NO NO NO NO NO NO NO NA NA NA NA NA NA NA NA NA NA
Iceland 3.1 4.7 5.0 NO 0.49 3.2 7.4 NA NA NA
Ireland 151 1.2 6.3 6.8 2.0 35 243 0.74 7.3 NO NO 369 42 NA NA NA NA NA NA
Italy NO NO NO NO NO NO NO NO NO NO NO NO NO
Japan NO NO NO NO NO NO NO NO NO 24 58 40 2.2 NO NO NO NA NA NA
Kazakhstan
Latvia 0.80 2.8 64 14 4.9 104 498 2.7 13 NA NA NA NA NA NA NA NA NA NA
Liechtenstein NO NO NO NO NO NO NO NO NO NO NO NO NO NO NO NO NO NO NO
Lithuania 3.2 1.8 8.0 NO NO NO 170 1.8 7.9 NA NA NA NA NA NA NA NA NA NA
Luxembourg NO NO NO NO NO NO NO NO NO NA NA NA NA NA NA NA NA NA NA
Malta
Monaco
Netherlands NE NE NE NE NE NE NE NE NE
New Zealand NE NE NE NE NE NE NE NE NE NE NE NE NE NE NE NE NE NE NE
Norway 6.1 3.2 7.4 10 IE, NE 58 241 2.6 8.4 60 58 3.1 73 NA NA NA NA NA NA
Poland NO NO NO NO NO NO NO NO NO NA NA NA NA NA NA NA NA NA NA
Portugal NO NO NO NO NO NO NO NO NO NO NO NO NO NA NA NA NA NA NA
Romania NO NO NO NO NO NO NO NO NO NO NO NO NO NO NO NO NA NA NA
Russian Federation NO NO NO NO NO NO 1 950 1.7 9.8 NA NA NA NA NA NA NA NA NA NA
Slovakia NO NO NO NO NO NO NO NO NO NA NA NA NA NA NA NA NA NA NA
Slovenia NO NA NA NO NA NA NO NA NA NA NA NA NA NA NA NA NA NA NA
Spain NO NO NO NO NO NO NO NO NO NO NO NA NA NA NA NA NA NA NA
Sweden 27 2.2 8.9 9.3 0.55 2.5 1 091 2.1 9.1 NA NA NA NA NA NA
Switzerland NO NO NO NO NO NO 3.9 2.8 NO NA NA NA NA NA NA NA NA NA NA
Ukraine NO NO NO NA NA NA 193 0.60 NA, NO NA NA NA NA NA NA NA NA NA NA
United Kingdom of Great
Britain and Northern Ireland 51 0.20 NE, NO NO NO NO 202 0.20 NE, NO NE NE NE NE NA NA NA NE NE NE
Area of
organic soils
Area of
organic soils
Area of
organic soils
Implied Emission Factor
a Methodologies for CH4 and N2O emissions from drained and rewetted soils are given in the "Wetlands Supplement" for all land-use categories.
Implied Emission
FactorImplied Emission Factor
Area of
organic soils
Implied Emission FactorArea of
organic soils
c For activities other than wetland drainage and rewetting, a Party may choose to include CH4 emissions from drained, rewetted and other organic soils. A Party should provide detailed information on methodologies, emissions and removals from these subdivisions in the NIR, ensuring consistency in reporting among categories.
Area of
organic soils
Implied Emission Factor
Grazing Land Management Revegetation Wetland drainage and rewetting
Implied Emission Factor Implied Emission FactorArea of
organic soils
Afforestation and Reforestation Deforestation Forest Management Cropland Management
b N2O emissions from drained cropland and grazing land soils are covered in the agriculture sector under cultivation of histosols.
67

Table 6.6
N2O emissions from N mineralization/immobilization due to carbon loss/gain associated with land-use conversions and management change in mineral soils for 2014a
IEF IEF IEF IEF IEF IEF
N2O-Nd
N2O-Nd
N2O-Nd
N2O-Nd
N2O-Nd
N2O-Nd
kha kt C kg N2O-N/ha kha kt Ckg N2O-
N/hakha kt C
kg N2O-
N/hakha kt C
kg N2O-
N/hakha kt C
kg N2O-
N/hakha kt C
kg N2O-
N/ha
Australia 3 190 -863 0.031 8 603 -2 443 0.032 10 976 194 0.006 7 264 -155 0.002 561 469 -8 745 0.003 NE NE NE
Austria 4.4 -2.9 0.44
Belarus
Belgium 17 18 0.004 27 -54 1.7 NO NO NO NA NA NA NA NA NA NA NA NA
Bulgaria NO NO NO NO NO NO NO NO NO NA NA NA NA NA NA NA NA NA
Croatia 51 37 NO 4.4 -13 2.4 NO NO NO NA NA NA NA NA NA NA NA NA
Cyprus NE NE NE NE NE NE NE NE NE NE NE NE NE NE NE NE NE NE
Czech Republic NO NO NO 2.9 -1.0 0.24 NO NO NO NA NA NA NA NA NA NA NA NA
Denmark (KP) NO NO NO 3.0 -0.31 0.063 502 NO NO 2 474 -2.8 0.002 327 -3.9 0.01 NA NA NA
Estonia NA NA NA NA NA NA NA NA NA NA NA NA NA NA NA NA NA NA
European Union (KP)
Finland 104 11 0.028 224 107 0.26 NA NA NA NA NA NA NA NA NA NA NA NA
France (KP) 111 NA 1.5 NO NO NE NE NE NE NE NE NE
Germany 476 -129 0.40 259 40 0.049 10 534 4 319 NO 933 -758 0.79 5 353 468 NO NA NA NA
Greece NO NA NA 0.015 –0.009 0.39 NO NA NA NA NA NA NA NA NA NA NA NA
Hungary 173 NE NO 1.9 IE 0.69 1 768 NE NO NA NA NA NA NA NA NA NA NA
Iceland NE NE NE NE NE NA NA
Ireland 137 NO NO 3.4 -3.7 72 181 NO NO IE IE IE IE IE IE NA NA NA
Italy NO NO NO 3.7 305 55 NO NO NO NO 18 NO NO NO NO
Japan NA NA NA 7.3 -38 5.7 16 042 -194 0.013 35 NA 0.63 567 NA 0.019 NA NA NA
Kazakhstan
Latvia NO NO NO 37 -28 0.62 NO NO NO NA NA NA NA NA NA NA NA NA
Liechtenstein NO NO NO 0.17 0.78 NO NO NO NO NO NO NO NO NO NO NO NO
Lithuania 35 -22 0.42 1.7 -25 9.9 NO NO NO NA NA NA NA NA NA NA NA NA
Luxembourg NO NO NO 0.93 -0.92 0.83 NO NO NO NA NA NA NA NA NA NA NA NA
Malta
Monaco
Netherlands 64 -0.20 0.18 69 -0.24 0.18 327 NO NO
New Zealand 644 270 0.28 182 2.8 0.010 9 219 2.5 0
Norway 27 0.95 94 0.31 11 345 31 NO 22 0.074 209 0.048 NA NA NA
Poland 721 NE NE 0.78 IE 2.5 8 661 NE NE NA NA NA NA NA NA NA NA NA
Portugal 19 -39 1.4 113 -419 2.5 20 -41 1.4 98 -273 1.9 55 -140 1.7 NA NA NA
Romania 6.1 0.12 1.0 83 13 8.4 NO NO NO NA NA NA NA NA NA NO NO NO
Russian Federation NO NO NO NO NO NO NO NO NO NA NA NA NA NA NA NA NA NA
Slovakia NO NO NO NO NO NO NO NO NO NA NA NA NA NA NA NA NA NA
Slovenia NO NA NA 2.6 -3.0 0.94 NO NO NA NA NA NA NA NA NA NA NA NA
Spain 3.3 -2.6 0.63 84 -40 0.39 249 -33 0.11 482 -347 0.59 NA NA NA NA NA NA
Sweden 309 -46 0.10 272 -217 0.80 24 626 3 415 NO NA NA NA NA NA NA NA NA NA
Switzerland 1.3 0.15 0.078 6.1 6.6 0.72 NO NO NO NA NA NA NA NA NA NA NA NA
Ukraine 327 18 0.006 50 -0.45 0.005 NA NA NA NA NA NA NA NA NA NA NA NA
United Kingdom of Great
Britain and Northern Ireland 103 IE 0.081 54 IE, NO 0.68 491 IE, NO 0.081 6 890 IE, NE 0.20 287 IE, NE 2.1 NA NA NA
Forest Management Cropland Management
Carbon
Stock
Change
Land areab
Carbon
Stock
Change
Carbon
Stock
Change
b Land areas should include lands converted and/or lands where a management change has taken place and resulted in carbon loss. Gains could be reported, under tier 3 approaches, if sufficient scientific justification is provided.
c N2O emissions associated with deforestation followed by the establishment of cropland should be reported under deforestation even if cropland management is not elected under Article 3.4.
d In the calculation of the implied emission factor, N2O emissions are converted to N2O-N by multiplying by 28/44.
Grazing land Management Revegetation
Carbon
Stock
Change
Carbon
Stock
Change
Afforestation and Reforestation Deforestationc
Land areab
a N2O emissions from nitrogen mineralization/immobilization associated with loss/gain of soil organic matter resulting from change of land use or management of mineral soils under afforestation/reforestation, deforestation, forest management, cropland management, grazing land management
and revegetation should be reported here when these emissions/removals are not reported under the agriculture sector.
Land areab
Land areab
Land areab
Land areab
Carbon
Stock
Change
68

Table 6.7(a)
Activity data Activity data Activity data Activity data
CO2 CH4 N2O CO2 CH4 N2O CO2 CH4 N2O CO2 CH4 N2O
Australia 2.1 0.011 0.000 IE, NO 0.016 0.000 0.12 0.016 0.000 0.95 0.14 0.002
Austria IE 0.093 0.005
Belarus
Belgium NO NO NO NO NO NO NO NO NO NO NO NO
Bulgaria 0.002 0.000 0.000 NO NO NO 0.002 0.000 0.000 0.002 0.000 0.000
Croatia NA NA NA NO NO NO NA, NO NA, NO NA, NO IE, NO NA NA
Cyprus NE NE NE NE NE NE NE NE NE IE, NO IE, NO IE, NO
Czech Republic NO NO NO NO NO NO NO NO NO 0.002 0.000 0.000
Denmark (KP) IE, NO IE, NO IE, NO NO NO NO IE, NO IE, NO IE, NO IE, NO 174 9.6
Estonia IE, NA 0.061 0.001 NO NO NO IE, NA, NO 0.061 0.001 IE, NO 0.029 0.000
European Union (KP)
Finland NA NA NA NA NA NA NA NA NA 7.3 0.045 0.000
France (KP) NA NA NA IE, NO NA NA IE, NA, NO NA NA NA NA NA
Germany IE, NO IE, NO IE, NO NO NO NO IE, NO IE, NO IE, NO IE, NO 0.22 0.012
Greece 6.9 0.088 0.001 NA NA NA 6.9 0.088 0.001 19 0.24 0.002
Hungary IE 0.000 0.000 IE, NO 0.000 0.000 IE, NO 0.000 0.000 IE 0.000 0.000
Iceland NA NA NA
Ireland NA NA NA NO NO NO NA, NO NA, NO NA, NO 261 1.1 0.007
Italy IE, NO 0.73 0.023 NO NO NO IE, NO 0.73 0.023 IE, NO 0.73 0.023
Japan IE, NO 0.000 0.000 NO NO NO IE, NO 0.000 0.000 IE, NO 0.000 0.000
Kazakhstan
Latvia NO NO NO NO NO NO NO NO NO NA NA NA
Liechtenstein NO NO NO NO NO NO NO NO NO NO NO NO
Lithuania 11 0.049 0.003 NO NO NO 11.1 0.049 0.003 35 2.4 0.013
Luxembourg NO NO NO NO NO NO NO NO NO NO NO NO
Malta
Monaco
Netherlands 95 0.29 0.016 7.3 0.010 0.001 54 0.15 0.009 95 0.29 0.016
New Zealand IE 0.000 0.000 IE 0.001 0.000 IE 0.000 0.000 IE 1.4 0.010
Norway IE, NO 0.043 0.000 NO NO NO IE, NO 0.043 0.000 IE 0.043 0.000
Poland 16 0.18 0.003 NO NO NO 16 0.18 0.003 18 0.56 0.004
Portugal 27 0.10 0.001 NO 0.11 0.053 8.6 0.10 0.036 25.45 0.09 0.001
Romania 48 0.21 0.006 NO NO NO 48 0.21 0.006 48 0.21 0.006
Russian Federation IE, NO 0.000 0.000 NO NO NO IE, NO 0.000 0.000 28 0.14 0.008
Slovakia IE, NO NA NA NO NO NO IE, NO NA, NO NA, NO IE NA NA
Slovenia NA NA NA NA NA NA NA NA NA 69 0.77 0.008
Spain 4.48 0.016 0.001 13 0.023 0.002 5.4 0.017 0.001 1.9 0.020 0.001
Sweden NO NO NO NO NO NO NO NO NO IE 0.077 0.001
Switzerland NO NO NO NO NO NO IE, NO 0.50 0.028
Ukraine 0.002 0.000 0.000 NA, NO NA, NO NA, NO 0.002 0.000 0.000 0.002 0.000 0.000
United Kingdom of Great
Britain and Northern Ireland 0.001 0.000 0.000 0.002 0.000 0.000 0.002 0.000 0.000 0.001 0.000 0.000
Description
of unit areab:
ab or bbc
Total article 3.3
Implied Emission Factor
(t/activity data unit)
c Area burned (ab) and biomass burned (bb).
a Total for controlled burning and wildfires.
(t/activity data unit) (t/activity data unit)
Description
of unit areab:
ab or bbc
Description
of unit areab:
ab or bbc
b For each activity, activity data could area burned or fuel burned. Units will be ha for area burned, and kg dm for fuel burned. The implied emission factor will refer to the selected activity data with an automatic change in the units.
Description
of unit areab:
ab or bbc
Forest management
Implied Emission Factor
(t/activity data unit)
Emissions from biomass burning 2014a
Implied Emission Factor
Afforestation/reforestation Deforestation
Implied Emission Factor
69

Table 6.7(b)
Activity data Activity data
CO2 CH4 N2O CO2 CH4 N2O
Australia IE IE IE IE 0.017 0.000
Austria
Belarus
Belgium NA NA NA NA NA NA
Bulgaria NA NA NA NA NA NA
Croatia NA NA NA NA NA NA
Cyprus NE NE NE NE NE NE
Czech Republic NA NA NA NA NA NA
Denmark (KP) NO NO NO NO NO NO
Estonia NA NA NA NA NA NA
European Union (KP)
Finland NA NA NA
France (KP) NO NO NO NE NE NE
Germany NO NO NO NO NO NO
Greece NA NA NA NA NA NA
Hungary NA NA NA
Iceland
Ireland NO 0.011 0.000 NO 0.011 0.000
Italy 4.3 0.024 0.001 4.9 0.027 0.001
Japan IE, NO 0.000 0.000 IE, NO 0.000 0.000
Kazakhstan
Latvia NA NA NA NA NA NA
Liechtenstein NO NO NO
Lithuania NA NA NA
Luxembourg NA NA NA NA NA NA
Malta
Monaco
Netherlands
New Zealand NA NA NA
Norway NO NO NO NO NO NO
Poland NA NA NA NA NA NA
Portugal NO 0.034 0.000 NO 0.056 0.005
Romania NA NA NA NA NA NA
Russian Federation NA NA NA NA NA NA
Slovakia NA NA NA NA NA NA
Slovenia NA NA NA NA NA NA
Spain IE, NE IE, NE IE, NE IE, NE IE, NE IE, NE
Sweden NA NA NA NA NA NA
Switzerland
Ukraine NA NA NA NA NA NA
United Kingdom of Great
Britain and Northern Ireland NE, NO 0.011 0.000 NE, NO 0.011 0.000
c Area burned (ab) and biomass burned (bb).
(t/activity data unit)
Emissions from biomass burning on cropland management landa
Implied Emission Factor
Base year
a Total for controlled burning and wildfires.
b For each activity, activity data should be selected between area burned or fuel burned. Units will be ha for area burned, and kg dm for fuel burned. The implied emission
factor will refer to the selected activity data with an automatic change in the units.
2014
Implied Emission Factor
(t/activity data unit)
Description of
unit areab:
ab or bbc
Description of
unit areab:
ab or bbc
70

Table 6.7(c)
Emissions from biomass burning on grazing land management landa
Activity data Activity data
CO2 CH4 N2O CO2 CH4 N2O
Australia 0.004 0.007 0.000 –0.028 0.005 0.000
Austria
Belarus
Belgium NA NA NA NA NA NA
Bulgaria NA NA NA NA NA NA
Croatia NA NA NA NA NA NA
Cyprus NE NE NE NE NE NE
Czech Republic NA NA NA NA NA NA
Denmark (KP) IE 1.7 0.15 IE 1.9 0.17
Estonia NA NA NA NA NA NA
European Union (KP)
Finland NA NA NA
France (KP) NO NO NO NE NE NE
Germany NO NO NO NO NO NO
Greece NA NA NA NA NA NA
Hungary NA NA NA
Iceland
Ireland 40 0.99 0.000 40 0.99 0.000
Italy NO NO NO NO NO NO
Japan NO NO NO NO NO NO
Kazakhstan
Latvia NA NA NA NA NA NA
Liechtenstein NO NO NO
Lithuania NA NA NA
Luxembourg NA NA NA NA NA NA
Malta
Monaco
Netherlands
New Zealand NA NA NA
Norway IE, NO NE, NO NE, NO IE, NO NE, NO NE, NO
Poland NA NA NA NA NA NA
Portugal NO 0.006 0.000 NO 0.014 0.004
Romania NA NA NA NA NA NA
Russian Federation NA NA NA NA NA NA
Slovakia NA NA NA NA NA NA
Slovenia NA NA NA NA NA NA
Spain NA NA NA NA NA NA
Sweden NA NA NA NA NA NA
Switzerland
Ukraine NA NA NA NA NA NA
United Kingdom of Great
Britain and Northern Ireland NE, NO 0.024 0.002 NE, NO 0.023 0.002
b For each activity, activity data should be selected between area burned or fuel burned. Units will be ha for area burned, and kg dm for fuel burned. The implied emission
factor will refer to the selected activity data with an automatic change in the units.
a Total for controlled burning and wildfires. Greenhouse gas emissions from prescribed savanna burning are reported in the agriculture sector.
c Area burned (ab) and biomass burned (bb).
(t/activity data unit)
Implied Emission Factor
Base year 2014
Implied Emission Factor
(t/activity data unit)
Description of
unit areab:
ab or bbc
Description of
unit areab:
ab or bbc
71
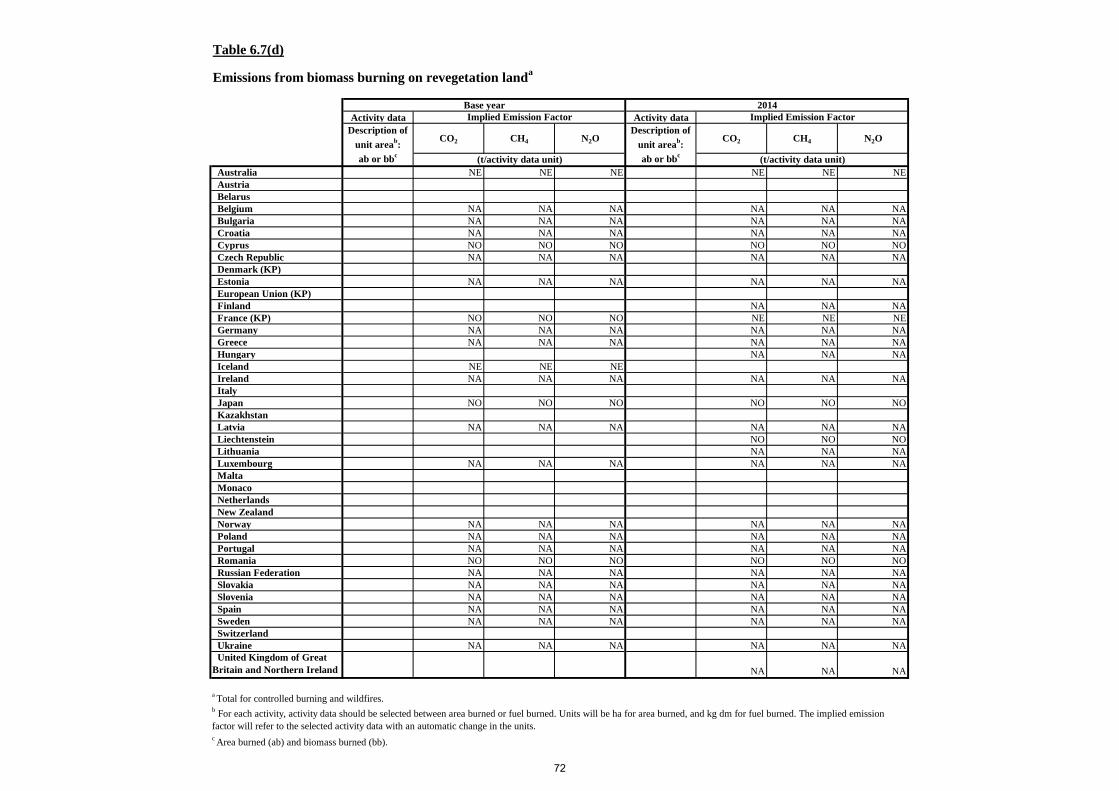
Table 6.7(d)
Activity data Activity data
CO2 CH4 N2O CO2 CH4 N2O
Australia NE NE NE NE NE NE
Austria
Belarus
Belgium NA NA NA NA NA NA
Bulgaria NA NA NA NA NA NA
Croatia NA NA NA NA NA NA
Cyprus NO NO NO NO NO NO
Czech Republic NA NA NA NA NA NA
Denmark (KP)
Estonia NA NA NA NA NA NA
European Union (KP)
Finland NA NA NA
France (KP) NO NO NO NE NE NE
Germany NA NA NA NA NA NA
Greece NA NA NA NA NA NA
Hungary NA NA NA
Iceland NE NE NE
Ireland NA NA NA NA NA NA
Italy
Japan NO NO NO NO NO NO
Kazakhstan
Latvia NA NA NA NA NA NA
Liechtenstein NO NO NO
Lithuania NA NA NA
Luxembourg NA NA NA NA NA NA
Malta
Monaco
Netherlands
New Zealand
Norway NA NA NA NA NA NA
Poland NA NA NA NA NA NA
Portugal NA NA NA NA NA NA
Romania NO NO NO NO NO NO
Russian Federation NA NA NA NA NA NA
Slovakia NA NA NA NA NA NA
Slovenia NA NA NA NA NA NA
Spain NA NA NA NA NA NA
Sweden NA NA NA NA NA NA
Switzerland
Ukraine NA NA NA NA NA NA
United Kingdom of Great
Britain and Northern Ireland NA NA NA
a Total for controlled burning and wildfires.
b For each activity, activity data should be selected between area burned or fuel burned. Units will be ha for area burned, and kg dm for fuel burned. The implied emission
factor will refer to the selected activity data with an automatic change in the units.c Area burned (ab) and biomass burned (bb).
(t/activity data unit)
Emissions from biomass burning on revegetation landa
Implied Emission Factor
Base year 2014
Description of
unit areab:
ab or bbc
Implied Emission Factor
Description of
unit areab:
ab or bbc
(t/activity data unit)
72

Table 6.7(e)
Activity data Activity data
CO2 CH4 N2O CO2 CH4 N2O
Australia NA NA NA NA NA NA
Austria
Belarus
Belgium NA NA NA NA NA NA
Bulgaria NA NA NA NA NA NA
Croatia NA NA NA NA NA NA
Cyprus NA, NO NA, NO NA, NO NA, NO NA, NO NA, NO
Czech Republic NA NA NA NA NA NA
Denmark (KP)
Estonia NA NA NA NA NA NA
European Union (KP)
Finland NA NA NA
France (KP) NO NO NO NE NE NE
Germany NA NA NA NA NA NA
Greece NA NA NA NA NA NA
Hungary NA NA NA
Iceland
Ireland NA NA NA NA NA NA
Italy
Japan NA NA NA NA NA NA
Kazakhstan
Latvia NA NA NA NA NA NA
Liechtenstein NO NO NO
Lithuania NA NA NA
Luxembourg NA NA NA NA NA NA
Malta
Monaco
Netherlands
New Zealand
Norway NA NA NA NA NA NA
Poland NA NA NA NA NA NA
Portugal NA NA NA NA NA NA
Romania NO NO NO NO NO NO
Russian Federation NA NA NA NA NA NA
Slovakia NA NA NA NA NA NA
Slovenia NA NA NA NA NA NA
Spain NA NA NA NA NA NA
Sweden NA NA NA NA NA NA
Switzerland
Ukraine NA NA NA NA NA NA
United Kingdom of Great
Britain and Northern Ireland NE NE NE
Emissions from biomass burning on wetland drainage and rewetting landa
Implied Emission Factor
(t/activity data unit)
Base year 2014
Implied Emission Factor
(t/activity data unit)
a Total for controlled burning and wildfires.
c Area burned (ab) and biomass burned (bb).
Description of
unit areab:
ab or bbc
Description of
unit areab:
ab or bbc
b For each activity, activity data should be selected between area burned or fuel burned. Units will be ha for area burned, and kg dm for fuel burned. The implied emission
factor will refer to the selected activity data with an automatic change in the units.
73