fcmb group plc annual report and …fcmb group plc fcmb group plc annual report and accounts fcmb...
TRANSCRIPT
FCMB GROUP PLC
FCMB GROUP PLC ANNUAL REPORT AND ACCOUNTS
FCMB Group Plc,First City Plaza, 44 Marina, Lagos, Nigeria.
www.fcmbgroupplc.com
ANNUAL REPORTAND ACCOUNTS 2017
FCMB GROUP PLC
FCMB GROUP PLC ANNUAL REPORT AND ACCOUNTS
FCMB Group Plc,First City Plaza, 44 Marina, Lagos, Nigeria.
www.fcmbgroupplc.com
FCMB GROUP PLC
FCMB GROUP PLC ANNUAL REPORT AND ACCOUNTS
FCMB Group Plc,First City Plaza, 44 Marina, Lagos, Nigeria.
www.fcmbgroupplc.com

OUR VISIONTo be the premier financial services group of African origin.
OUR MISSIONTo attain the highest levels of customer advocacy, be a great place to work, and deliver superior and sustainable returns to our shareholders.
OUR CORE VALUES
Professionalism
Sustainability
Customer focus
Excellence
FCMB GROUP PLC

ANNUAL REPORT 2017
FCMB Group Plc Annual Report and Accounts 20162
At FCMB, we place great value on being a responsible institution.By creating a great place to work for our people, selling our products and services responsibly, effecting positive social outcomes and mitigating the environmental impact of our operations, we believe that we can make a greater positive contribution to our operating environment.
1 Introduction 2 Operating Review 3 Corporate
Governance
4 Financial Statements
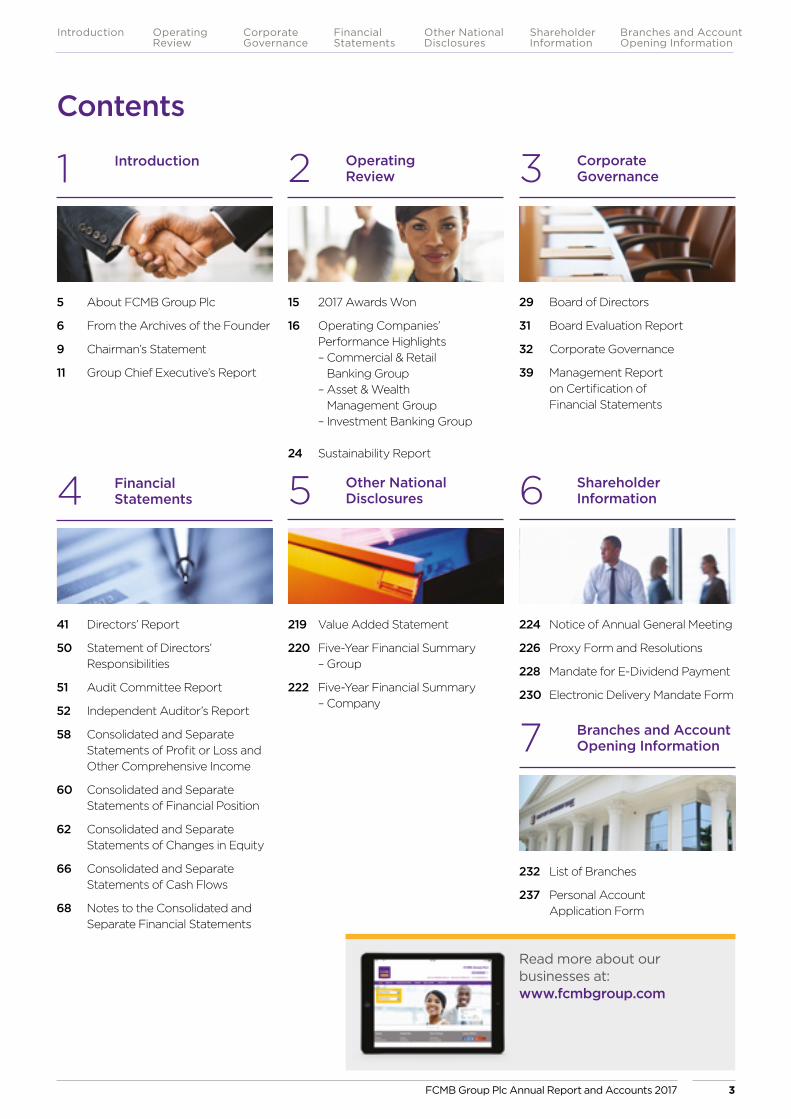
5 About FCMB Group Plc
6 From the Archives of the Founder
9 Chairman’s Statement
11 Group Chief Executive’s Report
15 2017 Awards Won
16 Operating Companies’ Performance Highlights
– Commercial & Retail Banking Group
– Asset & Wealth Management Group
– Investment Banking Group
24 Sustainability Report
29 Board of Directors
31 Board Evaluation Report
32 Corporate Governance
39 Management Report on Certification of Financial Statements
6 Shareholder Information5 Other National
Disclosures
224 Notice of Annual General Meeting
226 Proxy Form and Resolutions
228 Mandate for E-Dividend Payment
230 Electronic Delivery Mandate Form
219 Value Added Statement
220 Five-Year Financial Summary – Group
222 Five-Year Financial Summary – Company
7 Branches and Account Opening Information
232 List of Branches
237 Personal Account Application Form
41 Directors’ Report
50 Statement of Directors’ Responsibilities
51 Audit Committee Report
52 Independent Auditor’s Report
58 Consolidated and Separate Statements of Profit or Loss and Other Comprehensive Income
60 Consolidated and Separate Statements of Financial Position
62 Consolidated and Separate Statements of Changes in Equity
66 Consolidated and Separate Statements of Cash Flows
68 Notes to the Consolidated and Separate Financial Statements
Read more about our businesses at: www.fcmbgroup.com
Contents
FCMB Group Plc Annual Report and Accounts 2017 3
Introduction Operating Review
Corporate Governance
Financial Statements
Shareholder Information
Other National Disclosures
Branches and Account Opening Information

Introduction
FCMB Group Plc Annual Report and Accounts 20174
Introduction Operating Review
Corporate Governance
Financial Statements
Shareholder Information
Other National Disclosures
Branches and Account Opening Information
Introduction
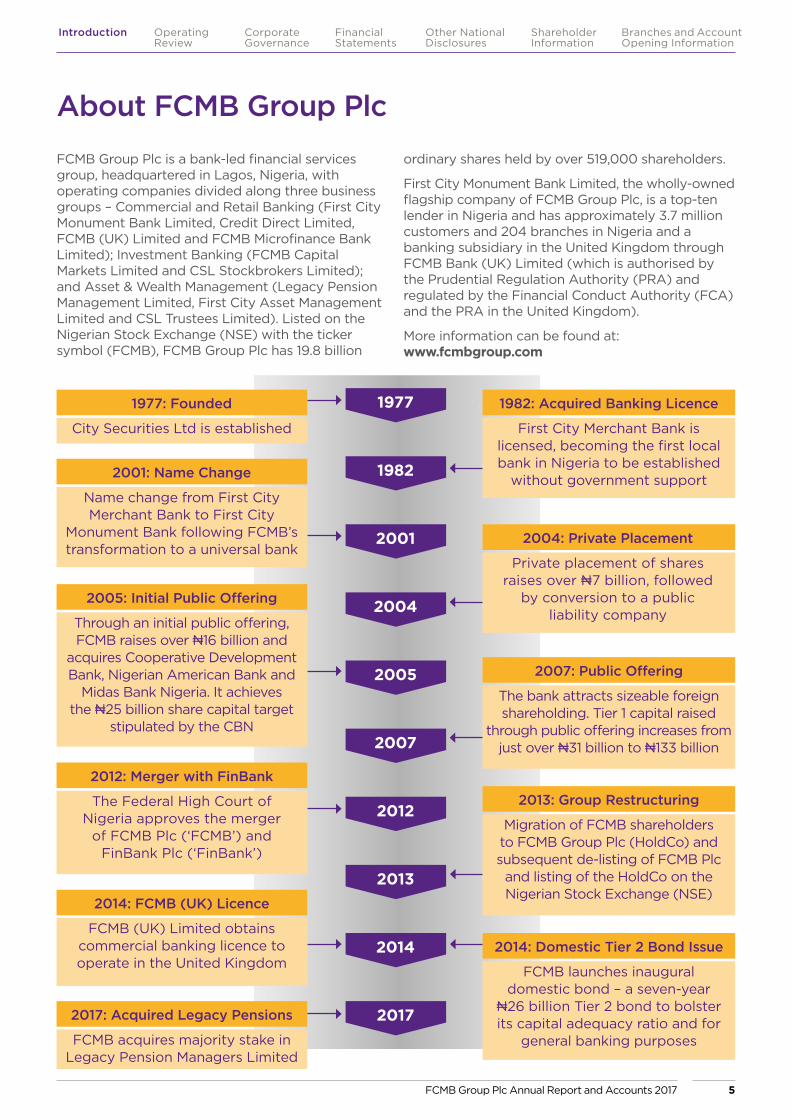
About FCMB Group Plc
FCMB Group Plc is a bank-led financial services group, headquartered in Lagos, Nigeria, with operating companies divided along three business groups – Commercial and Retail Banking (First City Monument Bank Limited, Credit Direct Limited, FCMB (UK) Limited and FCMB Microfinance Bank Limited); Investment Banking (FCMB Capital Markets Limited and CSL Stockbrokers Limited); and Asset & Wealth Management (Legacy Pension Management Limited, First City Asset Management Limited and CSL Trustees Limited). Listed on the Nigerian Stock Exchange (NSE) with the ticker symbol (FCMB), FCMB Group Plc has 19.8 billion
ordinary shares held by over 519,000 shareholders.
First City Monument Bank Limited, the wholly-owned flagship company of FCMB Group Plc, is a top-ten lender in Nigeria and has approximately 3.7 million customers and 204 branches in Nigeria and a banking subsidiary in the United Kingdom through FCMB Bank (UK) Limited (which is authorised by the Prudential Regulation Authority (PRA) and regulated by the Financial Conduct Authority (FCA) and the PRA in the United Kingdom).
More information can be found at: www.fcmbgroup.com
1977: Founded
City Securities Ltd is established
2001: Name Change
Name change from First City Merchant Bank to First City
Monument Bank following FCMB’s transformation to a universal bank
2005: Initial Public Offering
Through an initial public offering, FCMB raises over N16 billion and
acquires Cooperative Development Bank, Nigerian American Bank and
Midas Bank Nigeria. It achieves the N25 billion share capital target
stipulated by the CBN
2012: Merger with FinBank
The Federal High Court of Nigeria approves the merger
of FCMB Plc (‘FCMB’) and FinBank Plc (‘FinBank’)
2014: FCMB (UK) Licence
FCMB (UK) Limited obtains commercial banking licence to operate in the United Kingdom
2017: Acquired Legacy Pensions
FCMB acquires majority stake in Legacy Pension Managers Limited
1982: Acquired Banking Licence
First City Merchant Bank is licensed, becoming the first local bank in Nigeria to be established
without government support
2004: Private Placement
Private placement of shares raises over N7 billion, followed
by conversion to a public liability company
2007: Public Offering
The bank attracts sizeable foreign shareholding. Tier 1 capital raised
through public offering increases from just over N31 billion to N133 billion
2013: Group Restructuring
Migration of FCMB shareholders to FCMB Group Plc (HoldCo) and subsequent de-listing of FCMB Plc
and listing of the HoldCo on the Nigerian Stock Exchange (NSE)
2014: Domestic Tier 2 Bond Issue
FCMB launches inaugural domestic bond – a seven-year
N26 billion Tier 2 bond to bolster its capital adequacy ratio and for
general banking purposes
1977
2001
2005
2012
2014
1982
2004
2007
2013
2017
FCMB Group Plc Annual Report and Accounts 2017 5
Introduction Operating Review
Corporate Governance
Financial Statements
Shareholder Information
Other National Disclosures
Branches and Account Opening Information
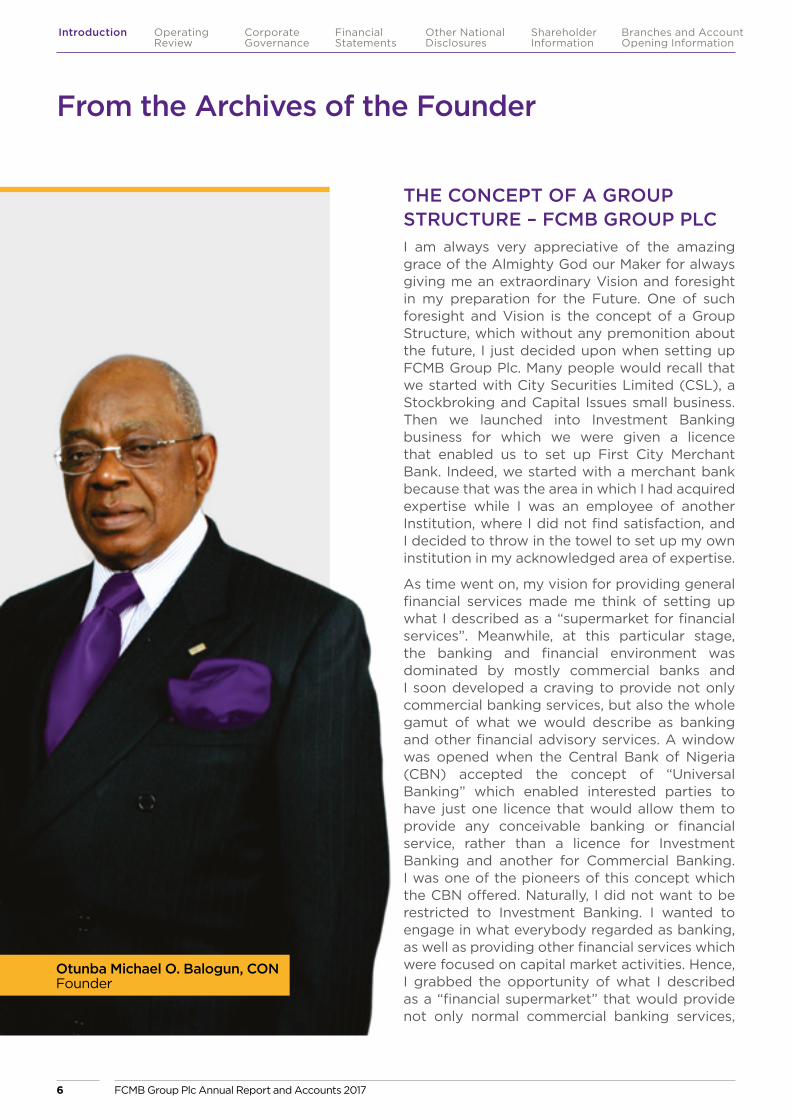
THE CONCEPT OF A GROUP STRUCTURE – FCMB GROUP PLCI am always very appreciative of the amazing grace of the Almighty God our Maker for always giving me an extraordinary Vision and foresight in my preparation for the Future. One of such foresight and Vision is the concept of a Group Structure, which without any premonition about the future, I just decided upon when setting up FCMB Group Plc. Many people would recall that we started with City Securities Limited (CSL), a Stockbroking and Capital Issues small business. Then we launched into Investment Banking business for which we were given a licence that enabled us to set up First City Merchant Bank. Indeed, we started with a merchant bank because that was the area in which I had acquired expertise while I was an employee of another Institution, where I did not find satisfaction, and I decided to throw in the towel to set up my own institution in my acknowledged area of expertise.
As time went on, my vision for providing general financial services made me think of setting up what I described as a “supermarket for financial services”. Meanwhile, at this particular stage, the banking and financial environment was dominated by mostly commercial banks and I soon developed a craving to provide not only commercial banking services, but also the whole gamut of what we would describe as banking and other financial advisory services. A window was opened when the Central Bank of Nigeria (CBN) accepted the concept of “Universal Banking” which enabled interested parties to have just one licence that would allow them to provide any conceivable banking or financial service, rather than a licence for Investment Banking and another for Commercial Banking. I was one of the pioneers of this concept which the CBN offered. Naturally, I did not want to be restricted to Investment Banking. I wanted to engage in what everybody regarded as banking, as well as providing other financial services which were focused on capital market activities. Hence, I grabbed the opportunity of what I described as a “financial supermarket” that would provide not only normal commercial banking services,
From the Archives of the Founder
Otunba Michael O. Balogun, CONFounder
FCMB Group Plc Annual Report and Accounts 20176
Introduction Operating Review
Corporate Governance
Financial Statements
Shareholder Information
Other National Disclosures
Branches and Account Opening Information

but would also be strong in providing capital market and other financial services, which would embrace the pedestal that I used in joining the banking profession.
We started with City Securities Limited (CSL) which was a stockbroking and capital issues company. We then moved at a particular stage to merchant banking, which embraced capital market services and when the opportunity offered itself that we could with one licence perform the whole gamut of banking and financial services, we grabbed it! Immediately, we adopted this strategy, we then decided that we should bring all our services under one institution which would enable us to provide all conceivable banking and financial services under one roof, so to speak. Having obtained this universal banking licence, we made sure that we did not abandon the field in which we already demonstrated financial expertise, hence, we thought of the name for an all embracing financial organization and we adopted the name, First City Group, which covered all the services we were providing under our roof. At that point, I did not know nor imagine that the CBN would in future introduce a mandatory tenure limitation for Chief Executives and Directors of banks.
From the beginning, we adopted the acronym of “FCMB”, at that time, meaning First City Merchant Bank, which was very popular. When the introduction of universal banking allowed us to extend our financial services beyond merchant banking, we just changed the “M” in our name from “Merchant” to “Monument” and our popular acronym was still retained. We so much like the acronym “FCMB” and I recall that when we decided to list our group of companies on the Stock Exchange, we agreed that all the different services we have been offering should be quoted on the Market. I still recall that I had to attend a meeting of the Board to ensure that the name of the entity we would be quoting should be “FCMB Group”, which embraces all our services.
We were indeed offering the market all the services that would be described as financial services, which go beyond commercial banking.
Today, when we refer to FCMB Group, it embraces all the financial services that we offer to the public under one roof.
Amazingly, it was the good Lord that was preparing me and our institution for future eventualities. When, therefore the Central Bank insisted that all the Chief Executives irrespective of their ages or their competence and value to the institution should retire after 10 years with the prospect of coming back three years later if it is desirable, I then appreciated that the vision which the good Lord had given me at the beginning would serve our purpose! We were able to do our restructuring without losing the services of very well experienced, valuable, competent, even though relatively youthful, leadership. This is what I described earlier as the amazing grace of the vision and foresight that the good Lord had given us in serving our present purpose.
Whilst complying with the requirements of the CBN, we were still able to retain the services of seasoned professionals, whom we believe still have much to offer to the growth of our institution. This vision gave us the required flexibility to retain those who led our transformation and remained critical in ensuring the group structure realises its potential value. Thanks be to God that the restructure was done seamlessly and without infringing any requirements of the CBN.
FCMB had commenced operations almost at the end of 1982 and published its first audited accounts early in 1984 and we continued to evolve and added more services, bringing in the required talent, whilst maintaining the highest levels of regulatory compliance. In the course of last year, we acquired a large pension management institution which is enhancing our performance and we continue to assert that in addition to our commercial banking franchise, we are in a position to offer a comprehensive range of financial services, provided it is in keeping with the CBN regulations.
As technological innovation continues to disrupt financial services, global industry experts are talking about the “platformification” of financial
FCMB Group Plc Annual Report and Accounts 2017 7
Introduction Operating Review
Corporate Governance
Financial Statements
Shareholder Information
Other National Disclosures
Branches and Account Opening Information
services. The idea is that banks will need to offer their customers access to many more financial services under a common platform, otherwise they will be disrupted by financial technology companies who do this and begin to own the customer relationship. FCMB Group is anticipating this future. We see our customers having access to a wide range of services, from traditional savings, borrowing and payment solutions, to advisory and investment management offerings. Technology will enable a single integrated gateway to our stable of products and services. Offering these services under the FCMB Group umbrella will give the reassurance of a 40-year track record, combined with the dynamism of a forward thinking organization. This will bring immense value and benefit to all stakeholders.
We have been innovative, resourceful and day by day, we have been able to provide the services required by our teeming customers and clients. As a Group, we are providing our services in a quintessential manner which makes us thank the good Lord and our Maker for giving us the Vision of providing diverse financial services under one roof.
We have also been able to identify and employ a blend of youthful, experienced, and highly talented professionals who have distinguished themselves and are accorded profound respect within the banking and financial services industry. I conclude by saying that it is the grace of the Almighty God that has been carrying us through. The future is indeed bright for our Group and as your Founder, I continue to praise and thank the Almighty God for what we have achieved.
Thank you all for sharing our experience.
Otunba Michael O. Balogun, CON
Founder
From the Archives of the FounderContinued
FCMB Group Plc Annual Report and Accounts 20178
Introduction Operating Review
Corporate Governance
Financial Statements
Shareholder Information
Other National Disclosures
Branches and Account Opening Information

Chairman’s Statement
Structure of the Group
The Board of the Group has responsibility for monitoring the activities of First City Monument Bank Limited and those of the other group companies under its ownership, which include FCMB Capital Markets Limited, CSL Stockbrokers Limited, CSL Trustees Limited, FCMB Microfinance Bank Limited and the most recently acquired Legacy Pension Fund Managers Limited. The Central Bank of Nigeria (CBN) granted an Other Financial Institutions Licence to the Group in May 2013, and 2017 marked the fourth full year of the Group’s operations under the holding company structure. The Group remains committed to the implementation of the Corporate Governance rules of the CBN, the Nigerian Stock Exchange and the Securities and Exchange Commission.
The structure of the Board changed slightly during 2017. Following the approval of the CBN, Mr Ladi Balogun became the Group Chief Executive effective 14 March 2017, while Mr Peter Obaseki became the Chief Operating Officer. The CBN also approved the appointments of Mr Oladipupo Jadesimi and Mrs Olapeju Sofowora as Non-Executive Directors on the Board of the Group effective 27 December 2017.
Ladies and Gentlemen, Fellow Shareholders, it is my pleasure once again to present the FCMB Group Plc’s (“the Group”) annual results to you. I welcome you to the fifth Annual General Meeting of the Group since its inception and I thank you for your continued support through 2017. Although, we met with a number of challenges as a group in 2017, I am pleased to say that we were able to surmount them, thanks to the commitment of all the personnel of our Group companies.
Dr Jonathan A D LongChairman
FCMB Group Plc Annual Report and Accounts 2017 9
Introduction Operating Review
Corporate Governance
Financial Statements
Shareholder Information
Other National Disclosures
Branches and Account Opening Information

The Board of the Group therefore consisted of Mr Ladi Balogun as the Group Chief Executive and Mr Peter Obaseki as the Chief Operating Officer. The Non-Executive Directors include: Alhaji Mustapha Damcida, Mr Olutola O Mobolurin, Mr Martin Dirks, Professor Oluwatoyin Ashiru, and Dr (Engr) Gregory O Ero. Mr Bismarck Rewane and Mr Olusegun Odubogun served as Non-Executive Independent Directors, while I served as Non-Executive Chairman. The Board met five times during 2017, with an average attendance rate of 82%.
The Board is supported by three Committees that report to it. These are the Board Risk, Audit & Finance Committee, the Board Governance and Remuneration Committee, and the Statutory Audit Committee. The Board Risk, Audit & Finance Committee, which consisted of Mr Bismarck Rewane (Chairman), Mr Olusegun Odubogun, Dr (Engr) Gregory O Ero and Mr Martin Dirks, met four times in 2017 with an average attendance rate of 81%. The Board Governance and Remuneration Committee, which is made up of only Non-Executive Directors (the Group Chief Executive and the Chief Operating Officer attend meetings when required), have the following as members: Mr Olutola O Mobolurin, Professor Oluwatoyin Ashiru and Alhaji Mustapha Damcida. The committee met four times within the year with an average attendance rate of 92%. The Statutory Audit Committee, which consisted of Alhaji S B Daranijo, Evangelist Akinola Soares, Mr Akeem Batula, Mr Bismarck Rewane, Mr Olutola O Mobolurin and Mr Olusegun Odubogun, also met four times with an average attendance rate of 96%. These committees enable the Board of FCMB Plc to monitor and supervise the implementation of business plans by each company in the Group on a regular and consistent basis.
Profits and Per Share Information
The bank saw a few headwinds to profitability in 2017. A high interest rate environment led to a rise in the bank’s funding cost. Deposits declined due to customer migration to relatively high-yield treasury bills and government bonds. Despite the reduction in deposits, the bank saw
an increase in the Cash Reserve Requirement (CRR) which impacted liquidity and the bank’s earning capacity. The bank continued to take a cautious approach towards lending in 2017 and consequently loans reduced marginally. Net Loans and advances were down 1.5% during the year. Despite these headwinds, whose effects were cushioned by improved contributions of investment banking, and the additions to our asset and wealth management activities, the group reported modest pre-tax profits of N11.5 billion – compared to N16.3 billion in 2016.
We continue to shore up the capital of the bank through profit retention in preparation for the growth opportunities that we expect as the economy recovers. Consequently, our Board has recommended a dividend of 10 kobo per share representing a dividend appropriation of N1.98 billion. Earnings per share, in 2017, was N0.48, compared to N0.72 in 2016. More details on the performance will be provided by the Group Chief Executive.
Thank you very much for your attention.
Dr Jonathan A D LongChairman
Chairman’s StatementContinued
FCMB Group Plc Annual Report and Accounts 201710
Introduction Operating Review
Corporate Governance
Financial Statements
Shareholder Information
Other National Disclosures
Branches and Account Opening Information

Distinguished Shareholders, it is my pleasure to welcome you to the 5th annual general meeting of FCMB Group Plc and to present an overview of the performance of our businesses in 2017.
Macroeconomic Environment
On the global scene, global economic growth began accelerating last year and stock markets around the world hit record highs. The year was particularly positive for the Eurozone, with last year being its best year since the financial market crash 10 years ago. The zone’s economic growth was at a 10-year high and unemployment at a nine-year low. The US economy grew 3.3% (a three-year high) in Q3 2017, and unemployment was at its lowest since 2000. The Bank of England raised interest rates for the first time in more than 10 years amidst strong signals that the Monetary Policy Committee will look to further increase rates if the UK economy stays reasonably strong in the face of Brexit. Global oil prices also recovered considerably during the year.
For the Nigerian economy, 2017 began with Nigeria continuing in a recession it slipped into in 2016 caused by adverse economic shocks, unstable economic policies, and deepening security problems in the North East, Delta regions and the South East. Nevertheless, improved oil production brought about by relative stability in the Niger Delta, increasing oil prices and better FX liquidity saw Nigeria exit its recession in Q2 2017 and brought back much needed foreign investments into the country.
The price of oil (Brent crude) rose from an average of US$44.1/bbl in 2016 to an average of US$54.3/bbl in 2017. Consequently, a number of indigenous upstream oil and gas players began to see an improvement in their cash flows. Increased oil prices in 2017 also led to an increase in the nation’s foreign reserves which closed the year at US$38.8 billion.
A major leap for the economy in 2017 came from the opening of the Investors and Exporters (I&E) FX window in April. The introduction of the Investors’ and Exporters’ Window (quoted as the Nigerian Autonomous Exchange Rate Fixing or NAFEX) significantly improved access
Group Chief Executive’s Report
Ladi BalogunGroup Chief Executive
FCMB Group Plc Annual Report and Accounts 2017 11
Introduction Operating Review
Corporate Governance
Financial Statements
Shareholder Information
Other National Disclosures
Branches and Account Opening Information

to FX as investors became increasingly more confident that they could access FX to repatriate capital. Improved FX liquidity led to a gradual convergence of official rates with the parallel rate. The value of the Naira strengthened on the parallel market to close the year at N363/US$ from as high as N490/US$ at the start of the year. The NAFEX rate which became the de facto rate at which many transactions were done, closed the year at N360/US$.
The country’s GDP growth climbed into positive territory for the first time in Q2 with a reported growth rate of 0.55%, which followed five quarters of negative GDP growth. This growth however was largely fueled by improved oil production supported by a relative calm in the oil-producing Niger Delta which ultimately, has resulted in higher foreign reserves. Oil production averaged 1.7 million barrels per day (mbpd) in 2017.
Though food inflation remained sticky through the year, we saw a marginal decline in the headline inflation rate which closed the year at 15.4% YoY compared to 18.6% YoY growth at the start of the year.
Group Performance
The Group recorded profits after tax of N9.4 billion, a 34% reduction from N14.3 billion achieved in 2016. In spite of the reduction in headline numbers, group performance is an improvement over the previous year after adjusting for the significant FX revaluation income enjoyed in 2016. The key drivers of the Group’s performance include increase in income from our non-banking activities, lower impairment charges from the bank and its subsidiaries, and improved operating efficiencies through more pervasive use of technology.
Our operating companies are divided along three business groups – Commercial and Retail Banking (First City Monument Bank Limited, Credit Direct Limited, FCMB (UK) Limited and FCMB Microfinance Bank Limited); Investment Banking (FCMB Capital Markets Limited and CSL Stockbrokers Limited); and Asset & Wealth Management (Legacy Pension Management Limited, First City Asset Management Limited and CSL Trustees Limited).
Commercial and Retail Banking showed signs of improvement with growth in income levels (after adjusting for exceptional FX revaluation income in 2016), reduction in impairment charges and substantial growth in our UK business and consumer finance business (CDL), after a difficult 2016. Commercial and Retail Banking remains our largest group, contributing 83.2% of profits and 98.6% of total assets.
Investment Banking exhibited improved performance, from a loss position in 2016 of N84.0 million after tax to a profit position of N430.3 million after tax in 2017, largely driven by CSL Stockbrokers Limited. Our stockbroking business remains a top-3 player in its sector and participated as the sell-side broker on the largest ever trade on the Nigeria Stock Exchange in December 2017. CSLS Stockbrokers Limited and FCMB Capital Markets Limited jointly accounted for 3.9% of profits.
Our Wealth & Asset Management businesses have combined assets under management of over N260 billion and contributed 4.2% of Group profits in 2017. This is a rise of N238.8 billion in AUM following the acquisition of Legacy Pension Managers Limited (“Legacy Pension”) in November 2017. The accounting apportionment of profits from Legacy Pension was only for December 2017 i.e. post completion of the transaction. The profit contribution of the Wealth & Asset Management businesses is expected to increase as we fully consolidate Legacy Pension from 2018.
New Business
The company completed the acquisition of additional 60% stake in Legacy Pension in November 2017. The transaction increased FCMB’s stake from 28.2% to 88.2%, thereby making Legacy a subsidiary of FCMB.
The acquisition helps achieve further diversification of service offerings and consequently earnings within the FCMB Group. We see significant growth opportunities in the Pension management industry in Nigeria as it is yet to achieve maturity and will support and facilitate strategic organic and inorganic growth
Group Chief Executive’s ReportContinued
FCMB Group Plc Annual Report and Accounts 201712
Introduction Operating Review
Corporate Governance
Financial Statements
Shareholder Information
Other National Disclosures
Branches and Account Opening Information
initiatives that will position Legacy in the top-tier of its industry over the next few years.
FCMB Microfinance Bank Limited, the Group’s new group lending and financial inclusion play, commenced operations as a state microfinance bank in January 2017. This business will be the key driver of FCMB’s informal sector and agricultural sector (particularly smallholder farmer) drive across the country. These two sectors account for over 30% of the country’s GDP.
Outlook
Current macro indices signal that the economy remains on course for a pickup in growth this year. The IMF predicts a 2018 economic growth of 2.1%, citing recovery in oil production, continued growth in agriculture, and higher public investment as key drivers. The World Bank forecasts a higher growth rate of 2.5%. The most recent Central Bank of Nigeria’s (CBN) Purchasing Managers’ Index (PMI) report published shows that the PMI (an index used to gauge the economic health of the manufacturing sector) for the month of January stood at 57.3 points indicating expansion in the manufacturing sector for the tenth consecutive month. This points to improved growth in business activities, employment and inventories.
We believe sustained stability in the exchange rate should provide some level of support for manufacturing output this year. We expect inflation will continue to decline albeit marginally. Oil prices have crossed the US$70 mark this year and despite expectations that an increase in oil production in the first half of 2018 (growth in US shale oil, resumption of exports through the Forties pipeline, etc.) could put downward pressure on prices in the first half of 2018, we expect oil prices to remain above US$60 in 2018.
Increased government spending backed by higher revenues should drive an increase in economic activities both at state and federal levels. We also expect easing macroeconomic headwinds to fuel recovery in consumer spending.
It seems likely that the group performance will also see an uptick this year based on improving
macro-economic indices. With the successful acquisition of a majority stake in Legacy Pension Managers Limited (“Legacy”), the group is set to benefit from a growing pension industry. An improvement in economic indices, necessarily results in growth in Assets under Management (AUM).
Nigerian equities had a strong start to the year extending gains from last year. The NSE appears to be heading into another bullish year considering expectations of more favourable economic indices and a more stable and liquid FX market and improvement in capital market activities bodes well for our brokerage and capital market businesses.
The recovery in oil prices and in the business environment means well for the companies the bank has lent to. I am confident that the banking group will see an improvement in its loan book. As yields also begin to moderate in the fixed income market, we expect more funds directed to banks and consequently stronger liquidity. The bank is also looking to enhance transaction services to drive non-interest income.
That said, despite the recovery seen thus far, the Nigerian economy remains fragile and vulnerable to oil price as well as production shocks. Nevertheless, we are optimistic about the prospects of our portfolio of businesses for 2018. We will continue to pursue our strategic objectives of strengthening the core commercial and retail banking businesses, investing in growing asset and wealth management activities, pursuing financial inclusion and micro enterprise opportunities in a more focused manner through FCMB Microfinance Bank Limited, and maintaining our presence in advisory and primary capital markets activities.
We thank all stakeholders for the confidence shown in us.
Ladi BalogunGroup Chief Executive
FCMB Group Plc Annual Report and Accounts 2017 13
Introduction Operating Review
Corporate Governance
Financial Statements
Shareholder Information
Other National Disclosures
Branches and Account Opening Information

OperatingReview
FCMB Group Plc Annual Report and Accounts 201714
Introduction Operating Review
Corporate Governance
Financial Statements
Shareholder Information
Other National Disclosures
Branches and Account Opening Information

OperatingReview
FCMB Group Plc’s commitment to excellence was recognised in 2017 by a number of awards:
2017 Awards Won
African Clean Up InitiativeBest Environmental Supporting Financial Institution in AfricaJuly 2017First City Monument Bank Limited
BusinessDay Banking AwardsBest Managed Fund in Equity – Legacy Equity FundOctober 2017First City Asset Management Limited
Most Improved Retail Bank in NigeriaOctober 2017First City Monument Bank Limited
Industrial Training Fund Merit AwardBest Contributing Employer in Human Resource DevelopmentJuly 2017First City Monument Bank Limited
Sustainability, Enterprise and Responsibility Awards (SERAS)Best Company in Partnership for Development in NigeriaNovember 2017First City Monument Bank Limited
EMEA Achievement AwardsBest Restructuring Deal in Africa Oando PlcFebruary 2017FCMB Capital Markets Limited (Financial Adviser)
New Age Banking Summit and AwardsExcellence Award in Alternate Channel BankingSeptember 2017First City Monument Bank Limited
FCMB Group Plc Annual Report and Accounts 2017 15
Introduction Operating Review
Corporate Governance
Financial Statements
Shareholder Information
Other National Disclosures
Branches and Account Opening Information
Operating Companies’ Performance Highlights Commercial & Retail Banking Group
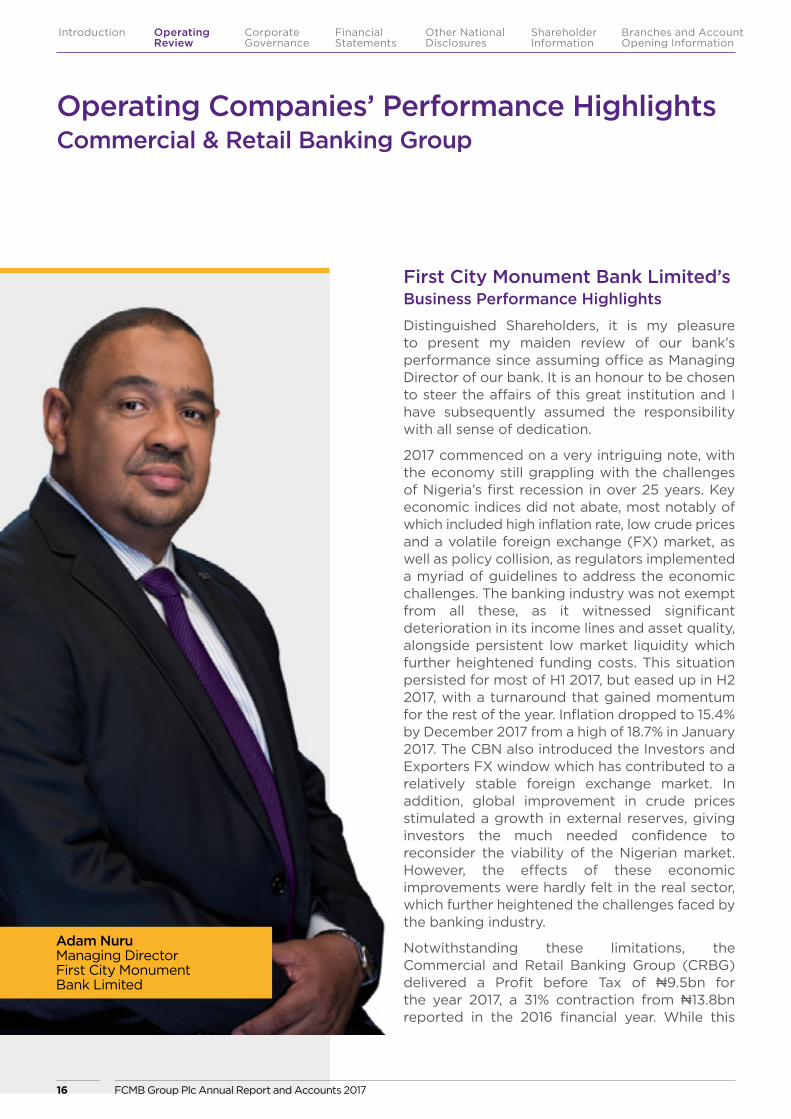
First City Monument Bank Limited’s Business Performance Highlights
Distinguished Shareholders, it is my pleasure to present my maiden review of our bank’s performance since assuming office as Managing Director of our bank. It is an honour to be chosen to steer the affairs of this great institution and I have subsequently assumed the responsibility with all sense of dedication.
2017 commenced on a very intriguing note, with the economy still grappling with the challenges of Nigeria’s first recession in over 25 years. Key economic indices did not abate, most notably of which included high inflation rate, low crude prices and a volatile foreign exchange (FX) market, as well as policy collision, as regulators implemented a myriad of guidelines to address the economic challenges. The banking industry was not exempt from all these, as it witnessed significant deterioration in its income lines and asset quality, alongside persistent low market liquidity which further heightened funding costs. This situation persisted for most of H1 2017, but eased up in H2 2017, with a turnaround that gained momentum for the rest of the year. Inflation dropped to 15.4% by December 2017 from a high of 18.7% in January 2017. The CBN also introduced the Investors and Exporters FX window which has contributed to a relatively stable foreign exchange market. In addition, global improvement in crude prices stimulated a growth in external reserves, giving investors the much needed confidence to reconsider the viability of the Nigerian market. However, the effects of these economic improvements were hardly felt in the real sector, which further heightened the challenges faced by the banking industry.
Notwithstanding these limitations, the Commercial and Retail Banking Group (CRBG) delivered a Profit before Tax of N9.5bn for the year 2017, a 31% contraction from N13.8bn reported in the 2016 financial year. While this
Adam Nuru Managing DirectorFirst City Monument Bank Limited
FCMB Group Plc Annual Report and Accounts 201716
Introduction Operating Review
Corporate Governance
Financial Statements
Shareholder Information
Other National Disclosures
Branches and Account Opening Information
may seem below par, I am pleased to announce that we have made considerable progress in our journey to deliver sustainable income growth. Improvements and diversification in our revenue streams, alongside moderations in operating expense and impairments growth are at the core of our new business model which we shall continue to implement in the current year.
The CRBG’s performance was driven by the marginal increase in net interest income, despite an industry wide muted loan growth in 2017. Fees and commissions also recovered from the knock off effect of FX related income in 2016 and improved by 7.6% to N14.5bn in 2017. This was in spite of the regulatory cap on fees in the year. We mitigated the impact of this cap on our revenue stream by increasing the volume of transacting customers, issuing almost a million cards to our customers in 2017 and leveraging technology to improve operating efficiency.
The CRBG’s revenue performance declined through a 52% reduction in other income, because of minimal revaluation gains in 2017. There was a 70% decline in revaluation surplus from N24.4bn in 2016 to N8.4bn in 2017. However to cushion this effect, we have positioned ourselves to aggressively explore new markets, mainly around the youth segment, women in business, the creative industries and most definitely, the sphere of agriculture to build additional revenue streams going forward.
We continued to contain our overhead cost, which increased marginally by 4% from N63.4bn in 2016 to N66.0bn despite the double digit inflation rate that characterized the year 2017. We hope to maintain this moderate cost-conscious posture in 2018 and beyond.
Balance sheet size remained flat, growing marginally by 0.5% in 2017, with loans and advances following the same trend and declining by 2% to N649bn in 2017. This is as the bank continues to manage its exposure, with focus on high quality assets to improve loan book quality, while also pursuing conscious growth in promising sectors to optimise resource allocation. Deposits on the other hand grew 4%, driven majorly by about 10% growth in savings deposits from N139bn
in 2016 to N153bn in 2017, a modest outcome of our renewed focus on low cost funding options to reduce our balance sheet cost.
On a segment basis, the Bank recorded commendable improvements across the key revenue earning units. Our Small to Medium Enterprise (SME) business recorded a 24.7% improvement in its net revenue, driven majorly by improvements in its interest income and about 30% growth in fees and commission. We deployed additional 5,000 point-of-sale (PoS) machines within the year to bring the number of active PoS machines to about 14,000. We also launched a new SME mobile banking app to enhance alternate channels adoption among customers in the business segment.
In the same way, our Corporate Banking business recorded a 41.4% increase in net revenue on the back of its renewed liability and transaction driven approach, growing its low cost deposit volume by about 20%.
Our Personal Banking business on the other hand recorded a 5.1% decline in net revenue, due mainly to increased funding cost which we were unable to pass on to our customers and the proactive decision to scale back on consumer loans in a bid to manage the impact of delayed salary payments by state governments on our loan book. This impact was however cushioned by improved business volumes in other products, reduction in our cost of risk and aggressive recoveries during the year, resulting in about 22% growth in PBT from N7.4bn in 2016 to N9.1bn in 2017. Overall improvements in fiscal conditions and increase focus on non-interest income will continue to sustain the positive growth trend in the segment
The overall strength of our performance for the year is reflected in our improved operating ratios. Other non-financial metrics also gained traction with the customer advocacy and likelihood index, Net Promoter Score (NPS) improving. In addition, the Bank continues to feature in the Top 5 category across key segments in the KPMG annual customer satisfaction survey index. We are positioned to fully leverage this positive feedback to further grow our businesses and related revenue lines in 2018.
FCMB Group Plc Annual Report and Accounts 2017 17
Introduction Operating Review
Corporate Governance
Financial Statements
Shareholder Information
Other National Disclosures
Branches and Account Opening Information

Directors as part of the leadership team in the bank; Bukola Smith and Olu Akanmu of the Business Development and Retail Divisions respectively. They are both individuals with great depth and tons of experience and I look forward to working with both of them in our drive to build a world class financial institution we can all be proud of.
We recognise and acknowledge the entire staff of this great institution for their resilience and commitment in the achievement of these positive results. To the Board of Directors, I am most grateful for the privilege and unwavering support.
We also acknowledge and appreciate the constant guidance and steer from our Founder, Otunba Olasubomi Balogun. His wealth of experience and deep industry knowledge have been priceless assets for us in our drive to build a solid and extremely resilient financial institution. We will continue to count on him for this support.
Above all, I return all glory to the Almighty God for his grace to see the year through and wish everyone a prosperous 2018.
Adam NuruManaging Director
Subsidiaries
Noted improvements were not limited to the Bank alone, as all subsidiaries within the banking group also exhibited improved performances. Our micro lending business Credit Direct Limited (CDL) recovered from the 2016 decline in revenue driven by local macro-economic impact on its customers’ ability to meet debt obligations to record a 65% growth in PBT from N1.3bn in 2016 to N2.2bn in 2017. The improvement was driven by the realignment of the Subsidiary’s business model and an aggressive recovery posture which will be sustained in 2018. FCMB UK also continued its recovering trend with 250% growth in PBT from N0.1bn in 2016 to N0.3bn in 2017, even as we intensify efforts to complete the variation process for its license, which will see it transform from a wholesale deposit taking bank to a retail deposit taker in line with our retail banking focus at the banking group level.
Outlook
Without doubt, the task ahead is well defined and we expect that continuous improvement in our operating environment will definitely serve as the pivot of our growth. We will continue to strengthen the Bank’s balance sheet to remain a key player in the converging banking landscape. In doing this, we will accelerate our play in the Retail, SME and Agriculture space to increase liquidity at a much lower cost and drive revenue growth. Our institutional and commercial banking spheres will be liability-led, with strong emphasis on transaction-based propositions. We will invest more in technology to build capabilities to drive scale for increased non-interest income growth and customer service excellence. Overall, we will continue the journey of building an agile organisation with a high performance culture, while improving our risk capabilities in line with our moderate risk appetite.
Conclusion
My sincere appreciation goes to our esteemed customers for their belief in us, continued trust and sustained patronage. I am also happy to announce the appointment of two new Executive
Commercial & Retail Banking GroupContinued
FCMB Group Plc Annual Report and Accounts 201718
Introduction Operating Review
Corporate Governance
Financial Statements
Shareholder Information
Other National Disclosures
Branches and Account Opening Information

FCMB Microfinance Bank Limited’s Business Performance Highlights
The Group has shown significant interest in the Financial Inclusion strategy of the Central Bank of Nigeria (CBN) by establishing a Group micro-lending unit within the retail banking division of FCMB Limited. This unit has developed micro- lending schemes across 12 states of Nigeria. FCMB Microfinance Bank Limited, a fully owned subsidiary of FCMB Group, was established to take over and enhance the services of the group lending unit. The Company was licensed as a state microfinance bank in Oyo state by the CBN in October 2016 and commenced operations on 1 January 2017.
2017 – Positive Start
The company commenced business with two branches in January 2017 and increased the business outlets to five branches within the year. The company disbursed N228 million to over 4,600 customers during the year. The loan portfolio size at the end of 2017 was over N92 million with 0% Portfolio at Risk (PAR).
The business closed the year with a loss but had started returning monthly profits in the last two months of the year. We expect the company to be profitable in 2018.
The business acquired robust microfinance software to achieve centralisation of the loan/underwriting review and standardised operations processing and ensure disbursement of quality loans across the business.
We introduced mobile tablets for instant account opening and transactions processing supported with instant SMS alerts to improve control and enhance customer experience.
Outlook for 2018
FCMB MFB expects to take over the existing nine group lending business units with FCMB Limited in Oyo State within the first half of 2018.
The company has applied for a National Microfinance Bank licence to facilitate full consolidation of the Group lending business in FCMB Limited. We anticipate that the licence will be granted in 2018.
We will implement a few initiatives to grow our distribution and profitability, including:
� Roll out 15 new business outlets and launch personalised debit cards for micro-lending customers.
� Collaborate with aggregators within the Agricultural business chain.
� Initiate aggressive savings portfolio growth to achieve an 80% savings-to-loan ratio, which will in turn reduce the cost of funding and increase profitability.
� Introduce individual and asset loans to tested group clients.
� Improve client retention through improved customer service.
� Maintain healthy loan portfolio of the consolidated business with PAR sustained below 3%.
� Disburse over N1.5 billion in loans.
Adetunji LamidiManaging Director FCMB Microfinance Bank Limited
FCMB Group Plc Annual Report and Accounts 2017 19
Introduction Operating Review
Corporate Governance
Financial Statements
Shareholder Information
Other National Disclosures
Branches and Account Opening Information

Legacy Pension Managers Limited’s Business Performance Highlights
On 21 November 2017, FCMB Group, having acquired majority interest in Legacy PFA, assumed control and the Company became a subsidiary of the Group.
As at 31 December 2017, we had under management, pension assets in excess of N239 billion for over 375,000 private and public sector employees.
2017 Highlights
Legacy delivered one of its best performances in five years. All key performance areas experienced significant growth, starting with profit before tax of N1.14 billion, an increase of 21.9% year-on-year. Gross revenue increased by 21.0% while cumulative assets under management (AUM) grew by 21.3%.
Challenges did, however, remain. As the economy settled deeply into recession in the first quarter of 2017, job losses ensued and this affected us in
more than one way. First, as new employments stalled, RSA enrolments plummeted by a year-on-year margin of 21.3%. Second, benefit payout, especially with regard to temporary access, increased tremendously as job losses mounted and third, contributions into workers’ RSAs fell into serious arrears, especially with respect to Federal and States employees.
In addition to these, operating costs were under inflationary pressure following systemic forex scarcity and the increase in energy costs.
Outlook for 2018
We enter 2018 with cautious optimism. We expect the economy will continue its recovery with GDP growth estimated at 2.2–2.5%. In the short run, as a PFA that is firmly positioned in the fixed-income space, we will be exposed to returns sub-optimization as rates drop. We are, however, prepared to close the value gap through bargain hunting in the equities space and seeking out opportunities in non-traditional asset classes. We will revamp our activities in the Lagos and South West market and vigorously pursue funding of unfunded accounts. We also expect that we will benefit from the synergy in the Group. This should impact positively on cost of operations, asset yield, RSA registration and contributions inflow.
Misbahu YolaManaging DirectorLegacy Pension Managers Limited
Asset & Wealth Management Group
FCMB Group Plc Annual Report and Accounts 201720
Introduction Operating Review
Corporate Governance
Financial Statements
Shareholder Information
Other National Disclosures
Branches and Account Opening Information
CSL Trustees Limited’s Business Performance Highlights
CSL Trustees Limited is the security agent and a wholly owned subsidiary of the FCMB Group Plc. We are licensed by the Securities Exchange Commission to carry on the business of trust services. We have strived in the last five years to create a niche in the industry as a leading service provider. As trustee and security agent, we have within the period rendered services to corporate, public and individual clients.
As evidence of our growing market share, we have expanded our client base both locally and offshore across various economic sectors, which include manufacturing, shipping, oil and gas, information technology and real estate, among others.
2017 – A Modest Achievement in the Midst of Recession
Despite the uncertainty, inflation and recession that prevailed for the greater part of the year under review, the company recorded a modest achievement in line with the budget expectation. The success story was based on efficient cost control, client retention and satisfaction through efficient service delivery. Our security agent to corporate debenture and public bonds remained the major earnings driver in the year.
Major highlights included the following:
� Revenue grew marginally by 3.0% from N292.0 million in 2016 to N300.8 million in 2017.
� Profit before tax decreased by 1.5% from N187.4 million to N184.5 million.
� Shareholders’ fund grew from N479.4 million to N523.1 million, representing an increase of 6.0%.
� Total assets reduced from N2.9 billion to N2.5 billion, a decrease of 12.9%.
Outlook for 2018
The economy showed signs of recovery from recession towards the end of 2017 and we expect the trend to continue in 2018. The relative peace in the Niger Delta has also resulted in increased crude oil production. The multiplier effect of this will be reflected in the revenue accrued by the different tiers of government and this will improve activities in the capital markets and the economy in general.
Consequently, we expect resumption of the issuance of bonds from state governments that are able to exit the salary debt burden and whose applications have been on hold with the regulator. We are also certain of launching three technology-driven products under our private trust service offering.
We shall also continue to keep in focus our cost-to-income ratio and exercise control over
operating expenses in order to remain profitable.
Samuel AdesanmiManaging DirectorCSL Trustees Limited
FCMB Group Plc Annual Report and Accounts 2017 21
Introduction Operating Review
Corporate Governance
Financial Statements
Shareholder Information
Other National Disclosures
Branches and Account Opening Information
FCMB Capital Market Limited’s Business Performance Highlights
FCMB Capital Markets Limited (FCMB CM), the investment banking subsidiary of FCMB Group Plc, is an adviser of choice to Nigeria’s leading companies and public institutions, and has a track record of advising on and executing landmark transactions in Nigeria for nearly four decades. Our services include arranging debt and equity finance; project and structured finance; mergers, acquisition and disposals; and strategic advisory, including balance sheet and corporate restructuring.
2017 – Maintaining a Profitable Position
Nigeria’s economy went through one of its worst GDP growth performances from 2016 to Q1 2017. The economic contraction and policy uncertainty only started easing towards the end of 2017, largely due to:
(i) the FGN rebalancing its debt profile in favour of external loans with the consequence that money market interest rates declined in December 2017.
(ii) CBN initiatives including injecting over US$14 billion into the interbank foreign exchange market due to stable and higher oil prices in 2017; creating the Nigerian Autonomous Foreign Exchange Rate Fixing (NAFEX), which created a benchmark FX rate for investors and exporters, and introducing a special FX window for small and medium enterprises in early 2017, all of which helped to ease the FX liquidity crisis, narrow the FX premium and converge multiple rates in the market.
(iii) FGN’s roll-out of the Economic Recovery and Growth Plan (“ERGP”) and implementation of 31 reforms under its 60-Day National Action Plan on Ease of Doing Business.
Despite the market challenges in 2017, we were financial adviser on a few noteworthy transactions including:
� corporate restructuring for one of Nigeria’s leading fast-moving consumer goods companies;
� a merger that resulted in the creation of the second-largest brewing company in Nigeria; and
� the first public bond issuance by a microfinance bank in Nigeria.
Outlook for 2018
In 2018, the recent stability in the macroeconomic environment should keep growth afloat subject to a favourable outlook for the oil sector. If oil revenue were to decline it’s highly probable that the CBN will reduce its supply of foreign currency into the market rather than deplete its reserves, which will have an adverse impact on the real sector. Lower oil revenue also implies an increase in the FGN’s debt profile. However, based on the current macroeconomic environment and outlook – robust foreign currency supply and stable FX rate, declining inflation, fall in interest rates on the back of monetary easing – we see opportunities for businesses to raise capital to pursue their growth and expansion plans, refinance debt etc. in the first half of the year, creating transaction advisory opportunities for our business. Elections will take place in early 2019, and as has been the case in past pre-election years, we anticipate that government focus will largely shift to politics as we get into end of Q3 and Q4 2018; investors and financiers will take a more cautious approach as elections draw nearer, contributing to a relative slowdown in transaction activity. Despite this, we will continue to seek to take advantage of opportunities in the market. We expect to complete ongoing transactions we carried over from last year and continue to work with our clients in providing financing solutions and identifying investment opportunities, while maintaining strong controls around our operating costs.
Tolu OsinibiExecutive DirectorFCMB Capital Markets Limited
Investment Banking Group
FCMB Group Plc Annual Report and Accounts 201722
Introduction Operating Review
Corporate Governance
Financial Statements
Shareholder Information
Other National Disclosures
Branches and Account Opening Information
CSL Stockbrokers Limited’s Business Performance Highlights
While 2017 started poorly for the equities market due to low investor confidence (a result of limited liquidity and transparency in the foreign exchange market), activity was restored in Q2 following the introduction by the Central Bank of Nigeria (CBN) of the Investors' and Exporters' foreign exchange window, which brought with it liquidity for investors at market-determined prices. The resulting pickup in the market was dramatic with value traded on the floor of the Nigerian Stock Exchange (NSE) growing from N1.15 trillion in 2016 to N2.54 trillion in 2017. The All Share Index also ended the year higher with a gain of 41.59% compared with a decline of 6.17% in 2016. The value of trades recorded by CSL during the year was N312 billion, while we ended the year as the third-ranked broker by transaction size. I am pleased to announce that CSL facilitated the single largest deal in the history of the NSE with
the purchase of 550 million Dangote Cement Plc shares for a foreign institutional client. Our local business (retail and institutional) also experienced significant growth in 2017 driven by the acquisition of new pension fund clients and increased trading by retail clients on our online trading platform.
Following a long period of depressed brokerage activity, CSLS started seeing some of the fruits of its recent initiative to diversify revenue streams. Specifically, our asset management, corporate brokerage and fixed-income activities contributed a bigger share to overall revenues than in previous years. Our asset management business, First City Asset Management, was a major contributor to the profitability of the group.
With the steady increase in oil prices and ceasing of hostilities in the oil-producing Niger Delta, we expect a positive performance of the equities market (value and returns) as it remains attractive to foreign and local investors in 2018. Under these conditions we expect to fully execute our business plan, which is focused on deal origination and providing excellent service to our local and foreign clients.
Gboyega BalogunManaging DirectorCSL Stockbrokers Limited
FCMB Group Plc Annual Report and Accounts 2017 23
Introduction Operating Review
Corporate Governance
Financial Statements
Shareholder Information
Other National Disclosures
Branches and Account Opening Information
Sustainability Report
Sustainability in FCMBSustainability is one of our core values and sits at the heart of how we operate. Beyond this, the Nigerian Sustainable Banking Principles (NSBPs) adopted by the Bankers’ Committee of the Central Bank of Nigeria (CBN) provide a standardised framework that guides our actions towards inclusive business practices. These practices range from environment and social risk management to financial inclusion and women’s economic empowerment, among others.
Our Business Activities: Environmental and Social Risk Management
Our policies and procedures include a social and environmental management system, which is designed to minimise the risk of negative impact on the environment as a result of our operations. Thus, in addition to financial factors, our loans are evaluated through environmental and social risk parameters and in line with regulatory requirements.
Our Business Operations: Environmental and Social Footprint
We have recorded significant improvements in our efforts to reduce CO2 emissions and diesel consumption. 18 FCMB branches and 48 ATMs currently run on solar energy, the ‘lights-out policy’ by 7pm bank-wide is fully operational and our alternate banking channels have recorded a 40% increase in customer uptake. We have also deepened investment in our e-learning platform and encourage more meetings to be held online, to further reduce travel and, by extension, fuel cost.
Women’s Economic Empowerment
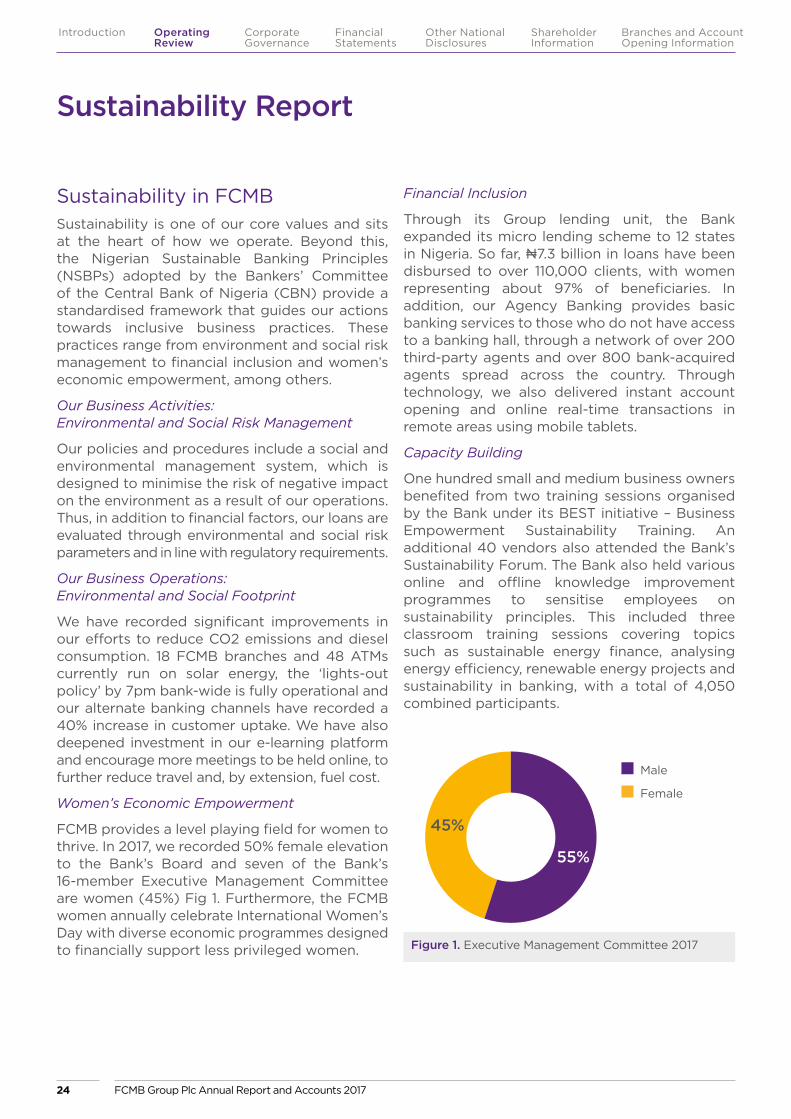
FCMB provides a level playing field for women to thrive. In 2017, we recorded 50% female elevation to the Bank’s Board and seven of the Bank’s 16-member Executive Management Committee are women (45%) Fig 1. Furthermore, the FCMB women annually celebrate International Women’s Day with diverse economic programmes designed to financially support less privileged women.
Financial Inclusion
Through its Group lending unit, the Bank expanded its micro lending scheme to 12 states in Nigeria. So far, N7.3 billion in loans have been disbursed to over 110,000 clients, with women representing about 97% of beneficiaries. In addition, our Agency Banking provides basic banking services to those who do not have access to a banking hall, through a network of over 200 third-party agents and over 800 bank-acquired agents spread across the country. Through technology, we also delivered instant account opening and online real-time transactions in remote areas using mobile tablets.
Capacity Building
One hundred small and medium business owners benefited from two training sessions organised by the Bank under its BEST initiative – Business Empowerment Sustainability Training. An additional 40 vendors also attended the Bank’s Sustainability Forum. The Bank also held various online and offline knowledge improvement programmes to sensitise employees on sustainability principles. This included three classroom training sessions covering topics such as sustainable energy finance, analysing energy efficiency, renewable energy projects and sustainability in banking, with a total of 4,050 combined participants.
Male
Female
45%
55%
Figure 1. Executive Management Committee 2017
FCMB Group Plc Annual Report and Accounts 201724
Introduction Operating Review
Corporate Governance
Financial Statements
Shareholder Information
Other National Disclosures
Branches and Account Opening Information
Awards and Recognition
FCMB received two Corporate Social Responsibility (CSR) awards:
� “The Best Environmental Supporting Financial Institution in Africa”, awarded by the African Clean-Up Initiative during The African Clean-Up Award for Excellence in Ghana.
� “The Best Company on Partnership Development”, received during the Sustainability, Enterprise and Responsibility Awards (SERAS) in November 2017.
Reporting
FCMB is fully compliant with the CBN’s biannual report requirement, in line with the NSBPs and equally submits periodic reports to the International Finance Corporation. We also create internal quarterly reports on sustainability, as well as more specific environmental management reporting.
Community Initiatives and Specific Engagements in 2017
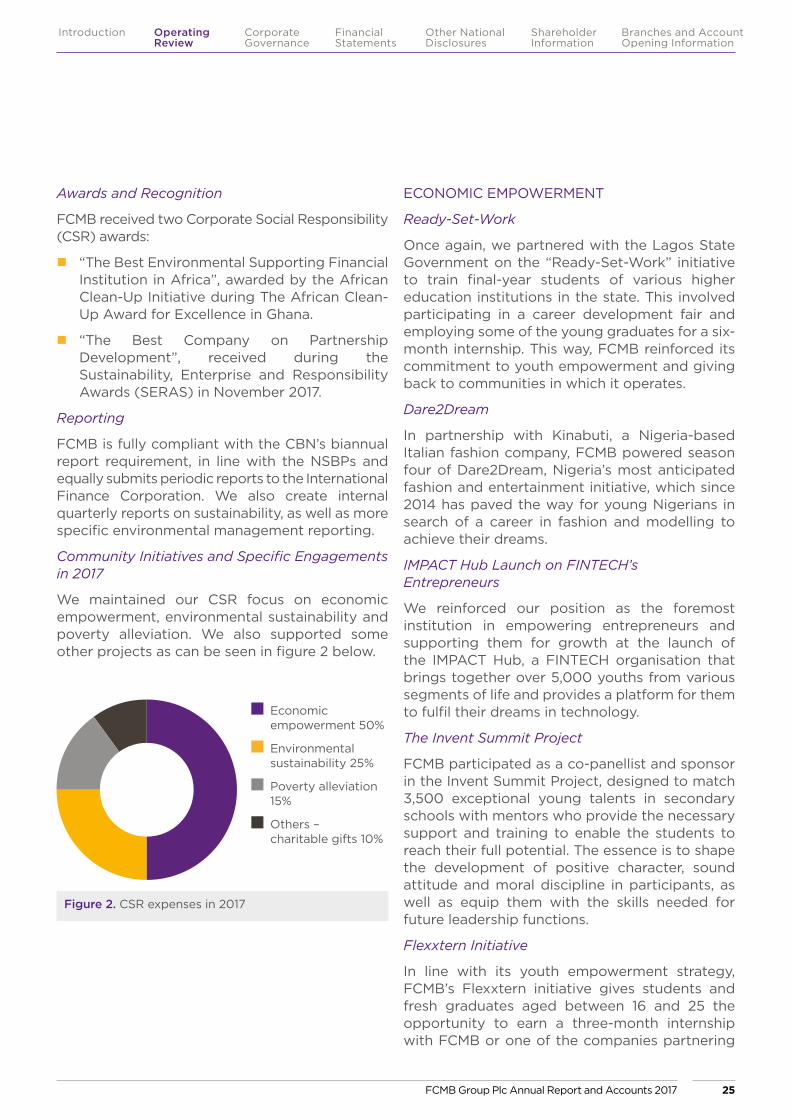
We maintained our CSR focus on economic empowerment, environmental sustainability and poverty alleviation. We also supported some other projects as can be seen in figure 2 below.
ECONOMIC EMPOWERMENT
Ready-Set-Work
Once again, we partnered with the Lagos State Government on the “Ready-Set-Work” initiative to train final-year students of various higher education institutions in the state. This involved participating in a career development fair and employing some of the young graduates for a six-month internship. This way, FCMB reinforced its commitment to youth empowerment and giving back to communities in which it operates.
Dare2Dream
In partnership with Kinabuti, a Nigeria-based Italian fashion company, FCMB powered season four of Dare2Dream, Nigeria’s most anticipated fashion and entertainment initiative, which since 2014 has paved the way for young Nigerians in search of a career in fashion and modelling to achieve their dreams.
IMPACT Hub Launch on FINTECH’s Entrepreneurs
We reinforced our position as the foremost institution in empowering entrepreneurs and supporting them for growth at the launch of the IMPACT Hub, a FINTECH organisation that brings together over 5,000 youths from various segments of life and provides a platform for them to fulfil their dreams in technology.
The Invent Summit Project
FCMB participated as a co-panellist and sponsor in the Invent Summit Project, designed to match 3,500 exceptional young talents in secondary schools with mentors who provide the necessary support and training to enable the students to reach their full potential. The essence is to shape the development of positive character, sound attitude and moral discipline in participants, as well as equip them with the skills needed for future leadership functions.
Flexxtern Initiative
In line with its youth empowerment strategy, FCMB’s Flexxtern initiative gives students and fresh graduates aged between 16 and 25 the opportunity to earn a three-month internship with FCMB or one of the companies partnering
Figure 2. CSR expenses in 2017
Economic empowerment 50%
Environmental sustainability 25%
Poverty alleviation 15%
Others – charitable gifts 10%
FCMB Group Plc Annual Report and Accounts 2017 25
Introduction Operating Review
Corporate Governance
Financial Statements
Shareholder Information
Other National Disclosures
Branches and Account Opening Information
with the Bank on the initiative. Over 200 contestants created a 45-second YouTube video of themselves to participate.
Business Empowerment on Sustainability Training (BEST)
FCMB hosted two editions of its Business Empowerment and Sustainability Training (BEST) initiative, with a total of 100 SME beneficiaries. The sessions focused on areas such as budgeting and cost management in challenging times, raising capital and getting business ready for loans or investors, and working capital management and credit sales. The initiative is part of those implemented by the Bank to support SMEs.
Empowered for the Future
The Empowered for the Future (E4F) initiative was implemented in partnership with Youth Empowerment Foundation (YEF). The 12-month vocational training, skill acquisition, job shadowing and knowledge building programme directly empowered 50 adolescents in Lagos, who in turn reached out to about 750 of their peers.
“Waste to Wealth” Initiative
FCMB partnered with Wecyclers, an award-winning company committed to improving recycling in Nigeria, to deploy an innovative waste recycling project aimed at job and wealth creation from waste. The independent contractors’ programme empowered four franchise teams and since January 2017 has diverted more than seven tonnes of recyclable items monthly, tackling the significant waste and employment issues in the country.
ENVIRONMENTAL SUSTAINABILITY
COPA Beach Soccer
For the seventh consecutive year, FCMB sponsored the exhilarating COPA Lagos Beach Soccer Tournament organised by Kinetic Sports. The annual event seeks to promote sports and tourism with a perfect blend of excitement, nature and entertainment. This past edition saw FCMB invite Recycle Points, one of its sustainability partners, to drive event location cleaning, reinforcing its reputation as a company committed to environmental sustainability.
Sustainability Report Continued
UNIBEN Flexx Hub Landscaping and Beautification
As part of activities marking the launch of the FCMB Flexx Hub in UNIBEN, the bank sponsored the landscaping and beautification of the road leading to the Flexx Hub. Creating a more beautiful environment was an opportunity to deepen the relationship between the bank and its youth customers within the citadel of learning.
Central Business District Cleaning Project
For the second year, we maintained our partnership with the Lagos State Government Central Business District (CBD) on the “Cleaner Lagos Initiative” to clean the Tinubu/Marina axis of the CBD, providing monthly salaries, equipment and apparel for the cleaners who ensure the environment stays neat.
FCMB Sponsors Project “Learn and Grow”
Working with POCADOTS Limited, FCMB built a world-class greenhouse, a herbary and a water feature at Health Body Clinic and Resort (HBC Resort), a tourist venue that attracts nature-loving individuals from home and abroad. The objectives were to support the horticultural and exotic fruit market, promote sustainable environmental development, and help disadvantaged communities create wealth by empowering women and youths to become financially independent.
World Environment Day Celebration
FCMB celebrates the annual World Environment Day (WED) to raise global awareness and take positive environmental action to protect nature and the earth. As part of our commitment to environmental sustainability, the bank organizes visits for employees to the Lekki Conservation Centre of the Nigerian Conservation Foundation to commemorate the WED, appreciate nature and learn tips on how to maintain the ecosystem.
FCMB Group Plc Annual Report and Accounts 201726
Introduction Operating Review
Corporate Governance
Financial Statements
Shareholder Information
Other National Disclosures
Branches and Account Opening Information
POVERTY ALLEVIATION
Priceless Gift of Sight
Since 2009, FCMB has partnered with Tulsi Chanrai Foundation (TCF), a Nigerian-Indian non-profit organization to deliver basic surgical intervention, eye testing and glasses to alleviate the sufferings of visually impaired Nigerians who otherwise would have lived with blindness and the attendant poverty. In 2017, FCMB sponsored over 500 surgeries, while over 1,000 outpatients were screened in three states of the country (Kebbi, Imo and Cross River states) with outreach activities in these locations.
Supporting the Less Privileged Children
FCMB has supported Bethesda Child Support Agency (BCSA) since 2007, giving scholarships to children from disadvantaged backgrounds. The laudable effort from the NGO currently includes educational sponsorship for many children, expanding the goodwill to low-income communities through sponsors such as FCMB. Our sustained support of the initiative has contributed significantly to the academic growth of the beneficiaries, despite the personal challenges they may face. We have positively impacted the lives of more than 500 children with this project.
OTHERS
Financial Literacy Day/World Savings Day Celebration
FCMB organised full interactive training sessions on financial literacy for students of 30 secondary schools in Nigeria. This is part of the Bank’s contributions towards securing the future of young Nigerians by encouraging the adoption of savings and other financial management techniques at an early age. About 5,000 students benefitted from this exercise, which was facilitated by employee volunteers of the Bank to promote financial literacy and inclusion among the citizenry. All 30 schools visited for Financial Literacy Day were again revisited in commemoration of World Savings Day.
“Corporate Challenge” Race Against Cancer
FCMB collaborated with the Nigerian Stock Exchange (NSE) on its annual 5km walk, jog or run competition designed for listed companies and capital market participants to drive awareness about cancer, as well as promote teamwork and a healthy community. The event had over 850 participants and provided an opportunity for positive competition among corporate teams. Now in its third year, the proceeds from the competition support the provision of Mobile Cancer Centres (MCCs) across Nigeria in partnership with the Community Encouraging Corporate Philanthropy (CECP).
FCMB as a Responsible Corporate Citizen
Over the years, FCMB’s role has evolved from financial intermediation to becoming an integral part of the activities of individuals, groups, businesses and society in general. Beyond the provision of financial services, we have deepened our involvement in the socio-economic well-being of our stakeholders through various initiatives.
FCMB Group Plc Annual Report and Accounts 2017 27
Introduction Operating Review
Corporate Governance
Financial Statements
Shareholder Information
Other National Disclosures
Branches and Account Opening Information

CorporateGovernance
FCMB Group Plc Annual Report and Accounts 201728
Introduction Operating Review
Corporate Governance
Financial Statements
Shareholder Information
Other National Disclosures
Branches and Account Opening Information

Board of Directors
Dr Jonathan A D Long Non-Executive Director (Chairman)Date of commencement of appointment: 19 November 2012
Mr Peter ObasekiExecutive Director (Chief Operating Officer)Date of commencement of appointment: 1 July 2013
Mr Ladi Balogun Executive Director (Group Chief Executive) Date of commencement of appointment: 14 March 2017
Mr Bismarck RewaneNon-Executive Director (Independent)Date of commencement of appointment: 19 November 2012
Mr Martin DirksNon-Executive Director Date of commencement of appointment: 25 September 2014
Alhaji Mustapha Damcida Non-Executive DirectorDate of commencement of appointment: 1 July 2013
FCMB Group Plc Annual Report and Accounts 2017 29
Introduction Operating Review
Corporate Governance
Financial Statements
Shareholder Information
Other National Disclosures
Branches and Account Opening Information

Board of DirectorsContinued
Mr Olutola O Mobolurin Non-Executive DirectorDate of commencement of appointment: 1 July 2013
Professor Oluwatoyin Ashiru Non-Executive DirectorDate of commencement of appointment: 23 December 2013
Mr Oladipupo Jadesimi Non-Executive DirectorDate of commencement of appointment: 27 December 2017
Dr (Engr) Gregory Omosigho EroNon-Executive DirectorDate of commencement of appointment: 23 December 2013
Mrs Olapeju SofoworaNon-Executive DirectorDate of commencement of appointment: 27 December 2017
Mr Olusegun Odubogun Non-Executive Director (Independent) Date of commencement of appointment: 1 July 2013
FCMB Group Plc Annual Report and Accounts 201730
Introduction Operating Review
Corporate Governance
Financial Statements
Shareholder Information
Other National Disclosures
Branches and Account Opening Information
Board Evaluation Report
12 February 2018
The Chairman Board of Directors FCMB Group Plc First City Plaza 44 Marina Lagos, Nigeria.
Report of the External Consultants on the Performance of the Board of Directors of FCMB Group Plc (FCMB Group) for the Year Ended 31 December 2017
DCSL Corporate Services Limited (DCSL) was engaged by FCMB Group Plc (“FCMB Group”) to carry out an evaluation of the performance of the Board of Directors for the year-ended 31 December 2017 in line with the provisions of Section 2.8.3 of the CBN Code of Corporate Governance for Banks and Discount Houses, 2014 (the CBN Code), Section 15.6 of the Securities and Exchange Commission Code (the SEC Code) as well as global best practices on corporate governance. The appraisal entailed a review of the Company’s corporate and statutory documents, minutes of Board and Committee meetings, policies and other ancillary documents made available to us, and the administration of questionnaires as well as interviews with the Directors and select members of the Executive Management team. To ascertain the extent of compliance with relevant corporate governance principles, and the performance of the Board in general, we benchmarked the Company’s corporate governance structures, policies and processes against the provisions of the CBN and SEC Codes as well as global best practices and considered the following seven key corporate governance themes:
1. Board Structure and Composition
2. Strategy and Planning
3. Board Operations and Effectiveness
4. Measuring and Monitoring of Performance
5. Risk Management and Compliance
6. Corporate Citizenship
7. Transparency and Disclosure
Our review of the corporate governance standards and processes affirms that the Board has substantially complied with the provisions of the CBN Code, SEC Code as well as other relevant corporate governance best practices. The Peer Assessment and Chairman’s Leadership Assessment undertaken indicate that individual Directors performed satisfactorily against the parameters used for the appraisal and remain committed to enhancing the Company’s growth.
While commending the Board for its efforts thus far towards ensuring compliance with the Code, we have recommended the need to ensure compliance with the following:
� The Board should take urgent steps to ensure compliance with the CBN’s Policy on Gender Diversity which stipulates a 30% female membership of the Board;
� The Board to treat the continuing training and development of Directors as a priority.
Other recommendations are contained in our detailed Report.
Yours faithfully,
For: DCSL Corporate Services Limited
Bisi Adeyemi Managing Director FRC/2013/NBA/00000002716
FCMB Group Plc Annual Report and Accounts 2017 31
Introduction Operating Review
Corporate Governance
Financial Statements
Shareholder Information
Other National Disclosures
Branches and Account Opening Information
Corporate Governance
Commitment to Corporate Governance
FCMB Group Plc (the Group) remains committed to institutionalising corporate governance principles. It continues to adhere to the implementation of Corporate Governance Rules of the Central Bank of Nigeria, the Nigerian Stock Exchange and the Securities and Exchange Commission.
The Group’s Board (the Board) operates in line with its responsibilities as contained in Regulatory Codes of Corporate Governance, the Company’s Articles of Association and the Companies and Allied Matters Act. Its oversight of the operations and activities of the Company are carried out transparently without undue influence.
The Company has undertaken to create an institutional framework conducive for defending the integrity of our Directors, and is convinced that on account of this, the Group’s Board is functioning in a highly effective manner. It is intended that we continue to challenge ourselves to improve in areas where the need for improvement is identified.
Board Composition and Independence
The Board is composed of 12 Directors made up of ten Non-Executive Directors and two Executive Directors, in line with international best practice which requires the number of Non-Executive Directors to be more than the Executive Directors.
The appointment of Board members is in line with the Companies and Allied Matters Act Cap C20 LFN 2004, CBN Code of Corporate Governance, and the Company’s selection criteria for Directors.
The Group’s Board, led by a Non-Executive Chairman, is composed of individuals with enviable records of achievement in their respective fields and who bring on board high levels of competencies and experience. The Board meets regularly to set broad policies for the Group’s business and operations and ensures that an objective and professional relationship is maintained with the Group’s internal and external auditors in order to promote transparency in
financial and non-financial reporting. Directors’ emoluments, as well as their shareholding information, are disclosed in the Company’s Annual Report and Accounts.
The Directors are guided by the Code of Conduct of the Central Bank of Nigeria for Directors and the Securities and Exchange Commission Code of Corporate Governance for Public Companies in Nigeria.
Changes on the Board
Following the approval of the Central Bank of Nigeria, Mr Ladi Balogun became the Group Chief Executive effective 14 March 2017, while Mr Peter Obaseki became the Chief Operating Officer.
The CBN has approved the appointments of Mr Oladipupo Jadesimi and Mrs Olapeju Sofowora as Non-Executive Directors on the Board of the Group effective 27 December 2017. Below are the profiles of the two newly appointed Directors whose appointments are being presented for shareholders’ approval:
1. Mr Oladipupo JadesimiMr Jadesimi was born on 12 July 1942. He has an Oxford MA (Honours) in Law and was a jurisprudence scholar at the University of Oxford from 1963 to 1966. He was a senior with Coopers & Lybrand, England from 1966 to 1970, and a Chartered Accountant with Coopers & Lybrand, Lagos (now Price Waterhouse Coopers) between 1970 and 1971, before moving to Nigerian Acceptances (Later NAL Plc) as General Manager, Corporate Finance and Investment Banking, a role he occupied from 1971 to 1972, with responsibility for most of the initial IPOs that were listed on the nascent Nigerian Stock Exchange.
Over the years, Mr Jadesimi has run several businesses in the energy, finance and real estate sectors. He is the Founder and Chairman of Ladol Group, the largest indigenous Free Zone Industrial Park, which hosts a variety of high-value industrial free zone enterprises. He also currently serves as the Chairman of the Board of Directors of Niger Delta Exploration and Production Plc, one of the largest indigenous integrated oil and gas producing companies.
FCMB Group Plc Annual Report and Accounts 201732
Introduction Operating Review
Corporate Governance
Financial Statements
Shareholder Information
Other National Disclosures
Branches and Account Opening Information
2. Mrs Olapeju SofoworaMrs Sofowora was born on 5 August 1964. She is a Fellow, Institute of Chartered Accountants of Nigeria (ICAN) and a member of the Chartered Institute of Taxation of Nigeria (CITN). She holds a Treasurers Dealership Certificate jointly issued by the Chartered Institute of Bankers of Nigeria (CIBN) and Money Market Association (MMAN) and is also a certified Information Systems Auditor.
The founding Partner of Abax-Oosa Professionals, a firm of Chartered Accountants, Mrs Sofowora has several years of professional work experience which cuts across banking, human resources consultancy, tax advisory, finance and accounting.
Board Selection and Appointment Process
The Board of the Company ensures a formal and transparent process for the selection and appointment of Directors to the Board. The Board Governance and Remuneration Committee plays a major role in the selection of candidates for appointment to the Board.
The process for appointing a Director includes the following:
� Careful analysis of the existing Board’s strengths and weaknesses, its skills, experience gaps and diversity considering the Company’s current business priorities and future plans;
� Identification, shortlisting and interviewing of candidates with the appropriate expertise and experience;
� Conducting formal and informal background checks to ensure they are fit and proper persons to sit on the Board of the Company;
� Discussing formally with prospective candidates concerning the Board’s expectations and the nominee’s ability to make the necessary commitment;
� The appointment process is communicated to Board members and filed by the Company Secretary;
� External consultants may be engaged as appropriate to obtain an independent view and input into the appointment process;
� Once the nomination is approved by the Board, the company secretary notifies the CBN in writing, seeking the CBN’s approval to the appointment;
� Upon approval by the CBN, the appointment and approval is communicated to the new Director in writing; and
� Other required regulatory authorities are also notified of the appointment in writing.
Existing CBN guidelines on appointment to the Board of Non-Financial Holding Companies in Nigeria shall continue to be applied.
The Guiding Principles of the Group’s Code of Corporate Governance are as follows:
� all power belongs to the shareholders;
� delegation of authority by the owners to the Board and subsequently to Board Committees and executives is clearly defined and agreed;
� institutionalised individual accountability and responsibility through empowerment and relevant authority;
� clear terms of reference and accountability for committees at Board and executive levels;
� effective communication and information sharing outside of meetings;
� actions are taken on a fully informed basis, in good faith with due diligence and care and in the best interest of the Group and shareholders;
� enhancing compliance with applicable laws and regulations and the interest of the stakeholders; where there is any conflict between the Group’s rules, the local laws and legislation supersede;
� conformity with overall Group strategy and direction; and
� transparency and full disclosure of accurate, adequate and timely information regarding the personal interest of Directors in any area of potential conflict regarding Group business.
FCMB Group Plc Annual Report and Accounts 2017 33
Introduction Operating Review
Corporate Governance
Financial Statements
Shareholder Information
Other National Disclosures
Branches and Account Opening Information
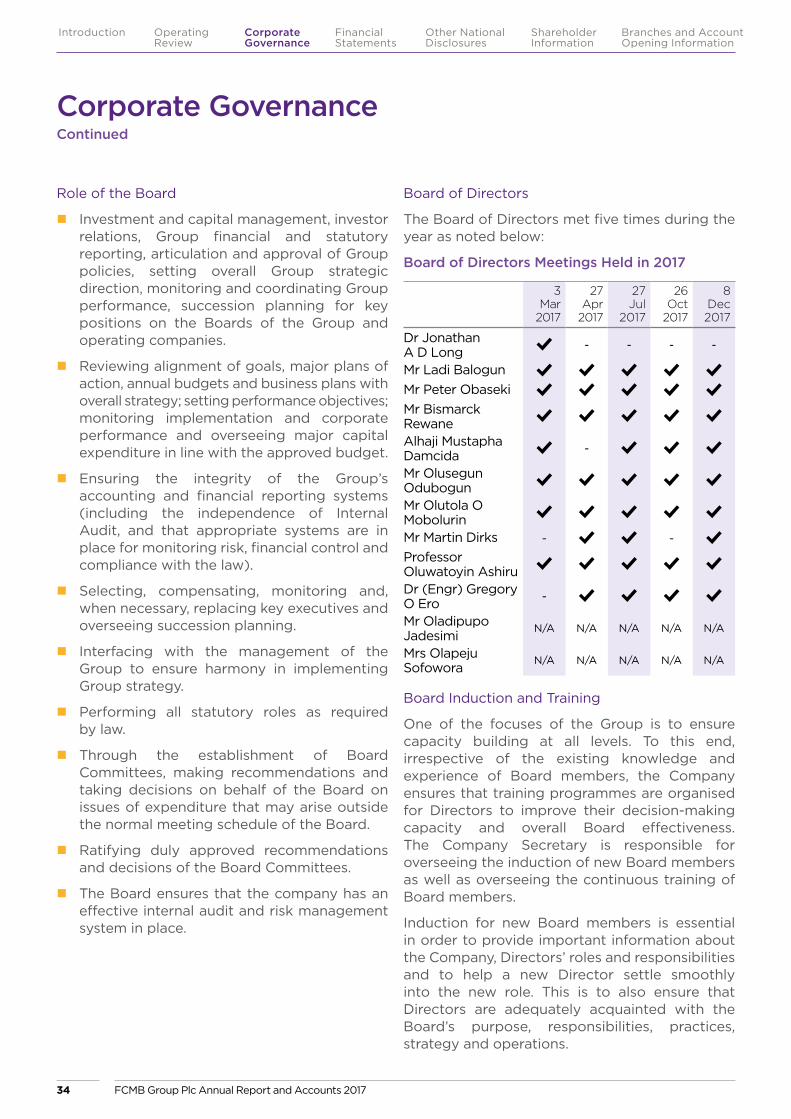
Corporate Governance Continued
Role of the Board
� Investment and capital management, investor relations, Group financial and statutory reporting, articulation and approval of Group policies, setting overall Group strategic direction, monitoring and coordinating Group performance, succession planning for key positions on the Boards of the Group and operating companies.
� Reviewing alignment of goals, major plans of action, annual budgets and business plans with overall strategy; setting performance objectives; monitoring implementation and corporate performance and overseeing major capital expenditure in line with the approved budget.
� Ensuring the integrity of the Group’s accounting and financial reporting systems (including the independence of Internal Audit, and that appropriate systems are in place for monitoring risk, financial control and compliance with the law).
� Selecting, compensating, monitoring and, when necessary, replacing key executives and overseeing succession planning.
� Interfacing with the management of the Group to ensure harmony in implementing Group strategy.
� Performing all statutory roles as required by law.
� Through the establishment of Board Committees, making recommendations and taking decisions on behalf of the Board on issues of expenditure that may arise outside the normal meeting schedule of the Board.
� Ratifying duly approved recommendations and decisions of the Board Committees.
� The Board ensures that the company has an effective internal audit and risk management system in place.
Board of Directors
The Board of Directors met five times during the year as noted below:
Board of Directors Meetings Held in 2017
3Mar
2017
27Apr
2017
27Jul
2017
26Oct
2017
8Dec2017
Dr Jonathan A D Long - - - -
Mr Ladi BalogunMr Peter ObasekiMr Bismarck RewaneAlhaji Mustapha Damcida -
Mr Olusegun OdubogunMr Olutola O MobolurinMr Martin Dirks - -
Professor Oluwatoyin AshiruDr (Engr) Gregory O Ero -
Mr Oladipupo Jadesimi
N/A N/A N/A N/A N/A
Mrs Olapeju Sofowora
N/A N/A N/A N/A N/A
Board Induction and Training
One of the focuses of the Group is to ensure capacity building at all levels. To this end, irrespective of the existing knowledge and experience of Board members, the Company ensures that training programmes are organised for Directors to improve their decision-making capacity and overall Board effectiveness. The Company Secretary is responsible for overseeing the induction of new Board members as well as overseeing the continuous training of Board members.
Induction for new Board members is essential in order to provide important information about the Company, Directors’ roles and responsibilities and to help a new Director settle smoothly into the new role. This is to also ensure that Directors are adequately acquainted with the Board’s purpose, responsibilities, practices, strategy and operations.
FCMB Group Plc Annual Report and Accounts 201734
Introduction Operating Review
Corporate Governance
Financial Statements
Shareholder Information
Other National Disclosures
Branches and Account Opening Information
Furthermore, the induction programme is aimed at deepening Directors’ understanding of the Company, and the environment and markets in which it operates. The programme may include formal/informal discussions with executive management, provision of reading materials or workshops.
The Company Secretary oversees the provision of additional training to Directors on a continuous basis to enable them to gain a broader understanding and knowledge of the Bank and the regulatory and competitive environment in which it operates.
The Company encourages and supports other informal training programmes for Directors, such as subscriptions to industry journals towards building relevant skills and interactive sessions at Board meetings whereby an external facilitator or a specialist from the Group facilitates sessions in specific areas of interest.
Notwithstanding the Company’s responsibilities, each Director has a personal responsibility to ensure that he or she remains current and up to date regarding the strategies and businesses of the Company as well as the industry and macro-economic environment in which it operates.
Re-Election of Directors
Pursuant to section 259 (1) and (3) of the Companies and Allied Matters Act, Cap C20 LFN, 2004, three of the Directors are due for retirement by rotation and have offered themselves for re-election by the Annual General Meeting. They are:
1. Mr Olutola MobolurinMr Mobolurin holds a BSc in Accounting and Finance from the York University, New York and an MBA from York University, Toronto. He is a Fellow of the Chartered Institute of Stockbrokers. He has over 30 years of varied exposure and experience in the financial services industry. He began his career as an investment executive at Plateau Investments Company in 1977 before joining City Securities Limited in 1978. He joined Continental Merchant Bank Limited in 1979, rising to Head of Corporate Finance before leaving in 1988. He subsequently worked with Capital Bancorp Ltd as Managing Director from 1988 to 2006. He joined Crusader (Nigeria) Plc as Vice Chairman and Group Chief Executive Officer in 2007 and remained there until his retirement in 2014.
2. Prof. Oluwatoyin AshiruProfessor Ashiru is a graduate of the University of Sussex, Brighton, UK, where he obtained a BSc in Materials Science and Engineering. He concluded his PhD in Industrial Metallurgy at the University of Birmingham, UK.
He is an accomplished materials and metallurgical engineer with over 30 years of comprehensive professional experience in academia, entrepreneurship, management engineering, technologies invention and consulting for the enhancement of productivity in major industries worldwide. He is currently the Managing Director and CEO of Tricontinental Oil Services Ltd.
He holds USA, British, European, Brazilian and other international patents for products and systems he has invented. He is a recipient of several international merit awards with listings in Who’s Who in the Dictionary of International Biography.
3. Dr (Engr) Gregory O EroDr Ero is a graduate of the University of Ibadan with a BSc (Hons) in Chemistry. He obtained an MSc and DIC in Petroleum Engineering from Imperial College, London, and a DMS from Templeton College, University of Oxford, then furthered his studies at the Graduate School of Business, University of Columbia, New York, and the Institute of Management Development, Lausanne, Switzerland.
He began his career as a petroleum engineer in the Lagos office of the Federal Ministry of Petroleum and Energy and thereafter, was posted to Warri as Head, Federal Ministry of Petroleum Resources. He spent much of his career in public service where he served in many capacities spanning three decades. He also served on the boards of many federal government parastatals including the Economic and Finance Committee of the Federal Government and Petroleum Training Institute, Warri among others.
Dr Ero is a Fellow of many professional bodies and is presently the Chairman/CEO of Arkleen Oil & Gas Limited and Chairman, Cardinal Drilling Company Limited, among others.
FCMB Group Plc Annual Report and Accounts 2017 35
Introduction Operating Review
Corporate Governance
Financial Statements
Shareholder Information
Other National Disclosures
Branches and Account Opening Information
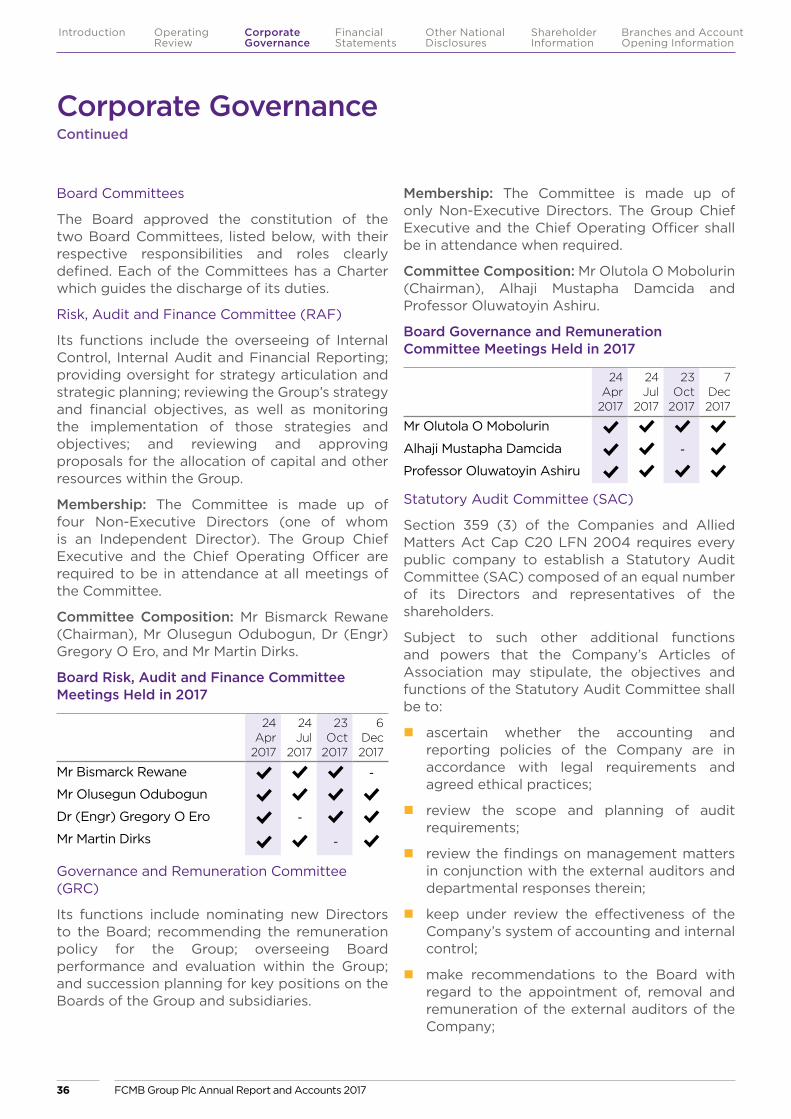
Corporate Governance Continued
Board Committees
The Board approved the constitution of the two Board Committees, listed below, with their respective responsibilities and roles clearly defined. Each of the Committees has a Charter which guides the discharge of its duties.
Risk, Audit and Finance Committee (RAF)
Its functions include the overseeing of Internal Control, Internal Audit and Financial Reporting; providing oversight for strategy articulation and strategic planning; reviewing the Group’s strategy and financial objectives, as well as monitoring the implementation of those strategies and objectives; and reviewing and approving proposals for the allocation of capital and other resources within the Group.
Membership: The Committee is made up of four Non-Executive Directors (one of whom is an Independent Director). The Group Chief Executive and the Chief Operating Officer are required to be in attendance at all meetings of the Committee.
Committee Composition: Mr Bismarck Rewane (Chairman), Mr Olusegun Odubogun, Dr (Engr) Gregory O Ero, and Mr Martin Dirks.
Board Risk, Audit and Finance Committee Meetings Held in 2017
24Apr
2017
24Jul
2017
23Oct
2017
6Dec2017
Mr Bismarck Rewane -
Mr Olusegun Odubogun
Dr (Engr) Gregory O Ero -
Mr Martin Dirks -
Governance and Remuneration Committee (GRC)
Its functions include nominating new Directors to the Board; recommending the remuneration policy for the Group; overseeing Board performance and evaluation within the Group; and succession planning for key positions on the Boards of the Group and subsidiaries.
Membership: The Committee is made up of only Non-Executive Directors. The Group Chief Executive and the Chief Operating Officer shall be in attendance when required.
Committee Composition: Mr Olutola O Mobolurin (Chairman), Alhaji Mustapha Damcida and Professor Oluwatoyin Ashiru.
Board Governance and Remuneration Committee Meetings Held in 2017
24Apr
2017
24Jul
2017
23Oct
2017
7Dec2017
Mr Olutola O Mobolurin
Alhaji Mustapha Damcida -
Professor Oluwatoyin Ashiru
Statutory Audit Committee (SAC)
Section 359 (3) of the Companies and Allied Matters Act Cap C20 LFN 2004 requires every public company to establish a Statutory Audit Committee (SAC) composed of an equal number of its Directors and representatives of the shareholders.
Subject to such other additional functions and powers that the Company’s Articles of Association may stipulate, the objectives and functions of the Statutory Audit Committee shall be to:
� ascertain whether the accounting and reporting policies of the Company are in accordance with legal requirements and agreed ethical practices;
� review the scope and planning of audit requirements;
� review the findings on management matters in conjunction with the external auditors and departmental responses therein;
� keep under review the effectiveness of the Company’s system of accounting and internal control;
� make recommendations to the Board with regard to the appointment of, removal and remuneration of the external auditors of the Company;
FCMB Group Plc Annual Report and Accounts 201736
Introduction Operating Review
Corporate Governance
Financial Statements
Shareholder Information
Other National Disclosures
Branches and Account Opening Information
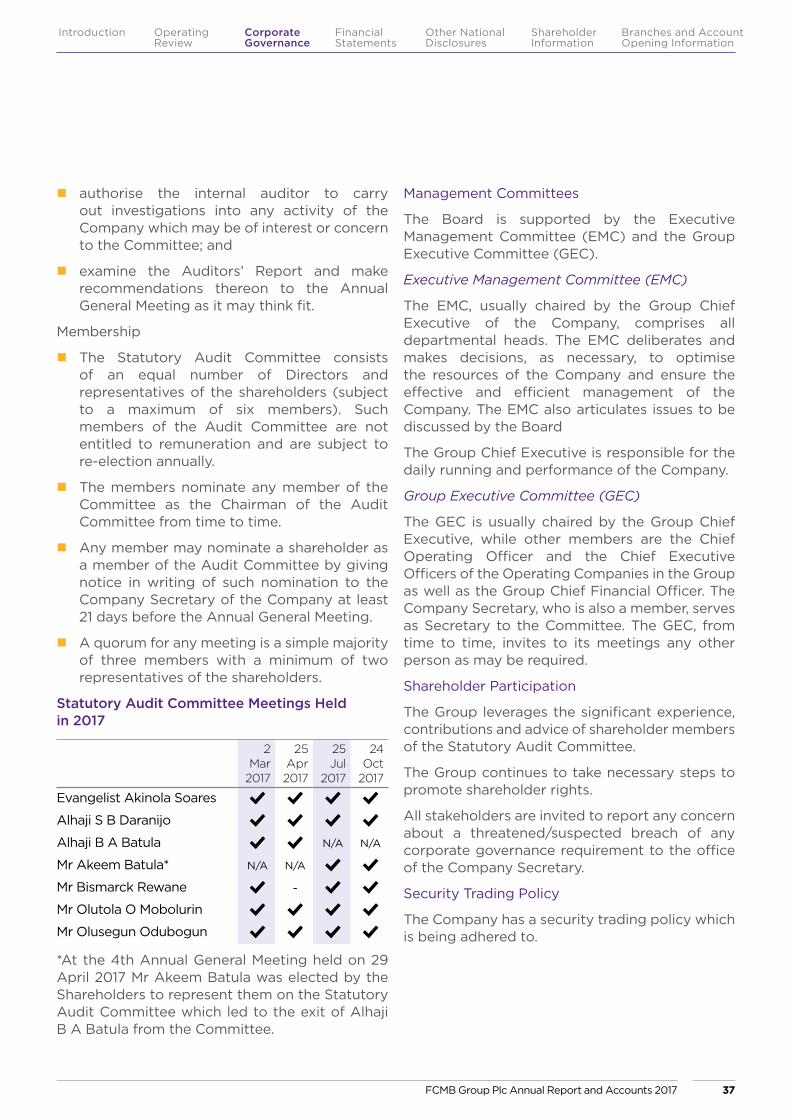
� authorise the internal auditor to carry out investigations into any activity of the Company which may be of interest or concern to the Committee; and
� examine the Auditors’ Report and make recommendations thereon to the Annual General Meeting as it may think fit.
Membership
� The Statutory Audit Committee consists of an equal number of Directors and representatives of the shareholders (subject to a maximum of six members). Such members of the Audit Committee are not entitled to remuneration and are subject to re-election annually.
� The members nominate any member of the Committee as the Chairman of the Audit Committee from time to time.
� Any member may nominate a shareholder as a member of the Audit Committee by giving notice in writing of such nomination to the Company Secretary of the Company at least 21 days before the Annual General Meeting.
� A quorum for any meeting is a simple majority of three members with a minimum of two representatives of the shareholders.
Statutory Audit Committee Meetings Held in 2017
2 Mar
2017
25 Apr 2017
25 Jul
2017
24 Oct
2017
Evangelist Akinola Soares
Alhaji S B Daranijo
Alhaji B A Batula N/A N/A
Mr Akeem Batula* N/A N/A
Mr Bismarck Rewane -
Mr Olutola O Mobolurin
Mr Olusegun Odubogun
*At the 4th Annual General Meeting held on 29 April 2017 Mr Akeem Batula was elected by the Shareholders to represent them on the Statutory Audit Committee which led to the exit of Alhaji B A Batula from the Committee.
Management Committees
The Board is supported by the Executive Management Committee (EMC) and the Group Executive Committee (GEC).
Executive Management Committee (EMC)
The EMC, usually chaired by the Group Chief Executive of the Company, comprises all departmental heads. The EMC deliberates and makes decisions, as necessary, to optimise the resources of the Company and ensure the effective and efficient management of the Company. The EMC also articulates issues to be discussed by the Board
The Group Chief Executive is responsible for the daily running and performance of the Company.
Group Executive Committee (GEC)
The GEC is usually chaired by the Group Chief Executive, while other members are the Chief Operating Officer and the Chief Executive Officers of the Operating Companies in the Group as well as the Group Chief Financial Officer. The Company Secretary, who is also a member, serves as Secretary to the Committee. The GEC, from time to time, invites to its meetings any other person as may be required.
Shareholder Participation
The Group leverages the significant experience, contributions and advice of shareholder members of the Statutory Audit Committee.
The Group continues to take necessary steps to promote shareholder rights.
All stakeholders are invited to report any concern about a threatened/suspected breach of any corporate governance requirement to the office of the Company Secretary.
Security Trading Policy
The Company has a security trading policy which is being adhered to.
FCMB Group Plc Annual Report and Accounts 2017 37
Introduction Operating Review
Corporate Governance
Financial Statements
Shareholder Information
Other National Disclosures
Branches and Account Opening Information
Corporate Governance Continued
Whistle-Blowing Procedures
The Board has a duty to conduct the Group’s affairs in a responsible and transparent manner and to take into account legal and regulatory requirements under which the Group operates. The Board is also committed to the principle of sound corporate governance and behaviour as enunciated in the CBN Code of Corporate Governance for banks and other financial institutions in Nigeria. One of the several ways a breach of regulatory requirements and management and staff misconduct can be addressed is through a whistle-blowing programme.
As such, the whistle-blowing policy and procedures of the Group are designed to encourage stakeholders to bring unethical conduct and illegal violations to the attention of an internal and/or supervising authority so that action can be taken to resolve the problem. All stakeholders are provided with the details of the Ethics Line facilities via the Group’s website. The Ethics Line facilities include: 0703-000-0026, 0703-000-0027, 0708-060-1222 and 0808-822-8888.
Statement of Compliance with SEC Code of Corporate Governance
In compliance with Section 34.7 of the SEC Code of Corporate Governance for Public Companies in Nigeria (the Code) which governs the operations of FCMB Group Plc, the Board confirms compliance with the Code as disclosed in the Annual Report and Accounts.
Disclosure to the Shareholders
Directors’ Fees:The Directors’ fees for the financial year ending 31 December 2018 shall be fixed at N200,000,000.00 only and a resolution to approve the same shall be proposed.
Directors’ Age
In compliance with Section 252 (1) of the Companies and Allied Matters Act Cap C20 LFN 2004, which requires that a Director of a public company who is 70 years or more should be disclosed to the members at the general meeting, the Directors hereby make the following disclosure:
1. Mr Oladipupo Jadesimi – will be 76 years on 12 July 2018.
2. Dr (Engr) Gregory Ero – 70 years as at 1 July 2017.
3. Dr Jonathan A D Long – 70 years as at 17 August 2017.
Post Audit Events
i. At the Board of Directors’ meeting held on March 8, 2018, the Board considered and approved the election of Mr Oladipupo Jadesimi as the new Chairman of the Company.
ii. The Board also considered and approved the appointment of Mr Adam Nuru (the MD of its banking subsidiary) as a Non-Executive Director on the Board of the Company.
Mrs Funmi Adedibu Company SecretaryFRC/2014/NBA/00000005887
FCMB Group Plc Annual Report and Accounts 201738
Introduction Operating Review
Corporate Governance
Financial Statements
Shareholder Information
Other National Disclosures
Branches and Account Opening Information
To the Board of Directors of FCMB Group Plc
In compliance with Section 34 (2) Code of Corporate Governance for Public Companies in Nigeria of the Securities and Exchange Commission, we certify that the financial statements of FCMB Group Plc (Separate and Consolidated), comprising of statements of financial position, statements of profit or loss and other comprehensive income, statements of changes in equity, statement of cash flows and the accompanying notes to the account for the year ended 31 December 2017 present a true and fair view of the affairs of the Company and the Group.
Kayode Adewuyi Ladi BalogunChief Financial Officer Group Chief ExecutiveFRC/2014/ICAN/00000006884 FRC/2013/IODN/00000001460
08 March 2018 08 March 2018
FCMB Group Plc Annual Report and Accounts 2017 39
Introduction Operating Review
Corporate Governance
Financial Statements
Shareholder Information
Other National Disclosures
Branches and Account Opening Information
Management Report on Certification of Financial Statements

Financial Statements
FCMB Group Plc Annual Report and Accounts 201740
Introduction Operating Review
Corporate Governance
Financial Statements
Shareholder Information
Other National Disclosures
Branches and Account Opening Information
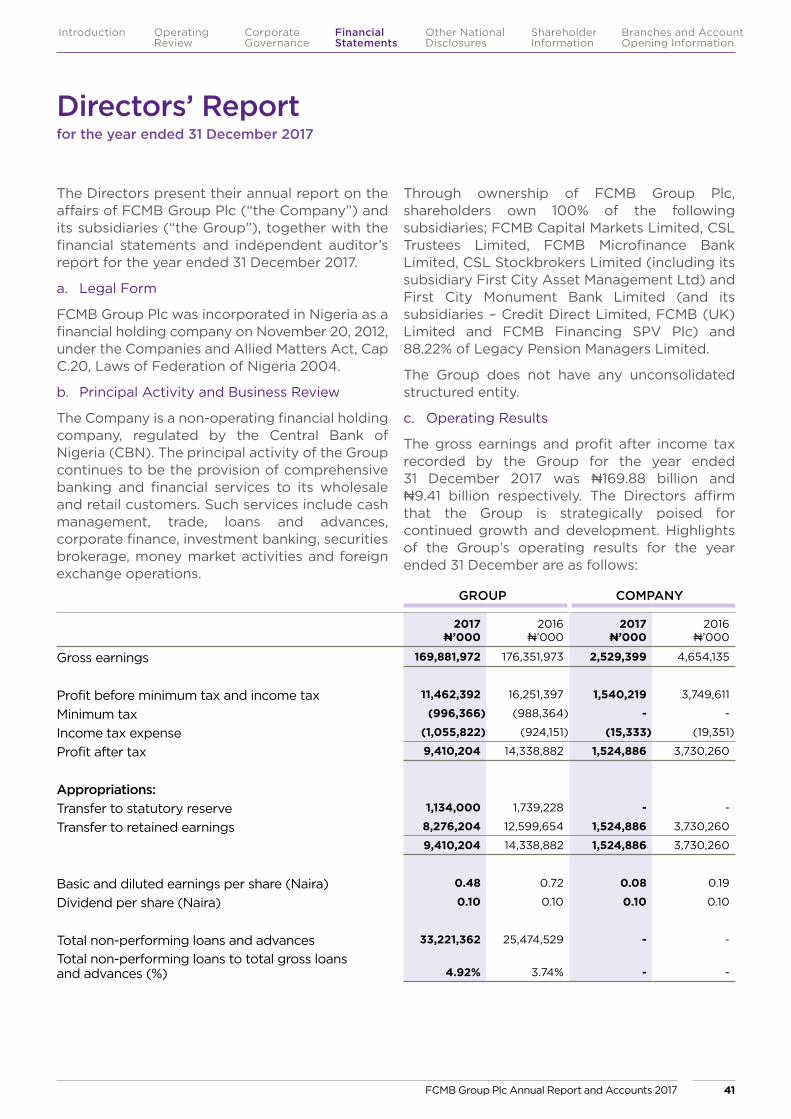
Financial Statements
Directors’ Report for the year ended 31 December 2017
The Directors present their annual report on the affairs of FCMB Group Plc (“the Company”) and its subsidiaries (“the Group”), together with the financial statements and independent auditor’s report for the year ended 31 December 2017.
a. Legal Form
FCMB Group Plc was incorporated in Nigeria as a financial holding company on November 20, 2012, under the Companies and Allied Matters Act, Cap C.20, Laws of Federation of Nigeria 2004.
b. Principal Activity and Business Review
The Company is a non-operating financial holding company, regulated by the Central Bank of Nigeria (CBN). The principal activity of the Group continues to be the provision of comprehensive banking and financial services to its wholesale and retail customers. Such services include cash management, trade, loans and advances, corporate finance, investment banking, securities brokerage, money market activities and foreign exchange operations.
Through ownership of FCMB Group Plc, shareholders own 100% of the following subsidiaries; FCMB Capital Markets Limited, CSL Trustees Limited, FCMB Microfinance Bank Limited, CSL Stockbrokers Limited (including its subsidiary First City Asset Management Ltd) and First City Monument Bank Limited (and its subsidiaries – Credit Direct Limited, FCMB (UK) Limited and FCMB Financing SPV Plc) and 88.22% of Legacy Pension Managers Limited.
The Group does not have any unconsolidated structured entity.
c. Operating Results
The gross earnings and profit after income tax recorded by the Group for the year ended 31 December 2017 was N169.88 billion and N9.41 billion respectively. The Directors affirm that the Group is strategically poised for continued growth and development. Highlights of the Group’s operating results for the year ended 31 December are as follows:
GROUP COMPANY
2017 N’000
2016 N’000
2017 N’000
2016 N’000
Gross earnings 169,881,972 176,351,973 2,529,399 4,654,135
Profit before minimum tax and income tax 11,462,392 16,251,397 1,540,219 3,749,611
Minimum tax (996,366) (988,364) - -
Income tax expense (1,055,822) (924,151) (15,333) (19,351)
Profit after tax 9,410,204 14,338,882 1,524,886 3,730,260
Appropriations:Transfer to statutory reserve 1,134,000 1,739,228 - -
Transfer to retained earnings 8,276,204 12,599,654 1,524,886 3,730,260
9,410,204 14,338,882 1,524,886 3,730,260
Basic and diluted earnings per share (Naira) 0.48 0.72 0.08 0.19
Dividend per share (Naira) 0.10 0.10 0.10 0.10
Total non-performing loans and advances 33,221,362 25,474,529 - -
Total non-performing loans to total gross loans and advances (%) 4.92% 3.74% - -
FCMB Group Plc Annual Report and Accounts 2017 41
Introduction Operating Review
Corporate Governance
Financial Statements
Shareholder Information
Other National Disclosures
Branches and Account Opening Information

Proposed Dividend
The Board of Directors recommended a cash dividend of 10 kobo per issued and paid up ordinary share for the year ended 31 December 2017 (2016: 10 kobo). This is subject to approval at the Annual General Meeting.
Payment of dividends is subject to withholding tax at a rate of 10% in the hand of recipients.
d. Directors’ Shareholding
The direct and indirect interests of directors in the issued share capital of the Company as recorded in the register of directors shareholding and/or as notified by the Directors for the purposes of sections 275 and 276 of the Companies and Allied Matters Act Cap C20, Laws of the Federation of Nigeria 2004 and listing requirements of the Nigerian Stock Exchange are as noted below:
Shareholding as at 31 December 2017
Number of 50k Ordinary Shares held
Shareholding as at 31 December 2016
Number of 50k Ordinary Shares held
Direct holdings
Indirect holdings
Direct holdings
Indirect holdings
Dr Jonathan A D Long (Chairman) 11,149,220 - 11,149,220 -
Mr Ladipupo O. Balogun (Group Chief Executive) 200,166,756 - 200,166,756 -
Mr Peter Obaseki (Chief Operating Officer) 5,369,945 - 5,369,945 -
Mr Bismarck Rewane (Non-Executive Independent Director) 1,112,280 - 1,112,280 -
Mr Olusegun Odubogun (Non-Executive Independent Director) 400,000 - 400,000 -
Alhaji Mustapha Damcida (Non-Executive Director) - - - -
Mr Olutola O. Mobolurin (Non-Executive Director) 2,120,000 - 2,120,000 -
Mr Martin Dirks (Non-Executive Director) 3,400,000 - - -
Professor Oluwatoyin Ashiru (Non Executive Director) 2,055,187 - 2,055,187 -
Dr (Engr) Gregory O. Ero (Non-Executive Director) - - - -
Mr Jadesimi Ladi (Non-Executive Director) 190,463,000 - - -
Mrs Olapeju Eniola Sofowora (Non-Executive Director) - - - -
Directors’ Report for the year ended 31 December 2017 continued
FCMB Group Plc Annual Report and Accounts 201742
Introduction Operating Review
Corporate Governance
Financial Statements
Shareholder Information
Other National Disclosures
Branches and Account Opening Information
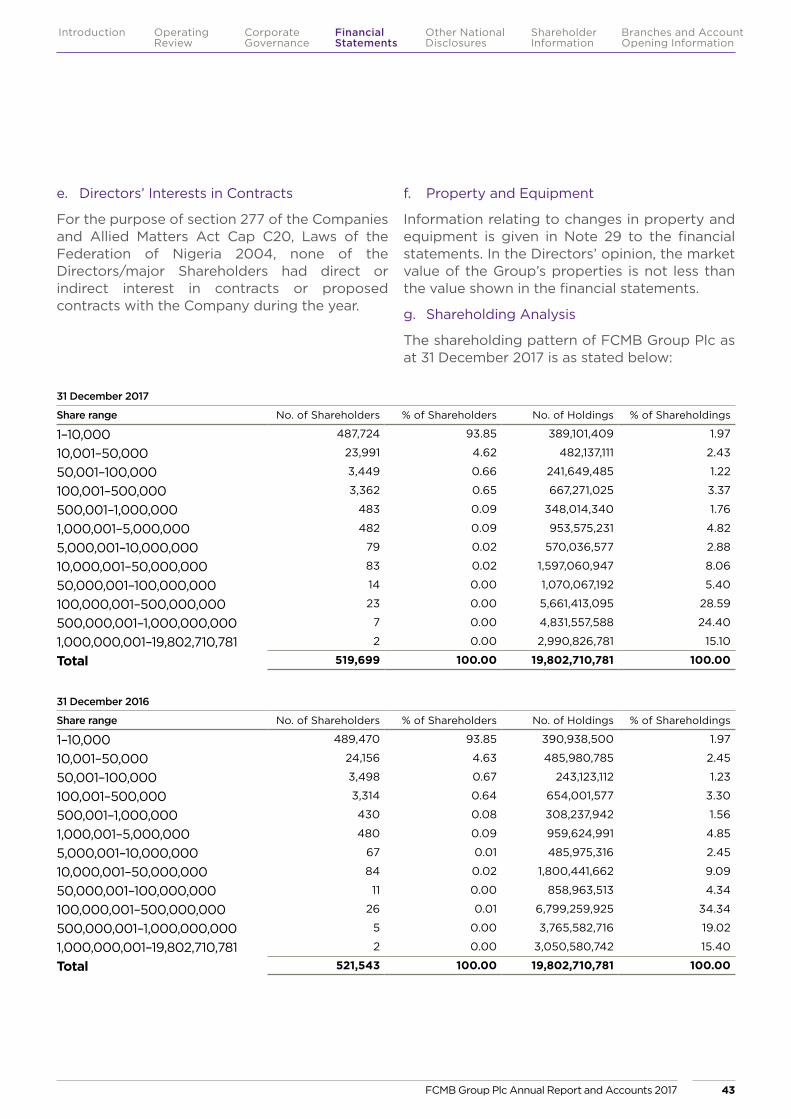
e. Directors’ Interests in Contracts
For the purpose of section 277 of the Companies and Allied Matters Act Cap C20, Laws of the Federation of Nigeria 2004, none of the Directors/major Shareholders had direct or indirect interest in contracts or proposed contracts with the Company during the year.
f. Property and Equipment
Information relating to changes in property and equipment is given in Note 29 to the financial statements. In the Directors’ opinion, the market value of the Group’s properties is not less than the value shown in the financial statements.
g. Shareholding Analysis
The shareholding pattern of FCMB Group Plc as at 31 December 2017 is as stated below:
31 December 2017
Share range No. of Shareholders % of Shareholders No. of Holdings % of Shareholdings
1–10,000 487,724 93.85 389,101,409 1.97
10,001–50,000 23,991 4.62 482,137,111 2.43
50,001–100,000 3,449 0.66 241,649,485 1.22
100,001–500,000 3,362 0.65 667,271,025 3.37
500,001–1,000,000 483 0.09 348,014,340 1.76
1,000,001–5,000,000 482 0.09 953,575,231 4.82
5,000,001–10,000,000 79 0.02 570,036,577 2.88
10,000,001–50,000,000 83 0.02 1,597,060,947 8.06
50,000,001–100,000,000 14 0.00 1,070,067,192 5.40
100,000,001–500,000,000 23 0.00 5,661,413,095 28.59
500,000,001–1,000,000,000 7 0.00 4,831,557,588 24.40
1,000,000,001–19,802,710,781 2 0.00 2,990,826,781 15.10
Total 519,699 100.00 19,802,710,781 100.00
31 December 2016
Share range No. of Shareholders % of Shareholders No. of Holdings % of Shareholdings
1–10,000 489,470 93.85 390,938,500 1.97
10,001–50,000 24,156 4.63 485,980,785 2.45
50,001–100,000 3,498 0.67 243,123,112 1.23
100,001–500,000 3,314 0.64 654,001,577 3.30
500,001–1,000,000 430 0.08 308,237,942 1.56
1,000,001–5,000,000 480 0.09 959,624,991 4.85
5,000,001–10,000,000 67 0.01 485,975,316 2.45
10,000,001–50,000,000 84 0.02 1,800,441,662 9.09
50,000,001–100,000,000 11 0.00 858,963,513 4.34
100,000,001–500,000,000 26 0.01 6,799,259,925 34.34
500,000,001–1,000,000,000 5 0.00 3,765,582,716 19.02
1,000,000,001–19,802,710,781 2 0.00 3,050,580,742 15.40
Total 521,543 100.00 19,802,710,781 100.00
FCMB Group Plc Annual Report and Accounts 2017 43
Introduction Operating Review
Corporate Governance
Financial Statements
Shareholder Information
Other National Disclosures
Branches and Account Opening Information
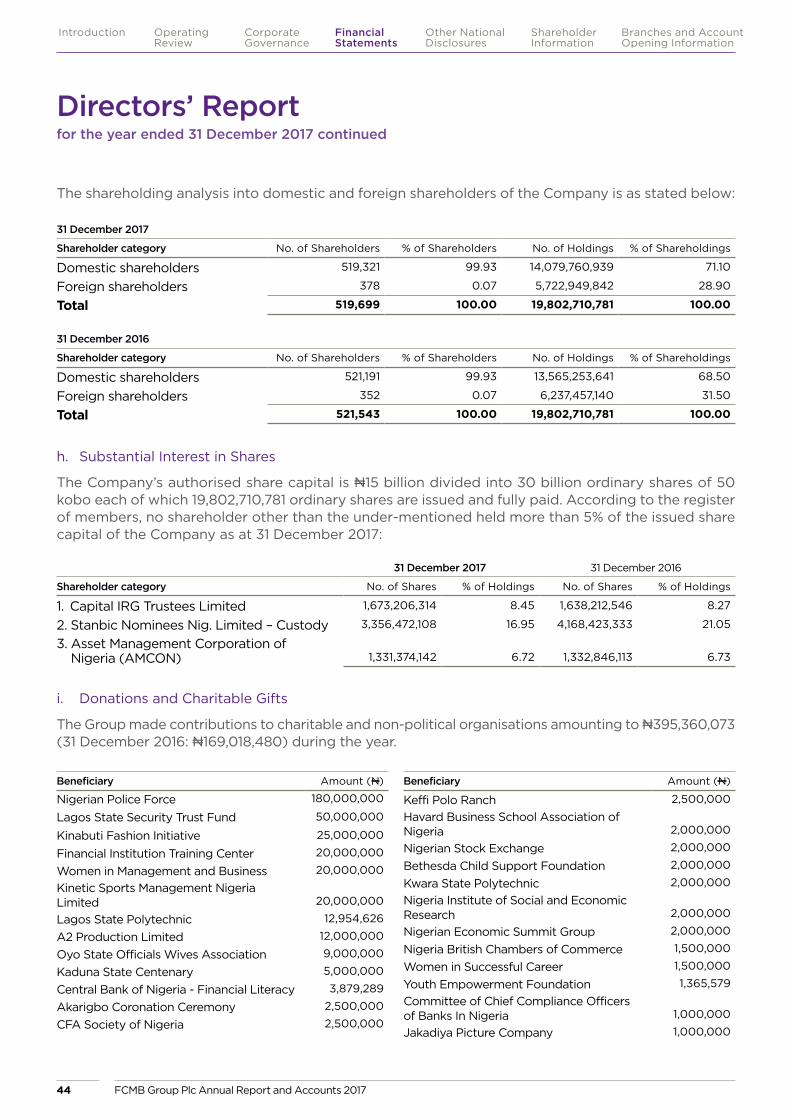
h. Substantial Interest in Shares
The Company’s authorised share capital is N15 billion divided into 30 billion ordinary shares of 50 kobo each of which 19,802,710,781 ordinary shares are issued and fully paid. According to the register of members, no shareholder other than the under-mentioned held more than 5% of the issued share capital of the Company as at 31 December 2017:
i. Donations and Charitable Gifts
The Group made contributions to charitable and non-political organisations amounting to N395,360,073 (31 December 2016: N169,018,480) during the year.
The shareholding analysis into domestic and foreign shareholders of the Company is as stated below:
31 December 2017
Shareholder category No. of Shareholders % of Shareholders No. of Holdings % of Shareholdings
Domestic shareholders 519,321 99.93 14,079,760,939 71.10
Foreign shareholders 378 0.07 5,722,949,842 28.90
Total 519,699 100.00 19,802,710,781 100.00
31 December 2016
Shareholder category No. of Shareholders % of Shareholders No. of Holdings % of Shareholdings
Domestic shareholders 521,191 99.93 13,565,253,641 68.50
Foreign shareholders 352 0.07 6,237,457,140 31.50
Total 521,543 100.00 19,802,710,781 100.00
31 December 2017 31 December 2016
Shareholder category No. of Shares % of Holdings No. of Shares % of Holdings
1. Capital IRG Trustees Limited 1,673,206,314 8.45 1,638,212,546 8.27
2. Stanbic Nominees Nig. Limited – Custody 3,356,472,108 16.95 4,168,423,333 21.05
3. Asset Management Corporation of Nigeria (AMCON) 1,331,374,142 6.72 1,332,846,113 6.73
Beneficiary Amount (N)
Nigerian Police Force 180,000,000
Lagos State Security Trust Fund 50,000,000
Kinabuti Fashion Initiative 25,000,000
Financial Institution Training Center 20,000,000
Women in Management and Business 20,000,000
Kinetic Sports Management Nigeria Limited 20,000,000
Lagos State Polytechnic 12,954,626
A2 Production Limited 12,000,000
Oyo State Officials Wives Association 9,000,000
Kaduna State Centenary 5,000,000
Central Bank of Nigeria - Financial Literacy 3,879,289
Akarigbo Coronation Ceremony 2,500,000
CFA Society of Nigeria 2,500,000
Beneficiary Amount (N)
Keffi Polo Ranch 2,500,000
Havard Business School Association of Nigeria 2,000,000
Nigerian Stock Exchange 2,000,000
Bethesda Child Support Foundation 2,000,000
Kwara State Polytechnic 2,000,000
Nigeria Institute of Social and Economic Research 2,000,000
Nigerian Economic Summit Group 2,000,000
Nigeria British Chambers of Commerce 1,500,000
Women in Successful Career 1,500,000
Youth Empowerment Foundation 1,365,579
Committee of Chief Compliance Officers of Banks In Nigeria 1,000,000
Jakadiya Picture Company 1,000,000
Directors’ Report for the year ended 31 December 2017 continued
FCMB Group Plc Annual Report and Accounts 201744
Introduction Operating Review
Corporate Governance
Financial Statements
Shareholder Information
Other National Disclosures
Branches and Account Opening Information
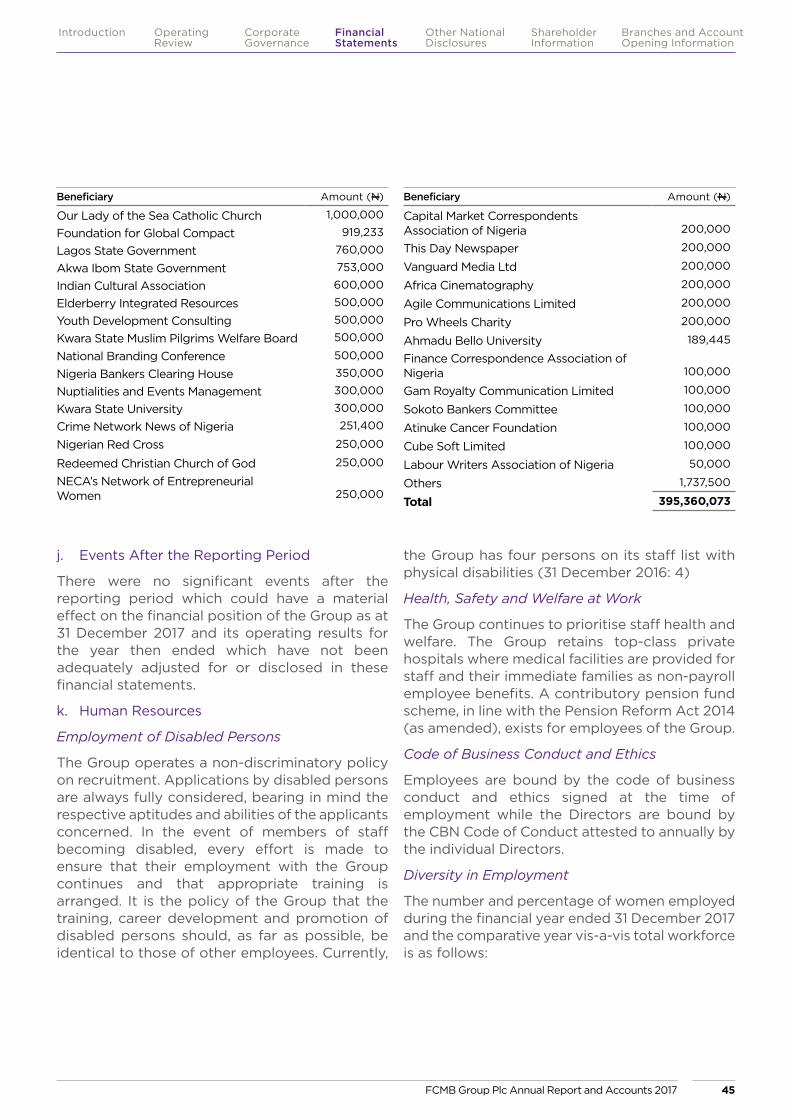
Beneficiary Amount (N)
Our Lady of the Sea Catholic Church 1,000,000
Foundation for Global Compact 919,233
Lagos State Government 760,000
Akwa Ibom State Government 753,000
Indian Cultural Association 600,000
Elderberry Integrated Resources 500,000
Youth Development Consulting 500,000
Kwara State Muslim Pilgrims Welfare Board 500,000
National Branding Conference 500,000
Nigeria Bankers Clearing House 350,000
Nuptialities and Events Management 300,000
Kwara State University 300,000
Crime Network News of Nigeria 251,400
Nigerian Red Cross 250,000
Redeemed Christian Church of God 250,000
NECA’s Network of Entrepreneurial Women 250,000
Beneficiary Amount (N)
Capital Market Correspondents Association of Nigeria 200,000
This Day Newspaper 200,000
Vanguard Media Ltd 200,000
Africa Cinematography 200,000
Agile Communications Limited 200,000
Pro Wheels Charity 200,000
Ahmadu Bello University 189,445
Finance Correspondence Association of Nigeria 100,000
Gam Royalty Communication Limited 100,000
Sokoto Bankers Committee 100,000
Atinuke Cancer Foundation 100,000
Cube Soft Limited 100,000
Labour Writers Association of Nigeria 50,000
Others 1,737,500
Total 395,360,073
j. Events After the Reporting Period
There were no significant events after the reporting period which could have a material effect on the financial position of the Group as at 31 December 2017 and its operating results for the year then ended which have not been adequately adjusted for or disclosed in these financial statements.
k. Human Resources
Employment of Disabled Persons
The Group operates a non-discriminatory policy on recruitment. Applications by disabled persons are always fully considered, bearing in mind the respective aptitudes and abilities of the applicants concerned. In the event of members of staff becoming disabled, every effort is made to ensure that their employment with the Group continues and that appropriate training is arranged. It is the policy of the Group that the training, career development and promotion of disabled persons should, as far as possible, be identical to those of other employees. Currently,
the Group has four persons on its staff list with physical disabilities (31 December 2016: 4)
Health, Safety and Welfare at Work
The Group continues to prioritise staff health and welfare. The Group retains top-class private hospitals where medical facilities are provided for staff and their immediate families as non-payroll employee benefits. A contributory pension fund scheme, in line with the Pension Reform Act 2014 (as amended), exists for employees of the Group.
Code of Business Conduct and Ethics
Employees are bound by the code of business conduct and ethics signed at the time of employment while the Directors are bound by the CBN Code of Conduct attested to annually by the individual Directors.
Diversity in Employment
The number and percentage of women employed during the financial year ended 31 December 2017 and the comparative year vis-a-vis total workforce is as follows:
FCMB Group Plc Annual Report and Accounts 2017 45
Introduction Operating Review
Corporate Governance
Financial Statements
Shareholder Information
Other National Disclosures
Branches and Account Opening Information
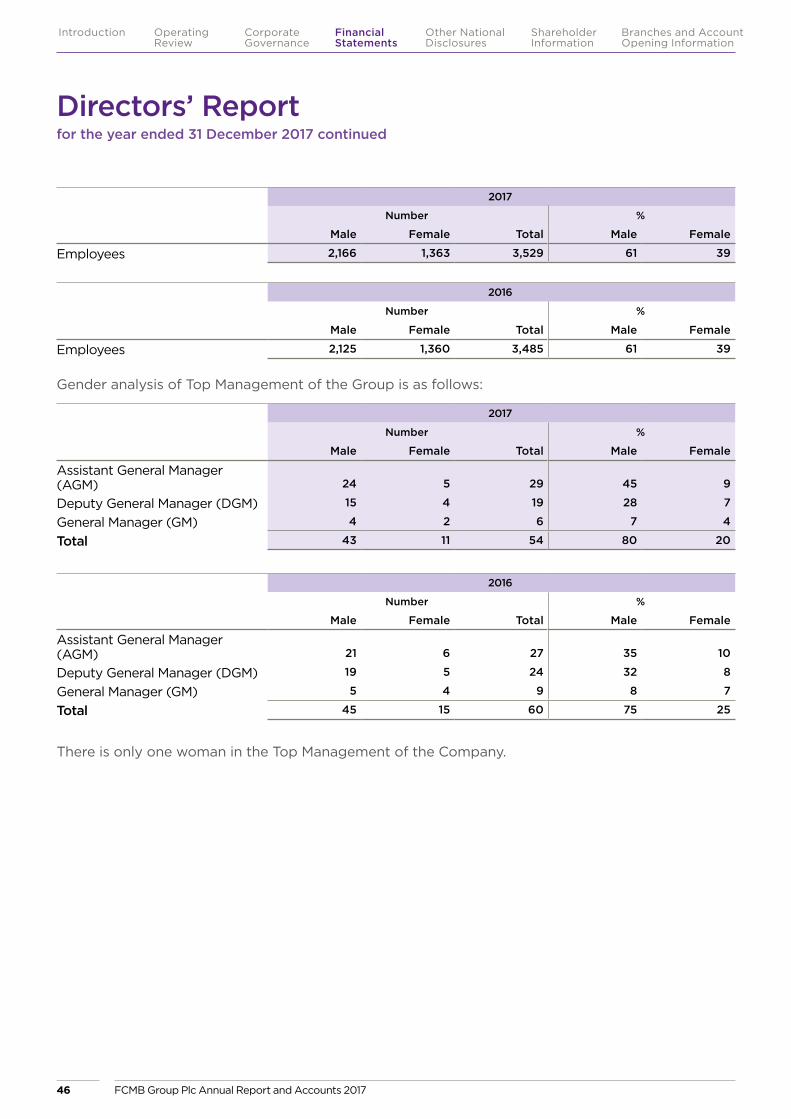
2017
Number %
Male Female Total Male Female
Employees 2,166 1,363 3,529 61 39
2016
Number %
Male Female Total Male Female
Employees 2,125 1,360 3,485 61 39
Directors’ Report for the year ended 31 December 2017 continued
2017
Number %
Male Female Total Male Female
Assistant General Manager (AGM) 24 5 29 45 9
Deputy General Manager (DGM) 15 4 19 28 7
General Manager (GM) 4 2 6 7 4
Total 43 11 54 80 20
Gender analysis of Top Management of the Group is as follows:
There is only one woman in the Top Management of the Company.
2016
Number %
Male Female Total Male Female
Assistant General Manager (AGM) 21 6 27 35 10
Deputy General Manager (DGM) 19 5 24 32 8
General Manager (GM) 5 4 9 8 7
Total 45 15 60 75 25
FCMB Group Plc Annual Report and Accounts 201746
Introduction Operating Review
Corporate Governance
Financial Statements
Shareholder Information
Other National Disclosures
Branches and Account Opening Information
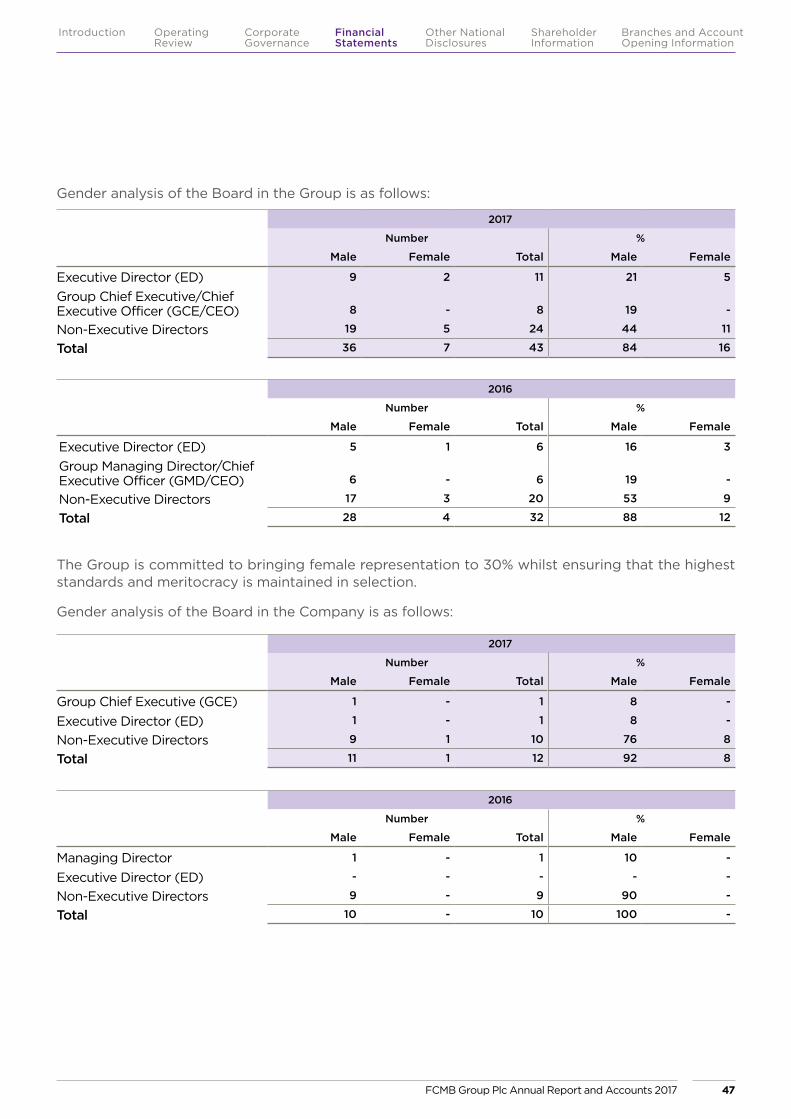
2017
Number %
Male Female Total Male Female
Executive Director (ED) 9 2 11 21 5
Group Chief Executive/Chief Executive Officer (GCE/CEO) 8 - 8 19 -
Non-Executive Directors 19 5 24 44 11
Total 36 7 43 84 16
2017
Number %
Male Female Total Male Female
Group Chief Executive (GCE) 1 - 1 8 -
Executive Director (ED) 1 - 1 8 -
Non-Executive Directors 9 1 10 76 8
Total 11 1 12 92 8
2016
Number %
Male Female Total Male Female
Managing Director 1 - 1 10 -
Executive Director (ED) - - - - -
Non-Executive Directors 9 - 9 90 -
Total 10 - 10 100 -
2016
Number %
Male Female Total Male Female
Executive Director (ED) 5 1 6 16 3
Group Managing Director/Chief Executive Officer (GMD/CEO) 6 - 6 19 -
Non-Executive Directors 17 3 20 53 9
Total 28 4 32 88 12
Gender analysis of the Board in the Group is as follows:
The Group is committed to bringing female representation to 30% whilst ensuring that the highest standards and meritocracy is maintained in selection.
Gender analysis of the Board in the Company is as follows:
FCMB Group Plc Annual Report and Accounts 2017 47
Introduction Operating Review
Corporate Governance
Financial Statements
Shareholder Information
Other National Disclosures
Branches and Account Opening Information

l. Employee Involvement and Training
The Group places considerable value on the involvement of its employees and has continued its practice of keeping them informed on matters affecting them as employees and the various factors affecting the performance of the Group. This is achieved through regular meetings between management and staff of the Group.
The Group has in-house training facilities complemented with additional facilities from educational institutions (local and offshore) for the training of its employees.
m. Customer Complaints
FCMB Group Plc is committed to ensuring an effective and responsive complaints management process hence the banking subsidiary has put in place a complaints management policy to ensure that the causes of complaints are fully addressed and to assure stakeholders and members of the public that their concerns will be handled in a fair and appropriate manner. Customers’ complaints
Number Amount claimed (N’000) Amount refunded (N’000)
Description 2017 2016 2017 2016 2017 2016
Pending complaints B/F 111 85 - - - -
Received complaints 39,404 35,966 4,964,218 4,939,776 - -
Total complaints 39,515 36,051 4,964,218 4,939,776 - -
Resolved complaints 39,238 35,923 3,570,200 4,791,338 656,532 4,508,835
Unresolved complaints escalated to CBN for intervention 11 17 203,486 107,870 - 2,600
Unresolved complaints pending with the bank subsidiary C/F 266 111 1,335 - - -
are lodged with the Complaints Officer at [email protected] for necessary action. The banking subsidiary had pending complaints of 111 at the beginning of the year and received additional 39,404 (31 December 2016: 35,966) during the year ended 31 December 2017, of which 39,238 (31 December 2016: 35,923) complaints were resolved (inclusive of pending complaints brought forward) and 266 (31 December 2016: 111) complaints remained unresolved and pending with the Banking subsidiary as at the end of the reporting year. The total amount resolved was N3.57 billion (31 December 2016: N4.79 billion) while the total disputed amount in cases which remained unresolved stood at N203.49 million (2016: N107.87 million). These unresolved complaints were referred to the Central Bank of Nigeria for intervention. The Directors are of the opinion that these complaints will be resolved without adverse consequences to the Banking subsidiary. No provisions are therefore deemed necessary for these claims.
Directors’ Report for the year ended 31 December 2017 continued
FCMB Group Plc Annual Report and Accounts 201748
Introduction Operating Review
Corporate Governance
Financial Statements
Shareholder Information
Other National Disclosures
Branches and Account Opening Information
n. Auditors
Messrs KPMG Professional Services, having satisfied the relevant corporate rules on their tenure in office have indicated their willingness to continue in office as auditors to the company. In accordance with section 357 (2) of the Companies and Allied Matters Act, Cap C.20 Laws of Federation of Nigeria 2004 therefore, the auditor will be re-appointed at the next annual general meeting of the company without any resolution being passed.
By Order of the Board
Mrs Olufunmilayo Adedibu Company Secretary 44 Marina Lagos State Nigeria
FRC/2014/NBA/00000005887
8 March 2018
FCMB Group Plc Annual Report and Accounts 2017 49
Introduction Operating Review
Corporate Governance
Financial Statements
Shareholder Information
Other National Disclosures
Branches and Account Opening Information
Statement of Directors’ Responsibilities in Relation to the Financial Statements for the year ended 31 December 2017
The directors accept responsibility for the preparation of the annual financial statements that give a true and fair view in accordance with International Financial Reporting Standards (IFRS) and in the manner required by the Companies and Allied Matters Act, Cap C20, Laws of the Federation of Nigeria 2004, the Financial Reporting Council of Nigeria Act, 2011, the Banks and Other Financial Institutions Act, Cap B3, Laws of the Federation of Nigeria, 2004 and relevant Central Bank of Nigeria regulations.
The directors further accept responsibility for maintaining adequate accounting records as required by the Companies and Allied Matters Act, Cap C20, Laws of the Federation of Nigeria 2004, and for such internal control as the directors determine is necessary to enable the preparation of financial statements that are free from material misstatement whether due to fraud or error.
The directors have made an assessment of the Company’s ability to continue as a going concern and have no reason to believe that the Company will not remain a going concern in the year ahead.
Dr Jonathan Long Chairman
FRC/2013/IODN/00000001433
8 March 2018
Ladi Balogun Group Chief Executive
FRC/2013/IODN/00000001460
8 March 2018
FCMB Group Plc Annual Report and Accounts 201750
Introduction Operating Review
Corporate Governance
Financial Statements
Shareholder Information
Other National Disclosures
Branches and Account Opening Information
For the financial year ended 31 December 2017 to the members of FCMB Group Plc.
In compliance with section 359 (6) of the Companies and Allied Matters Act, Cap C20, Laws of the Federation of Nigeria 2004, the Central Bank of Nigeria Code of Corporate Governance and the Securities and Exchange Commission Code of Corporate Governance for Public Companies in Nigeria, we have reviewed the Audit Report for the year ended 31 December, 2017 and hereby state as follows:
1. The scope and planning of the audit were adequate in our opinion;
2. The account and reporting policies of the Group conformed with the statutory requirements and agreed ethical practices;
3. The internal control system was constantly and effectively monitored;
4. The whistle blowing channel run by an external and independent third party was found adequate;
5. The external auditor’s management controls report received satisfactory response from Management; and
6. The gross value of related party loans as at 31 December 2017 was N18.09 billion (31 December 2016: N14.70 billion). All related party loans are performing.
The Audit Committee comprises the following Non-Executive Directors and Shareholders’ representatives:
(i) Evangelist Akinola Soares Chairman/Shareholders’ representative
(ii) Alhaji S B Daranijo Shareholders’ representative
(iii) Mr Akeem Batula Shareholders’ representative
(iv) Mr Bismarck Rewane Non-Executive Director
(v) Mr Olusegun Odubogun Non-Executive Director
(vi) Mr Olutola Mobolurin Non-Executive Director
The Group’s Head, Internal Audit, Babajide Odedele (FRC/2014/ICAN/00000006880) acts as secretary to the Committee.
Audit Committee Report
Evangelist Akinola Soares, FCNA Chairman, Audit Committee
FRC/2013/ANAN/00000004356
7 March 2018
FCMB Group Plc Annual Report and Accounts 2017 51
Introduction Operating Review
Corporate Governance
Financial Statements
Shareholder Information
Other National Disclosures
Branches and Account Opening Information
To the Shareholders of FCMB Group Plc
Report on the Audit of the Consolidated and Separate Financial Statements
Opinion
We have audited the consolidated and separate financial statements of FCMB Group Plc (“the Company”) and its subsidiaries (together, “the Group”), which comprise the consolidated and separate statement of financial position as at 31 December 2017, and the consolidated and separate statement of profit or loss and other comprehensive income, consolidated and separate statement of changes in equity and consolidated and separate statement of cash flows for the year then ended, and a summary of significant accounting policies and other explanatory information, as set out on pages 58 to 217.
In our opinion, the accompanying consolidated and separate financial statements give a true and fair view of the consolidated and separate financial position of the Company and its subsidiaries as at 31 December 2017, and of its consolidated and separate financial performance and its consolidated and separate cash flows for the year then ended in accordance with International Financial Reporting Standards (IFRSs) and in the manner required by the Companies and Allied Matters Act, Cap C.20, Laws of the Federation of Nigeria, 2004 and the Financial Reporting Council of Nigeria Act, 2011, the Banks and other Financial Institutions Act, Cap B3, Laws of the Federation of Nigeria, 2004 and relevant Central Bank of Nigeria (CBN) Guidelines and Circulars.
Independent Auditor’s Report
Basis for Opinion
We conducted our audit in accordance with International Standards on Auditing (ISAs). Our responsibilities under those standards are further described in the Auditor’s Responsibilities for the Audit of the consolidated and separate Financial Statements section of our report. We are independent of the Group and Company in accordance with the International Ethics Standards Board for Accountants’ Code of Ethics for Professional Accountants (IESBA Code) together with the ethical requirements that are relevant to our audit of the consolidated and separate financial statements in Nigeria and we have fulfilled our other ethical responsibilities in accordance with these requirements and the IESBA Code. We believe that the audit evidence we have obtained is sufficient and appropriate to provide a basis for our opinion.
Key Audit Matters
Key audit matters are those matters that, in our professional judgment, were of most significance in our audit of the consolidated and separate financial statements of the current period. These matters were addressed in the context of our audit of the financial statements as a whole, and in forming our opinion thereon, and we do not provide a separate opinion on these matters.
The key audit matters described below apply to the audit of the consolidated and separate financial statements.
FCMB Group Plc Annual Report and Accounts 201752
Introduction Operating Review
Corporate Governance
Financial Statements
Shareholder Information
Other National Disclosures
Branches and Account Opening Information
Impairment of loans and advances granted to customers
The impairment of loans and advances granted to customers is an area of significance for our audit due to the level of judgment and uncertainty involved in both the timing of recognition and estimation of the key parameters for the estimation of the recoverability of the loan balances. The allowance for impairment recognized, represents management’s best estimate of the losses incurred within the loan portfolio, determined on an individual basis for loans and advances above a specific threshold and on a collective basis for a portfolio of loans with similar or homogeneous characteristics.
Individually significant loans are assessed for specific impairment. The specific impairment allowance on these significant loans is determined based on the magnitude of the outstanding exposure, and the current level of past due obligations on the loans. Specific impairment allowance levels are determined by comparing the carrying amount of the loans to the present value of estimated future cash flows (including the fair value of pledged collaterals) discounted using the effective interest rate of the loan. Impairment assessment for all other loans, including individually significant loans which were assessed to be unimpaired, is performed collectively, with the key assumptions being: the probability of a loan becoming past due and subsequently defaulting and the rate of recovery on loans that are past due and in default.
Procedures
Our audit procedures included but were not limited to the following:
� We evaluated and tested the key controls over the impairment determination process such as the credit committee reviews of loans and advances and management’s monitoring of the performance of loans and advances, including timely identification of impairment triggers.
� For Individually significant loans that were assessed for specific impairment, we tested the completeness of the loans identified by the Group as high risk by considering risk factors such as magnitude of the outstanding exposure, the current level of past due obligations and our knowledge of the credit risk in the specific industries and sectors. For the balances deemed to be specifically impaired, we re-performed the calculations of impairment and compared the key data inputs to relevant sources for example, we compared the collateral values used to the respective valuation reports for reasonableness, compared discount rates to the effective interest rate of the loan and compared projected cash flows to historical inflows in customers’ accounts.
� We identified and evaluated the appropriateness of any changes to management’s collective impairment assessment methodology during the year, including whether there was any indication of management bias in developing the collective impairment assessment.
FCMB Group Plc Annual Report and Accounts 2017 53
Introduction Operating Review
Corporate Governance
Financial Statements
Shareholder Information
Other National Disclosures
Branches and Account Opening Information
� In relation to the loans that were collectively assessed for impairment, we tested the Group’s impairment model for reasonableness. We re-performed the calculation using the Group’s impairment model, in order to assess the accuracy of the collective impairment charge recorded. The assumptions inherent in the Group’s collective impairment model were assessed against our understanding of the Group. We assessed the methodology used by the Group to estimate the likelihood of default for loans and advances with different profiles and recalculated these default rates based on our cumulative knowledge of the Group’s actual historic experience and current circumstances. We also evaluated the historical accuracy and reliability of the Group’s collective impairment estimates by determining whether these estimates have been consistent with subsequent actual losses and write-offs identified on individual assets.
� We assessed the disclosures in relation to impairment of loans and advances in the consolidated and separate financial statements with reference to the requirements of the prevailing accounting standards.
The Group’s notes on impairment of loans and advances and related disclosures on credit risk are shown in notes 24 (c) and 3 (b) respectively.
Recoverability of deferred tax assets
At the reporting date the Group had significant recognised and unrecognised deferred tax assets arising from unused tax losses, unutilised capital allowances and collective impairment allowance on loans and advances. The Group’s determination of the recoverability of deferred tax assets involves significant judgment and high estimation uncertainty as the Group supports the recoverability of the deferred tax assets mainly with estimates of future taxable profits.
Independent Auditor’s Report
Procedures
Our procedures included the following:
� We assessed the components that gave rise to the deferred tax asset to determine whether they were valid and in line with the requirements of the accounting standards and tax laws.
� We further assessed management’s forecasts of future taxable profits by checking that assumptions used in the Group’s projection of taxable income were reasonable and reflects the Group’s historical performance trend, the business model and the Group’s future plans and that there was no evidence of management bias in making those estimates.
The Group’s accounting policy and note on deferred tax is shown in note 2j(ii) and note 31 respectively.
Information Other Than the Financial Statements and Audit Report Thereon
The Directors are responsible for the other information which comprises the Directors’ report, Statement of Directors’ responsibilities, Corporate governance report, Audit Committee report, Report of the external consultants on the performance of the Board of Directors, Management Certification of Financial Statements and Other national disclosures, but does not include the consolidated and separate financial statements and our audit report thereon. Other information also includes information about FCMB Group Plc, the archives of the Founder, Chairman’s statement, Managing Director’s report, 2017 awards won, Operating Companies performance highlights, Sustainability report, Board evaluation report, Notice of Annual General Meeting and list of branches which would be obtained after the date of the auditor’s report.
FCMB Group Plc Annual Report and Accounts 201754
Introduction Operating Review
Corporate Governance
Financial Statements
Shareholder Information
Other National Disclosures
Branches and Account Opening Information
Our opinion on the consolidated and separate financial statements does not cover the other information and we do not express any form of assurance conclusion thereon.
In connection with our audit of the consolidated and separate financial statements, our responsibility is to read the other information and in doing so, consider whether the other information is materially inconsistent with the consolidated and separate financial statements or our knowledge obtained in the audit or otherwise appears to be materially misstated. If, based on the work we have performed, we conclude that there is a material misstatement of this other information, we are required to report that fact. We have nothing to report in this regard.
Responsibilities of the Directors for the Consolidated and Separate Financial Statements
The Directors are responsible for the preparation of consolidated and separate financial statements that give a true and fair view in accordance with International Financial Reporting Standards (IFRSs) and in the manner required by the Companies and Allied Matters Act, Cap C.20, Laws of the Federation of Nigeria, 2004 and the Financial Reporting Council of Nigeria Act, 2011 and the Banks and other Financial Institutions Act, Cap B3, Laws of the Federation of Nigeria, 2004 and relevant Central Bank of Nigeria (CBN) Guidelines and Circulars, and for such internal control as the directors determine is necessary to enable the preparation of financial statements that are free from material misstatement, whether due to fraud or error.
In preparing the consolidated and separate financial statements, the directors are responsible for assessing the Group and Company’s ability to continue as a going concern, disclosing, as applicable, matters related to going concern and using the going concern basis of accounting unless the directors either intend to liquidate the
Group or to cease operations, or have no realistic alternative but to do so.
Auditor’s Responsibilities for the Audit of the Consolidated and Separate Financial Statements
Our objectives are to obtain reasonable assurance about whether the consolidated and separate financial statements as a whole are free from material misstatement, whether due to fraud or error, and to issue an auditor’s report that includes our opinion. Reasonable assurance is a high level of assurance, but is not a guarantee that an audit conducted in accordance with ISAs will always detect a material misstatement when it exists. Misstatements can arise from fraud or error and are considered material if, individually or in the aggregate, they could reasonably be expected to influence the economic decisions of users taken on the basis of these financial statements.
As part of an audit in accordance with ISAs, we exercise professional judgment and maintain professional scepticism throughout the audit. We also:
� Identify and assess the risks of material misstatement of the consolidated and separate financial statements, whether due to fraud or error, design and perform audit procedures responsive to those risks, and obtain audit evidence that is sufficient and appropriate to provide a basis for our opinion. The risk of not detecting a material misstatement resulting from fraud is higher than for one resulting from error, as fraud may involve collusion, forgery, intentional omissions, misrepresentations, or the override of internal control.
� Obtain an understanding of internal control relevant to the audit in order to design audit procedures that are appropriate in the circumstances, but not for the purpose of expressing an opinion on the effectiveness of the Group and Company’s internal control.
FCMB Group Plc Annual Report and Accounts 2017 55
Introduction Operating Review
Corporate Governance
Financial Statements
Shareholder Information
Other National Disclosures
Branches and Account Opening Information
� Evaluate the appropriateness of accounting policies used and the reasonableness of accounting estimates and related disclosures made by the directors.
� Conclude on the appropriateness of directors’ use of the going concern basis of accounting and, based on the audit evidence obtained, whether a material uncertainty exists related to events or conditions that may cast significant doubt on the Group and Company’s ability to continue as a going concern. If we conclude that a material uncertainty exists, we are required to draw attention in our auditor’s report to the related disclosures in the consolidated and separate financial statements or, if such disclosures are inadequate, to modify our opinion. Our conclusions are based on the audit evidence obtained up to the date of our auditor’s report. However, future events or conditions may cause the Group and Company to cease to continue as a going concern.
� Evaluate the overall presentation, structure and content of the consolidated and separate financial statements, including the disclosures, and whether the consolidated and separate financial statements represent the underlying transactions and events in a manner that achieves fair presentation.
� Obtain sufficient appropriate audit evidence regarding the financial information of the entities or business activities within the Group to express an opinion on the consolidated financial statements. We are responsible for the direction, supervision and performance of the group audit. We remain solely responsible for our audit opinion.
Independent Auditor’s Report
We communicate with the Audit Committee regarding, among other matters, the planned scope and timing of the audit and significant audit findings, including any significant deficiencies in internal control that we identify during our audit.
We also provide the Audit Committee with a statement that we have complied with relevant ethical requirements regarding independence, and to communicate with them all relationships and other matters that may reasonably be thought to bear on our independence, and where applicable, related safeguards.
From the matters communicated with the Audit Committee, we determine those matters that were of most significance in the audit of the consolidated and separate financial statements of the current period and are therefore the key audit matters. We describe these matters in our auditor’s report unless law or regulation precludes public disclosure about the matter or when, in extremely rare circumstances, we determine that a matter should not be communicated in our report because the adverse consequences of doing so would reasonably be expected to outweigh the public interest benefits of such communication.
FCMB Group Plc Annual Report and Accounts 201756
Introduction Operating Review
Corporate Governance
Financial Statements
Shareholder Information
Other National Disclosures
Branches and Account Opening Information
Report on Other Legal and Regulatory Requirements
Compliance with the requirements of Schedule 6 of the Companies and Allied Matters Act, Cap C.20, Laws of the Federation of Nigeria, 2004
In our opinion, proper books of account have been kept by the Group and Company, so far as appears from our examination of those books and the Group and Company’s statement of financial position and statement of profit or loss and other comprehensive income are in agreement with the books of account.
Compliance with Section 27 (2) of the Banks and the other Financial Institutions Act Cap B3, Laws of the Federation of Nigeria, 2004 and Central Bank of Nigeria circular BSD/1/2004
(i) The Group paid penalties in respect of contravention of the Central Bank of Nigeria guidelines during the year ended 31 December 2017. Details of penalties paid are disclosed in note 48 to the financial statements.
(ii) Related party transactions and balances are disclosed in note 45 to the financial statements in compliance with the Central Bank of Nigeria circular BSD/1/2004.
Ayodele H Othihiwa, FCA FRC/2012/ICAN/00000000425 For: KPMG Professional Services
Chartered Accountants
22 March 2018 Lagos, Nigeria
FCMB Group Plc Annual Report and Accounts 2017 57
Introduction Operating Review
Corporate Governance
Financial Statements
Shareholder Information
Other National Disclosures
Branches and Account Opening Information
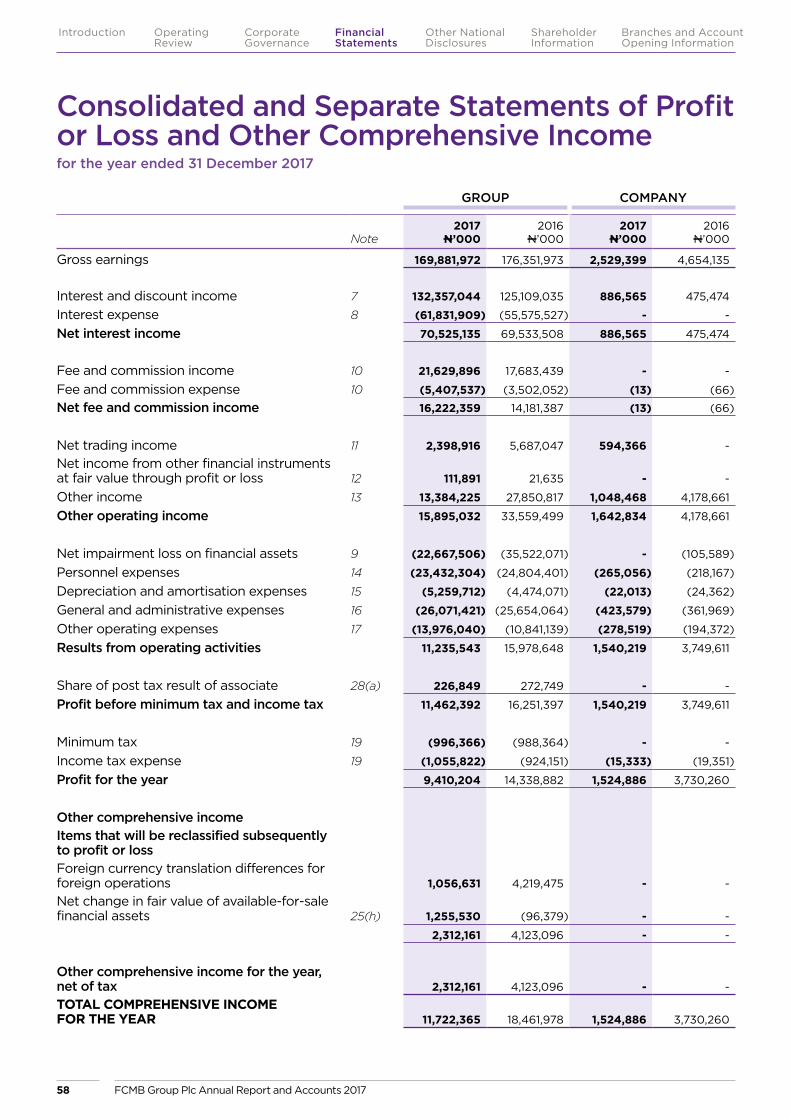
Consolidated and Separate Statements of Profit or Loss and Other Comprehensive Incomefor the year ended 31 December 2017
GROUP COMPANY
Note 2017
N’000 2016
N’000 2017
N’000 2016
N’000
Gross earnings 169,881,972 176,351,973 2,529,399 4,654,135
Interest and discount income 7 132,357,044 125,109,035 886,565 475,474
Interest expense 8 (61,831,909) (55,575,527) - -
Net interest income 70,525,135 69,533,508 886,565 475,474
Fee and commission income 10 21,629,896 17,683,439 - -
Fee and commission expense 10 (5,407,537) (3,502,052) (13) (66)
Net fee and commission income 16,222,359 14,181,387 (13) (66)
Net trading income 11 2,398,916 5,687,047 594,366 -
Net income from other financial instruments at fair value through profit or loss 12 111,891 21,635 - -
Other income 13 13,384,225 27,850,817 1,048,468 4,178,661
Other operating income 15,895,032 33,559,499 1,642,834 4,178,661
Net impairment loss on financial assets 9 (22,667,506) (35,522,071) - (105,589)
Personnel expenses 14 (23,432,304) (24,804,401) (265,056) (218,167)
Depreciation and amortisation expenses 15 (5,259,712) (4,474,071) (22,013) (24,362)
General and administrative expenses 16 (26,071,421) (25,654,064) (423,579) (361,969)
Other operating expenses 17 (13,976,040) (10,841,139) (278,519) (194,372)
Results from operating activities 11,235,543 15,978,648 1,540,219 3,749,611
Share of post tax result of associate 28(a) 226,849 272,749 - -
Profit before minimum tax and income tax 11,462,392 16,251,397 1,540,219 3,749,611
Minimum tax 19 (996,366) (988,364) - -
Income tax expense 19 (1,055,822) (924,151) (15,333) (19,351)
Profit for the year 9,410,204 14,338,882 1,524,886 3,730,260
Other comprehensive incomeItems that will be reclassified subsequently to profit or loss Foreign currency translation differences for foreign operations 1,056,631 4,219,475 - -
Net change in fair value of available-for-sale financial assets 25(h) 1,255,530 (96,379) - -
2,312,161 4,123,096 - -
Other comprehensive income for the year, net of tax 2,312,161 4,123,096 - -
TOTAL COMPREHENSIVE INCOME FOR THE YEAR 11,722,365 18,461,978 1,524,886 3,730,260
FCMB Group Plc Annual Report and Accounts 201758
Introduction Operating Review
Corporate Governance
Financial Statements
Shareholder Information
Other National Disclosures
Branches and Account Opening Information
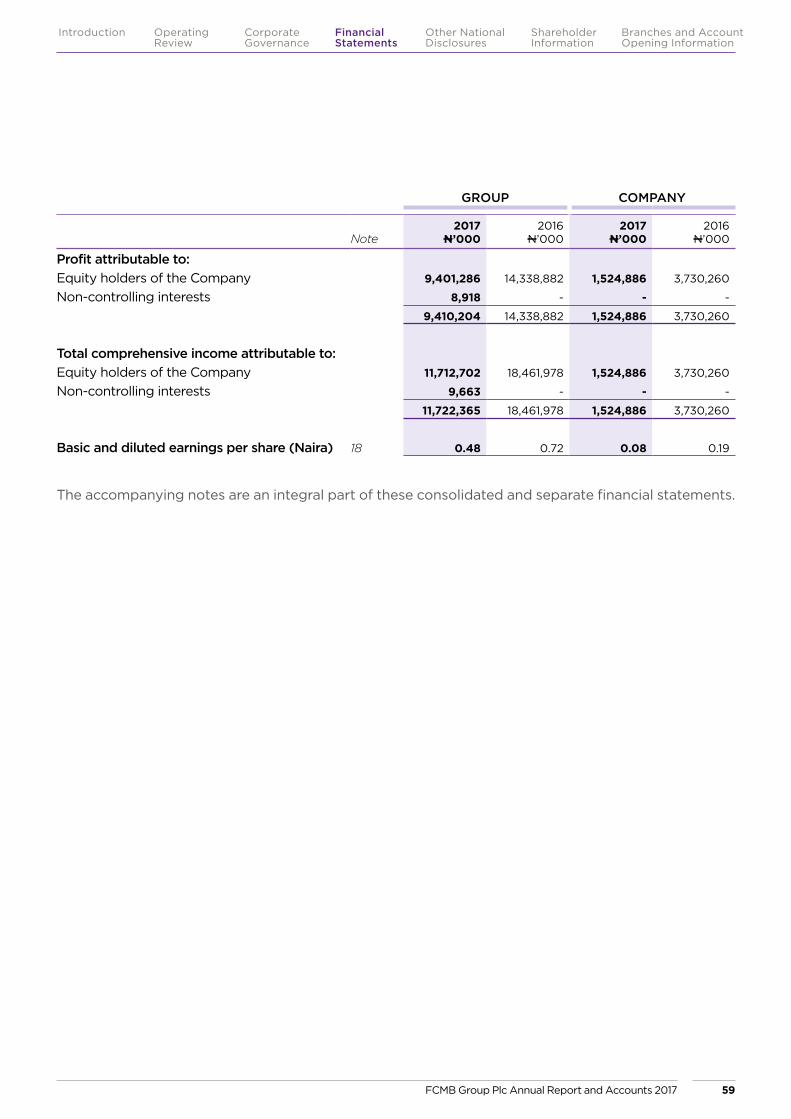
GROUP COMPANY
Note 2017
N’000 2016
N’000 2017
N’000 2016
N’000
Profit attributable to:Equity holders of the Company 9,401,286 14,338,882 1,524,886 3,730,260
Non-controlling interests 8,918 - - -
9,410,204 14,338,882 1,524,886 3,730,260
Total comprehensive income attributable to:Equity holders of the Company 11,712,702 18,461,978 1,524,886 3,730,260
Non-controlling interests 9,663 - - -
11,722,365 18,461,978 1,524,886 3,730,260
Basic and diluted earnings per share (Naira) 18 0.48 0.72 0.08 0.19
The accompanying notes are an integral part of these consolidated and separate financial statements.
FCMB Group Plc Annual Report and Accounts 2017 59
Introduction Operating Review
Corporate Governance
Financial Statements
Shareholder Information
Other National Disclosures
Branches and Account Opening Information
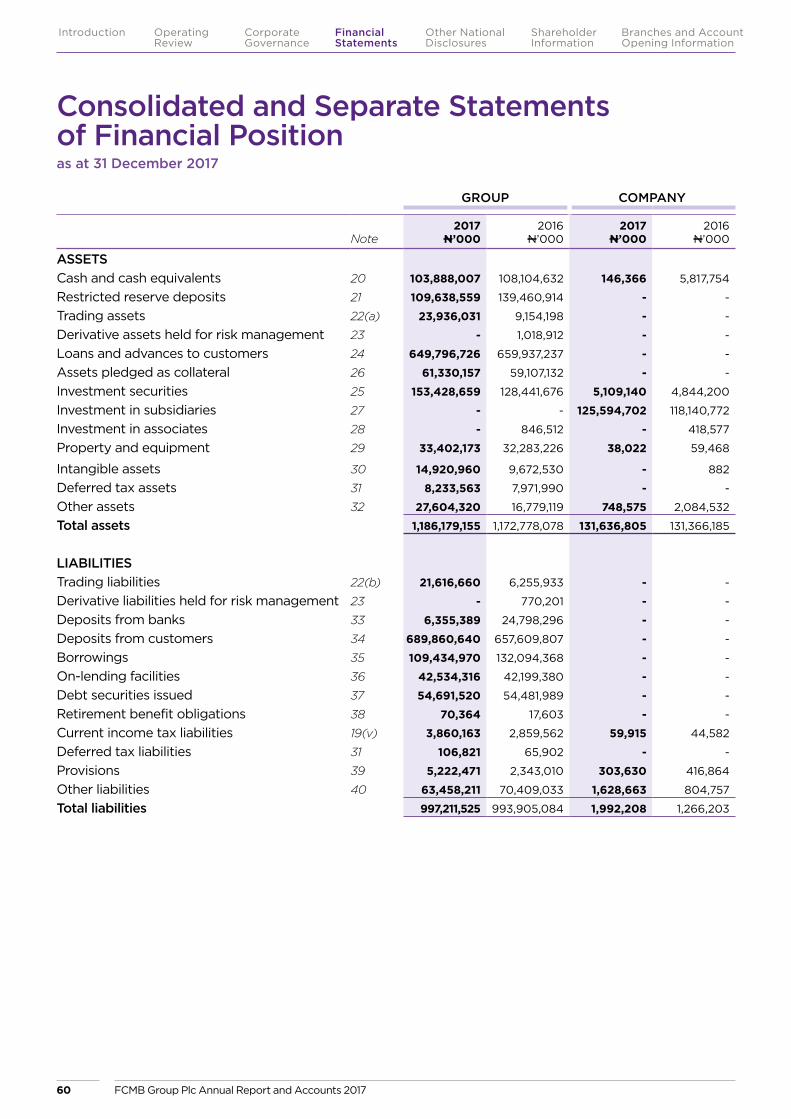
GROUP COMPANY
Note 2017
N’000 2016
N’000 2017
N’000 2016
N’000
ASSETSCash and cash equivalents 20 103,888,007 108,104,632 146,366 5,817,754
Restricted reserve deposits 21 109,638,559 139,460,914 - -
Trading assets 22(a) 23,936,031 9,154,198 - -
Derivative assets held for risk management 23 - 1,018,912 - -
Loans and advances to customers 24 649,796,726 659,937,237 - -
Assets pledged as collateral 26 61,330,157 59,107,132 - -
Investment securities 25 153,428,659 128,441,676 5,109,140 4,844,200
Investment in subsidiaries 27 - - 125,594,702 118,140,772
Investment in associates 28 - 846,512 - 418,577
Property and equipment 29 33,402,173 32,283,226 38,022 59,468
Intangible assets 30 14,920,960 9,672,530 - 882
Deferred tax assets 31 8,233,563 7,971,990 - -
Other assets 32 27,604,320 16,779,119 748,575 2,084,532
Total assets 1,186,179,155 1,172,778,078 131,636,805 131,366,185
LIABILITIESTrading liabilities 22(b) 21,616,660 6,255,933 - -
Derivative liabilities held for risk management 23 - 770,201 - -
Deposits from banks 33 6,355,389 24,798,296 - -
Deposits from customers 34 689,860,640 657,609,807 - -
Borrowings 35 109,434,970 132,094,368 - -
On-lending facilities 36 42,534,316 42,199,380 - -
Debt securities issued 37 54,691,520 54,481,989 - -
Retirement benefit obligations 38 70,364 17,603 - -
Current income tax liabilities 19(v) 3,860,163 2,859,562 59,915 44,582
Deferred tax liabilities 31 106,821 65,902 - -
Provisions 39 5,222,471 2,343,010 303,630 416,864
Other liabilities 40 63,458,211 70,409,033 1,628,663 804,757
Total liabilities 997,211,525 993,905,084 1,992,208 1,266,203
Consolidated and Separate Statements of Financial Positionas at 31 December 2017
FCMB Group Plc Annual Report and Accounts 201760
Introduction Operating Review
Corporate Governance
Financial Statements
Shareholder Information
Other National Disclosures
Branches and Account Opening Information
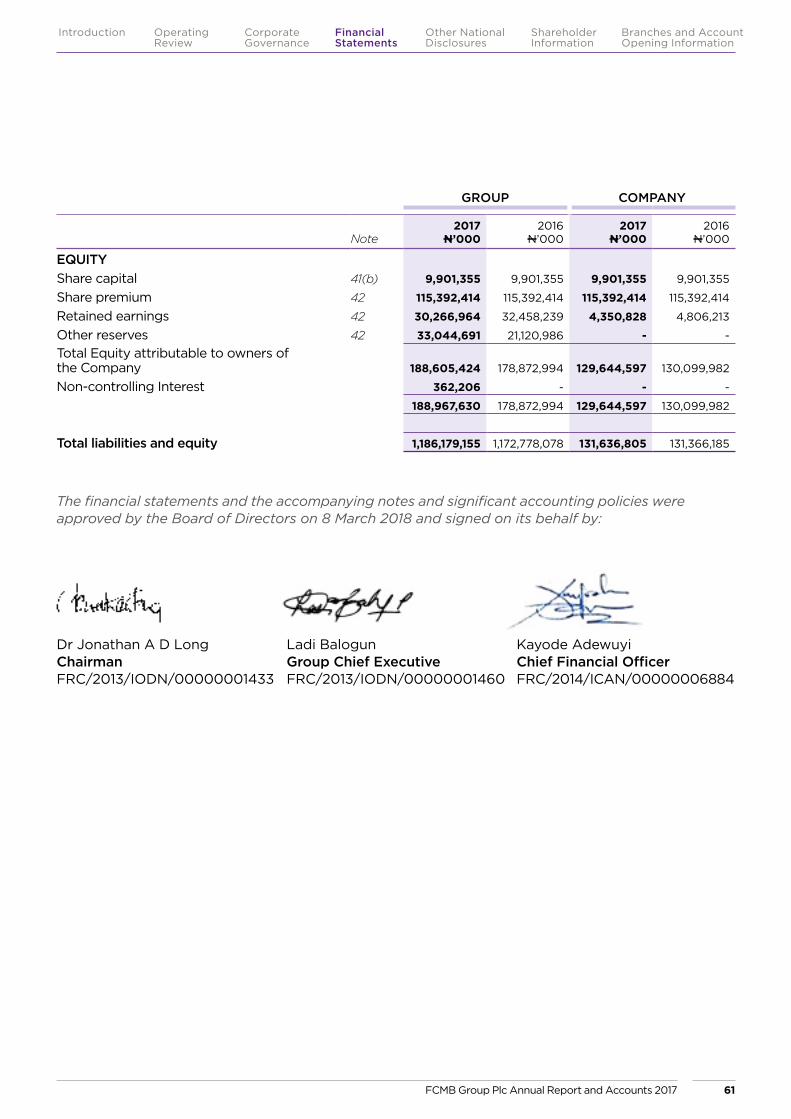
Dr Jonathan A D Long Chairman FRC/2013/IODN/00000001433
Ladi Balogun Group Chief Executive FRC/2013/IODN/00000001460
Kayode Adewuyi Chief Financial Officer FRC/2014/ICAN/00000006884
The financial statements and the accompanying notes and significant accounting policies were approved by the Board of Directors on 8 March 2018 and signed on its behalf by:
GROUP COMPANY
Note 2017
N’000 2016
N’000 2017
N’000 2016
N’000
EQUITYShare capital 41(b) 9,901,355 9,901,355 9,901,355 9,901,355
Share premium 42 115,392,414 115,392,414 115,392,414 115,392,414
Retained earnings 42 30,266,964 32,458,239 4,350,828 4,806,213
Other reserves 42 33,044,691 21,120,986 - -
Total Equity attributable to owners of the Company 188,605,424 178,872,994 129,644,597 130,099,982
Non-controlling Interest 362,206 - - -
188,967,630 178,872,994 129,644,597 130,099,982
Total liabilities and equity 1,186,179,155 1,172,778,078 131,636,805 131,366,185
FCMB Group Plc Annual Report and Accounts 2017 61
Introduction Operating Review
Corporate Governance
Financial Statements
Shareholder Information
Other National Disclosures
Branches and Account Opening Information
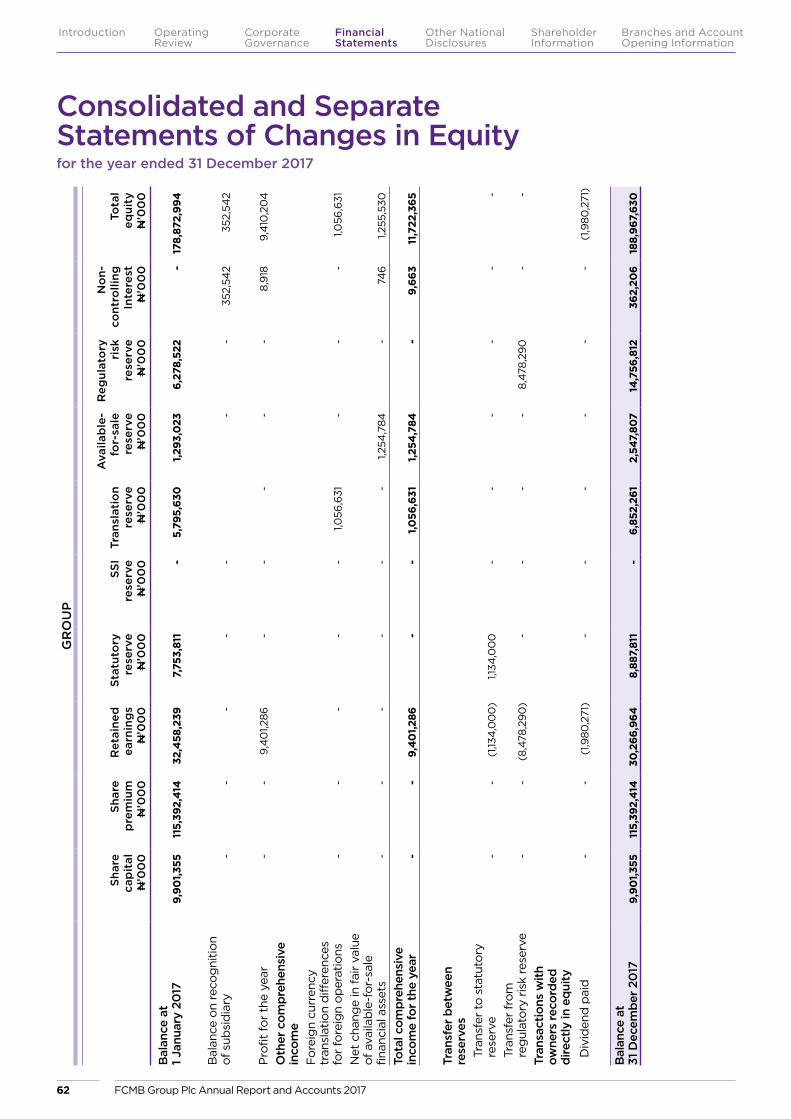
GR
OU
P
Shar
e ca
pit
alN
’00
0
Shar
e p
rem
ium
N’0
00
Ret
aine
d
earn
ing
sN
’00
0
Stat
uto
ry
rese
rve
N’0
00
SSI
rese
rve
N’0
00
Tran
slat
ion
rese
rve
N’0
00
Ava
ilab
le-
for-
sale
re
serv
eN
’00
0
Reg
ulat
ory
ri
sk
rese
rve
N’0
00
No
n-co
ntro
lling
In
tere
stN
’00
0
Tota
l eq
uity
N’0
00
Bal
ance
at
1 J
anua
ry 2
017
9,90
1,355
115,
392,
414
32,4
58,2
397,
753,
811
-
5,79
5,63
01,2
93,0
23
6,27
8,52
2 -
17
8,87
2,99
4
Bal
ance
on
reco
gni
tion
of s
ubsi
dia
ry -
-
-
-
-
-
-
3
52,5
42
352,
542
Pro
fit fo
r th
e ye
ar -
-
9,
40
1,286
-
-
-
-
-
8,9
18
9,4
10,2
04
Oth
er c
ompr
ehen
sive
in
com
eFo
reig
n cu
rren
cy
tran
slat
ion
diff
eren
ces
for
fore
ign
oper
atio
ns -
-
-
-
-
1,0
56,6
31 -
-
-
1,0
56,6
31
Net
cha
nge
in fa
ir va
lue
of a
vaila
ble
-for
-sal
e fin
anci
al a
sset
s -
-
-
-
-
-
1,2
54,7
84
-
74
6
1,255
,530
Tota
l com
preh
ensi
ve
inco
me
for
the
year
-
-
9,4
01,2
86 -
-
1,0
56,6
311,2
54,7
84
-
9,66
3 11
,722
,365
Tran
sfer
bet
wee
n re
serv
esTr
ansf
er t
o st
atut
ory
rese
rve
-
-
(1,13
4,0
00
)1,1
34,0
00
-
-
-
-
-
-
Tran
sfer
from
re
gul
ator
y ris
k re
serv
e -
-
(8
,478
,290
) -
-
-
-
8,
478,
290
-
-
Tran
sact
ions
with
ow
ners
reco
rded
di
rect
ly in
equ
ityD
ivid
end
pai
d -
-
(1
,980
,271
) -
-
-
-
-
-
(1
,980
,271
)
Bal
ance
at
31
Dec
embe
r 20
179,
901,3
5511
5,39
2,41
430
,266
,964
8,88
7,81
1 -
6,
852,
261
2,54
7,80
7 14
,756
,812
362,
206
18
8,96
7,63
0
Consolidated and Separate Statements of Changes in Equityfor the year ended 31 December 2017
FCMB Group Plc Annual Report and Accounts 201762
Introduction Operating Review
Corporate Governance
Financial Statements
Shareholder Information
Other National Disclosures
Branches and Account Opening Information
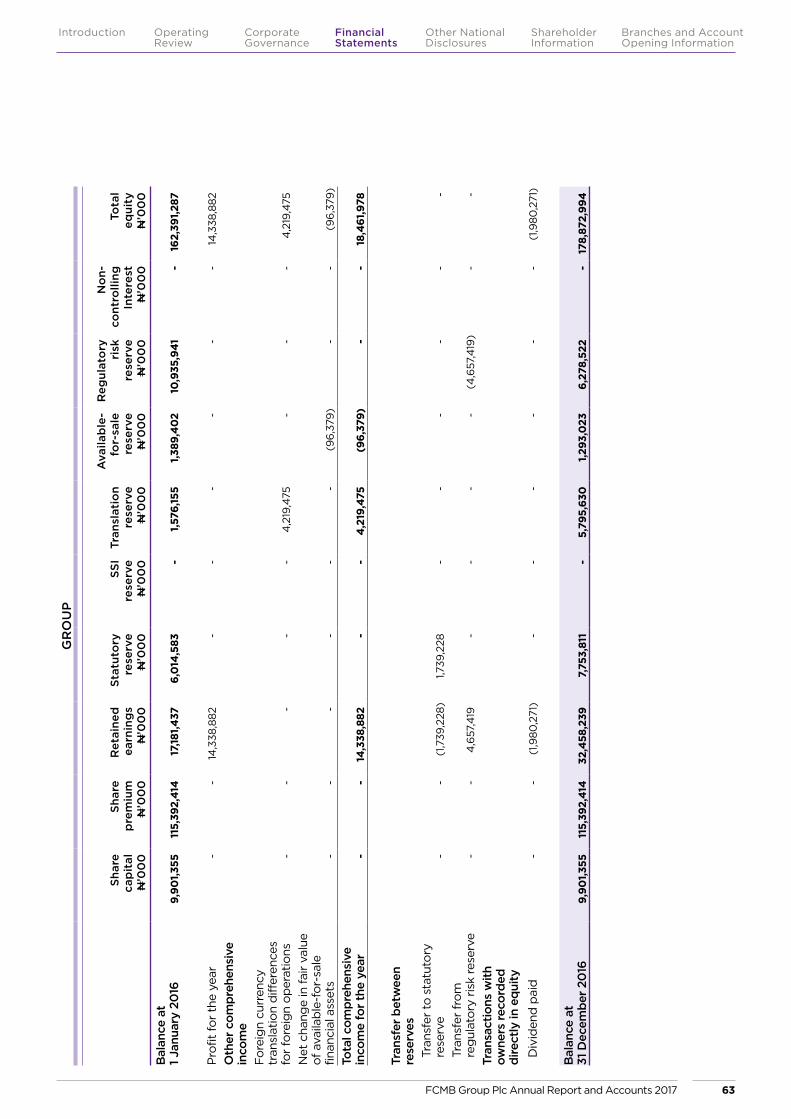
GR
OU
P
Shar
e ca
pit
alN
’00
0
Shar
e p
rem
ium
N’0
00
Ret
aine
d
earn
ing
sN
’00
0
Stat
uto
ry
rese
rve
N’0
00
SSI
rese
rve
N’0
00
Tran
slat
ion
rese
rve
N’0
00
Ava
ilab
le-
for-
sale
re
serv
eN
’00
0
Reg
ulat
ory
ri
sk
rese
rve
N’0
00
No
n-co
ntro
lling
In
tere
stN
’00
0
Tota
l eq
uity
N’0
00
Bal
ance
at
1 J
anua
ry 2
016
9,90
1,355
115,
392,
414
17,18
1,437
6,0
14,5
83 -
1,5
76,15
5 1
,389
,40
2 10
,935
,941
-
162,
391,2
87
Pro
fit fo
r th
e ye
ar -
-
14
,338
,882
-
-
-
-
-
-
14,3
38,8
82
Oth
er c
ompr
ehen
sive
in
com
eFo
reig
n cu
rren
cy
tran
slat
ion
diff
eren
ces
for
fore
ign
oper
atio
ns -
-
-
-
-
4
,219
,475
-
-
-
4,2
19,4
75
Net
cha
nge
in fa
ir va
lue
of a
vaila
ble
-for
-sal
e fin
anci
al a
sset
s -
-
-
-
-
-
(9
6,37
9) -
-
(9
6,37
9)
Tota
l com
preh
ensi
ve
inco
me
for
the
year
-
-
14,3
38,8
82
-
-
4,2
19,4
75
(96,
379)
-
-
18,4
61,9
78
Tran
sfer
bet
wee
n re
serv
esTr
ansf
er t
o st
atut
ory
rese
rve
-
-
(1,7
39,2
28)
1,739
,228
-
-
-
-
-
-
Tran
sfer
from
re
gul
ator
y ris
k re
serv
e -
-
4
,657
,419
-
-
-
-
(4
,657
,419
) -
-
Tran
sact
ions
with
ow
ners
reco
rded
di
rect
ly in
equ
ityD
ivid
end
pai
d -
-
(1
,980
,271
) -
-
-
-
-
-
(1
,980
,271
)
Bal
ance
at
31
Dec
embe
r 20
169,
901,3
5511
5,39
2,41
432
,458
,239
7,75
3,81
1 -
5,
795,
630
1,293
,023
6,
278,
522
-
178,
872,
994
FCMB Group Plc Annual Report and Accounts 2017 63
Introduction Operating Review
Corporate Governance
Financial Statements
Shareholder Information
Other National Disclosures
Branches and Account Opening Information
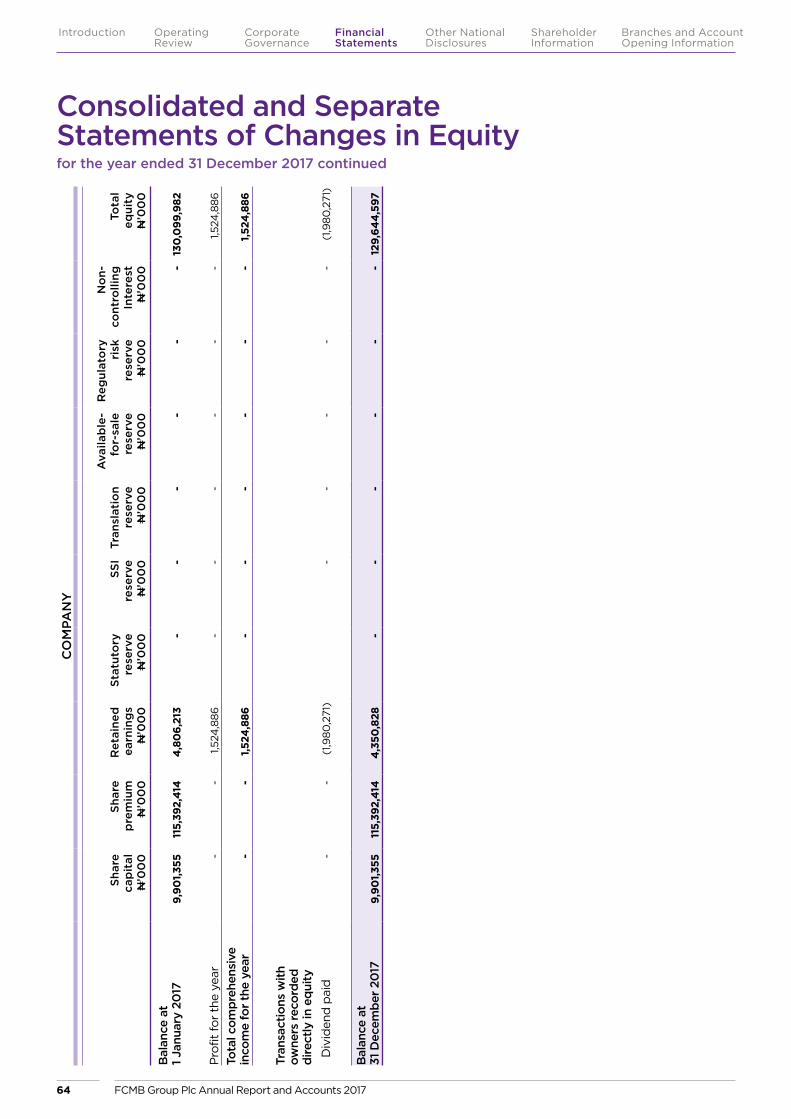
Consolidated and Separate Statements of Changes in Equityfor the year ended 31 December 2017 continued
CO
MPA
NY
Shar
e ca
pit
alN
’00
0
Shar
e p
rem
ium
N’0
00
Ret
aine
d
earn
ing
sN
’00
0
Stat
uto
ry
rese
rve
N’0
00
SSI
rese
rve
N’0
00
Tran
slat
ion
rese
rve
N’0
00
Ava
ilab
le-
for-
sale
re
serv
eN
’00
0
Reg
ulat
ory
ri
sk
rese
rve
N’0
00
No
n-co
ntro
lling
In
tere
stN
’00
0
Tota
l eq
uity
N’0
00
Bal
ance
at
1 J
anua
ry 2
017
9,90
1,355
115,
392,
414
4,8
06,
213
-
-
-
-
-
-
130
,099
,982
Pro
fit fo
r th
e ye
ar -
-
1,5
24,8
86 -
-
-
-
-
-
1,5
24,8
86
Tota
l com
preh
ensi
ve
inco
me
for
the
year
-
-
1,524
,886
-
-
-
-
-
-
1,524
,886
Tran
sact
ions
with
ow
ners
reco
rded
di
rect
ly in
equ
ityD
ivid
end
pai
d -
-
(1
,980
,271
) -
-
-
-
-
(1
,980
,271
)
Bal
ance
at
31
Dec
embe
r 20
179,
901,3
5511
5,39
2,41
44
,350
,828
-
-
-
-
-
-
129,
644
,597
FCMB Group Plc Annual Report and Accounts 201764
Introduction Operating Review
Corporate Governance
Financial Statements
Shareholder Information
Other National Disclosures
Branches and Account Opening Information

CO
MPA
NY
Shar
e ca
pit
alN
’00
0
Shar
e p
rem
ium
N’0
00
Ret
aine
d
earn
ing
sN
’00
0
Stat
uto
ry
rese
rve
N’0
00
SSI
rese
rve
N’0
00
Tran
slat
ion
rese
rve
N’0
00
Ava
ilab
le-
for-
sale
re
serv
eN
’00
0
Reg
ulat
ory
ri
sk
rese
rve
N’0
00
No
n-co
ntro
lling
In
tere
stN
’00
0
Tota
l eq
uity
N’0
00
Bal
ance
at
1 J
anua
ry 2
016
9,90
1,355
115,
392,
414
3,0
56,2
24 -
-
-
-
-
-
12
8,34
9,99
3
Pro
fit fo
r th
e ye
ar -
-
3,
730
,260
-
-
-
-
-
-
3,73
0,2
60
Tota
l com
preh
ensi
ve
inco
me
for
the
year
-
-
3,73
0,2
60 -
-
-
-
-
-
3,
730
,260
Tran
sact
ions
with
ow
ners
reco
rded
di
rect
ly in
equ
ityD
ivid
end
pai
d -
-
(1
,980
,271
) -
-
-
-
-
-
(1
,980
,271
)
Bal
ance
at
31
Dec
embe
r 20
169,
901,3
5511
5,39
2,41
44
,80
6,21
3 -
-
-
-
-
-
13
0,0
99,9
82
The
acc
om
pan
ying
no
tes
are
an in
teg
ral p
art
of
thes
e co
nso
lidat
ed a
nd s
epar
ate
fina
ncia
l sta
tem
ents
.
FCMB Group Plc Annual Report and Accounts 2017 65
Introduction Operating Review
Corporate Governance
Financial Statements
Shareholder Information
Other National Disclosures
Branches and Account Opening Information

GROUP COMPANY
Note 2017
N’000 2016
N’000 2017
N’000 2016
N’000
Cash flows from operating activitiesProfit for the year 9,410,204 14,338,882 1,524,886 3,730,260
Adjustments for:Net impairment loss on financial assets 9 22,667,506 35,522,071 - 105,589
Fair value (gain)/loss on financial assets held for trading 50(i) (50,317) 54,622 - -
Net income from other financial instruments at fair value through profit or loss 12 (111,891) (21,635) - -
Depreciation and amortisation 15 5,259,712 4,474,071 22,013 24,362
(Gain)/loss on disposal of property and equipment 13 (1,040,777) 1,408,352 (46) (570)
(Gain)/loss on disposal of investment securities 13 (19,357) 769,929 - (42,387)
Share of profit of associates 28(a) (226,849) (272,749) - -
Loss on previously held equity interest in associate company 13 106,569 - - -
Unrealised foreign exchange gains 13 (8,722,791) (29,310,033) (208,384) (1,883,509)
Net interest income 50(x) (70,525,135) (69,533,508) (886,565) (475,474)
Dividend income 13 (567,166) (448,538) (793,045) (2,252,195)
Tax expense 19 2,052,188 1,912,515 15,333 19,351
(41,768,104) (41,106,021) (325,808) (774,574)
Changes in operating assets and liabilitiesNet decrease/(increase) in restricted reserve deposits 50(xi) 29,822,355 (13,908,596) - -
Net decrease derivative assets held for risk management 50(xii) - 971,983 - -
Net increase trading assets 50(xiii) (14,674,659) (6,997,345) - -
Net decrease/(increase) loans and advances to customers 50(xiv) 13,685,485 (64,883,315) - -
Net decrease/(increase) in other assets 50(xv) 5,524,076 4,924,296 1,335,957 (659,134)
Net decrease/(increase) in trading liabilities 50(xvi) 15,360,727 (6,255,933) - -
Net (decrease)/increase in deposits from banks 50(xvii) (18,442,907) 19,337,258 - -
Net increase/(decrease) in deposits from customers 50(xviii) 32,250,833 (42,606,899) - -
Net (decrease)/increase in on-lending facilities 50(xix) (1,407,618) 7,758,788 - -
Net decrease in derivative liabilities held for risk management 50(xx) (770,201) (1,073,123) - -
Net increase/(decrease) in provision 50(viii) 2,879,461 (535,973) (113,234) (10,453)
Net (decrease)/increase in other liabilities 50(vii) (8,014,690) (16,685,977) 815,669 218,622
14,444,758 (161,060,857) 1,712,584 (1,225,539)
Consolidated and Separate Statements of Cash Flowsfor the year ended 31 December 2017
FCMB Group Plc Annual Report and Accounts 201766
Introduction Operating Review
Corporate Governance
Financial Statements
Shareholder Information
Other National Disclosures
Branches and Account Opening Information

GROUP COMPANY
Note 2017
N’000 2016
N’000 2017
N’000 2016
N’000
Interest received 50(ii) 147,430,320 137,414,576 886,565 475,474
Interest paid 50(iii) (63,000,614) (55,753,584) - -
Dividends received 50(xxii) 567,166 448,538 228,417 2,252,195
VAT paid 50(iv) (916,195) (884,172) (1,727) -
Income taxes paid 19(v) (410,944) (1,935,705) - -
Net cash generated from/(used in) operating activities 98,114,491 (81,771,204) 2,825,839 1,502,130
Cash flows from investing activitiesInvestment in subsidiaries - - (7,035,353) -
Purchase of property and equipment 29 (6,663,504) (3,868,517) (357) (68,305)
Purchase of intangible assets 30(a) (329,067) (302,185) - -
Purchase of intangible assets – work-in-progress 30(a) (1,091,969) (927,242) - -
Proceeds from sale of property and equipment 50(ix) 2,374,084 247,912 720 27,271
Acquisition of investment securities 50(v) (122,338,995) (79,557,022) (318,858) (2,442,000)
Proceeds from sale and redemption of investment securities 50(v) 59,101,963 77,322,034 57,907 42,387
Net cash used in investing activities (68,947,488) (7,085,020) (7,295,941) (2,440,647)
Cash flows from financing activitiesDividend paid (1,980,271) (1,980,271) (1,980,271) (1,980,271)
Proceeds from long term borrowing 35(c) 10,298,880 33,996,484 - -
Repayment of long term borrowing 35(c) (43,184,244) (68,348,938) - -
Proceeds from debt securities issued 50(xxi) - 5,104,000 - -
Net cash used in financing activities (34,865,635) (31,228,725) (1,980,271) (1,980,271)
Net decrease in cash and cash equivalents (5,698,632) (120,084,950) (6,450,373) (2,918,788)
Cash and cash equivalents at start of year 47 108,104,632 180,921,698 5,817,754 7,231,196
Effect of exchange rate fluctuations on cash and cash equivalents held 50(vi) 1,482,007 47,267,884 778,985 1,505,347
Cash and cash equivalents at end of year 47 103,888,007 108,104,632 146,366 5,817,754
The accompanying notes are an integral part of these consolidated and separate financial statements.
FCMB Group Plc Annual Report and Accounts 2017 67
Introduction Operating Review
Corporate Governance
Financial Statements
Shareholder Information
Other National Disclosures
Branches and Account Opening Information
1 Reporting Entity
FCMB Group Plc was incorporated in Nigeria as a financial holding company on November 20, 2012, under the Companies and Allied Matters Act, in response to the CBN’s Regulation on the Scope of Banking Activities and Ancillary Matters (Regulation 3).
The principal activity of FCMB Group Plc is to carry on business as a financial holding company, investing in and holding controlling shares in, as well as managing equity investments in Central Bank of Nigeria approved financial entities. The Company has six direct subsidiaries; First City Monument Bank Limited (100%), FCMB Capital Markets Limited (100%), CSL Stockbrokers Limited (100%), CSL Trustees Limited (100%), FCMB Microfinance Bank Limited (100%) and Legacy Pension Managers Limited (88.22%).
FCMB Group Plc is a company domiciled in Nigeria. The address of the company’s registered office is 44 Marina, Lagos. These audited reports for the year ended 31 December 2017 comprise the Company and its subsidiaries (together referred to as the ‘Group’).
2 Significant Accounting Policies
The Group has consistently applied the following accounting policies to all periods presented in these consolidated and separate financial statements, unless otherwise stated.
The principal accounting policies adopted in the preparation of these financial statements are set out below:
(a) Basis of Preparation
(i) Statement of compliance
The consolidated and separate financial statements have been prepared in accordance with International Financial Reporting Standards (IFRSs) as issued by International Accounting Standard Board (IASB) in the manner required by the Companies and Allied Matters Act, Cap C20, Laws of the Federation of Nigeria 2004, the Financial Reporting Council of Nigeria Act, 2011, the Banks and Other Financial Institutions Act, Cap B3, Laws of the Federation of Nigeria, and relevant Central Bank of Nigeria circulars and
guidelines. The IFRS accounting policies have been consistently applied to all periods presented.
These consolidated and separate financial statements were authorised for issue by the Board of directors on 8 March 2018.
(ii) Basis of measurement
These consolidated and separate financial statements have been prepared on the historical cost basis except for the following material items in the statement of financial position:
� Non-derivative financial instruments, at fair value through profit or loss are measured at fair value.
� Available-for-sale financial assets are measured at fair value through other comprehensive income (OCI). However, when the fair value of the available-for-sale financial assets cannot be measured reliably, they are measured at cost less impairment.
� Financial assets and liabilities held for trading are measured at fair value.
� Derivative financial instruments are measured at fair value.
(iii) Functional and presentation currency
These consolidated and separate financial statements are presented in Naira, which is the Company’s functional currency. Except where indicated, financial information presented in Naira has been rounded to the nearest thousand.
(iv) Use of estimates and judgements
The preparation of the consolidated and separate financial statements in conformity with IFRS requires management to make judgments, estimates and assumptions that affect the application of policies and reported amounts of assets and liabilities, income and expenses. The estimates and associated assumptions are based on historical experience and various other factors that are believed to be reasonable under the circumstances, the results of which form the basis of making the judgments about carrying values of assets and liabilities that are not readily apparent from other sources. Actual results may differ from these estimates.
Notes to the Consolidated and Separate Financial Statementsfor the year ended 31 December 2017
FCMB Group Plc Annual Report and Accounts 201768
Introduction Operating Review
Corporate Governance
Financial Statements
Shareholder Information
Other National Disclosures
Branches and Account Opening Information

Estimates and underlying assumptions are reviewed on an ongoing basis. Revisions to accounting estimates are recognized in the period in which the estimate is revised and in any future periods affected.
Information about significant areas of estimation uncertainties and critical judgments in applying accounting policies that have the most significant effect on the amounts recognised in the consolidated financial statements are described in note 4.
(b) Basis of Consolidation
(i) Subsidiaries
Subsidiaries are investees controlled by the Group. The Group ‘controls’ an investee if it is exposed to, or has the rights to, variable returns from its involvement with the investee and has the ability to affect those returns through its power over the investee. The Group reassesses whether it has control if there are changes to one or more of elements of control. This includes circumstances in which protective rights held become substantive and lead to the Group having power over an investee.
The financial statements of subsidiaries are included in the consolidated financial statements from the date that control commences until the date that control ceases. Investment in subsidiaries are measured at cost less impairment in the Company’s separate financial statements.
(ii) Special purpose entities
Special purpose entities (SPEs) are entities that are created to accomplish a narrow and well-defined objective such as the execution of a specific borrowing or lending transaction. A SPE is consolidated if, based on an evaluation of the substance of its relationship with the Group and the SPE’s risks and rewards, the Group concludes that it controls the SPE.
The Group established FCMB Financing SPV Plc, Nigeria as a special purpose entity to raise capital from the Nigerian capital markets or other international market either by way of a stand-alone issue or by the establishment of a programme. Accordingly, the financial statements of FCMB Financing SPV Plc have been consolidated.
(iii) Loss of control
On the loss of control, the Group derecognises the assets and liabilities of the subsidiary, any non-controlling interests and the other components of equity related to the subsidiary. Any surplus or deficit arising on the loss of control is recognised in statement of profit or loss. If the Group retains any interests in the previous subsidiary, then such interests is measured at fair value at the date that control is lost. Subsequently, that retained interest is accounted for as an equity-accounted investee or in accordance with the Group’s accounting for financial instruments.
Changes in the Group’s interest in a subsidiary that do not result in a loss of control are accounted for as equity transactions.
(iv) Investments in associates (equity-accounted investees)
Associates are those entities in which the Group has significant influence, but not control, over the financial and operating policies. Significant influence is presumed to exist when the Group holds between 20 and 50 percent of the voting power of another entity.
Investments in associates are accounted for using the equity method (equity-accounted investees) and are recognised initially at cost. The cost of the investment includes transaction costs.
The consolidated financial statements include the Group’s share of the profit or loss and other comprehensive income of equity-accounted investments, after adjustments to align the accounting policies with those of the Group, from the date that significant influence commences until the date that significant influence ceases.
When the Group’s share of losses exceeds its interest in an equity-accounted investee, the carrying amount of that interest, including any long-term investments, is reduced to zero, and the recognition of further losses is discontinued except to the extent that the Group has an obligation or has made payments on behalf of the investee.
FCMB Group Plc Annual Report and Accounts 2017 69
Introduction Operating Review
Corporate Governance
Financial Statements
Shareholder Information
Other National Disclosures
Branches and Account Opening Information

(v) Transactions eliminated on consolidation
Intra-group balances and any unrealised income and expenses arising from intra-group transactions, are eliminated in preparing the consolidated financial statements. Unrealised gains arising from transactions with equity-accounted investees are eliminated against the investment to the extent of the Group’s interest in the investee. Unrealised losses are eliminated in the same way as unrealised gains, but only to the extent that there is no evidence of impairment.
(vi) Non-controlling interest
Non-controlling interest are measured at their proportionate share of the acquiree’s identifiable net assets at the date of acquisition. Changes in the Group’s interest in a subsidiary that do not result in a loss of control are accounted for as equity transactions.
(c) Foreign Currency
(i) Foreign currency transactions
Transactions in foreign currencies are translated into the respective functional currencies of the operations at the spot exchange rates at the dates of the transactions.
Monetary assets and liabilities denominated in foreign currencies at the reporting date are translated into the functional currency at the spot exchange rates as at that date. The foreign currency gain or loss is the difference between amortised cost in the functional currency at the beginning of the year, adjusted for effective interest and payments during the year, and the amortized cost in foreign currency translated at the spot exchange rate at the end of the year.
Non-monetary assets and liabilities denominated in foreign currencies that are measured at fair value are translated into the functional currency at the spot exchange rate at the date that the fair value was determined. Non-monetary assets and liabilities that are measured in terms of historical cost in a foreign currency are translated using the exchange rate at the date of the transaction.
Foreign currency differences arising on translation are recognised in statement of profit or loss, except for differences arising on the translation
of available-for-sale equity instruments, which are recognised in other comprehensive income.
(ii) Foreign operations
The assets and liabilities of foreign operations, including goodwill and fair value adjustments arising on acquisition, are translated to Naira at the spot exchange rates at the reporting date. The income and expenses of foreign operations are translated to Naira at spot exchange rates at the dates of the transactions.
Foreign currency differences are recognised in other comprehensive income, and presented in the foreign currency translation reserve, except to the extent that the translation difference is allocated to non-controlling interests (NCI). When a foreign operation is disposed of such that control is lost, the cumulative amount in the translation reserve related to that foreign operation is reclassified to statement of profit or loss as part of the gain or loss on disposal. When the Group disposes of only part of its interest in a subsidiary that includes a foreign operation while retaining control, the relevant proportion of the cumulative amount is reattributed to non-controlling interests.
When the settlement of a monetary item receivable from or payable to a foreign operation is neither planned nor likely in the foreseeable future, foreign currency gains or losses arising from such item are considered to form part of a net investment in the foreign operation and are recognised in other comprehensive income, and presented in the translation reserve in equity.
(d) Interest
Interest income and expense on financial instruments are recognised in the statement of profit or loss using the effective interest method.
The effective interest rate is the rate that exactly discounts the estimated future cash payments and receipts through the expected life of the financial asset or liability (or, where appropriate, the next repricing date) to the carrying amount of the financial asset or liability. When calculating the effective interest rate, the Group estimates future cash flows considering all contractual terms of the financial instruments but not future credit losses.
Notes to the Consolidated and Separate Financial Statementsfor the year ended 31 December 2017 continued
FCMB Group Plc Annual Report and Accounts 201770
Introduction Operating Review
Corporate Governance
Financial Statements
Shareholder Information
Other National Disclosures
Branches and Account Opening Information

The calculation of the effective interest rate includes contractual fees and points paid or received, transaction costs, and discounts or premiums that are an integral part of the effective interest rate. Transaction costs are incremental costs that are directly attributable to the acquisition, issue or disposal of a financial asset or liability.
Interest income and expense presented in the statement of profit or loss and other comprehensive income include:
� Interest on financial assets and liabilities measured at amortised cost calculated on an effective interest rate basis.
� Interest on available for sale investment securities calculated on an effective interest rate basis.
Interest income and expense on all trading assets and liabilities are considered to be incidental to the Group’s trading operations and are presented together with all other changes in the fair value of trading assets and liabilities in net trading income.
(e) Fees and Commission
Fees and commission income and expenses that are integral to the effective interest rate on a financial asset or liability are included in the measurement of the effective interest rate which is used in the computation of Interest Income. Fees, such as processing and management fees charged for assessing the financial position of the borrower, evaluating and reviewing guarantees, collateral and other security, negotiation of instruments’ terms, preparing and processing documentation and finalising the transaction are an integral part of the effective interest rate on a financial asset or liability and are included in the measurement of the effective interest rate of financial assets or liabilities.
Other fees and commission income, including loan account servicing fees, investment management and other fiduciary activity fees, sales commission, placement fees and syndication fees, are recognised as the related services are performed. When a loan commitment is not expected to result in the draw-down of a loan,
loan commitment fees are recognised on a straight-line basis over the commitment period.
Other fees and commission expense relates mainly to transaction and service fees, which are expensed as the services are received.
(f) Net Trading Income
Net trading income comprises gains less losses related to trading assets and liabilities, and includes all realised and unrealised fair value changes, dividends and foreign exchange differences.
(g) Net Income from Other Financial Instruments at Fair Value Through Profit or Loss
Net income from other financial instruments at fair value through profit or loss relates to fair value gains or losses on non-trading derivatives held for risk management purposes that do not form part of qualifying hedge relationships and financial assets and liabilities designated at fair value through profit or loss. It includes all realised and unrealised fair value changes, interest, dividends and foreign exchange differences.
(h) Dividend Income
Dividend income is recognised when the right to receive income is established. Dividends on trading equities are reflected as a component of net trading income. Dividend income on long term equity investments is recognised as a component of other operating income.
(i) Leases
(i) Lease payments – Lessee
Payments made under operating leases are recognised in statement of profit or loss on a straight-line basis over the term of the lease. Lease incentives received are recognised as an integral part of the total lease expense, over the term of the lease.
Minimum lease payments made under finance leases are apportioned between the finance expense and the reduction on the outstanding liability. The finance expense is allocated to each period during the lease term so as to produce a constant periodic rate of interest on the remaining balance of the liability.
FCMB Group Plc Annual Report and Accounts 2017 71
Introduction Operating Review
Corporate Governance
Financial Statements
Shareholder Information
Other National Disclosures
Branches and Account Opening Information

Contingent lease payments are accounted for by revising the minimum lease payments over the remaining term of the lease when the lease adjustment is confirmed.
(ii) Lease assets – Lessee
Assets held by the Group under leases that transfer to the Group substantially all of the risks and rewards of ownership are classified as finance leases. The leased asset is initially measured at an amount equal to the lower of its fair value and the present value of the minimum lease payments. Subsequent to initial recognition, the asset is accounted for in accordance with the accounting policy applicable to that asset.
Assets held under other leases are classified as operating leases and are not recognised in the Group’s statement of financial position.
(iii) Lease assets – Lessor
If the Group is the lessor in a lease agreement that transfers substantially all of the risks and rewards incidental to ownership of the asset to the lessee, then the arrangement is classified as a finance lease and a receivable equal to the net investment in the lease is recognised and presented within loans and advances (see (o))
Finance charges earned are computed using the effective interest method which reflects a constant periodic return on the investment in the finance lease. Initial direct costs paid are capitalized to the value of the lease amount receivable and accounted for over the lease term as an adjustment to the effective rate of return.
(j) Income Tax
Income tax expense comprises current and deferred tax. Current and deferred tax are recognised in statement of profit or loss except to the extent that they relate to items recognised directly in equity or in other comprehensive income.
(i) Current income tax
Income tax payable is calculated on the basis of the applicable tax law in the respective jurisdiction and it consists of Company Income Tax, Education tax and NITDA levy. Company Income tax is
assessed at 30% statutory rate of total profit whereas Education tax is computed as 2% of assessable profit while NITDA levy is a 1% levy on Profit Before Tax of the Company and the subsidiary companies.
Current income tax and adjustments to past years tax liability is recognised as an expense for the period except to the extent that the current tax relates to items that are charged or credited in other comprehensive income or directly to equity. In these circumstances, current tax is charged or credited to other comprehensive income or to equity (for example, current tax on available-for-sale investments).
The Group evaluates positions stated in tax returns; ensuring information disclosed are in agreement with the underlying tax liability.
(ii) Deferred tax
Deferred tax is recognised in respect of temporary differences between the carrying amounts of assets and liabilities for financial reporting purposes and the amounts used for taxation purposes. Deferred tax is not recognised for:
� temporary differences on the initial recognition of assets or liabilities in a transaction that is not a business combination and that affects neither accounting nor taxable profit or loss;
� temporary differences related to investments in subsidiaries to the extent that it is probable that they will not reverse in the foreseeable future; and
� taxable temporary differences arising on the initial recognition of goodwill.
Where the Group has tax losses that can be relieved only by carry-forward against taxable profits of future periods, a deductible temporary difference arises. Those losses carried forward are set off against deferred tax liabilities carried in the consolidated statement of financial position.
The measurement of deferred tax reflects the tax consequences that would follow the manner in which the Group expects, at the end of the reporting period, to recover or settle the carrying amount of its assets and liabilities.
Notes to the Consolidated and Separate Financial Statementsfor the year ended 31 December 2017 continued
FCMB Group Plc Annual Report and Accounts 201772
Introduction Operating Review
Corporate Governance
Financial Statements
Shareholder Information
Other National Disclosures
Branches and Account Opening Information
Deferred tax is measured at the tax rates that are expected to be applied to temporary differences when they reverse, using tax rates enacted or substantively enacted at the reporting date.
Deferred tax assets and liabilities are offset if there is a legally enforceable right to offset current tax liabilities and assets, and they relate to taxes levied by the same tax authority on the same taxable entity or on different tax entities, but they intend to settle current tax liabilities and assets on a net basis or their tax assets and liabilities will be realised simultaneously.
Additional taxes that arise from the distribution of dividend by the Group are recognised at the same time as the liability to pay the related dividend is recognised. These amounts are generally recognised in statement of profit or loss because they generally relate to income arising from transactions that were originally recognised in statement of profit or loss.
A deferred tax asset is recognised for unused tax losses, tax credits and deductible temporary differences to the extent that it is probable that future taxable profits will be available against which it can be utilised. Deferred tax assets are reviewed at each reporting date and are reduced to the extent that it is no longer probable that the related tax benefit will be realised.
Unrecognised deferred tax assets are reassessed at each reporting date and recognised to the extent that it has become probable that future taxable profits will be available against which they can be used.
(iii) Tax exposures
In determining the amount of current and deferred tax, the Group takes into account the impact of uncertain tax positions and whether additional taxes and interest may be due. This assessment relies on estimates and assumptions and may involve a series of judgments about future events. New information may become available that causes the Group to change its judgment regarding the adequacy of existing tax liabilities; such changes to tax liabilities will impact tax expense in the period that such a determination is made.
(k) Financial Assets and Financial Liabilities
(i) Recognition
The Group initially recognises loans and advances, deposits, bonds, treasury bills and other securities on the date that they are originated. All other financial assets and financial liabilities (including assets and liabilities designated at fair value through profit or loss) are initially recognised on the trade date at which the Group becomes a party to the contractual provisions of the instrument.
All financial assets or financial liabilities are measured initially at their fair value plus or minus transaction costs, except in the case of financial assets and financial liabilities recorded at fair value through profit or loss. Subsequent recognition of financial assets and liabilities is at amortised cost or fair value.
(ii) Classification
Financial assets
The classification of financial instruments depends on the purpose and management’s intention for which the financial instruments were acquired and their characteristics. The Group classifies its financial assets in the following categories:
� loan and receivables
� held to maturity
� available-for-sale
� at fair value through profit or loss and within the category as:
� held for trading; or
� designated at fair value through profit or loss.
See notes 2(m), (o), and (p).
Financial liabilities
The Group classifies its financial liabilities as measured at amortised cost or fair value through profit or loss.
FCMB Group Plc Annual Report and Accounts 2017 73
Introduction Operating Review
Corporate Governance
Financial Statements
Shareholder Information
Other National Disclosures
Branches and Account Opening Information
(iii) De-recognition
Financial assets
The Group derecognises a financial asset when the contractual rights to the cash flows from the financial asset expire, or when it transfers the rights to receive the contractual cash flows on the financial asset in a transaction in which substantially all of the risks and rewards of ownership of the financial asset are transferred. Any interest in transferred financial assets that is created or retained by the Group is recognised as a separate asset or liability.
On derecognition of financial asset, the difference between the carrying amount of the asset (or the carrying amount allocated to the portion of the asset transferred), and the sum of (i) the consideration received (including any new asset obtained less any new liability assumed) and (ii) any cumulative gain or loss that had been recognised in other comprehensive income is recognised in statement of profit or loss.
The Group enters into transactions whereby it transfers assets recognised on its statement of financial position, but retains either all or substantially all of the risks and rewards of the transferred assets or a portion of them. If all or substantially all risks and rewards are retained, then the transferred assets are not derecognised. Transfers of assets with retention of all or substantially all risks and rewards include, for example, securities lending and repurchase transactions.
In transactions in which the Group neither retains nor transfers substantially all the risks and rewards of ownership of a financial asset and it retains control over the asset, the Group continues to recognise the asset to the extent of its continuing involvement, determined by extent to which it is exposed to changes in the value of the transferred asset.
The rights and obligations retained in the transfer are recognised separately as assets and liabilities as appropriate. In transfers where control over the asset is retained, the Group continues to recognise the asset to the extent of its continuing
involvement, determined by the extent to which it is exposed to changes in the value of the transferred asset.
Financial liabilities
The Group derecognises a financial liability when its contractual obligations are discharged, cancelled or expire.
(iv) Offsetting
Financial assets and liabilities are set off and the net amount presented in the statement of financial position when, and only when, the Group has a legally enforceable right to set off the amounts and it intends either to settle them on a net basis or to realise the asset and settle the liability simultaneously.
Income and expenses are presented on a net basis only when permitted under IFRS, or for gains and losses arising from a group of similar transactions such as in the Group’s trading activity.
(v) Amortised cost measurement
The amortised cost of a financial asset or liability is the amount at which the financial asset or liability is measured at initial recognition, minus principal repayments, plus or minus the cumulative amortisation using the effective interest method of any difference between the initial amount recognised and the maturity amount, minus any reduction for impairment.
(vi) Fair value measurement
‘Fair value’ is the price that would be received to sell an asset or paid to transfer a liability in an orderly transaction between market participants at the measurement date in the principal or, in its absence, the most advantageous market to which the Group has access at that date. The fair value of a liability reflects its non-performance risk.
When available, the Group measures the fair value of an instrument using the quoted price in an active market for that instrument. A market is regarded as active if transactions for the asset or liability take place with sufficient frequency and volume to provide pricing information on an ongoing basis.
Notes to the Consolidated and Separate Financial Statementsfor the year ended 31 December 2017 continued
FCMB Group Plc Annual Report and Accounts 201774
Introduction Operating Review
Corporate Governance
Financial Statements
Shareholder Information
Other National Disclosures
Branches and Account Opening Information
If there is no quoted price in an active market, then the Group uses valuation techniques that maximises the use of relevant observable inputs and minimises the use of unobservable inputs. The chosen valuation technique incorporates all of the factors that market participants would take into account in pricing a transaction.
The best evidence of the fair value of a financial instrument at initial recognition is normally the transaction price – i.e. the fair value of the consideration given or received. If the Group determines that the fair value at initial recognition differs from the transaction price and the fair value is evidenced neither by a quoted price in an active market for an identical asset or liability nor based on a valuation technique that uses only data from observable markets, then the financial instrument is initially measured at fair value, adjusted to defer the difference between the fair value at initial recognition and the transaction price. Subsequently, that difference is recognised in statement of profit or loss on an appropriate basis over the life of the instrument but no later than when the valuation is wholly supported by observable market data or the transaction is closed out.
If an asset or a liability measured at fair value has a bid price and an ask price, then the Group measures assets and long positions at a bid price and liabilities and short positions at an ask price. Portfolios of financial assets and financial liabilities that are exposed to market risk and credit risk that are managed by the Group on the basis of the net exposure to either market or credit risk are measured on the basis of a price that would be received to sell a net long position (or paid to transfer a net short position) for a particular risk exposure. Those portfolio level adjustments are allocated to the individual assets and liabilities on the basis of the relative risk adjustment of each of the individual instruments in the portfolio.
For more complex instruments, the Group uses internally developed models, which are usually based on valuation methods and techniques
generally recognised as standard within the industry. Valuation models are used primarily to value derivatives transacted in the over-the-counter market, unlisted debt securities and other debt instruments for which markets were or have become illiquid. Some of the inputs to these models may not be market observable and are therefore estimated based on assumptions. The impact on net profit of financial instrument valuations reflecting non-market observable inputs (level 3 valuations) is disclosed in the Note to the accounts.
In cases when the fair value of unlisted equity instruments cannot be determined reliably, the instruments are carried at cost less impairment. The fair value for loans and advances as well as liabilities to banks and customers are determined using a present value model on the basis of contractually agreed cash flows, taking into account credit quality, liquidity and costs. The fair values of contingent liabilities correspond to their carrying amounts.
The fair value of a demand deposit is not less than the amount payable on demand, discounted from the first date on which the amount could be required to be paid.
The Group recognises transfers between levels of the fair value hierarchy as of the end of the reporting period during which the change has occurred.
(vii) Identification and measurement of impairment
Assets classified as loan and advances and held-to-maturity investment securities;
At each reporting date the Group assesses whether there is objective evidence that financial assets not carried at fair value through profit or loss are impaired. A financial asset or a group of financial assets is impaired when objective evidence demonstrates that a loss event has occurred after the initial recognition of the assets(s), and that the loss event has an impact on the future cash flows of the asset(s) that can be estimated reliably.
FCMB Group Plc Annual Report and Accounts 2017 75
Introduction Operating Review
Corporate Governance
Financial Statements
Shareholder Information
Other National Disclosures
Branches and Account Opening Information
Objective evidence that financial assets are impaired can include;
(a) a breach of contract, such as a default or delinquency in interest or principal payments;
(b) significant financial difficulty of the issuer or obligor;
(c) the lender, for economic or legal reasons relating to the borrower’s financial difficulty, granting to the borrower a concession that the lender would not otherwise consider;
(d) it becomes probable that the borrower will enter bankruptcy or other financial reorganisation;
(e) the disappearance of an active market for that financial asset because of financial difficulties; or
(f) observable data indicating that there is a measurable decrease in the estimated future cash flows from a portfolio of financial assets since the initial recognition of those assets, although the decrease cannot yet be identified with the individual financial assets in the portfolio, including:(i) adverse changes in the payment status of
borrowers in the portfolio; and (ii) national economic conditions that correlate
with defaults on the assets in the portfolio.
The Group first assesses whether objective evidence of impairment exists individually for financial assets that are individually significant, and individually or collectively for financial assets that are not individually significant. If the Group determines that no objective evidence of impairment exists for an individually assessed financial asset, whether significant or not, it includes the asset in a group of financial assets with similar credit risk characteristics and collectively assesses them for impairment. Assets that are individually assessed for impairment and for which an impairment loss is or continues to be recognised are not included in a collective assessment of impairment.
The amount of the loss is measured as the difference between the asset’s carrying amount
and the present value of estimated future cash flows (excluding future credit losses that have not been incurred) discounted at the financial asset’s original effective interest rate. The carrying amount of the asset is reduced through the use of an allowance account and the amount of the loss is recognised in the consolidated statement of profit or loss. If a loan or held-to-maturity investment has a variable interest rate, the discount rate for measuring any impairment loss is the current effective interest rate determined under the contract. As a practical expedient, the Group may measure impairment on the basis of an instrument’s fair value using an observable market price.
The calculation of the present value of the estimated future cash flows of a collateralized financial asset reflects the cash flows that may result from foreclosure less costs for obtaining and selling the collateral, whether or not foreclosure is probable.
For the purposes of a collective evaluation of impairment, financial assets are grouped on the basis of similar credit risk characteristics (that is, on the basis of the Group’s grading process that considers asset type, industry, geographical location, collateral type, past-due status and other relevant factors). Those characteristics are relevant to the estimation of future cash flows for groups of such assets by being indicative of the debtors’ ability to pay all amounts due according to the contractual terms of the assets being evaluated.
Future cash flows in a group of financial assets that are collectively evaluated for impairment are estimated on the basis of the contractual cash flows of the assets in the group and historical loss experience for assets with credit risk characteristics similar to those in the group. Historical loss experience is adjusted on the basis of current observable data to reflect the effects of current conditions that did not affect the period on which the historical loss experience is based and to remove the effects of conditions in the historical period that do not currently exist.
Estimates of changes in future cash flows for groups of assets should reflect and be directionally consistent with changes in related observable data from period to period (for example, changes in unemployment rates, property prices, payment
Notes to the Consolidated and Separate Financial Statementsfor the year ended 31 December 2017 continued
FCMB Group Plc Annual Report and Accounts 201776
Introduction Operating Review
Corporate Governance
Financial Statements
Shareholder Information
Other National Disclosures
Branches and Account Opening Information
status, or other factors indicative of changes in the probability of losses in the Group and their magnitude). The methodology and assumptions used for estimating future cash flows are reviewed regularly by the Group to reduce any differences between loss estimates and actual loss experience.
When a loan is uncollectible, it is written off against the related allowance for loan impairment. Such loans are written off after all the necessary procedures have been completed and the amount of the loss has been determined. Impairment charges relating to loans and advances to banks and customers are classified in loan impairment charges whilst impairment charges relating to investment securities (held to maturity categories) are classified in ‘Net gains/(losses) from financial instruments at fair value’.
If, in a subsequent period, the amount of the impairment loss decreases and the decrease can be related objectively to an event occurring after the impairment was recognised (such as an improvement in the debtor’s credit rating), the previously recognised impairment loss is reversed by adjusting the allowance account. The amount of the reversal is recognised in the statement of profit or loss.
Assets classified as available for sale
The Group assesses at reporting date whether there is objective evidence that a financial asset or a group of financial assets is impaired. In the case of equity investments classified as available for sale, a significant or prolonged decline in the fair value of the security below its cost is objective evidence of impairment resulting in the recognition of an impairment loss. In general, the Group considers a decline of 20% to be “significant” and a period of nine months to be “prolonged”. If any such evidence exists for available-for-sale financial assets, the cumulative loss – measured as the difference between the acquisition cost and the current fair value, less any impairment loss on that financial asset previously recognised in statement of profit or loss – is removed from equity and recognised in the statement of profit or loss. Impairment losses recognised in the statement of profit or loss on equity instruments are not
reversed through the statement of profit or loss. If, in a subsequent period, the fair value of a debt instrument classified as available for sale increases and the increase can be objectively related to an event occurring after the impairment loss was recognised in statement of profit or loss, the impairment loss is reversed through the statement of profit or loss. Assets classified as available for sale are assessed for impairment in the same manner as assets carried at amortised cost.
(l) Cash and cash equivalents and restricted deposits
Cash and cash equivalents include bank notes and coins on hand, unrestricted balances held with central banks and highly liquid financial assets with original maturities of less than three months, which are subject to an insignificant risk of changes in their fair value, and are used by the Group in the management of its short-term commitments. Cash and cash equivalents are carried at amortised cost in the statement of financial position. Restricted reserve deposits are restricted mandatory reserve deposits held with the Central Bank of Nigeria, which are not available for use in the Banking subsidiary’s and Group’s day-to-day operations. They are calculated as a fixed percentage of the Banking subsidiary’s deposit liabilities.
For the purposes of the statement of cash flow, cash and cash equivalents include cash and non-restricted balances with central banks.
(m) Financial assets and liabilities at fair value through profit or loss
This category comprises two sub-categories: financial assets classified as held for trading, and financial assets designated by the Group as at fair value through profit or loss upon initial recognition.
Financial liabilities for which the fair value option is applied are recognised in the consolidated statement of financial position as ‘Financial liabilities designated at fair value through profit or loss’. Fair value changes relating to financial liabilities designated at fair value through profit or loss are recognised in ‘Net gains on financial instruments designated at fair value through profit or loss’.
FCMB Group Plc Annual Report and Accounts 2017 77
Introduction Operating Review
Corporate Governance
Financial Statements
Shareholder Information
Other National Disclosures
Branches and Account Opening Information
(i) Trading assets and liabilities
Trading assets and liabilities are those assets and liabilities that the Group acquires or incurs principally for the purpose of selling or repurchasing in the near term, or holds as part of a portfolio that is managed together for short-term profit.
Trading assets and liabilities are initially recognised and subsequently measured at fair value in the statement of financial position with transaction costs recognised in statement of profit or loss. All changes in fair value are recognised as part of net trading income in statement of profit or loss.
(ii) Designation at fair value through profit or loss
The Group designates certain financial assets upon initial recognition as at fair value through profit or loss (fair value option). This designation cannot subsequently be changed. According to IAS 39, the fair value option is only applied when the following conditions are met:
� the application of the fair value option reduces or eliminates an accounting mismatch that would otherwise arise or
� the financial assets are part of a portfolio of financial instruments which is risk managed and reported to management on a fair value basis.
Financial assets for which the fair value option is applied are recognised in the consolidated and separate statement of financial position as ‘Financial assets designated at fair value’. Fair value changes relating to financial assets designated at fair value through profit or loss are recognised in ‘Net gains on financial instruments designated at fair value through profit or loss’.
(iii) Reclassification of financial assets and liabilities
The Group may choose to reclassify a non-derivative financial asset held for trading out of the held-for-trading category if the financial asset is no longer held for the purpose of selling it in the near-term. Financial assets other than loans and receivables are permitted to be reclassified out of the held for trading category only in rare
circumstances arising from a single event that is unusual and highly unlikely to recur in the near-term. In addition, the Group may choose to reclassify financial assets that would meet the definition of loans and receivables out of the held-for-trading or available-for-sale categories if the Group has the intention and ability to hold these financial assets for the foreseeable future or until maturity at the date of reclassification.
Reclassifications are made at fair value as of the reclassification date. Fair value becomes the new cost or amortised cost as applicable, and no reversals of fair value gains or losses recorded before reclassification date are subsequently made. Effective interest rates for financial assets reclassified to loans and receivables and held-to-maturity categories are determined at the reclassification date. Further increases in estimates of cash flows adjust effective interest rates prospectively.
(n) Assets Pledged as Collateral
Financial assets transferred to external parties that do not qualify for de-recognition (see k(iii)) are reclassified in the statement of financial position from investment securities to assets pledged as collateral, if the transferee has received the right to sell or re-pledge them in the event of default from agreed terms. Initial measurement of assets pledged as collateral is at fair value, whilst subsequent measurement is based on the classification of the financial asset. Assets pledged as collateral are designated as available for sale or held to maturity. Where the assets pledged as collateral are designated as available for sale, subsequent measurement is at fair value through equity. Assets pledged as collateral designated as held to maturity are measured at amortised cost.
(o) Loans and Advances
Loans and receivables are non-derivative financial assets with fixed or determinable payments that are not quoted in an active market and that the Group does not intend to sell immediately or in the near term.
Loan and receivables from customers and others include:
Notes to the Consolidated and Separate Financial Statementsfor the year ended 31 December 2017 continued
FCMB Group Plc Annual Report and Accounts 201778
Introduction Operating Review
Corporate Governance
Financial Statements
Shareholder Information
Other National Disclosures
Branches and Account Opening Information
� those classified as loan and receivables;
� finance lease receivables; and
� other receivables (other assets).
Loan and receivables are initially measured at fair value plus incremental direct transaction costs, and subsequently measured at their amortised cost using the effective interest method.
When the Group is the lessor in a lease agreement that transfer substantially all of the risks and rewards incidental to ownership of the asset to the lessee, the arrangement is classified as a finance lease and a receivable equal to the net investment in the lease is recognised and presented within loans and advances.
When the Group purchases a financial asset and simultaneously enters into an agreement to resell the asset (or a substantially similar asset) at a fixed price on a future date (“reverse repo or borrowing”), the arrangement is accounted for as a loan or advance, and the underlying asset is not recognised in the Group’s financial statements. Loans and advances are initially measured at fair value plus incremental direct transaction costs, and subsequently measured at their amortised cost using the effective interest method.
(p) Investment Securities
Investment securities are initially measured at fair value plus, in case of investment securities not at fair value through profit or loss, incremental direct transaction costs and subsequently accounted for depending on their classification as either held for trading, held-to-maturity, fair value through profit or loss or available-for-sale.
(i) Held-to-maturity
Held-to-maturity investments are non-derivative assets with fixed or determinable payments and fixed maturity that the Group has the positive intent and ability to hold to maturity, and which are not designated at fair value through profit or loss or available-for-sale.
Held-to-maturity investments are carried at amortised cost using the effective interest method. A sale or reclassification of more than insignificant amount of held-to-maturity
investments would result in the reclassification of all held-to-maturity investments as available-for-sale, and prevent the Group from classifying investment securities as held-to-maturity for the current and the following two financial years. However, sales and reclassifications in any of the following circumstances would not trigger a reclassification to available-for-sale:
� Sales or reclassifications that are so close to maturity that changes in the market rate of interest would not have a significant effect on the financial asset’s fair value.
� Sales or reclassifications after the Group has collected substantially all the asset’s original principal.
� Sales or reclassification attributable to non-recurring isolated events beyond the Group’s control that could not have been reasonably anticipated.
(ii) Fair value through profit or loss
The Group designates some investment securities at fair value with fair value changes recognised immediately in statement of profit or loss.
(iii) Available-for-sale
Available-for-sale investments are non-derivative investments that are not designated as another category of financial assets. Unquoted equity securities whose fair value cannot be reliably measured are carried at cost. All other available-for-sale investments are carried at fair value.
Interest income is recognised in the statement of profit or loss using the effective interest method. Dividend income is recognised in statement of profit or loss when the Group becomes entitled to the dividend. Foreign exchange gains or losses on available-for-sale debt security investments are recognised in statement of profit or loss.
Other fair value changes are recognised directly in other comprehensive income until the investment is sold or impaired whereupon the cumulative gains and losses previously recognised in other comprehensive income are recognised in the statement of profit or loss as a reclassification adjustment.
FCMB Group Plc Annual Report and Accounts 2017 79
Introduction Operating Review
Corporate Governance
Financial Statements
Shareholder Information
Other National Disclosures
Branches and Account Opening Information
A non-derivative financial asset may be reclassified from the available-for-sale category to the loans and receivable category if it otherwise would have met the definition of loans and receivables and if the Group has the intention and ability to hold that financial asset for the foreseeable future or until maturity.
(q) Derivatives Held for Risk Management Purposes
Derivatives held for risk management purposes include all derivative assets and liabilities that are not classified as trading assets or liabilities. Derivatives are recognised initially at fair value in the statement of financial position, while any attributable costs are recognised in the statement of profit or loss when incurred. Subsequent to initial recognition, derivatives are measured at fair value with fair values changes recognised in statement of profit or loss.
(r) Property and Equipment
(i) Recognition and measurement
Items of property and equipment are measured at cost less accumulated depreciation and impairment losses. Cost includes expenditures that are directly attributable to the acquisition of the asset. Purchased software that is integral to the functionality of the related equipment is capitalised as part of the equipment.
When parts of an item of property or equipment have different useful lives, they are accounted for as separate items (major components) of property and equipment.
Items of work in progress are recognised at cost less any observable impairment. A review for impairment is carried out when circumstances or situations suggests that the asset carrying amount may not be recoverable. Impairment loss is recognized when the current asset value is less than the cost.
The gain or loss on disposal of an item of property and equipment is determined by comparing the proceeds from disposal with the carrying amount of the item of property and equipment and are recognized net within other income in the statement of profit or loss.
The assets’ carrying values and useful lives are reviewed, and written down if appropriate, at each date of the consolidated statement of financial position. Assets are impaired whenever events or changes in circumstances indicate that the carrying amount is less than the recoverable amount; see note (t) on impairment of non-financial assets.
(ii) Subsequent costs
The cost of replacing part of an item of property or equipment is recognised in the carrying amount of the item if it is probable that the future economic benefits embodied within the part will flow to the Group and its cost can be measured reliably. The carrying amount of the replaced part is derecognised. The costs of the day-to-day servicing of property and equipment are recognised in the statement of profit or loss as incurred.
(iii) Depreciation
Depreciation is recognised in the statement of profit or loss on a straight-line basis to write down the cost of each asset, to their residual values over the estimated useful lives of each part of an item of property and equipment.
Items classified as work in progress are not depreciated till the asset is available for use.
Depreciation begins when an asset is available for use and ceases at the earlier of the date that the asset is derecognised or classified as held for sale in accordance with IFRS 5. A non-current asset or disposal group is not depreciated while it is classified as held for sale. Leasehold land is not depreciated.
The estimated useful lives for the current and comparative periods of significant items of property and equipment are as follows:
Leasehold land IndefiniteBuildings 50 yearsLeasehold improvement Over the shorter of
the useful life of the item or lease term
Motor vehicles 4 yearsFurniture, fittings and equipment
5 years
Computer equipment 4 years
Notes to the Consolidated and Separate Financial Statementsfor the year ended 31 December 2017 continued
FCMB Group Plc Annual Report and Accounts 201780
Introduction Operating Review
Corporate Governance
Financial Statements
Shareholder Information
Other National Disclosures
Branches and Account Opening Information
Depreciation methods, useful lives and residual values are reassessed at each reporting date and adjusted if appropriate.
(iv) De-recognition
When an item of work in progress is completed and is available for use, the asset is de-classified to the relevant class of the asset under property and equipment. An item of property and equipment is derecognised on disposal or when no future economic benefits are expected from its use or disposal. Any gain or loss arising on de-recognition of the asset (calculated as the difference between the net disposal proceeds and the carrying amount of the asset) is included in the statement of profit or loss in the year the asset is derecognised.
(s) Intangible Assets
(i) Goodwill
Goodwill represents the excess of the cost of the acquisition over the Group’s interest in the net fair value of the identifiable assets, liabilities and contingent liabilities of the acquired subsidiaries at the date of acquisition. When the excess is negative, it is recognised immediately in the statement of profit or loss; Goodwill on acquisition of subsidiaries is included in intangible assets. Subsequent to initial recognition, goodwill is measured at cost less accumulated impairment losses.
Subsequent measurement
Goodwill is allocated to cash-generating units or groups of cash-generating units for the purpose of impairment testing. The allocation is made to those cash-generating units or groups of cash-generating units that are expected to benefit from the business combination in which the goodwill arose identified in accordance with IFRS 8. Goodwill is tested annually as well as whenever a trigger event has been observed for impairment by comparing the present value of the expected future cash flows from a cash generating unit with the carrying value of its net assets, including attributable goodwill and carried at cost less accumulated impairment losses. Impairment losses on goodwill are not reversed. Gains and losses on the disposal of an entity
include the carrying amount of goodwill relating to the entity sold.
(ii) Software
Software acquired by the Group is stated at cost less accumulated amortisation and accumulated impairment losses.
Subsequent expenditure on software assets is capitalised only when it increases the future economic benefits embodied in the specific asset to which it relates. All other expenditure is expensed as incurred.
Amortisation is recognised in the statement of profit or loss on a straight-line basis over the estimated useful life of the software, from the date that it is available for use since this most closely reflects the expected pattern of consumption of the future economic benefits embodied in the asset. The maximum useful life of software is four years.
Amortisation methods, useful lives and residual values are reviewed at each reporting date and adjusted if appropriate.
(t) Impairment of Non-Financial Assets
The Group’s non-financial assets with carrying amounts other than investment property and deferred tax assets are reviewed at each reporting date to determine whether there is any indication of impairment. If any such indication exists then the asset’s recoverable amount is estimated. For goodwill and intangible assets that have indefinite useful lives, the recoverable amount is estimated each year at the same time.
An impairment loss is recognised if the carrying amount of an asset or its cash-generating unit exceeds its recoverable amount. A cash-generating unit is the smallest identifiable asset group that generates cash flows that largely are independent from other assets and groups. Impairment losses are recognised in the statement of profit or loss. Impairment losses recognised in respect of cash-generating units are allocated first to reduce the carrying amount of any goodwill allocated to the units and then to reduce the carrying amount of the other assets in the unit (group of units) on a pro rota basis.
FCMB Group Plc Annual Report and Accounts 2017 81
Introduction Operating Review
Corporate Governance
Financial Statements
Shareholder Information
Other National Disclosures
Branches and Account Opening Information

The recoverable amount of an asset or cash-generating unit is the greater of its value in use and its fair value less costs to sell. In assessing value in use, the estimated future cash flows are discounted to their present value using a pre-tax discount rate that reflects current market assessments of the time value of money and the risks specific to the asset.
An impairment loss in respect of goodwill is not reversed. In respect of other assets, impairment losses recognised in prior periods are assessed at each reporting date for any indications that the loss has decreased or no longer exists. An impairment loss is reversed if there has been a change in the estimates used to determine the recoverable amount. An impairment loss is reversed only to the extent that the asset’s carrying amount does not exceed the carrying amount that would have been determined, net of depreciation or amortisation, if no impairment loss had been recognised.
(u) Deposits, Debt Securities Issued, Onlending Facilities and Borrowings
Deposits, debt securities issued, onlending facilities and borrowings are the Group’s sources of funding. When the Group sells a financial asset and simultaneously enters into a “repo” or “lending” agreement to repurchase the asset (or a similar asset) at a fixed price on a future date, the arrangement is accounted for as borrowing, and the underlying asset continues to be recognised in the Group’s financial statements.
Deposits, debt securities issued, onlending facilities and borrowings are initially measured at fair value plus transaction costs, and subsequently measured at their amortised cost using the effective interest method, except where the Group chooses to carry the liabilities at fair value through profit or loss.
(v) Sale and Repurchase Agreements
Securities sold subject to repurchase agreements (‘repos’) remain on the statement of financial position; the counterparty liability is included in amounts due to other banks, deposits from banks,
other deposits or deposits due to customers, as appropriate. Securities purchased under agreements to resell (reverse repos’) are recorded as money market placements. The difference between sale and repurchase price is treated as interest and accrued over the life of the agreements using the effective interest method.
Securities lent to counterparties are also retained in the financial statements. Securities borrowed are not recognised in the financial statements, unless these are sold to third parties, in which case the purchase and sale are recorded with the gain or loss included in trading income.
(w) Provisions
Provisions for restructuring costs and legal claims are recognised when: the Group has a present legal or constructive obligation as a result of past events; it is more likely than not that an outflow of resources will be required to settle the obligation; and the amount has been reliably estimated. The Group recognises no provisions for future operating losses.
(x) Financial Guarantees and Loan Commitments
Financial guarantees are contracts that require the Group to make specified payments to reimburse the holder for a loss it incurs because a specified debtor failed to make payment when due in accordance with the terms of the debt instrument. Loan commitments are firm commitments to provide credit under pre-specified terms and conditions.
Liabilities arising from financial guarantees or commitments to provide a loan at a below-market interest rate are initially measured at fair value and the initial fair value is amortised over the life of the guarantee or the commitment. The liability is subsequently carried at the higher of this amortised amount and the present value of any expected payment to settle the liability when a payment under the contracts has become probable. Financial guarantees and commitments to provide a loan at a below-market interest rate are included within other liabilities.
Notes to the Consolidated and Separate Financial Statementsfor the year ended 31 December 2017 continued
FCMB Group Plc Annual Report and Accounts 201782
Introduction Operating Review
Corporate Governance
Financial Statements
Shareholder Information
Other National Disclosures
Branches and Account Opening Information

(y) Employee Benefits
(i) Defined contribution plans
A retirement benefit obligation is a defined contribution plan. A defined contribution plan is a post-employment benefits plan under which an entity pays fixed contributions into a separate entity and has no legal or constructive obligation to pay further amounts. In line with the Pension Reform Act 2014, the Group and its employees make a joint contribution, 18% (10% by the company and 8% by the employees) of basic salary, housing and transport allowance to each employee’s retirement savings account maintained with their nominated pension fund administrators. Obligations for contributions to defined contribution plans are recognised as personnel expenses in statement of profit or loss in the period during which related services are rendered. Prepaid contributions are recognised as an asset to the extent that a cash refund or a reduction in the future payments is available.
(ii) Termination benefits
Termination benefits are recognised as an expense when the Group is demonstrably committed, without realistic possibility of withdrawal, to a formal detailed plan to either terminate employment before the normal retirement date, or to provide termination benefits as a result of an offer made to encourage voluntary redundancy. Termination benefits for voluntary redundancy are recognised as an expense if the Group has made an offer of voluntary redundancy, it is probable that the offer will be accepted, and the number of acceptances can be estimated reliably. If benefits are payable more than 12 months after the reporting date, then they are discounted.
(iii) Short-term employee benefits
Short-term employee benefit obligations are measured on an undiscounted basis and are expensed as the related service is provided. A liability is recognised for the amount expected to be paid under short-term cash bonus or profit-sharing plans if the Group has a present legal or
constructive obligation to pay this amount as a result of past service provided by the employee and the obligation can be estimated reliably.
(z) Share Capital and Reserves
(i) Share issue costs
Incremental costs directly attributable to the issue of an equity instrument are deducted from the initial measurement of the equity instrument.
(ii) Dividend on the Company’s ordinary shares
Dividends on ordinary shares are recognised in equity in the period in which they are approved by the Company’s shareholders. Dividends for the year that are declared after the date of the consolidated statement of financial position are dealt with in the subsequent events note. Dividends proposed by the Directors but not yet approved by members are disclosed in the financial statements in accordance with the requirements of the Companies and Allied Matters Act of Nigeria.
Where the Company or other members of the Group purchase the Company’s share, the consideration paid is deducted from total shareholders’ equity as treasury shares until they are cancelled. Where such shares are subsequently sold or reissued, any consideration received is included in shareholders’ equity.
(aa) Earnings Per Share
The Group presents basic earnings per share (EPS) data for its ordinary shares. Basic EPS is calculated by dividing the profit or loss attributable to ordinary shareholders of the Company by the weighted average number of ordinary shares outstanding during the period. Diluted EPS is determined by adjusting the profit or loss attributable to ordinary shareholders and the weighted average number of ordinary shares outstanding for the effects of all dilutive potential ordinary shares, which comprise share options granted to employees.
FCMB Group Plc Annual Report and Accounts 2017 83
Introduction Operating Review
Corporate Governance
Financial Statements
Shareholder Information
Other National Disclosures
Branches and Account Opening Information
(ab) Segment Reporting
Segment results that are reported to the Executive Management Committee (being the chief operating decision maker) include items directly attributable to a segment as well as those that can be allocated on a reasonable basis. Unallocated items comprise mainly corporate assets (primarily the Company’s headquarters), head office expenses, and tax assets and liabilities.
(ac) New Standards, Interpretations and Amendments to Existing Standards That Are Not Yet Effective
A number of new standards, amendments to standards and interpretations are effective for annual periods beginning after 1 January 2018, and have not been applied in preparing these consolidated financial statements. Those that may be relevant to the Group are set out below. The Group does not plan to adopt these standards early.
(i) Adoption of IFRS 9 Financial Instruments
In July 2014, the IASB issued IFRS 9 Financial Instruments (IFRS 9), which addresses impairment, classification, measurement and hedge accounting. IFRS 9 is effective for the Group for the financial year beginning 1 January 2018.
Guidance relating to the adoption of IFRS 9 has been provided by the Central Bank of Nigeria (CBN) in its Guidance Note to Banks and Discount Houses on the Implementation of IFRS 9 Financial Instruments in Nigeria (CBN Guideline). The CBN Guideline was considered in the determination of the allowance for credit losses. Based on 31 December 2017 data and current implementation status, we estimate the adoption of IFRS 9 will lead to an additional impairment approximately range between N11.66 billion and N14.84 billion before tax driven by the impairment requirements of IFRS 9. The above assessment is preliminary because not all transition work has been finalized. The actual impact of adoption of IFRS 9 on 1 January 2018 may change because:
� IFRS 9 will require the Group to revise its accounting processes and internal controls and these changes are not yet complete;
� the new accounting policies, assumptions, judgements and estimation techniques employed are subject to change until the Group finalizes its first financial statements that include the date of initial application
� although parallel runs were carried out in the last quarter of 2017, the new systems and associated controls in place have not been operational for a more extended period;
� the Group is refining and finalizing its models for expected credit loss (ECL) calculations.
IFRS 9 implementation strategy
The Group’s IFRS 9 implementation process is governed by a steering committee whose members include representatives from risk, finance, operations and IT functions. The steering committee meets monthly to challenge key assumptions, approve decisions and monitor the progress of the implementation work across the Group, including evaluation of whether the project has sufficient resources. Also the services of an independent consultant was engaged to help evaluate, assess and monitor the implementation.
The Group has completed the preliminary impact assessment and most of the accounting analysis and has worked on the design and build of models, systems, processes and controls. An application, VBox was deployed managed by Manticore to help in the implementation.
Classification and Measurement of Financial Assets and Liabilities
Debt Instruments
The new standard requires that the Group classify debt instruments based on its business model for managing the assets and the contractual cash flow characteristics of those assets. The Business model refers to how an entity manages its financial assets to generate cash flows. Debt instruments will be measured at fair value through profit and loss unless certain conditions are met that permit measurement at fair value through other comprehensive income (FVOCI) or amortized cost. Debt instruments that have contractual cash flows representing only
Notes to the Consolidated and Separate Financial Statementsfor the year ended 31 December 2017 continued
FCMB Group Plc Annual Report and Accounts 201784
Introduction Operating Review
Corporate Governance
Financial Statements
Shareholder Information
Other National Disclosures
Branches and Account Opening Information
payments of principal and interest will be eligible for classification as FVOCI or amortized cost. Gains and losses recorded in other comprehensive income for debt instruments will be recognized in profit or loss only on disposal.
Equity Instruments
Equity instruments would be measured at fair value through profit or loss unless we irrevocably elect to measure them at fair value through other comprehensive income (FVOCI). Future unrealized gains and losses on fair value through profit or loss equity instruments will be recorded in income.
Based on the Group preliminary high-level assessment of possible changes to the classification and measurement of financial assets held as at 31 December 2017, the Group’s current expectation is that:
� Trading assets are classified as held-for-trading and measured at FVTPL under IAS 39 would in general also be measured at FVTPL under IFRS 9;
� Loans and advances to banks and customers that are classified as loans and receivables and measured at amortized cost under IAS 39 would in general also be measured at amortized cost under IFRS 9;
� Debt securities that are classified as held-to-maturity investment securities and measured at amortized cost under IAS 39 would in general also be measured at amortized cost under IFRS 9;
� Debt securities that are classified as available-for-sale under IAS 39 may, under IFRS 9, be measured at amortized cost, FVOCI or FVTPL, depending on the particular circumstances.
� Quoted equity securities classified as available-for-sale and measured at FVOCI under IAS 39 would generally be measured at FVTPL under IFRS 9.
� Unquoted equity securities at cost under available-for-sale investments under IAS 39 may, under IFRS 9, be measured at amortized cost, FVOCI or FVTPL, depending on the particular circumstances.
Impairment of Financial Assets, Loan Commitments and Financial Guarantee Contracts
IFRS 9 introduces a new expected credit loss (ECL) impairment framework for all financial assets and certain off-balance sheet loan commitments and guarantees. The new ECL framework will result in an allowance for expected credit losses being recorded on financial assets regardless of whether there has been an actual loss event. This differs from the current approach where the allowance recorded on performing loans is designed to capture only losses that have been incurred, whether or not they have been specifically identified.
IFRS 9 replaces the ‘incurred loss’ model in IAS 39 with a forward-looking ‘expected credit loss’ (ECL) model. This will require considerable judgement over how changes in economic factors affect ECLs, which will be determined on a probability-weighted basis.
The new impairment model applies to the following financial instruments that are not measured at fair value through profit or loss:
� financial assets that are debt instruments;
� loans and receivables; and
� loan commitments and financial guarantee contracts issued.
Under IFRS 9, no impairment loss is recognized on equity investments.
Under IFRS 9, the Group will recognize loss allowances at an amount equal to lifetime ECL, except in the following cases, where the amount recognized will be 12-month ECL:
� debt investment securities that are determined to have low credit risk at the reporting date; and
� Other financial instruments (other than lease receivables) on which credit risk has not increased significantly since their initial recognition.
FCMB Group Plc Annual Report and Accounts 2017 85
Introduction Operating Review
Corporate Governance
Financial Statements
Shareholder Information
Other National Disclosures
Branches and Account Opening Information
The assessment of whether credit risk on financial asset has increased significantly will be on critical judgements in implementing the impairment model of IFRS 9. Loss allowance for lease receivables will always be measured at an amount equal to lifetime ECL. 12-months ECL are the portion of ECL that results from default events on a financial instrument that are possible within the 12 months after the reporting date.
Measurement of ECL
ECLs are a possibility-weighted estimate of credit losses and will be measured as follows:
� Financial assets that are not credit-impaired at the reporting date: the present value of all cash shortfalls (i.e. the difference between the cash flows due to the entity in accordance with the contract and the cash flows that the Group expects to receive);
� Financial assets that are credit-impaired at the reporting date: the difference between the gross carrying amount and the present value of estimated future cash flows;
� Undrawn loan commitments: the present value of the difference between the contractual cash flows that are due to the Group if the commitment is drawn down and the cash flows that the Group expects to receive; and
� Financial guarantee contracts: the expected payments to reimburse the holder less any amounts that the Group expects to recover.
IFRS 9 Impairment model uses a three stage approach based on the extent of credit deterioration since origination:
Stage 1 – 2-month ECL applies to all financial assets that have not experienced a significant increase in credit risk (SIR) since origination and are not credit impaired. The ECL will be computed using a 12-month PD that represents the probability of default occurring over the next 12 months. For those assets with a remaining maturity of less than 12 months, a PD is used that corresponds to remaining maturity. This Stage 1 approach is different from the incurred loss approach, which estimates a collective allowance
to recognize losses that have been incurred but not reported on performing loans. We always will see less impairment than before based on the PD curve over 12 months, always starting with 0%.
Stage 2 – When a financial asset experiences a SIR subsequent to origination but is not credit impaired, it is considered to be in Stage 2. This requires the computation of ECL based on lifetime PD that represents the probability of default occurring over the remaining estimated life of the financial asset. Impairments are higher in this stage because of an increase in risk and the impact of a longer time horizon being considered compared to 12 months in Stage 1. We see slight increase in impairment based on the Life Time consideration.
Stage 3 – Financial assets that have an objective evidence of impairment will be included in this stage. Similar to Stage 2, the allowance for credit losses will continue to capture the lifetime expected credit losses. The impairment requirements of IFRS 9 are complex and require management judgments, estimates and assumptions, particularly in the areas of assessing whether the credit risk of an instrument has increased significantly since initial recognition and incorporating forward-looking information into the measurement of ECLs. The calculation is similar to what it was before.
In the result the increase comes from stage 2, but is partially offset by the decrease in stage 1.
Definition of default
Under IFRS 9, the Group will consider a financial asset to be in default when:
� the borrower is unlikely to pay its credit obligations to the Group in full, without recourse by the Group to actions such as realizing collaterals (if any is held); or
� the borrower is more than 90 days past due on any material credit obligation to the Group. Overdrafts are considered past dues once the customer has breached an advised limit or been advised of a limit that is smaller than the current amount outstanding.
Notes to the Consolidated and Separate Financial Statementsfor the year ended 31 December 2017 continued
FCMB Group Plc Annual Report and Accounts 201786
Introduction Operating Review
Corporate Governance
Financial Statements
Shareholder Information
Other National Disclosures
Branches and Account Opening Information
Significant increase in credit risk (SIC)
Under IFRS 9, when determining whether the credit risk (i.e. risk of default) on a financial instrument has increased significantly since initial recognition, the Group will consider reasonable and supportable information that is relevant and available without undue cost or effort, including both quantitative and qualitative information and analysis based on the Group’s historical experience, expert credit assessment and forward-looking information.
The Group will primarily identify whether a significant increase in credit risk has occurred for an exposure by comparing:
� the remaining lifetime probability of default (PD) as at the reporting date; with
� the remaining lifetime PD for this point in time that was estimated on initial recognition of the exposure.
Inputs into measurement of ECL
The key inputs into the measurement of ECL are likely to be the term structures of the following variables:
� probability of default (PD);
� loss given default (LGD);
� exposure at default (EAD).
In general, the Group expects to drive these parameters from internally developed statistical models and other historical data. They will be adjusted to reflect for forward-looking information as described above.
Probability of default (PD) estimates are estimates at a certain date, which the Group expects to calculate based on statistical rating models, and assessed using rating tools tailored to the various categories of counterparties and exposures. These statistical models are expected to be based on internally compiled data comprising both quantitative and qualitative factors. Where it is available, market data may also be used to derive the PD for large corporate counterparties. If a counterparty or exposure migrates between ratings classes, then this will
lead to a change in the estimate of the associated PD. PDs will be estimated considering the contractual maturities of exposures and estimated prepayment rates.
Loss given default (LGD) is the magnitude of the likely loss if there is a default. The Group plans to estimate LGD parameters based on the history of recovery rates of claims against defaulted counterparties. It expects the LGD models to consider the structure, collateral, seniority of claim, counterparty industry and recovery costs of any collateral that is integral to the financial asset. The Group expects to calibrate LGD estimates for different economic scenarios and, for real estate lending, to reflect possible changes in property prices. They will be calculated on a discounted cash flow basis using the effective interest rate as the discounting factor.
Exposure at default (EAD) represents the expected exposure in the event of a default. The Group expects to derive the EAD from the current exposure to the counterparty and potential changes to the current amount allowed under the contract including amortization. The EAD of a financial asset will be the gross carrying amount at default. For lending commitments and financial guarantees, the EAD will consider the amount drawn, as well as potential future amounts that may be drawn or repaid under the contract, which will be estimated based on historical observations and forward-looking forecasts. For some financial assets, the Group expects to determine EAD by modelling the range of possible exposure outcomes at various points in time using scenario and statistical techniques.
As described above, and subject to using a maximum of 12-month PD for financial assets for which credit risk has not significantly increased, the Group will measure ECL considering the risk of default over the maximum contractual period (including any borrower’s extension options) over which it is exposed to credit risk, even if, for risk management purposes, the Group considers a longer period. The maximum contractual period extends to the date at which the Group has the right to require repayments of an advance or terminate a loan commitment or guarantee.
FCMB Group Plc Annual Report and Accounts 2017 87
Introduction Operating Review
Corporate Governance
Financial Statements
Shareholder Information
Other National Disclosures
Branches and Account Opening Information
For retail overdrafts and credit card facilities that include both a loan and an undrawn commitment component, the Group will measure ECL over a period longer than the maximum contractual period if the Group’s contractual ability to demand repayment and cancel the undrawn commitment does not limit the Group’s exposure to credit losses to the contractual notice period. These facilities do not have a fixed term or repayment structure and are managed on a collective basis. The Group can cancel them with immediate effect but this contractual right is not enforced in the normal day-to-day management, but only when the Group becomes aware of an increase in credit risk at the facility level. This longer period will be estimated taking into account the credit risk management actions that the Group expects to take and that serve to mitigate ECL. These include a reduction in limits, cancellation of the facility and/or turning the outstanding balance into a loan with fixed repayment terms.
Forward-looking information (FLI)
The Group will incorporate forward-looking information into both its assessment of whether the credit risk of an instrument has increased significantly since its initial recognition and its measurement of ECL. Based on advice from the Risk Management Committee and consideration of a variety of external actual and forecast information, the Group intends to formulate a ‘base case’ view of the future direction of relevant economic variables as well as a representative range of other possible forecast scenarios. This process would involve developing two or more additional economic scenarios and considering the relative probabilities of each outcome. External information may include economic data and forecasts published by governmental bodies and monetary authorities, supranational organizations and selected private-sector and academic forecasters.
The base case is expected to represent a most-likely outcome and be aligned with information used by the Group for other purposes, such as strategic planning and budgeting. The other scenarios would represent more optimistic and
more pessimistic outcomes. The Group plans also to periodically carry out stress testing of more extreme shocks to calibrate its determination of these other representative scenarios.
The Group is in the process of identifying and documenting key drivers of credit risk and credit losses for each portfolio of financial instruments and, using an analysis of historical data, estimating relationships between macro-economic variables and credit risk and credit losses.
Hedge Accounting
IFRS 9 introduces a new hedge accounting model that expands the scope of hedged items and risks eligible for hedge accounting and aligns hedge accounting more closely with risk management. The new model no longer specifies quantitative measures for effectiveness testing and does not permit hedge de-designation. The Group does not apply hedge accounting and therefore does not expect any changes to the financial statements in respect of the new requirements on hedge accounting.
Disclosures
IFRS 9 will require extensive new disclosures, in particular about credit risk and ECLs.
Transition impact
The Group will record an adjustment to its 1 January 2018 retained earnings to reflect the application of the new requirements at the adoption date and will not restate comparative periods. The Group estimates the IFRS 9 transition amount will result to an additional impairment between N11.66 billion and N14.84 billion and Tier 1 capital ratio between 100 to 120 basis points as at 1 January 2018. The estimated impact relates primarily to the implementation of the ECL requirements. The Group will continue to review, revise, refine and revalidate the impairment models and related process controls.
Impacts on Governance and Controls
The Group has applied its existing governance framework to ensure that appropriate controls and validations are in place over key processes and judgments to determine the ECL. As part of
Notes to the Consolidated and Separate Financial Statementsfor the year ended 31 December 2017 continued
FCMB Group Plc Annual Report and Accounts 201788
Introduction Operating Review
Corporate Governance
Financial Statements
Shareholder Information
Other National Disclosures
Branches and Account Opening Information
the implementation, the Bank is in the process of sanitizing the existing internal controls and implementing new controls where required in areas that are impacted by IFRS 9, including controls over the development and probability weighting of macroeconomic scenarios, credit risk data and systems, and the determination of a significant increase in credit risk.
Impacts on Capital Planning
IFRS 9 will impact the reported capital as a result of the adjustment recorded in shareholders’ equity on adoption of the standard; this impact is not expected to be significant.
(ii) IFRS 15, Revenue from contracts with customers
IFRS 15 establishes a comprehensive framework for determining whether, how much and when revenue is recognized. It replaces existing revenue recognition guidance, including IAS 18 Revenue, IAS 11 Construction Contracts and IFRIC 13 Customer Loyalty Programmes.
The Group has completed an initial review of the potential impact of the adoption of IFRS 15 on its consolidated financial statements. This focused on a review of fee and commission income. The Group earns fee and commission income (other than fees included in the calculation of the effective interest rate) on provision of the following services; retail banking, corporate banking, and financial guarantees issued.
The Group will adopt the standard and its amendments in the financial year beginning on 1 January, 2018 and plans to use the modified retrospective approach. Under this approach, the Group will recognize the cumulative effect of initially applying the standard as an adjustment to the opening balances of retained earnings as of 1 January, 2018, without restating comparative periods. Additional disclosures will be required in order to explain any significant changes between reported results and results had the previous revenue standard been applied.
The standard does not apply to revenue associated with financial instruments, and therefore, will not impact the majority of the
Group’s revenue, including interest income, trading revenue and securities gains which are covered under IFRS 9 Financial Instruments. The implementation of the standard is being led by the Financial control department in coordination with the business segments. The areas of focus for the Group’s assessment of impact are fees and commissions. The Group has been working to identify and review the customer contracts within the scope of the new standard. While the assessment is not complete, the timing of the Group’s revenue recognition of fees and commissions within the scope of this standard is not expected to materially change. The Group is also evaluating the additional disclosures that may be relevant and required.
(iii) IFRS 16, Leases
This standard sets out the principles for the recognition, measurement, presentation and disclosure of leases for both parties to a contract, i.e. the customer (‘lessee’) and the supplier (‘lessor’). IFRS 16 eliminates the classification of leases as required by IAS 17 and introduces a single lease accounting model. Applying that model, a lessee is required to recognise:
� assets and liabilities for leases with a term of more than 12 months, unless the underlying assets is of low value;
� depreciation of lease assets separately from interest on lease liabilities in profit or loss.
For the lessor, IFRS 16 substantially carries forward the lessor accounting requirements in IAS 17. Accordingly, a lessor continues to classify its leases or finance leases, and to account for these two types of leases differently.
IFRS 16 introduces a single, on-balance sheet lease accounting model for lessees. A lessee recognizes a right-of-use (ROU) asset representing its right to use the underlying asset and a lease liability representing its obligation to make lease payments. There are optional exemptions for short-term leases and leases of low-value items. Lessor accounting remains similar to the current standard – i.e. lessors continue to classify leases as finance or operating leases.
FCMB Group Plc Annual Report and Accounts 2017 89
Introduction Operating Review
Corporate Governance
Financial Statements
Shareholder Information
Other National Disclosures
Branches and Account Opening Information

IFRS 16 replaces existing leases guidance, including IAS 17 Lease, IFRIC 4 Determining whether an Arrangement contains a lease, SIC – 15 Operating Leases – incentives and SIC – 27 Evaluating the Substance of Transactions involving the Legal Form of a Lease.
The standard is effective for annual periods beginning on or after 1 January 2019. Early adoption is permitted for entities that apply IFRS 15 at or before the date of initial application of IFRS 16. The Group is currently in the process of assessing the impact that the initial application would have on its business.
Transition
The Group currently plans to apply IFRS 16 initially on 1 January 2019.
As a lessee, the Group can either apply the standard using a:
� Respective approach; or
� modified retrospective approach with optional practical expedients.
The lessee applies the election consistently to all of its leases. The Group has not yet determined which transition approach to approach. As a lessor, the Group is not required to make any adjustments for leases except where it is an intermediate lessor in a sub-lease.
The Group has not yet quantified the impact on its reported assets and liabilities of the adoption of IFRS 16. The quantitative effect will depend on, inter alia, the transition method chosen, the extent to which the Group uses the practical expedients and recognition exemptions, and any additional leases that the Group enters into. The Group expects to disclose its transition approach and quantitative information before adoption.
(iv) IFRIC 22: Foreign currency transactions and advance consideration
The amendments clarifies the transaction date to be used in determining the exchange rate for translation of foreign currency transactions involving an advance payment or receipt.
The amendments clarifies that the transaction date is the date on which the Group initially
recognises the prepayment or deferred income arising from the advance consideration.
For transactions involving multiple payments or receipts, each payment or receipt gives rise to a separate transaction date. The interpretation applies when the Group:
For transactions involving multiple payments or receipts, each payment or receipt gives rise to a separate transaction date. The interpretation applies when the Group:
� pays or receives consideration in a foreign currency; and
� recognises a non-monetary asset or liability – e.g. non-refundable advance consideration – before recognising the related item.
The Group will adopt the amendments for the year ending 31 December 2018.
(v) IFRIC 23: Uncertainty over income tax treatments
These amendments provide clarity on the accounting for income tax treatments that have yet to be accepted by the tax authorities.
The amendments clarifies that the key test for determining the amounts to be recognised in the financial statements is whether it is probable that the tax authority will accept the chosen tax treatment; this could result in an increase in the tax liability or a recognition of an asset depending on the current practice of the Group.
The Group will adopt the amendments for the year ending 31 December 2019.
3 Financial Risk Management
(a) Introduction and Overview
Risk management at FCMB Group Plc is critical to the attainment of the Group’s strategic business objectives. It provides the mechanism to identify and explore growth opportunities and manage inherent risks in operating and business environments, ensure compliance with corporate governance standards and regulatory stipulations. Our risk management practices are integrated, structured, enterprise-wide and continuous across the Group for identifying and deciding on
Notes to the Consolidated and Separate Financial Statementsfor the year ended 31 December 2017 continued
FCMB Group Plc Annual Report and Accounts 201790
Introduction Operating Review
Corporate Governance
Financial Statements
Shareholder Information
Other National Disclosures
Branches and Account Opening Information

appropriate responses to, and reporting on, opportunities and threats that may affect the achievement of the strategic business objectives. Based on its strategic business and operational objectives, the Group is exposed to a wide range of risks such as credit, liquidity, market, operational, strategic, regulatory, reputational and systemic risks. It has put in place a robust risk management framework, policies and processes for the proactive identification, assessment, measurement and management of such risks to ensure that they are managed within the Board approved risk appetite whilst also complying with the regulatory requirements.
The Group has developed and periodically updates its capital management policy and capital plan to ensure that it operates within its risk capacity, while optimising risk and return. The outcome of the business strategy and capital plan are part of the key considerations in the development of risk appetite and they all work together to ensure there is an equilibrium. The framework seeks to strengthen the administration and supervision of the Group’s enterprise risk management and ensure that the Group’s corporate governance principles, risk philosophy and culture, risk appetite and risk management processes are implemented in line with the board’s expectations. It also provides management with clear, comprehensive and unbiased analysis of the adequacy, existence and effectiveness of internal controls and risk processes.
In line with global standard, the Group sets its risk tone from the top, adopting a strategy that ensures individuals who take or manage risk clearly understand it; the Group and its subsidiaries’ risk exposures are within the appetites established by Board of Directors; risk taking decisions are in line with the business strategy and objectives set by the Board of Directors; the expected payoffs compensate for the risks taken; risk taking decisions are explicit and clear and sufficient capital is available to take risks. Personal accountability is reinforced by the Group’s values, with staff expected to act with courageous integrity in conducting their duties even as competence is developed through various training and development programs. Also,
staff are supported through the Group’s whistle blower program, which enables them to raise concerns in a confidential manner. The whistle blower program has been outsourced to ensure independence, confidentiality and protection of the whistle blower.
FCMB risk management philosophy
Overall, the Group’s enterprise risk management (ERM) program is underpinned by a strong risk management philosophy and culture, ensuring that the risk management practices are embedded in strategy development and implementation. The Group’s Risk Management Philosophy is: “To continue to institutionalize comprehensive risk practices that enable our stakeholders build and preserve wealth while integrating our core values and beliefs enterprise wide to give us competitive advantage”.
The following are the guiding principles that FCMB tries to entrench in its risk management process:
a) A common standard of risk management values imbibed and consistently exhibited by everyone in the Group;
b) Consistent drive to balance risk/opportunities and return;
c) Clear and consistent communication on risks;
d) A business strategy that aligns risk and accountability;
e) The Group will always strive to understand every new product, business or any type of transaction with a view to addressing all the risk issues;
f) The Group will avoid products and businesses it does not understand.
FCMB shall seek to fully understand the risks and rewards of transactions and only transactions that meet the Group’s risk appetite and profile shall be undertaken.
The chart below provides a link between the Group’s business units and their principal risk exposures. The risks have been assessed based on the relative amount of capital allocation to the various business lines and their revenue generating ability.
FCMB Group Plc Annual Report and Accounts 2017 91
Introduction Operating Review
Corporate Governance
Financial Statements
Shareholder Information
Other National Disclosures
Branches and Account Opening Information
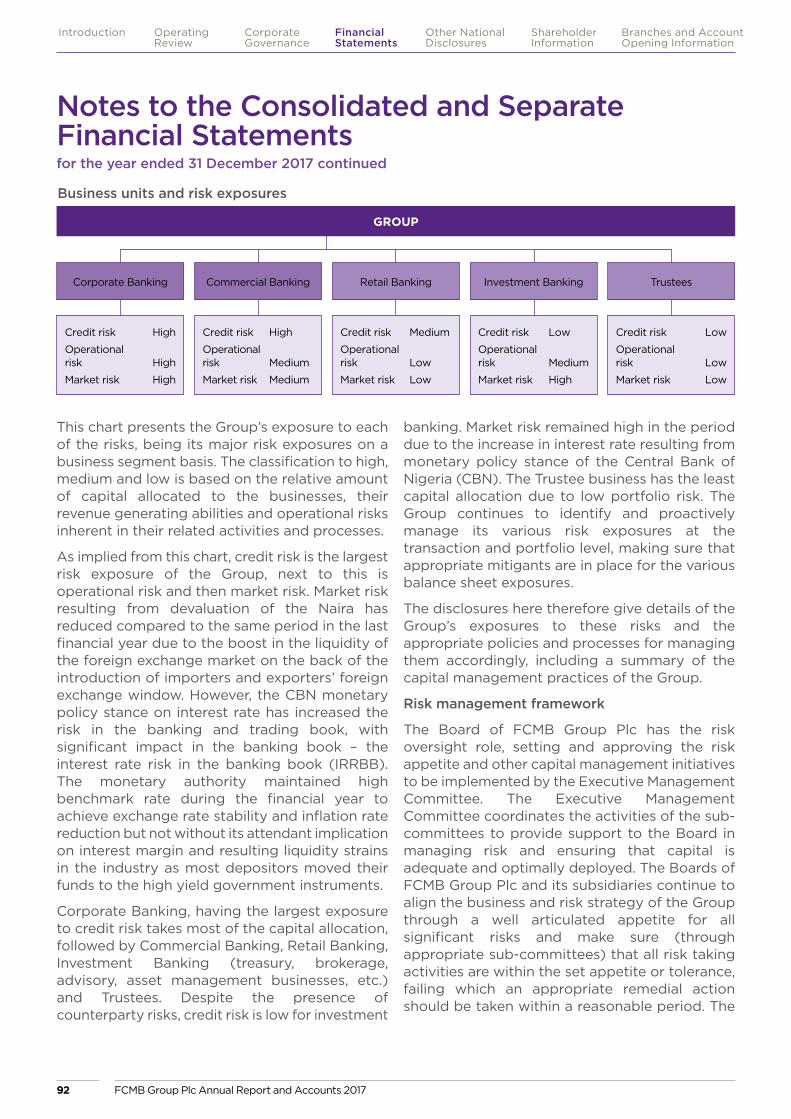
This chart presents the Group’s exposure to each of the risks, being its major risk exposures on a business segment basis. The classification to high, medium and low is based on the relative amount of capital allocated to the businesses, their revenue generating abilities and operational risks inherent in their related activities and processes.
As implied from this chart, credit risk is the largest risk exposure of the Group, next to this is operational risk and then market risk. Market risk resulting from devaluation of the Naira has reduced compared to the same period in the last financial year due to the boost in the liquidity of the foreign exchange market on the back of the introduction of importers and exporters’ foreign exchange window. However, the CBN monetary policy stance on interest rate has increased the risk in the banking and trading book, with significant impact in the banking book – the interest rate risk in the banking book (IRRBB). The monetary authority maintained high benchmark rate during the financial year to achieve exchange rate stability and inflation rate reduction but not without its attendant implication on interest margin and resulting liquidity strains in the industry as most depositors moved their funds to the high yield government instruments.
Corporate Banking, having the largest exposure to credit risk takes most of the capital allocation, followed by Commercial Banking, Retail Banking, Investment Banking (treasury, brokerage, advisory, asset management businesses, etc.) and Trustees. Despite the presence of counterparty risks, credit risk is low for investment
banking. Market risk remained high in the period due to the increase in interest rate resulting from monetary policy stance of the Central Bank of Nigeria (CBN). The Trustee business has the least capital allocation due to low portfolio risk. The Group continues to identify and proactively manage its various risk exposures at the transaction and portfolio level, making sure that appropriate mitigants are in place for the various balance sheet exposures.
The disclosures here therefore give details of the Group’s exposures to these risks and the appropriate policies and processes for managing them accordingly, including a summary of the capital management practices of the Group.
Risk management framework
The Board of FCMB Group Plc has the risk oversight role, setting and approving the risk appetite and other capital management initiatives to be implemented by the Executive Management Committee. The Executive Management Committee coordinates the activities of the sub-committees to provide support to the Board in managing risk and ensuring that capital is adequate and optimally deployed. The Boards of FCMB Group Plc and its subsidiaries continue to align the business and risk strategy of the Group through a well articulated appetite for all significant risks and make sure (through appropriate sub-committees) that all risk taking activities are within the set appetite or tolerance, failing which an appropriate remedial action should be taken within a reasonable period. The
GROUP
Corporate Banking
Credit risk High
Operational risk High
Market risk High
Commercial Banking
Credit risk High
Operational risk Medium
Market risk Medium
Retail Banking
Credit risk Medium
Operational risk Low
Market risk Low
Investment Banking Trustees
Credit risk Low
Operational risk Medium
Market risk High
Credit risk Low
Operational risk Low
Market risk Low
Business units and risk exposures
Notes to the Consolidated and Separate Financial Statementsfor the year ended 31 December 2017 continued
FCMB Group Plc Annual Report and Accounts 201792
Introduction Operating Review
Corporate Governance
Financial Statements
Shareholder Information
Other National Disclosures
Branches and Account Opening Information
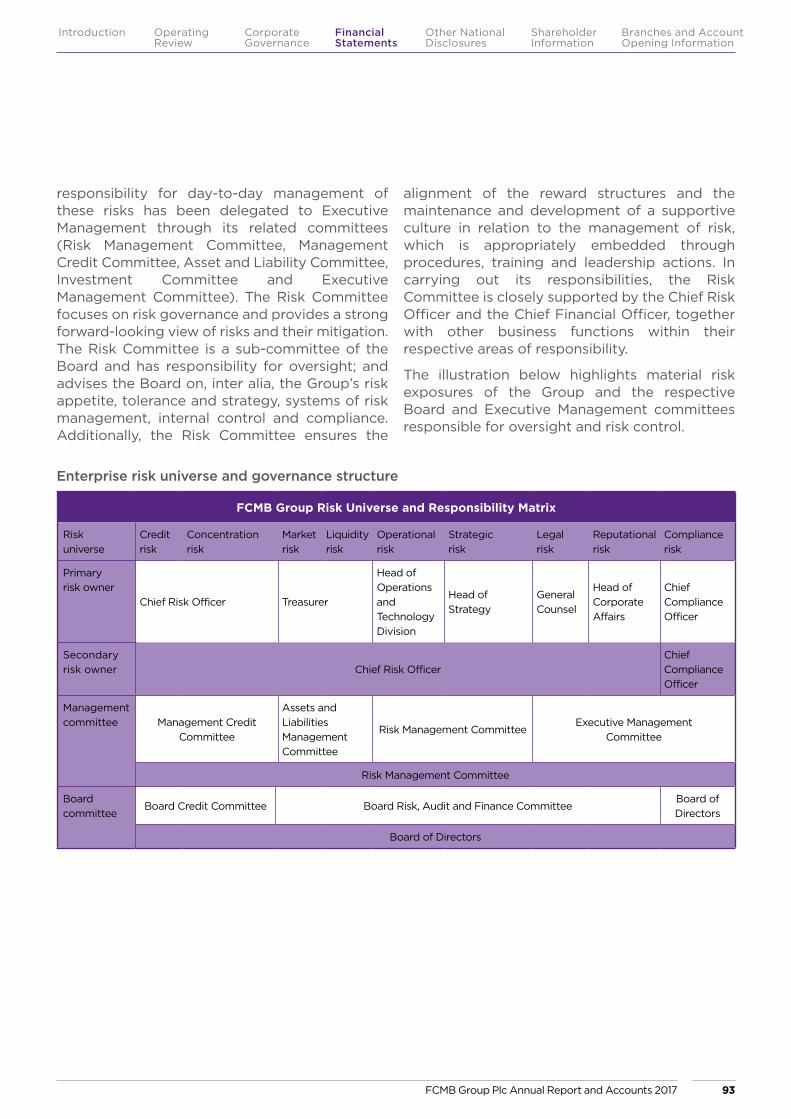
Enterprise risk universe and governance structure
FCMB Group Risk Universe and Responsibility Matrix
Risk universe
Credit risk
Concentration risk
Market risk
Liquidity risk
Operational risk
Strategic risk
Legal risk
Reputational risk
Compliance risk
Primary risk owner
Chief Risk Officer Treasurer
Head of Operations and Technology Division
Head of Strategy
General Counsel
Head of Corporate Affairs
Chief Compliance Officer
Secondary risk owner Chief Risk Officer
Chief Compliance Officer
Management committee Management Credit
Committee
Assets and Liabilities Management Committee
Risk Management CommitteeExecutive Management
Committee
Risk Management Committee
Board committee
Board Credit Committee Board Risk, Audit and Finance CommitteeBoard of Directors
Board of Directors
responsibility for day-to-day management of these risks has been delegated to Executive Management through its related committees (Risk Management Committee, Management Credit Committee, Asset and Liability Committee, Investment Committee and Executive Management Committee). The Risk Committee focuses on risk governance and provides a strong forward-looking view of risks and their mitigation. The Risk Committee is a sub-committee of the Board and has responsibility for oversight; and advises the Board on, inter alia, the Group’s risk appetite, tolerance and strategy, systems of risk management, internal control and compliance. Additionally, the Risk Committee ensures the
alignment of the reward structures and the maintenance and development of a supportive culture in relation to the management of risk, which is appropriately embedded through procedures, training and leadership actions. In carrying out its responsibilities, the Risk Committee is closely supported by the Chief Risk Officer and the Chief Financial Officer, together with other business functions within their respective areas of responsibility.
The illustration below highlights material risk exposures of the Group and the respective Board and Executive Management committees responsible for oversight and risk control.
FCMB Group Plc Annual Report and Accounts 2017 93
Introduction Operating Review
Corporate Governance
Financial Statements
Shareholder Information
Other National Disclosures
Branches and Account Opening Information
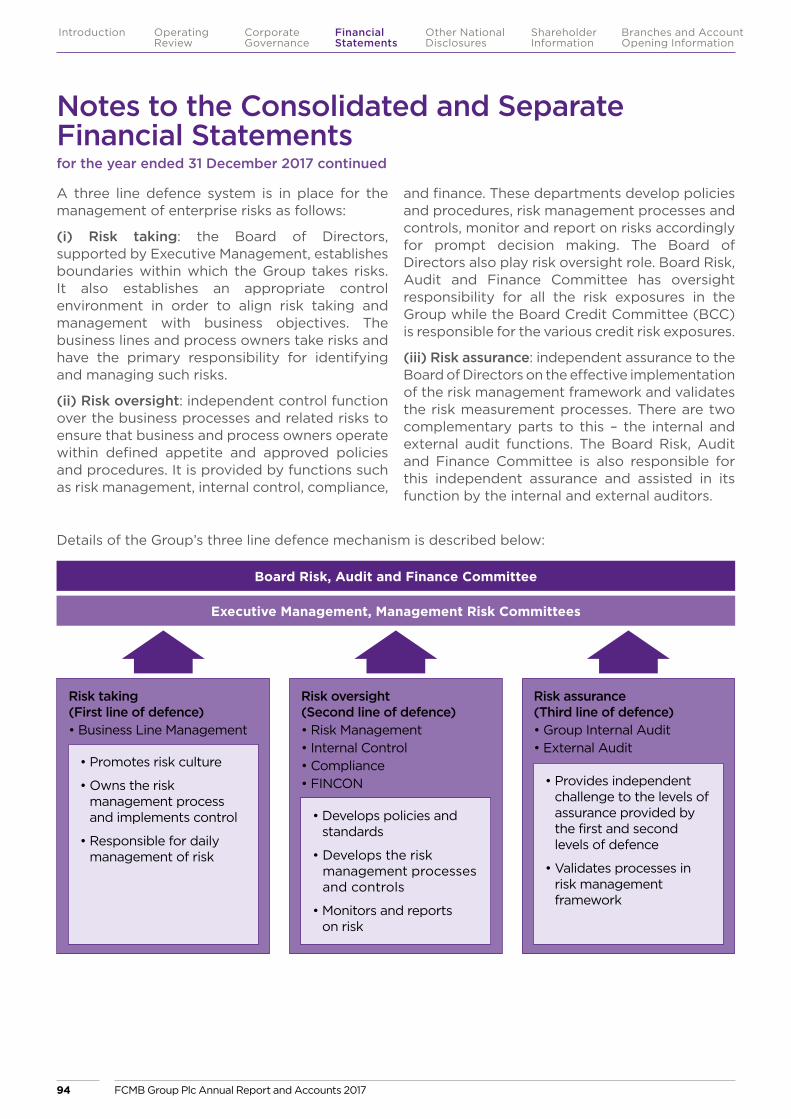
A three line defence system is in place for the management of enterprise risks as follows:
(i) Risk taking: the Board of Directors, supported by Executive Management, establishes boundaries within which the Group takes risks. It also establishes an appropriate control environment in order to align risk taking and management with business objectives. The business lines and process owners take risks and have the primary responsibility for identifying and managing such risks.
(ii) Risk oversight: independent control function over the business processes and related risks to ensure that business and process owners operate within defined appetite and approved policies and procedures. It is provided by functions such as risk management, internal control, compliance,
and finance. These departments develop policies and procedures, risk management processes and controls, monitor and report on risks accordingly for prompt decision making. The Board of Directors also play risk oversight role. Board Risk, Audit and Finance Committee has oversight responsibility for all the risk exposures in the Group while the Board Credit Committee (BCC) is responsible for the various credit risk exposures.
(iii) Risk assurance: independent assurance to the Board of Directors on the effective implementation of the risk management framework and validates the risk measurement processes. There are two complementary parts to this – the internal and external audit functions. The Board Risk, Audit and Finance Committee is also responsible for this independent assurance and assisted in its function by the internal and external auditors.
Details of the Group’s three line defence mechanism is described below:
Board Risk, Audit and Finance Committee
Executive Management, Management Risk Committees
Risk taking (First line of defence)• Business Line Management
Risk oversight (Second line of defence)• Risk Management• Internal Control• Compliance• FINCON
Risk assurance(Third line of defence)• Group Internal Audit• External Audit
• Promotes risk culture
• Owns the risk management process and implements control
• Responsible for daily management of risk
• Develops policies and standards
• Develops the risk management processes and controls
• Monitors and reports on risk
• Provides independent challenge to the levels of assurance provided by the first and second levels of defence
• Validates processes in risk management framework
Notes to the Consolidated and Separate Financial Statementsfor the year ended 31 December 2017 continued
FCMB Group Plc Annual Report and Accounts 201794
Introduction Operating Review
Corporate Governance
Financial Statements
Shareholder Information
Other National Disclosures
Branches and Account Opening Information
First line of defence
(a) Board level
I. The Board of Directors sets the appetite for risk and ensures that senior management and individuals responsible for managing risks possess sound expertise and knowledge to undertake risk management functions within the Group.
II. The Board Risk, Audit and Finance Committee (BRAFC) and, as necessary, the subsidiaries’ risk committees provide direct oversight for enterprise risk management and acts on behalf of the Board on all risk management matters. The BRAFC ensures that all the decisions of the Board on risk management are fully implemented and that risk exposures are in line with agreed risk appetite. The committee also reviews the enterprise risk management framework on a periodic basis to ensure its appropriateness and continued usefulness in line with the size, complexity and exposure of the Group to risks and compliance with regulatory requirements. The BRAFC is also responsible for assessing the adequacy and scope of internal controls, audit of the financial statements and overall compliance. The Committee meets every quarter.
III. The Board Credit Committee’s (BCC) function is more transactional. It approves amendments to the Group’s credit policy, changes in target market or risk acceptance criteria, large exposure requests within pre-defined limits, exceptional approvals where necessary, specific provisions, credit write-offs and remedial/corrective measures. The BCC also reviews the credit portfolio to ensure they are appropriately managed for portfolio risk exposures such as correlation risk, concentration risk, cyclicality of collateral values and any reputational and contagion effects.
(b) Executive management level
I. The Risk Management Committee (RMC) is a management committee, which reports to the Board Risk, Audit and Finance Committee and has direct responsibility for implementing the enterprise risk management framework and related policies approved by the BRAFC. The RMC
meets on a periodic basis (monthly) to review all risk exposures (including Key Risk Indicators, credit portfolio reports, market risk exposures, etc.) and recommends risk mitigating strategies/actions. The RMC is also responsible for portfolio planning, capital management, review and management of external issues and policies affecting the business of the Group and oversight for all enterprise risk management initiatives.
II. The Management Credit Committee (MCC) appraises and approves loans and other credit related transactions as stated in the Group’s credit policy. The committee endorses the credit policy and ensures full compliance with the Board approved credit policy. The MCC reviews and considers credit requests above the delegated approval limits of the approving authorities for approval. The committee also reviews and manages portfolio risk in order for the credit portfolio to remains healthy and in compliance with the Board approved appetite and all regulatory requirements.
III. The Asset and Liability Committee (ALCO) is responsible for managing the composition and pricing of the assets and liabilities, making policy decisions, and providing direction/oversight for market and liquidity risk management practices.
(c) Business unit management level
I. Business Unit Management, as a risk originator, has first line responsibility for and ownership of risks. The Business Units take on risks within set boundaries and manage the risks taken on a day to day basis to protect the Group from the risk of loss.
II. Each Business Unit has a dedicated Operational Risk Committee responsible for reviewing critical/significant risks and recommending appropriate remedial measures. The Committee reviews the outcome of Risk and Control Self-Assessment (RCSA) for their respective business units, major risk exposures as measured by their Key Risk Indicators/Key Control Indicators, agrees action plans and assigns responsibilities for resolving identified issues and exposures.
FCMB Group Plc Annual Report and Accounts 2017 95
Introduction Operating Review
Corporate Governance
Financial Statements
Shareholder Information
Other National Disclosures
Branches and Account Opening Information

Second line of defence
Risk Management is an independent control function with primary responsibility for the following:
� Risk strategy – development of the risk management strategy in alignment with overall growth and business strategy of the Group.
� Risk compliance – ensuring compliance with risk strategy, risk appetite at enterprise and business unit levels.
� Risk advisory – identification, measurement, management and disclosure of all significant risk exposures and providing recommendations/guidance on risk taking and exposures.
� Risk control – proactive management of all risks to minimize losses and capital erosion. The Group could take various control measures to address identified risk exposures such as follows:
(i) Risk avoidance: the Group could make decisions that will attempt to isolate it from further contact with such risks. The decision could affect a new or existing strategy, product or business. Some examples of risk avoidance include opting not to expand its branches, refusing to lend to a customer because of poor understanding of the business or industry and/or closing/relocating a branch because of high incidence of armed robbery or other operational losses. Risk avoidance could be a proactive avoidance (not going into the activity in the first place) or abandonment (dropping the activity after embarking on it).
(ii) Risk acceptance: the Group will acknowledge the risk. However, it will not take any measures to halt the likelihood of such a situation occurring or to minimize the risk associated with it. The Group shall adopt this approach where certain risks remain outstanding after avoidance, transfer or mitigation responses have been taken or where the risks in question are minor or unavoidable and any response is not likely to be cost-effective compared to the possible cost of bearing the risk impact.
(iii) Risk mitigation: the Group will acknowledge the risk and take steps to reduce the risk likelihood and/or impact. Some of the steps that can be taken to mitigate the impact or likelihood of a risk occurring includes:– Formulation of policy or enhancement.– Clarity and strengthening of accountabilities.– Improvement of processes.– Strengthening/implementation of new
controls.– Education and training program. – Expert advice.
The mitigation steps may be Directive, Preventative, Detective or Corrective controls. Detective control entails monitoring of the activities that can lead to the incident in order to detect any early warning signal and respond to it in time.
(iv) Risk transfer: the Group will try to shift the burden from its shoulders to another party. Some common practices involved in risk transfer include insurance contract, performance bonds, guarantees, warrantees and outsourcing. The relevant business unit should however include the new risks arising from these arrangements such as service level performance and contract management, in its risk universe.
(v) Risk sharing: the Group will share the risk with another party in order to reduce any possible loss. Examples include loan syndication, joint-venture arrangement among others.
The Risk Management Division:
The Risk Management Division is a major line of defence in the management of risks in the Group and its subsidiaries. The division assists executive management with the identification, assessment, management, monitoring and reporting of all the risks within the Group. It recommends appropriate risk management polices for the consideration and approval of the Board, through the various executive risk management committees and coordinates the Group’s ERM activities. Key responsibilities of the division include:
Notes to the Consolidated and Separate Financial Statementsfor the year ended 31 December 2017 continued
FCMB Group Plc Annual Report and Accounts 201796
Introduction Operating Review
Corporate Governance
Financial Statements
Shareholder Information
Other National Disclosures
Branches and Account Opening Information
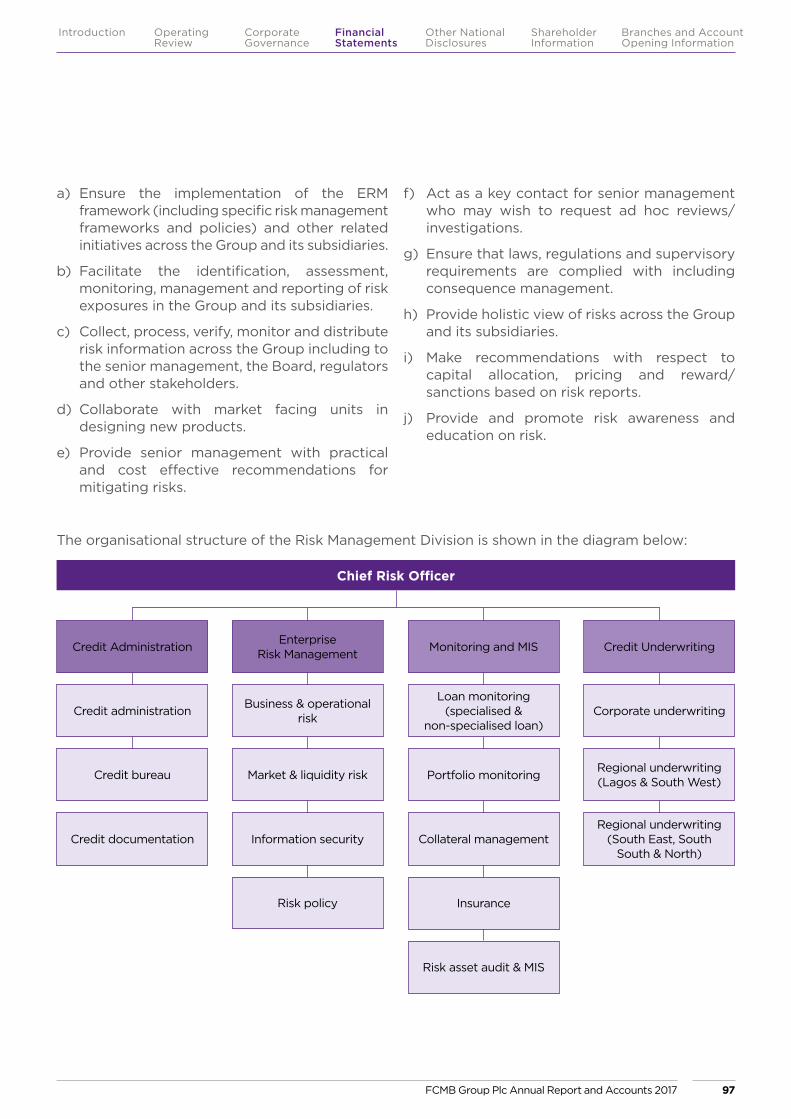
Chief Risk Officer
Credit Administration
Credit administration
Credit bureau
Business & operational risk
Market & liquidity risk
Loan monitoring (specialised &
non-specialised loan)
Collateral management
Portfolio monitoring
Insurance
Risk asset audit & MIS
Enterprise Risk Management Monitoring and MIS
Corporate underwriting
Regional underwriting (Lagos & South West)
Regional underwriting (South East, South
South & North)
Credit Underwriting
Information securityCredit documentation
Risk policy
a) Ensure the implementation of the ERM framework (including specific risk management frameworks and policies) and other related initiatives across the Group and its subsidiaries.
b) Facilitate the identification, assessment, monitoring, management and reporting of risk exposures in the Group and its subsidiaries.
c) Collect, process, verify, monitor and distribute risk information across the Group including to the senior management, the Board, regulators and other stakeholders.
d) Collaborate with market facing units in designing new products.
e) Provide senior management with practical and cost effective recommendations for mitigating risks.
f) Act as a key contact for senior management who may wish to request ad hoc reviews/investigations.
g) Ensure that laws, regulations and supervisory requirements are complied with including consequence management.
h) Provide holistic view of risks across the Group and its subsidiaries.
i) Make recommendations with respect to capital allocation, pricing and reward/sanctions based on risk reports.
j) Provide and promote risk awareness and education on risk.
The organisational structure of the Risk Management Division is shown in the diagram below:
FCMB Group Plc Annual Report and Accounts 2017 97
Introduction Operating Review
Corporate Governance
Financial Statements
Shareholder Information
Other National Disclosures
Branches and Account Opening Information
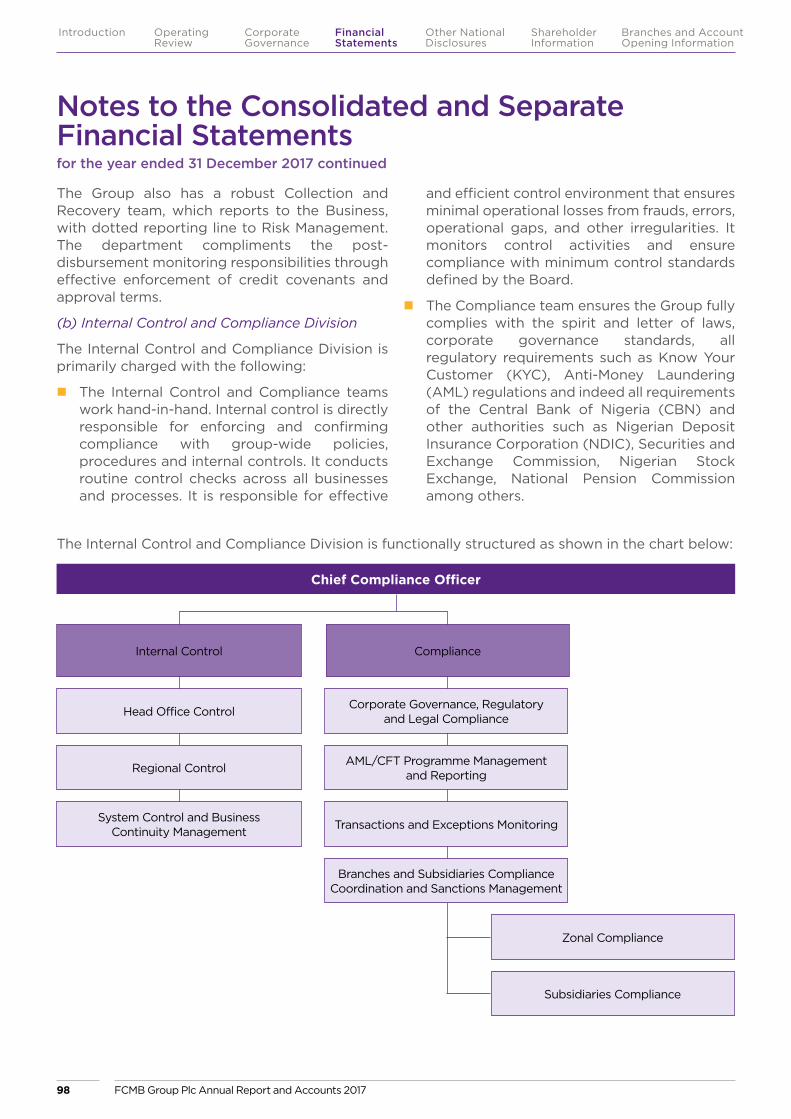
The Group also has a robust Collection and Recovery team, which reports to the Business, with dotted reporting line to Risk Management. The department compliments the post-disbursement monitoring responsibilities through effective enforcement of credit covenants and approval terms.
(b) Internal Control and Compliance Division
The Internal Control and Compliance Division is primarily charged with the following:
� The Internal Control and Compliance teams work hand-in-hand. Internal control is directly responsible for enforcing and confirming compliance with group-wide policies, procedures and internal controls. It conducts routine control checks across all businesses and processes. It is responsible for effective
and efficient control environment that ensures minimal operational losses from frauds, errors, operational gaps, and other irregularities. It monitors control activities and ensure compliance with minimum control standards defined by the Board.
� The Compliance team ensures the Group fully complies with the spirit and letter of laws, corporate governance standards, all regulatory requirements such as Know Your Customer (KYC), Anti-Money Laundering (AML) regulations and indeed all requirements of the Central Bank of Nigeria (CBN) and other authorities such as Nigerian Deposit Insurance Corporation (NDIC), Securities and Exchange Commission, Nigerian Stock Exchange, National Pension Commission among others.
The Internal Control and Compliance Division is functionally structured as shown in the chart below:
Chief Compliance Officer
Internal Control
Head Office Control
Regional Control
System Control and Business Continuity Management
Corporate Governance, Regulatory and Legal Compliance
AML/CFT Programme Management and Reporting
Compliance
Transactions and Exceptions Monitoring
Branches and Subsidiaries Compliance Coordination and Sanctions Management
Zonal Compliance
Subsidiaries Compliance
Notes to the Consolidated and Separate Financial Statementsfor the year ended 31 December 2017 continued
FCMB Group Plc Annual Report and Accounts 201798
Introduction Operating Review
Corporate Governance
Financial Statements
Shareholder Information
Other National Disclosures
Branches and Account Opening Information
(c) Group Finance Division
� Group Finance Division develops the Group’s strategic and capital plan and clearly outlines the actual and projected capital needs, anticipated capital expenditure and desired level of capital.
� It reviews the Group’s capital structure and ensures the desired level of capital adequacy in the Group.
� It drives all activities relating to the Group’s responses to any proposed regulatory change that might affect the Group’s capital and provides all necessary information on portfolio, product and profitability metrics and any analysis to support the material risk assessment process.
Third line of defence
(a) Internal Audit
Group Internal Audit provides independent assessment of the adequacy of, and compliance with, the Group’s established policies and procedures. The function is responsible, amongst others, for monitoring compliance with the enterprise risk management framework and validating the adequacy and efficacy of risk assessment systems (including rating and measurement models).
(b) External Audit
External Auditors apart from establishing whether the financial statements reflect a true and fair position of the organisation, also have an important impact on the quality of internal controls through their audit activities and recommendations for improvement of internal controls. Our external auditors have been helpful in providing guidance on new developments in risk management, corporate governance and financial accounting and controls.
(c) Board
The Board Risk, Audit and Finance Committee (BRAFC) also serves as part of the independent assurance group and assisted in its role by the internal and external auditors.
Risk appetite
Risk appetite is an expression of the level and type of risks that the Group is willing to accept and retain for a given risk-reward ratio in order to achieve its strategic goals. In FCMB, risk appetite is set by the Board of Directors and enforced by Risk Management Division. It is a key component of the risk management framework and central to the annual planning process. This appetite guides all management risks (strategic and reputational risks), risk creation activities (chosen risks such as credit and market risks) and risks inadvertently assumed by the Business groups (consequential risks such as operational risks).
The Group has a well developed risk appetite, prepared to establish a common understanding amongst all employees and other stakeholders regarding the desirable risks underlying execution of its strategy. It represents the combined view of the FCMB leadership and the governance bodies. The risk appetite is not intended to “handcuff” management but a benchmark for discussing the implications of pursuing value creation opportunities as they arise. It therefore defines boundary within which the Group is expected to operate when pursuing its strategy by aligning risk and decision-making. It provides a cornerstone for the Group’s ERM framework, setting a clear strategic direction and tolerances around controls.
FCMB general risk appetite statement
“FCMB as a financial service group is exposed to a variety of risks as it strives to achieve its strategic objectives. These risks will be managed in accordance with the Group’s enterprise risk management (ERM) framework and related policies. The Group’s general risk appetite is a moderate one that allows us to maintain appropriate growth, profitability, earnings stability and capital adequacy while ensuring regulatory compliance, being an employer of choice, and serving the communities in our footprint”.
Apart from the general risk appetite statement, the Group also has specific risk appetite statements defined around its strategic objectives
FCMB Group Plc Annual Report and Accounts 2017 99
Introduction Operating Review
Corporate Governance
Financial Statements
Shareholder Information
Other National Disclosures
Branches and Account Opening Information
with defined metrics to track them. This is to ensure that the specific risk appetite statements are in sync with the business strategy of the Group.
Some of the parameters around which risk appetite and tolerances have been defined in the Group include:
� Bank Credit Rating.
� Capital Adequacy Ratio.
� Deviation from PBT and ROE.
� Non-Performing Loan (NPL).
� Cost of Risk.
� Secured exposure.
� Various credit risk concentration limits.
� Net Interest Margin (NIM).
� Low cost composition.
� Various market risk trading and exposure limits.
� Liquidity risk measurement/exposure limits.
� Operational risk exposure limits for loss events and Key Risk Indicators and Key Control Indicators.
� Interest Rate Risk (IRR) trading limits.
� Various metrics/statements for reputational, regulatory and compliance risks.
Benefit of FCMB risk appetite framework and Statements:
� Sets the foundation for the risk culture of the Group
� Helps to communicate the Board’s vision in practical terms
� Guides all staff in their decision-making on all risk related activities
� Helps to ensure an alignment between the expectations of the Board and the business
� Serves as a benchmark for monitoring and reporting of abnormal events or exposures.
In FCMB Group, all risk appetite metrics are tracked and reported monthly to the Risk Management Committee (RMC), in order to aid the committee’s oversight responsibilities. The Risk Management Division monitors the risk metrics on a more regular basis to make certain that risk exposures are within the approved boundaries. Exposures that are outside of set boundaries are investigated to understand the underlying causes and consider ways to mitigate or avoid them within the shortest possible period.
The Group’s risk appetite is reviewed at least once a year or more frequently as may be required in the event of significant/material changes in the Group’s strategy or in line with regulatory requirements or other external demands.
(b) Credit Risk
Credit risk is the risk that the Group may not be able to recover funds and suffer losses because a customer or counterparty is unable or unwilling to meet contractual obligations to the Group as and when due. It is the most significant risk of the Group.
The Group takes on credit risk through the following principal activities:
� Lending/leasing: the Group grants credit to its customers (loans, advances, temporary overdraft, etc.) or finances a lease or grants an advance or a loan to its employees (staff loan, cash advance, etc.)
� Bank guarantees: the Group issues bonds and guarantees (contingent exposure)
� Trading (fixed income, foreign currency trading, etc.) activities: The Group engages in trading activities where the exchange of monetary value and transfer of ownership of purchased assets is not simultaneous. There is counterparty risk, which creates a bilateral risk of loss.
The Group uses its internal ratings system to assess the risk of default (probability that a customer will become 90 days past due on an obligation) and the risk of loss in the event of
Notes to the Consolidated and Separate Financial Statementsfor the year ended 31 December 2017 continued
FCMB Group Plc Annual Report and Accounts 2017100
Introduction Operating Review
Corporate Governance
Financial Statements
Shareholder Information
Other National Disclosures
Branches and Account Opening Information
default (the estimated size of loss the Group will incur in the event of a default). The Group’s credit risk rating systems and processes differentiate exposures in order to highlight those with greater risk factors and higher potential severity of loss. This provides predictive capability for assessing borrower’s likelihood of default and the acceptable risk mitigants required to cushion residual credit risks for each transaction.
Our ratings framework measures the following key components:
� Financial factors: sales terms/conditions, strength of operations, liquidity and capital in addition to debt service capacity
� Industry: structure, performance, economic sensitivity and outlook
� Management: quality (ownership experience, skills and turnover) and company standing (reputation, ownership and credit history)
� Security/collateral arrangements: seniority of debt, ability to cancel debt at the point of default and loss given default (LGD) computation for each security/collateral type supporting the exposure.
The above components help the group to establish the following:
� Obligor risk rating (ORR), mapped to an estimated probability of default (PD). The PD validation is done internally to ensure the rating continues to be predictive of default and differentiates borrowers based on their ability to service their obligations. This will be further reinforced with a rating validation/back testing.
� Facility risk rating (FRR) for each transaction is mapped to Basel II loss given defaults (LGDs) grades
� Both the ORR and FRR produce the Expected Loss % (EL) which is the product of the PD and LGD, i.e. EL =f(PD, LDG). The EL represents the risk premium which is useful for transaction pricing under the risk-based pricing.
The use of internal ratings system is strategic for the Group. The internal ratings system will ultimately be used for capital computation under the Internal Ratings Based Approach - Foundation IRB and Advanced IRB and the allocation of capital/computation of economic profit across business lines based on Basel II principles.
Management of credit risk
The Group manages its credit risk through an appropriate assessment, management and reporting process, underpinned by sound credit risk systems, policies and well qualified personnel. A combination of risk management tools and policies are adopted to stimulate the creation of quality risk assets. It is managed centrally by various departments within the Risk Management Division, which have responsibilities for policy setting and review, credit underwriting, approval, credit administration, monitoring and portfolio management.
The credit risk management function of the Group, which rides on a sound credit culture is achieved through a combination of the following:
� Appropriate credit policies: the Group develops appropriate risk management policies in conjunction with the business units and other stakeholders, covering all the key areas of credit origination, management, collection, portfolio management, etc. whilst also ensuring compliance with all regulatory requirements. The credit policies reinforce all the Group’s lending and credit management decisions. The credit risk policies are reviewed periodically to ensure that they continue to be relevant and robust enough to address existing and emerging credit risk exposures.
� Lending driven by internal rating system: the Group’s lending and policy enforcement is driven by an internal rating system, with scorecards built for different classes of customers such as corporate, commercial, small and medium enterprises (SME), public sector, retail, etc. The rating of obligors and transactions has been useful in the
FCMB Group Plc Annual Report and Accounts 2017 101
Introduction Operating Review
Corporate Governance
Financial Statements
Shareholder Information
Other National Disclosures
Branches and Account Opening Information
quantification of credit risk and underwriting decision including serving as a guide for pricing, portfolio management and computation of required capital to support the different business lines.
� Establishment of credit approval limits and authorities: there are various approval limits for different kinds of credit exposures and approval authorities including risk committees such as the Management Credit Committee (MCC) and the Board Credit Committee (BCC). These limits are also guided by statutory impositions such as the single obligor limit and other concentrations’ limits set by the Central Bank of Nigeria (CBN).The Group’s single obligor limit is benchmarked to the regulatory cap of 20% of shareholder’s funds unimpaired by loses. The sector limits are set based on the perceived riskiness of each sector but the Government exposures are capped at the regulatory limit of 10% of the total loans.
In response to observed market realities and in order to enhance corporate governance, improve credit culture, tighten risk acceptance criteria (RAC) and strengthen credit approval and management process, the Group revised its credit policy. The revised credit policy, with the RAC, which reflects the Group’s risk appetite will aid underwriting decisions, improve turnaround time and quality of the credit portfolio.
In order to further strengthen its credit process, the Group has differentiated the approval route for its corporate and commercial credits from retail credits. Credit approval for each area is supervised by well experienced personnel referred to as Senior Credit Underwriters who also function as Senior Credit Officers and are members of the Management Credit Committee.
� Loan monitoring and reviews: the various loans are monitored both at transaction and portfolio levels to ensure a balanced and healthy portfolio in line with the portfolio development and balancing strategy of the Group.
� Collateral review, monitoring and management: the Legal department reviews the collateral proposed by customers as part of the credit approval process to determine acceptability of the collateral. Beyond the initial assessment at the point of credit origination however, the Group also has a good collateral management review process in place in order to reduce the risk of loss in the event of default. Our collateral management policy is linked to the internal ratings framework and has helped to reduce the estimated expected loss and capital charge on transactions. Collateral management in the Group includes periodic evaluation of coverage for each facility type, mark-to-market for stocks and commodities, revaluation benchmark for properties and acceptable standards for eligibility on all forms of collateral.
The principal collateral types eligible as security and used primarily to mitigate transaction risk include the following: cash and marketable securities; legal mortgage; all assets debenture; account receivables of highly rated obligors. Other admissible collateral (accepted for comfort only but not eligible as credit risk mitigants) include domiciliation agreements, trust receipts and negative pledges.
Another mitigant used to reduce the risk of credit exposures is master netting agreements with obligors that have investments in liability products so that in the event of default, exposures to the obligor will be settled on a net basis. These agreements are executed by the representatives of the obligor and are generally enforceable with no further recourse to the obligor or a third party.
Generally, all the contingent liabilities are also supported by tangible collaterals or a charge over the underlying goods depending on the assessment of the performance risks.
� Limit concentrations for various exposures: the Group complies with the concentration policy of the CBN as specified in the prudential guidelines and is even more prudent, having
Notes to the Consolidated and Separate Financial Statementsfor the year ended 31 December 2017 continued
FCMB Group Plc Annual Report and Accounts 2017102
Introduction Operating Review
Corporate Governance
Financial Statements
Shareholder Information
Other National Disclosures
Branches and Account Opening Information

internal limits that are more stringent in some cases than specified by the apex regulatory authority. The limit concentration policy of the Group covers all forms of exposures such as customers, large exposures, counterparties, collateral, geography, sector, products, rating band and facility type among others.
In recent time, resulting from the devaluation of the domestic currency (Naira), some of the concentration limits have been threatened. This is due to notional growth in the areas affected by foreign currency revaluation such as foreign exposures in certain sectors and to some obligors. The Group however continues to monitor, track and manage areas that are vulnerable to this risk.
� Reporting: an important part of the Group’s risk management framework is reporting to ensure that all vital information are brought to the attention of stakeholders, appropriate decisions are taken to further improve the risk culture and ultimately ensure all identified issues are brought within the Board approved risk appetite. This internal reporting has imposed discipline within the Group, thereby improving its risk management culture.
Monitoring and reporting looks at specific transactions that are challenged or vulnerable as well the entire portfolio.
In line with the Group’s three line defence mechanism, each of the business units has primary responsibility for managing the credit relationships with customers, hence, responsible for the quality and performance of their credit portfolio. Risk Management Division however continues to provide oversight for the entire credit portfolio and all credit relationships whilst ensuring that the businesses operate within the approved framework and policies. The division is assisted in this role by Internal Control, which does a regular post disbursement check to ensure that credits booked comply with the approved policies and that they continue to operate within approved conditions and guidelines. The internal audit function provides independent assurance for the entire credit process of the Group.
FCMB Group Plc Annual Report and Accounts 2017 103
Introduction Operating Review
Corporate Governance
Financial Statements
Shareholder Information
Other National Disclosures
Branches and Account Opening Information
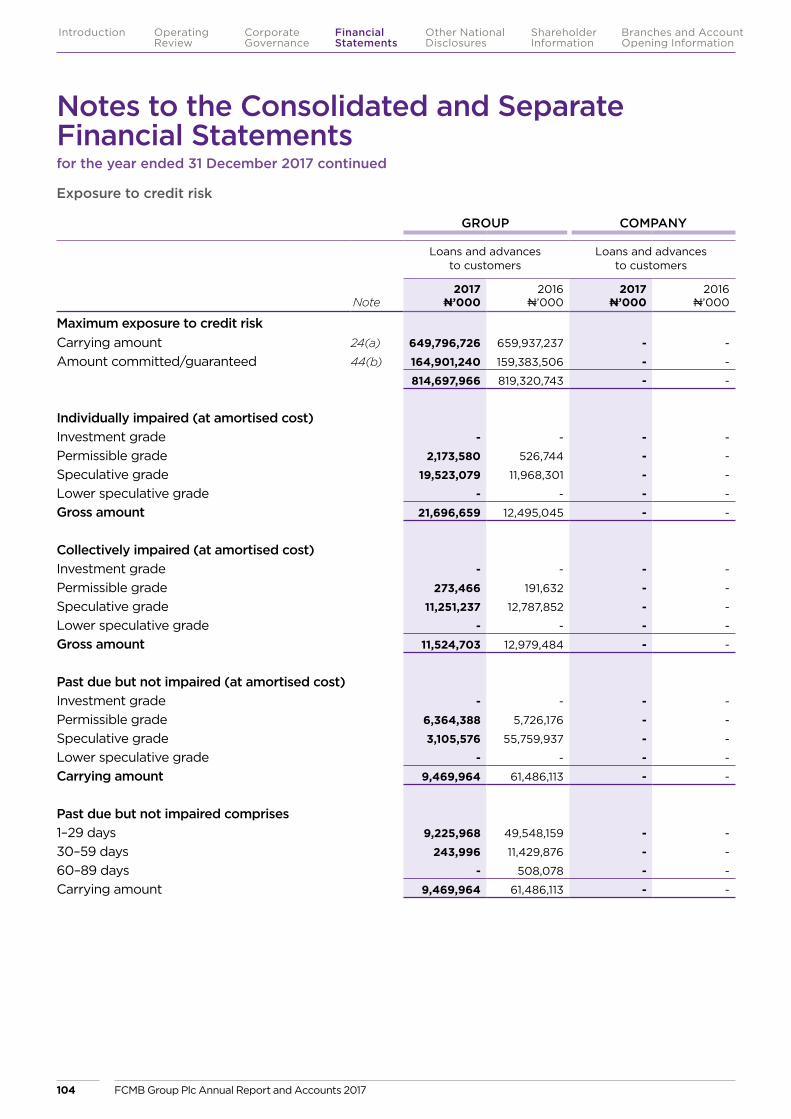
GROUP COMPANY
Loans and advances to customers
Loans and advances to customers
Note 2017
N’000 2016
N’000 2017
N’000 2016
N’000
Maximum exposure to credit riskCarrying amount 24(a) 649,796,726 659,937,237 - -
Amount committed/guaranteed 44(b) 164,901,240 159,383,506 - -
814,697,966 819,320,743 - -
Individually impaired (at amortised cost)Investment grade - - - -
Permissible grade 2,173,580 526,744 - -
Speculative grade 19,523,079 11,968,301 - -
Lower speculative grade - - - -
Gross amount 21,696,659 12,495,045 - -
Collectively impaired (at amortised cost)Investment grade - - - -
Permissible grade 273,466 191,632 - -
Speculative grade 11,251,237 12,787,852 - -
Lower speculative grade - - - -
Gross amount 11,524,703 12,979,484 - -
Past due but not impaired (at amortised cost)Investment grade - - - -
Permissible grade 6,364,388 5,726,176 - -
Speculative grade 3,105,576 55,759,937 - -
Lower speculative grade - - - -
Carrying amount 9,469,964 61,486,113 - -
Past due but not impaired comprises1–29 days 9,225,968 49,548,159 - -
30–59 days 243,996 11,429,876 - -
60–89 days - 508,078 - -
Carrying amount 9,469,964 61,486,113 - -
Exposure to credit risk
Notes to the Consolidated and Separate Financial Statementsfor the year ended 31 December 2017 continued
FCMB Group Plc Annual Report and Accounts 2017104
Introduction Operating Review
Corporate Governance
Financial Statements
Shareholder Information
Other National Disclosures
Branches and Account Opening Information

GROUP COMPANY
Loans and advances to customers
Loans and advances to customers
Note 2017
N’000 2016
N’000 2017
N’000 2016
N’000
Neither past due nor impaired (at amortised cost)Investment grade 23,978,804 35,643,254 - -
Permissible grade 106,644,588 96,190,033 - -
Speculative grade 501,787,107 461,689,132 - -
Lower speculative grade - - - -
Gross amount 632,410,499 593,522,419 - -
Total gross amount (at amortised cost) 675,101,825 680,483,061 - -
Impairment allowance:Specific 24(c)(i) (15,303,954) (6,524,600) - -
Collective 24(c)(ii) (10,001,146) (14,021,224) - -
Carrying amount 649,796,725 659,937,237 - -
GROUP COMPANY
Loans and advances to customers
Loans and advances to customers
Note 2017
N’000 2016
N’000 2017
N’000 2016
N’000
Financial guarantees 164,901,240 159,383,506 - -
164,901,240 159,383,506 - -
Credit risk exposure relating to off-balance sheet
In addition to the above, the banking subsidiary had entered into lending commitments and financial guarantee contracts of N164.90 billion (31 December 2016: N159.38 billion) with counterparties as set below:
FCMB Group Plc Annual Report and Accounts 2017 105
Introduction Operating Review
Corporate Governance
Financial Statements
Shareholder Information
Other National Disclosures
Branches and Account Opening Information
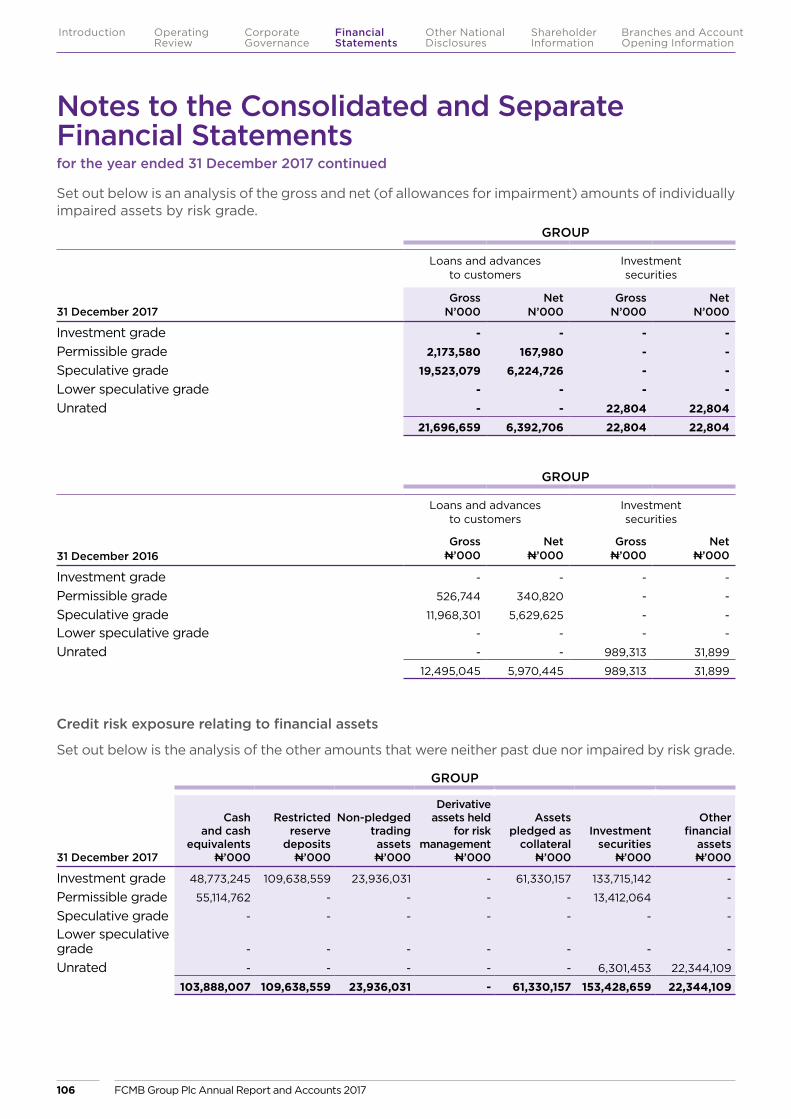
Set out below is an analysis of the gross and net (of allowances for impairment) amounts of individually impaired assets by risk grade.
GROUP
Loans and advances to customers
Investment securities
31 December 2017 Gross N’000
Net N’000
Gross N’000
Net N’000
Investment grade - - - -
Permissible grade 2,173,580 167,980 - -
Speculative grade 19,523,079 6,224,726 - -
Lower speculative grade - - - -
Unrated - - 22,804 22,804
21,696,659 6,392,706 22,804 22,804
GROUP
31 December 2017
Cash and cash
equivalentsN’000
Restricted reserve
depositsN’000
Non-pledged trading assetsN’000
Derivative assets held
for risk management
N’000
Assets pledged as
collateralN’000
Investment securities
N’000
Other financial
assetsN’000
Investment grade 48,773,245 109,638,559 23,936,031 - 61,330,157 133,715,142 -
Permissible grade 55,114,762 - - - - 13,412,064 -
Speculative grade - - - - - - -
Lower speculative grade - - - - - - -
Unrated - - - - - 6,301,453 22,344,109
103,888,007 109,638,559 23,936,031 - 61,330,157 153,428,659 22,344,109
GROUP
Loans and advances to customers
Investment securities
31 December 2016 Gross N’000
Net N’000
Gross N’000
Net N’000
Investment grade - - - -
Permissible grade 526,744 340,820 - -
Speculative grade 11,968,301 5,629,625 - -
Lower speculative grade - - - -
Unrated - - 989,313 31,899
12,495,045 5,970,445 989,313 31,899
Credit risk exposure relating to financial assets
Set out below is the analysis of the other amounts that were neither past due nor impaired by risk grade.
Notes to the Consolidated and Separate Financial Statementsfor the year ended 31 December 2017 continued
FCMB Group Plc Annual Report and Accounts 2017106
Introduction Operating Review
Corporate Governance
Financial Statements
Shareholder Information
Other National Disclosures
Branches and Account Opening Information

COMPANY
31 December 2017
Cash and cash
equivalentsN’000
Restricted reserve
depositsN’000
Non-pledged trading assetsN’000
Derivative assets held
for risk management
N’000
Assets pledged as
collateralN’000
Investment securities
N’000
Other financial
assetsN’000
Permissible grade 146,366 - - - - 2,647,592 -
Unrated - - - - - 2,461,548 744,575
146,366 - - - - 5,109,140 744,575 COMPANY
GROUP
31 December 2016
Cash and cash
equivalentsN’000
Restricted reserve
depositsN’000
Non-pledged trading assetsN’000
Derivative assets held
for risk management
N’000
Assets pledged as
collateralN’000
Investment securities
N’000
Other financial
assetsN’000
Investment grade 40,424,497 139,460,914 9,154,198 - 59,107,132 98,615,005 -
Permissible grade 67,680,135 - - - - 23,508,935 -
Speculative grade - - - 1,018,912 - - -
Lower speculative grade - - - - - - -
Unrated - - - - - 6,317,736 11,470,338
108,104,632 139,460,914 9,154,198 1,018,912 59,107,132 128,441,676 11,470,338
COMPANY
31 December 2016
Cash and cash
equivalentsN’000
Restricted reserve
depositsN’000
Non-pledged trading assetsN’000
Derivative assets held
for risk management
N’000
Assets pledged as
collateralN’000
Investment securities
N’000
Other financial
assetsN’000
Investment grade 5,615,574 - - - - - -
Permissible grade 202,180 - - - - 2,701,510 -
Unrated - - - - - 2,142,690 2,080,271
5,817,754 - - - - 4,844,200 2,080,271
FCMB Group Plc Annual Report and Accounts 2017 107
Introduction Operating Review
Corporate Governance
Financial Statements
Shareholder Information
Other National Disclosures
Branches and Account Opening Information

Past due but not impaired loans
Past due but not impaired loans are those for which contractual interest or principal payments are past due but the Group believes that specific impairment is not appropriate on the basis of the level of security/collateral available and/or the stage of collection of amounts owed to the Group.
Loans with renegotiated terms and the forbearance policy
The Group may renegotiate loans when there is a material change in the customer’s financial position, operating dynamics, industry and environment or anything that gives reasonable doubt that the debt may not be repaid or serviced as and when due. This is usually done through concessions with agreed new terms and conditions that are more favourable to the borrower in order to increase the chance of collection/recovery and thereby reduce the risk of default. Renegotiation of terms may take the forms such as extension of tenor, reduction of pricing, introduction of moratorium or restructuring of facility from one form to the other (e.g. overdraft to term loan) or other forms of amendments to the terms and conditions earlier contracted with the customer. The objective of renegotiation is to ensure recovery of the outstanding obligations and the request could be at the instance of the customer or the Group.
Write-off Policy
The Group has a write-off policy approved by the Board of Directors, which also meets the requirements as specified in the prudential guidelines of the Central Bank of Nigeria for deposit money banks.
In line with the Group’s approved write-off policy, the Management Credit Committee (MCC) may authorise a write-off of outstanding balances on a loan account where it is apparent that the exposure may not be recovered from any of the available repayment sources. However, the Group must have fully provided for the facility and such
credits must also receive the approval of the Board of Directors. The approval process for write-off is as follows:
� The Loan Recovery Unit originates the write-off requests;
� Credit Risk Management obtains the approval of the Management Credit Committee (MCC) and the Board Credit Committee (BCC) for the request;
� All write-offs must be ratified by the full Board;
� Credit Risk Management sends notification of the balances approved for write-off to the Central Bank of Nigeria (CBN).
The write-off must also satisfy the following requirements of Central Bank of Nigeria (CBN):
� The facility must have been in the Group’s book for at least one year after the full provision;
� There should be evidence of Board approval;
� If the facility is insider or related party credit, the approval of CBN is required;
� The fully provisioned facility is appropriately disclosed in the audited financial statement of the Group.
A gross loan amount of N20.65 billion, which were impaired were written off during year ended 31 December 2017 (31 December 2016: N30.69 billion).
Collateral held and other credit enhancements and their financial effects
The Group also has a good collateral management policy in place to reduce the risk of loss in the event of default. Our collateral management policy is linked to the internal ratings framework and has helped to reduce the estimated expected loss and capital charge on transactions.
The Group holds collateral and other types of credit enhancements against its credit exposures. The table below gives the principal collateral types eligible as security and used primarily to mitigate transaction risk.
Notes to the Consolidated and Separate Financial Statementsfor the year ended 31 December 2017 continued
FCMB Group Plc Annual Report and Accounts 2017108
Introduction Operating Review
Corporate Governance
Financial Statements
Shareholder Information
Other National Disclosures
Branches and Account Opening Information
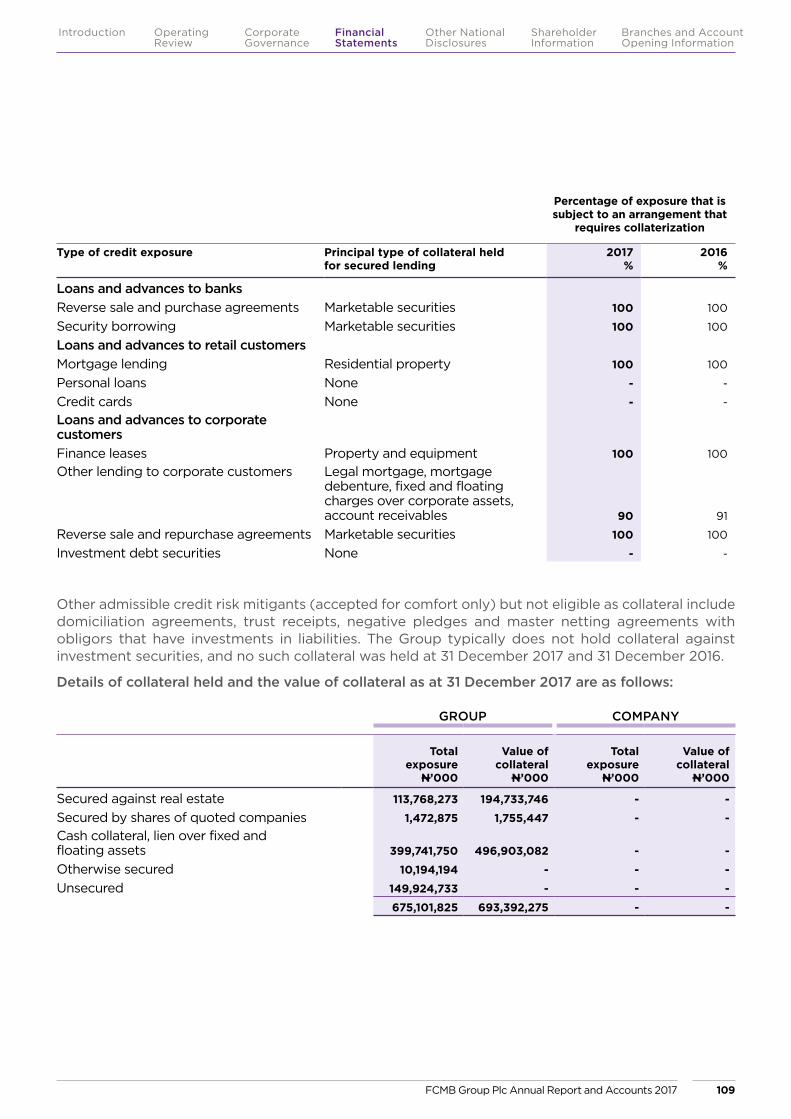
Percentage of exposure that is subject to an arrangement that
requires collaterization
Type of credit exposure Principal type of collateral held for secured lending
2017 %
2016 %
Loans and advances to banksReverse sale and purchase agreements Marketable securities 100 100
Security borrowing Marketable securities 100 100
Loans and advances to retail customersMortgage lending Residential property 100 100
Personal loans None - -
Credit cards None - -
Loans and advances to corporate customersFinance leases Property and equipment 100 100
Other lending to corporate customers Legal mortgage, mortgage debenture, fixed and floating charges over corporate assets, account receivables 90 91
Reverse sale and repurchase agreements Marketable securities 100 100
Investment debt securities None - -
Other admissible credit risk mitigants (accepted for comfort only) but not eligible as collateral include domiciliation agreements, trust receipts, negative pledges and master netting agreements with obligors that have investments in liabilities. The Group typically does not hold collateral against investment securities, and no such collateral was held at 31 December 2017 and 31 December 2016.
Details of collateral held and the value of collateral as at 31 December 2017 are as follows:
GROUP COMPANY
Total exposure
N’000
Value of collateral
N’000
Total exposure
N’000
Value of collateral
N’000
Secured against real estate 113,768,273 194,733,746 - -
Secured by shares of quoted companies 1,472,875 1,755,447 - - Cash collateral, lien over fixed and floating assets 399,741,750 496,903,082 - -
Otherwise secured 10,194,194 - - -
Unsecured 149,924,733 - - -
675,101,825 693,392,275 - -
FCMB Group Plc Annual Report and Accounts 2017 109
Introduction Operating Review
Corporate Governance
Financial Statements
Shareholder Information
Other National Disclosures
Branches and Account Opening Information

Details of collateral held and their carrying amounts as at 31 December 2016 are as follows:
GROUP COMPANY
Total exposure
N’000
Value of collateral
N’000
Total exposure
N’000
Value of collateral
N’000
Secured against real estate 80,635,724 113,079,296 - -
Secured by shares of quoted companies 1,702,798 3,746,191 - -
Cash Collateral, lien over fixed and floating assets 380,513,407 481,236,434 - -
Otherwise secured 64,026,625 - - -
Unsecured 153,604,507 - - -
680,483,061 598,061,921 - -
Loans and advances to corporate customers
The Group’s loans and advances to corporate obligors are subject to rigorous credit appraisals commencing with rating of obligor via our Moody’s Risk Analysis Methodology to determine the credit worthiness of the customer or its probability of default known as the obligor risk rating (ORR) – the Probability of Default (PD) of a customer is a measure of the obligor risk rating.
Collateral in the form of first charge over real estate (legal mortgage or mortgage debenture) or floating and fixed charges over corporate assets is usually taken to provide additional comfort to the Group. The measure of the collateral pledged by the customer is given by the Facility Risk Rating (FRR) mapped to the Basel II defined Loss Given Default (LGD) estimates. The FRR or LGD therefore assesses the transaction of the customer – risk of loss on the transaction in the event of default.
All non-retail and retail-SME exposures are assigned a risk grade by independent Credit Analysts within the Risk Management Division based on inputs/discussions with relationship management teams and verifiable facts. While the obligor risk rating model differentiates borrower risk (i.e. risk of default), the facility risk rating model differentiates transaction risk (i.e. risk of loss in the event of default), taking the
structure of the facility (availability of credit risk mitigants) into consideration.
The Group’s credit analysts are fully guided by the internal ratings framework, lending policies and exhibit a high level of professionalism and judgment in their recommendations to the approving authorities. Model overrides if any, require the exceptional approval of the Chief Risk Officer and in certain cases, may be escalated to the Board Credit Committee.
The Group’s facility risk rating model (for non-retail and retail SME) also reflects the expected loss (EL) on each transaction, which fully incorporates both borrower strength (PD) and loss severity (LGD) considerations. The EL generated is used as a guide to price for transactions, being the risk premium and forms the basis of the treatment provision for the purpose of capital computation and allocation to the business groups.
The Group also holds collateral in the form of cash and marketable securities in respect of sale and repurchase transactions and securities borrowing. Receivables relating to reverse sale and repurchase agreements and securities borrowing transactions are usually collaterized on a gross exposure basis. The Group undertakes master netting agreements with all counterparties and margining agreements with some counterparties.
Notes to the Consolidated and Separate Financial Statementsfor the year ended 31 December 2017 continued
FCMB Group Plc Annual Report and Accounts 2017110
Introduction Operating Review
Corporate Governance
Financial Statements
Shareholder Information
Other National Disclosures
Branches and Account Opening Information
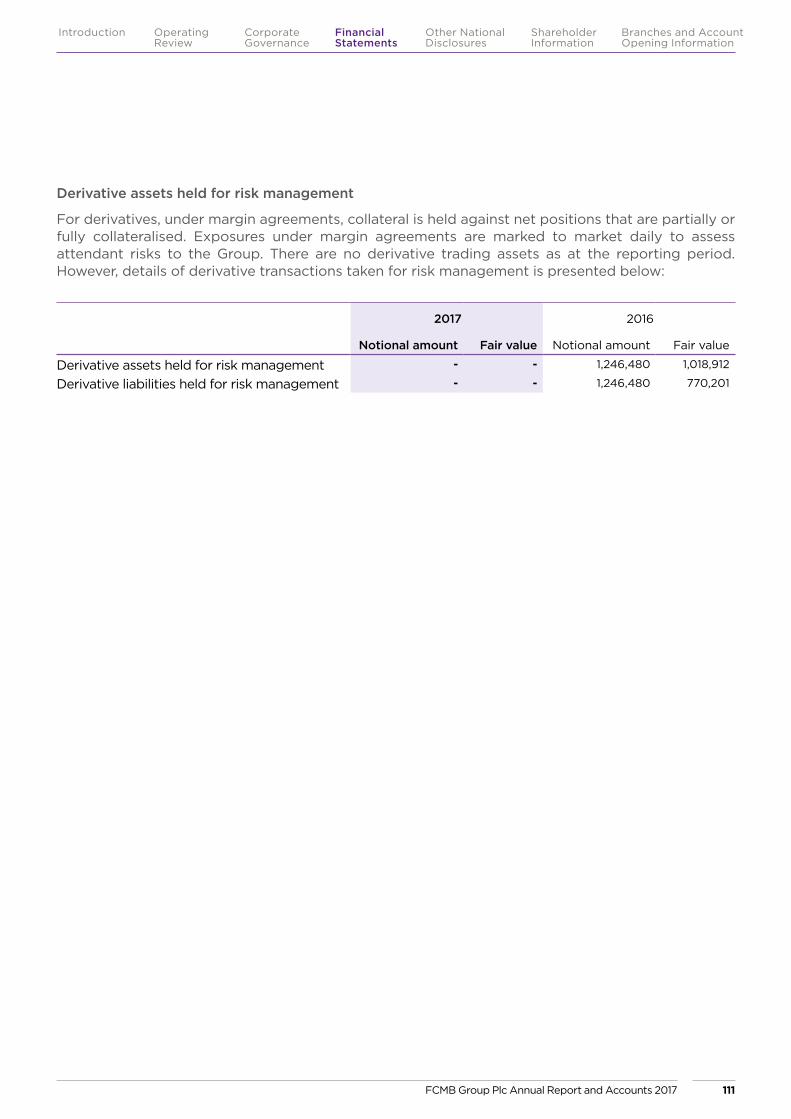
Derivative assets held for risk management
For derivatives, under margin agreements, collateral is held against net positions that are partially or fully collateralised. Exposures under margin agreements are marked to market daily to assess attendant risks to the Group. There are no derivative trading assets as at the reporting period. However, details of derivative transactions taken for risk management is presented below:
2017 2016
Notional amount Fair value Notional amount Fair value
Derivative assets held for risk management - - 1,246,480 1,018,912
Derivative liabilities held for risk management - - 1,246,480 770,201
FCMB Group Plc Annual Report and Accounts 2017 111
Introduction Operating Review
Corporate Governance
Financial Statements
Shareholder Information
Other National Disclosures
Branches and Account Opening Information
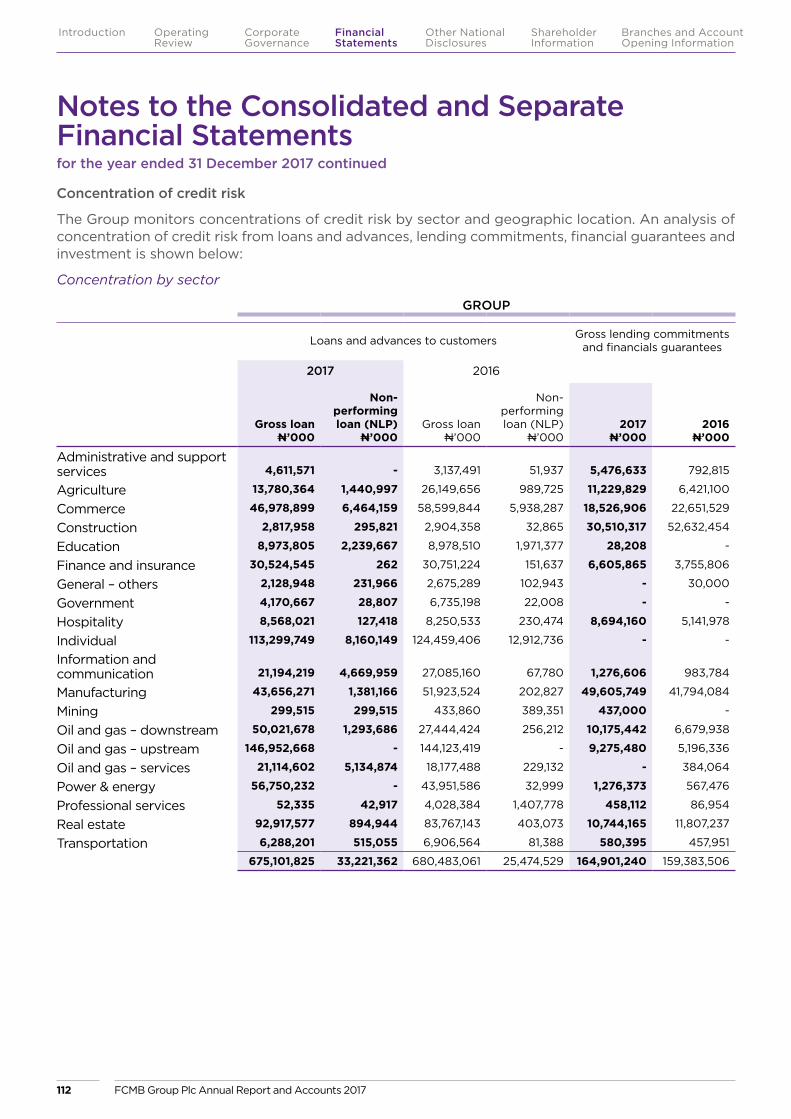
Concentration of credit risk
The Group monitors concentrations of credit risk by sector and geographic location. An analysis of concentration of credit risk from loans and advances, lending commitments, financial guarantees and investment is shown below:
Concentration by sector
GROUP
Loans and advances to customers Gross lending commitments and financials guarantees
2017 2016
Gross loan N’000
Non-performing loan (NLP)
N’000Gross loan
N’000
Non-performing loan (NLP)
N’0002017
N’0002016
N’000
Administrative and support services 4,611,571 - 3,137,491 51,937 5,476,633 792,815
Agriculture 13,780,364 1,440,997 26,149,656 989,725 11,229,829 6,421,100
Commerce 46,978,899 6,464,159 58,599,844 5,938,287 18,526,906 22,651,529
Construction 2,817,958 295,821 2,904,358 32,865 30,510,317 52,632,454
Education 8,973,805 2,239,667 8,978,510 1,971,377 28,208 -
Finance and insurance 30,524,545 262 30,751,224 151,637 6,605,865 3,755,806
General – others 2,128,948 231,966 2,675,289 102,943 - 30,000
Government 4,170,667 28,807 6,735,198 22,008 - -
Hospitality 8,568,021 127,418 8,250,533 230,474 8,694,160 5,141,978
Individual 113,299,749 8,160,149 124,459,406 12,912,736 - -
Information and communication 21,194,219 4,669,959 27,085,160 67,780 1,276,606 983,784
Manufacturing 43,656,271 1,381,166 51,923,524 202,827 49,605,749 41,794,084
Mining 299,515 299,515 433,860 389,351 437,000 -
Oil and gas – downstream 50,021,678 1,293,686 27,444,424 256,212 10,175,442 6,679,938
Oil and gas – upstream 146,952,668 - 144,123,419 - 9,275,480 5,196,336
Oil and gas – services 21,114,602 5,134,874 18,177,488 229,132 - 384,064
Power & energy 56,750,232 - 43,951,586 32,999 1,276,373 567,476
Professional services 52,335 42,917 4,028,384 1,407,778 458,112 86,954
Real estate 92,917,577 894,944 83,767,143 403,073 10,744,165 11,807,237
Transportation 6,288,201 515,055 6,906,564 81,388 580,395 457,951
675,101,825 33,221,362 680,483,061 25,474,529 164,901,240 159,383,506
Notes to the Consolidated and Separate Financial Statementsfor the year ended 31 December 2017 continued
FCMB Group Plc Annual Report and Accounts 2017112
Introduction Operating Review
Corporate Governance
Financial Statements
Shareholder Information
Other National Disclosures
Branches and Account Opening Information
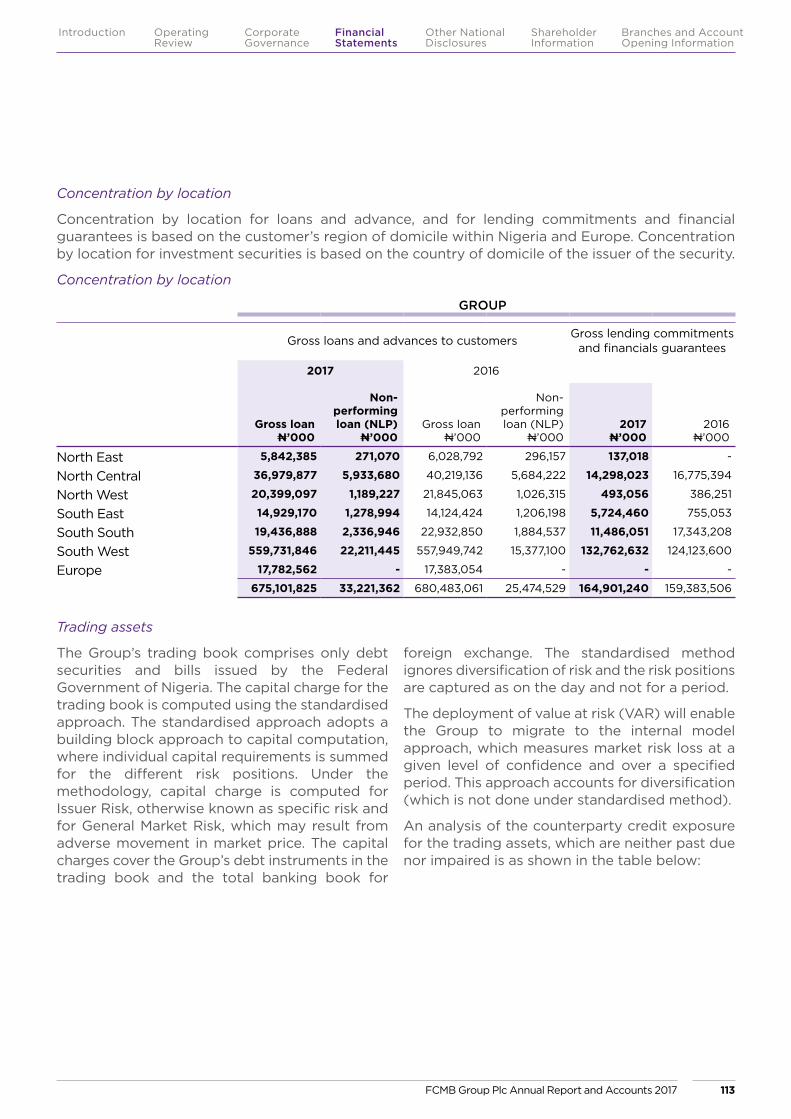
Concentration by location
Concentration by location for loans and advance, and for lending commitments and financial guarantees is based on the customer’s region of domicile within Nigeria and Europe. Concentration by location for investment securities is based on the country of domicile of the issuer of the security.
Concentration by location
Trading assets
The Group’s trading book comprises only debt securities and bills issued by the Federal Government of Nigeria. The capital charge for the trading book is computed using the standardised approach. The standardised approach adopts a building block approach to capital computation, where individual capital requirements is summed for the different risk positions. Under the methodology, capital charge is computed for Issuer Risk, otherwise known as specific risk and for General Market Risk, which may result from adverse movement in market price. The capital charges cover the Group’s debt instruments in the trading book and the total banking book for
foreign exchange. The standardised method ignores diversification of risk and the risk positions are captured as on the day and not for a period.
The deployment of value at risk (VAR) will enable the Group to migrate to the internal model approach, which measures market risk loss at a given level of confidence and over a specified period. This approach accounts for diversification (which is not done under standardised method).
An analysis of the counterparty credit exposure for the trading assets, which are neither past due nor impaired is as shown in the table below:
GROUP
Gross loans and advances to customers Gross lending commitments and financials guarantees
2017 2016
Gross loan N’000
Non-performing loan (NLP)
N’000Gross loan
N’000
Non-performing loan (NLP)
N’0002017
N’0002016
N’000
North East 5,842,385 271,070 6,028,792 296,157 137,018 -
North Central 36,979,877 5,933,680 40,219,136 5,684,222 14,298,023 16,775,394
North West 20,399,097 1,189,227 21,845,063 1,026,315 493,056 386,251
South East 14,929,170 1,278,994 14,124,424 1,206,198 5,724,460 755,053
South South 19,436,888 2,336,946 22,932,850 1,884,537 11,486,051 17,343,208
South West 559,731,846 22,211,445 557,949,742 15,377,100 132,762,632 124,123,600
Europe 17,782,562 - 17,383,054 - - -
675,101,825 33,221,362 680,483,061 25,474,529 164,901,240 159,383,506
FCMB Group Plc Annual Report and Accounts 2017 113
Introduction Operating Review
Corporate Governance
Financial Statements
Shareholder Information
Other National Disclosures
Branches and Account Opening Information
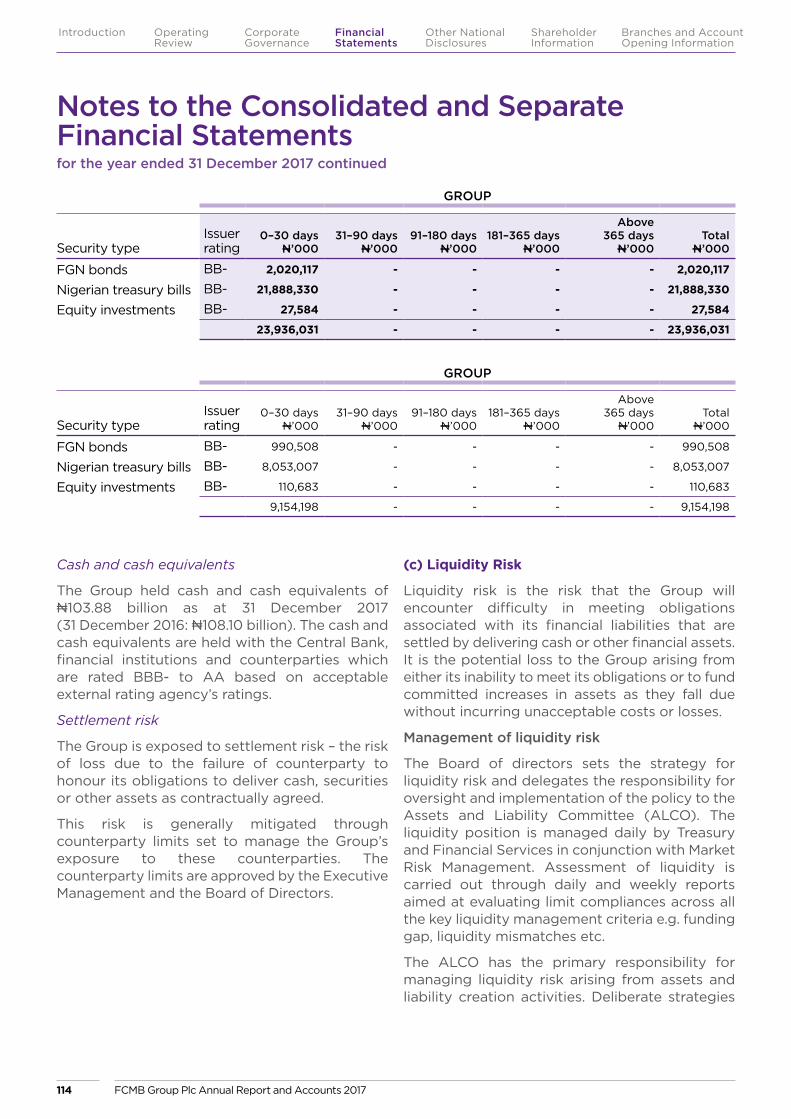
Cash and cash equivalents
The Group held cash and cash equivalents of N103.88 billion as at 31 December 2017 (31 December 2016: N108.10 billion). The cash and cash equivalents are held with the Central Bank, financial institutions and counterparties which are rated BBB- to AA based on acceptable external rating agency’s ratings.
Settlement risk
The Group is exposed to settlement risk – the risk of loss due to the failure of counterparty to honour its obligations to deliver cash, securities or other assets as contractually agreed.
This risk is generally mitigated through counterparty limits set to manage the Group’s exposure to these counterparties. The counterparty limits are approved by the Executive Management and the Board of Directors.
(c) Liquidity Risk
Liquidity risk is the risk that the Group will encounter difficulty in meeting obligations associated with its financial liabilities that are settled by delivering cash or other financial assets. It is the potential loss to the Group arising from either its inability to meet its obligations or to fund committed increases in assets as they fall due without incurring unacceptable costs or losses.
Management of liquidity risk
The Board of directors sets the strategy for liquidity risk and delegates the responsibility for oversight and implementation of the policy to the Assets and Liability Committee (ALCO). The liquidity position is managed daily by Treasury and Financial Services in conjunction with Market Risk Management. Assessment of liquidity is carried out through daily and weekly reports aimed at evaluating limit compliances across all the key liquidity management criteria e.g. funding gap, liquidity mismatches etc.
The ALCO has the primary responsibility for managing liquidity risk arising from assets and liability creation activities. Deliberate strategies
GROUP
Security typeIssuer rating
0–30 daysN’000
31–90 days N’000
91–180 days N’000
181–365 days N’000
Above 365 days
N’000Total
N’000
FGN bonds BB- 990,508 - - - - 990,508
Nigerian treasury bills BB- 8,053,007 - - - - 8,053,007
Equity investments BB- 110,683 - - - - 110,683
9,154,198 - - - - 9,154,198
GROUP
Security typeIssuer rating
0–30 daysN’000
31–90 days N’000
91–180 days N’000
181–365 days N’000
Above 365 days
N’000Total
N’000
FGN bonds BB- 2,020,117 - - - - 2,020,117
Nigerian treasury bills BB- 21,888,330 - - - - 21,888,330
Equity investments BB- 27,584 - - - - 27,584
23,936,031 - - - - 23,936,031
Notes to the Consolidated and Separate Financial Statementsfor the year ended 31 December 2017 continued
FCMB Group Plc Annual Report and Accounts 2017114
Introduction Operating Review
Corporate Governance
Financial Statements
Shareholder Information
Other National Disclosures
Branches and Account Opening Information

put in place to ensure the Group is protected from liquidity risk include:
� Liquidity risk identification at transaction, portfolio and entity levels using the defined early warning liquidity risk indicators such as deposit attrition, funding mismatch and funding concentrations to mention a few.
� Establishment of the Group’s liquidity risk appetite, which is the amount of risk FCMB is willing to accept in pursuit of value using relevant liquidity risk ratios and assets and liability funding gaps.
� Establishment of methodologies for measuring and reporting on the Group’s liquidity risk profile against set appetite and sensitizing against unforeseen circumstances using liquidity risk scenario analysis.
� Establishment of preventive (limit setting and management) as well as corrective (contingency funding plan – CFP) controls over liquidity risk.
� Maintaining a diversified funding base consisting of customer deposit (both retail and corporate) and wholesale market deposits and contingency deposits and liabilities.
� Carrying a portfolio of highly liquid assets, diversified by currency and maturity.
� Monitoring liquidity ratios, maturity mismatches, behavioural characteristics of the Group’s financial assets and liabilities, and the extent to which they are encumbered.
The Group conducts regular stress testing on its liquidity position using different scenarios including normal, mild and severe stress situations. The scenarios anticipate changes in key financial indicators such as interest rate movement, sharp reduction in Development Financial Institutions (DFIs) as a result of current security challenges, economic downturn among others. Stress results are presented to ALCO to elicit proactive liquidity management decisions. The committee’s resolutions are tracked for impact assessment and anticipated stability in liquidity management.
The Risk Management Division acts as the secretariat for ALCO and provides the necessary analytics (maturity/repricing gap and balance sheet analysis) required for taking proactive liquidity management decisions. The Group’s Treasury and Financial Services Division is responsible for executing ALCO decisions and in particular, ensuring that the Group is optimally and profitably funded at any point in time.
(i) Exposure to liquidity risk
The key measures adopted by the Group for liquidity management are maturity profile (on and off balance sheet) and maturity analysis. Details of reported ratio of the Group’s net liquid assets to deposit from customers as at the reporting period is given as:
2017 2016
At 31 December 36.63% 31.21%
Average for the year 34.89% 36.30%
Maximum for the year 38.94% 43.19%
Minimum for the year 31.30% 30.08%
Liquidity ratio which is a measure of liquidity risk is calculated as a ratio of Naira liquid assets to local currency deposits and its is expressed in percentages.
The exposure to liquidity risk during the review period is as presented below:
(ii) Maturity analysis for financial assets and liabilities
The table below analyses financial assets and liabilities of the Group into relevant maturity groupings based on the remaining period at balance sheet date to the contractual maturity date. These include both principal and interest cash flows across the different maturity periods. The following tables show the undiscounted cash flows on the Group’s financial assets and liabilities and on the basis of their earliest possible contractual maturity. The Gross nominal inflow/ (outflow) disclosed in the table is the contractual, undiscounted cash flow on the financial assets and liabilities.
FCMB Group Plc Annual Report and Accounts 2017 115
Introduction Operating Review
Corporate Governance
Financial Statements
Shareholder Information
Other National Disclosures
Branches and Account Opening Information
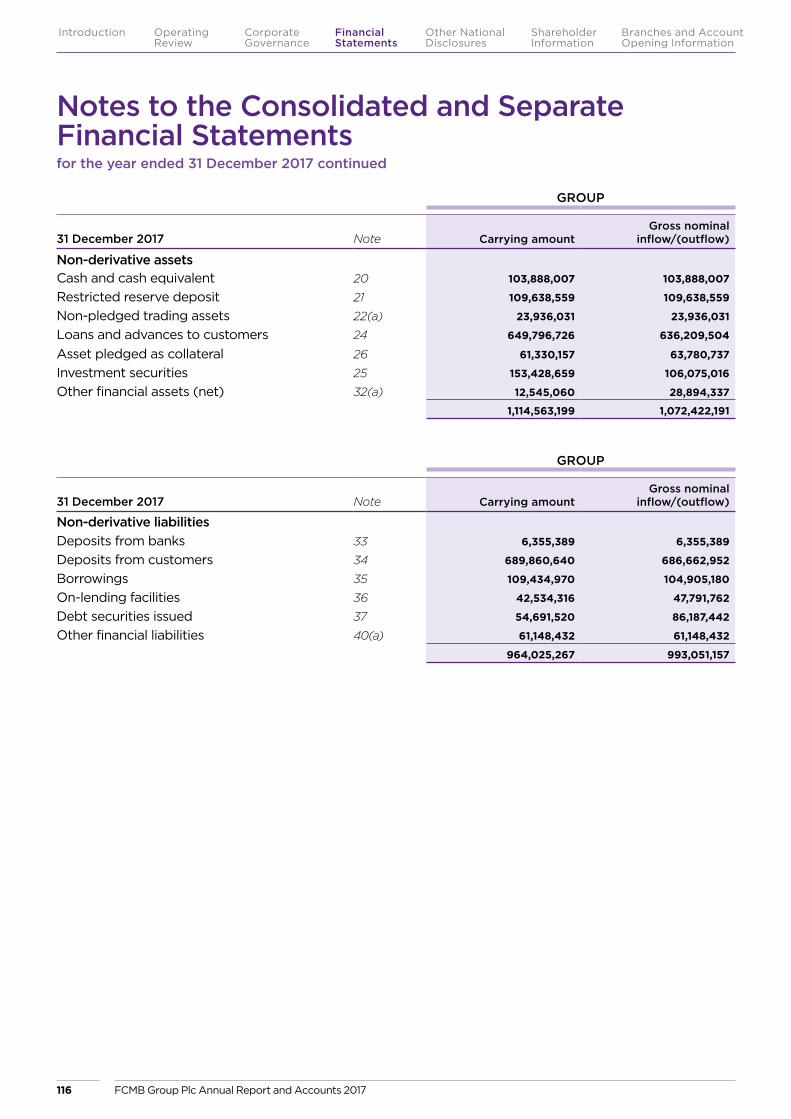
GROUP
31 December 2017 Note Carrying amountGross nominal
inflow/(outflow)
Non-derivative liabilitiesDeposits from banks 33 6,355,389 6,355,389
Deposits from customers 34 689,860,640 686,662,952
Borrowings 35 109,434,970 104,905,180
On-lending facilities 36 42,534,316 47,791,762
Debt securities issued 37 54,691,520 86,187,442
Other financial liabilities 40(a) 61,148,432 61,148,432
964,025,267 993,051,157
GROUP
31 December 2017 Note Carrying amountGross nominal
inflow/(outflow)
Non-derivative assetsCash and cash equivalent 20 103,888,007 103,888,007
Restricted reserve deposit 21 109,638,559 109,638,559
Non-pledged trading assets 22(a) 23,936,031 23,936,031
Loans and advances to customers 24 649,796,726 636,209,504
Asset pledged as collateral 26 61,330,157 63,780,737
Investment securities 25 153,428,659 106,075,016
Other financial assets (net) 32(a) 12,545,060 28,894,337
1,114,563,199 1,072,422,191
Notes to the Consolidated and Separate Financial Statementsfor the year ended 31 December 2017 continued
FCMB Group Plc Annual Report and Accounts 2017116
Introduction Operating Review
Corporate Governance
Financial Statements
Shareholder Information
Other National Disclosures
Branches and Account Opening Information
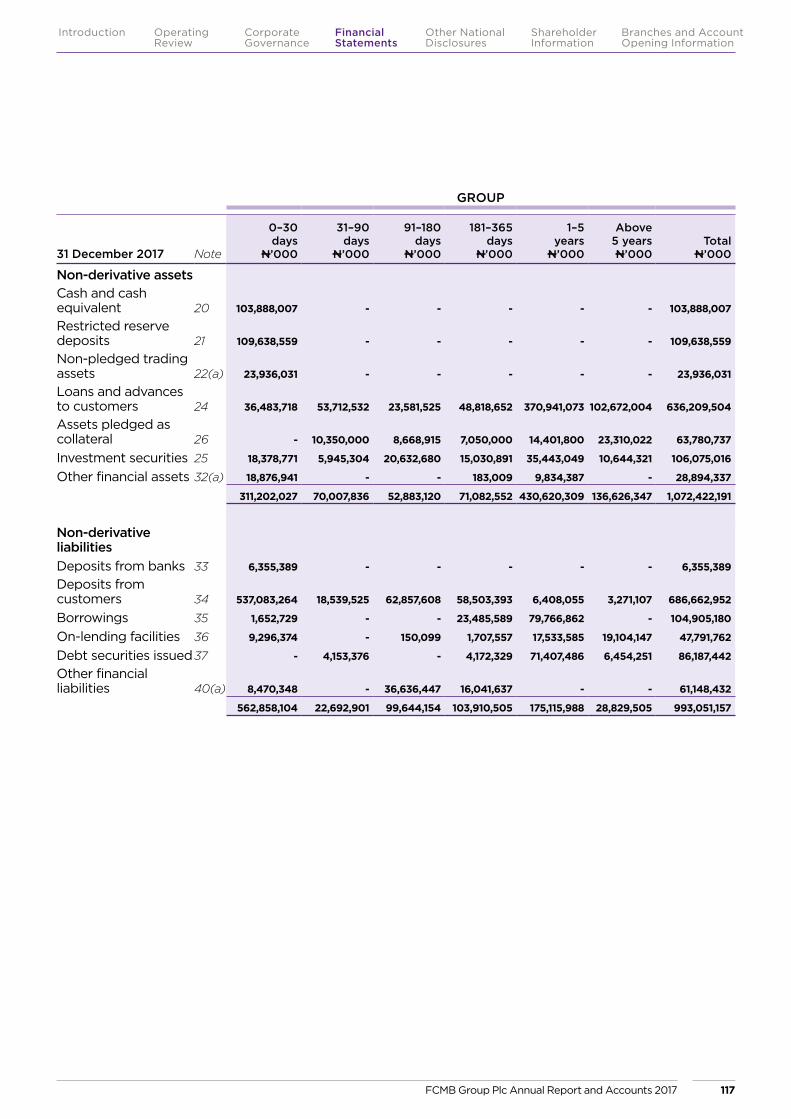
GROUP
31 December 2017 Note
0–30 days
N’000
31–90 days
N’000
91–180 days
N’000
181–365 days
N’000
1–5 years
N’000
Above 5 years N’000
TotalN’000
Non-derivative assetsCash and cash equivalent 20 103,888,007 - - - - - 103,888,007
Restricted reserve deposits 21 109,638,559 - - - - - 109,638,559
Non-pledged trading assets 22(a) 23,936,031 - - - - - 23,936,031
Loans and advances to customers 24 36,483,718 53,712,532 23,581,525 48,818,652 370,941,073 102,672,004 636,209,504
Assets pledged as collateral 26 - 10,350,000 8,668,915 7,050,000 14,401,800 23,310,022 63,780,737
Investment securities 25 18,378,771 5,945,304 20,632,680 15,030,891 35,443,049 10,644,321 106,075,016
Other financial assets 32(a) 18,876,941 - - 183,009 9,834,387 - 28,894,337
311,202,027 70,007,836 52,883,120 71,082,552 430,620,309 136,626,347 1,072,422,191
Non-derivative liabilitiesDeposits from banks 33 6,355,389 - - - - - 6,355,389
Deposits from customers 34 537,083,264 18,539,525 62,857,608 58,503,393 6,408,055 3,271,107 686,662,952
Borrowings 35 1,652,729 - - 23,485,589 79,766,862 - 104,905,180
On-lending facilities 36 9,296,374 - 150,099 1,707,557 17,533,585 19,104,147 47,791,762
Debt securities issued37 - 4,153,376 - 4,172,329 71,407,486 6,454,251 86,187,442
Other financial liabilities 40(a) 8,470,348 - 36,636,447 16,041,637 - - 61,148,432
562,858,104 22,692,901 99,644,154 103,910,505 175,115,988 28,829,505 993,051,157
FCMB Group Plc Annual Report and Accounts 2017 117
Introduction Operating Review
Corporate Governance
Financial Statements
Shareholder Information
Other National Disclosures
Branches and Account Opening Information
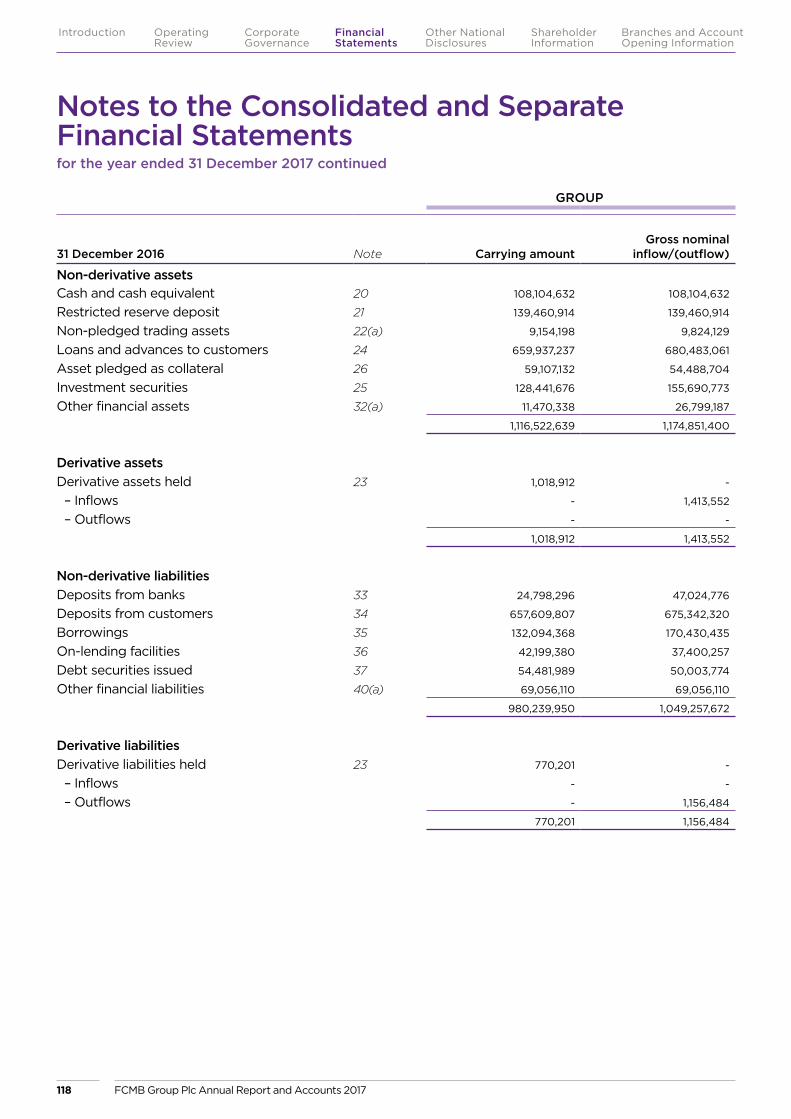
GROUP
31 December 2016 Note Carrying amountGross nominal
inflow/(outflow)
Non-derivative assetsCash and cash equivalent 20 108,104,632 108,104,632
Restricted reserve deposit 21 139,460,914 139,460,914
Non-pledged trading assets 22(a) 9,154,198 9,824,129
Loans and advances to customers 24 659,937,237 680,483,061
Asset pledged as collateral 26 59,107,132 54,488,704
Investment securities 25 128,441,676 155,690,773
Other financial assets 32(a) 11,470,338 26,799,187
1,116,522,639 1,174,851,400
Derivative assetsDerivative assets held 23 1,018,912 -
– Inflows - 1,413,552
– Outflows - -
1,018,912 1,413,552
Non-derivative liabilitiesDeposits from banks 33 24,798,296 47,024,776
Deposits from customers 34 657,609,807 675,342,320
Borrowings 35 132,094,368 170,430,435
On-lending facilities 36 42,199,380 37,400,257
Debt securities issued 37 54,481,989 50,003,774
Other financial liabilities 40(a) 69,056,110 69,056,110
980,239,950 1,049,257,672
Derivative liabilitiesDerivative liabilities held 23 770,201 -
– Inflows - -
– Outflows - 1,156,484
770,201 1,156,484
Notes to the Consolidated and Separate Financial Statementsfor the year ended 31 December 2017 continued
FCMB Group Plc Annual Report and Accounts 2017118
Introduction Operating Review
Corporate Governance
Financial Statements
Shareholder Information
Other National Disclosures
Branches and Account Opening Information
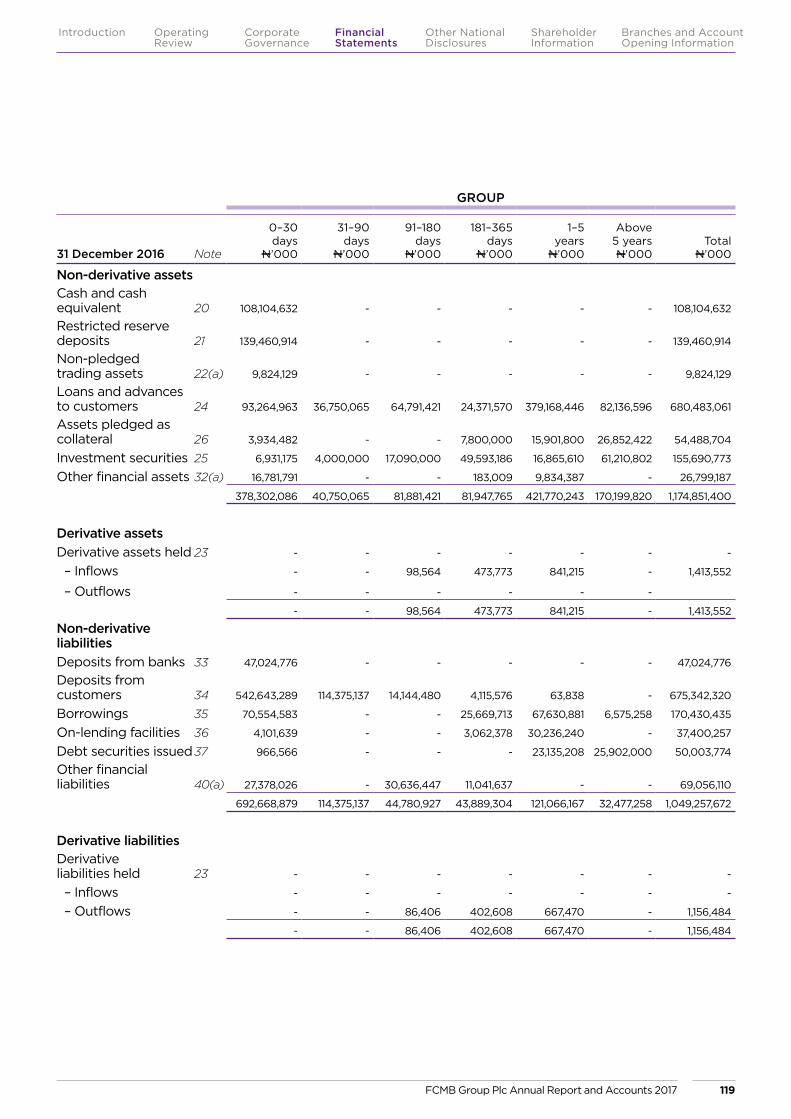
GROUP
31 December 2016 Note
0–30 days
N’000
31–90 days
N’000
91–180 days
N’000
181–365 days
N’000
1–5 years
N’000
Above 5 years N’000
TotalN’000
Non-derivative assetsCash and cash equivalent 20 108,104,632 - - - - - 108,104,632
Restricted reserve deposits 21 139,460,914 - - - - - 139,460,914
Non-pledged trading assets 22(a) 9,824,129 - - - - - 9,824,129
Loans and advances to customers 24 93,264,963 36,750,065 64,791,421 24,371,570 379,168,446 82,136,596 680,483,061
Assets pledged as collateral 26 3,934,482 - - 7,800,000 15,901,800 26,852,422 54,488,704
Investment securities 25 6,931,175 4,000,000 17,090,000 49,593,186 16,865,610 61,210,802 155,690,773
Other financial assets 32(a) 16,781,791 - - 183,009 9,834,387 - 26,799,187
378,302,086 40,750,065 81,881,421 81,947,765 421,770,243 170,199,820 1,174,851,400
Derivative assetsDerivative assets held 23 - - - - - - -
– Inflows - - 98,564 473,773 841,215 - 1,413,552
– Outflows - - - - - -
- - 98,564 473,773 841,215 - 1,413,552
Non-derivative liabilitiesDeposits from banks 33 47,024,776 - - - - - 47,024,776
Deposits from customers 34 542,643,289 114,375,137 14,144,480 4,115,576 63,838 - 675,342,320
Borrowings 35 70,554,583 - - 25,669,713 67,630,881 6,575,258 170,430,435
On-lending facilities 36 4,101,639 - - 3,062,378 30,236,240 - 37,400,257
Debt securities issued37 966,566 - - - 23,135,208 25,902,000 50,003,774
Other financial liabilities 40(a) 27,378,026 - 30,636,447 11,041,637 - - 69,056,110
692,668,879 114,375,137 44,780,927 43,889,304 121,066,167 32,477,258 1,049,257,672
Derivative liabilitiesDerivative liabilities held 23 - - - - - - -
– Inflows - - - - - - -
– Outflows - - 86,406 402,608 667,470 - 1,156,484
- - 86,406 402,608 667,470 - 1,156,484
FCMB Group Plc Annual Report and Accounts 2017 119
Introduction Operating Review
Corporate Governance
Financial Statements
Shareholder Information
Other National Disclosures
Branches and Account Opening Information

Type of financial instrument Basis on which amounts are compiled
Non-derivative financial liabilities and financial assets.
Undiscounted cash flows, which include estimated interest payments.
Derivative financial liabilities and financial assets held.
Contractual undiscounted cash flows. The amounts shown are the gross nominal inflows and outflows for derivatives that have simultaneous gross settlement and the net amounts for derivatives that are net settled.
Trading derivative liabilities and assets forming part of the Group’s proprietary trading operations that are expected to be closed out before contractual maturity.
Fair values at the date of the statement of financial position. This is because contractual maturities are not reflective of the liquidity risk exposure arising from these positions. These fair values are disclosed in the ‘less than 0-30 days’ column.
Issued financial guarantee contracts, and unrecognised loan commitments.
Earliest possible contractual maturity. For issued financial guarantee contracts, the maximum amount of the guarantee is allocated to the earliest period in which the guarantee could be called.
The amounts in the table above have been compiled as follows:
The Group’s expected cash flows on some financial assets and financial liabilities vary significantly from the contractual cash flows. The principal differences are as follows:
� demand deposits from customers are expected to remain stable or increase;
� unrecognised loan commitments are not all expected to be drawn down immediately; and
� retail mortgage loans have an original contractual maturity of between 10 and 15 years but an average expected maturity of six years because customers take advantage of early repayment options.
As part of the management of liquidity risk arising from financial liabilities, the Group holds liquid assets comprising cash and cash equivalents and debt securities issued by Central Bank of Nigeria, which can be readily sold to meet liquidity requirements. In addition, the Group maintains agreed lines of credit with other banks and holds unencumbered assets eligible for use as collateral with central banks.
(iii) Liquidity reserves
The table below sets out the components of the Group’s liquidity reserve.
31 December Note
Carrying amount 2017
N’000
Fair value 2017
N’000
Carrying amount 2016
N’000
Fair value 2016
N’000
Balances with the Central Banks 20 10,701,476 10,701,476 5,869,717 5,869,717
Cash and balances with other banks 20 93,186,531 93,186,531 102,234,915 102,234,915
Unencumbered debt securities issued by Central Bank of Nigeria 155,556,988 132,465,638 107,769,203 91,052,889
Total liquidity reserve 259,444,995 236,353,645 215,873,835 199,157,521
Notes to the Consolidated and Separate Financial Statementsfor the year ended 31 December 2017 continued
FCMB Group Plc Annual Report and Accounts 2017120
Introduction Operating Review
Corporate Governance
Financial Statements
Shareholder Information
Other National Disclosures
Branches and Account Opening Information
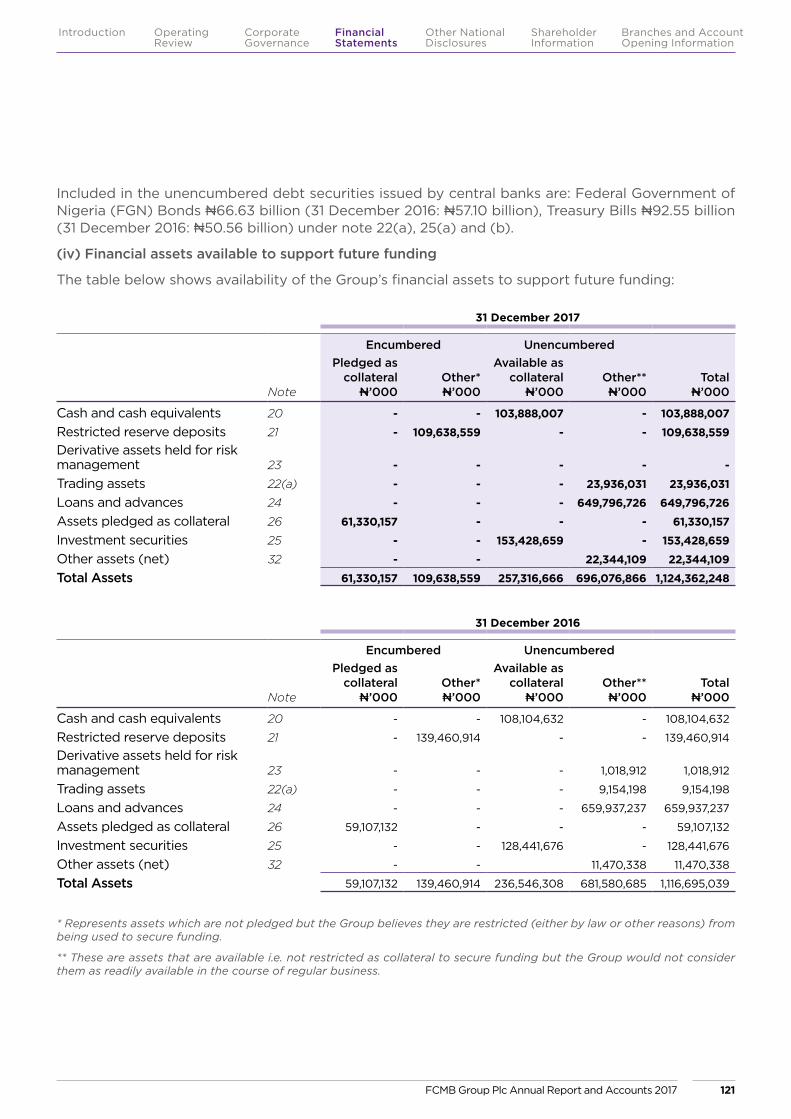
31 December 2017
Encumbered Unencumbered
Note
Pledged as collateral
N’000Other*N’000
Available as collateral
N’000Other**N’000
Total N’000
Cash and cash equivalents 20 - - 103,888,007 - 103,888,007
Restricted reserve deposits 21 - 109,638,559 - - 109,638,559 Derivative assets held for risk management 23 - - - - -
Trading assets 22(a) - - - 23,936,031 23,936,031
Loans and advances 24 - - - 649,796,726 649,796,726
Assets pledged as collateral 26 61,330,157 - - - 61,330,157
Investment securities 25 - - 153,428,659 - 153,428,659
Other assets (net) 32 - - 22,344,109 22,344,109
Total Assets 61,330,157 109,638,559 257,316,666 696,076,866 1,124,362,248
31 December 2016
Encumbered Unencumbered
Note
Pledged as collateral
N’000Other*N’000
Available as collateral
N’000Other**N’000
Total N’000
Cash and cash equivalents 20 - - 108,104,632 - 108,104,632
Restricted reserve deposits 21 - 139,460,914 - - 139,460,914
Derivative assets held for risk management 23 - - - 1,018,912 1,018,912
Trading assets 22(a) - - - 9,154,198 9,154,198
Loans and advances 24 - - - 659,937,237 659,937,237
Assets pledged as collateral 26 59,107,132 - - - 59,107,132
Investment securities 25 - - 128,441,676 - 128,441,676
Other assets (net) 32 - - 11,470,338 11,470,338
Total Assets 59,107,132 139,460,914 236,546,308 681,580,685 1,116,695,039
Included in the unencumbered debt securities issued by central banks are: Federal Government of Nigeria (FGN) Bonds N66.63 billion (31 December 2016: N57.10 billion), Treasury Bills N92.55 billion (31 December 2016: N50.56 billion) under note 22(a), 25(a) and (b).
(iv) Financial assets available to support future funding
The table below shows availability of the Group’s financial assets to support future funding:
* Represents assets which are not pledged but the Group believes they are restricted (either by law or other reasons) from being used to secure funding.
** These are assets that are available i.e. not restricted as collateral to secure funding but the Group would not consider them as readily available in the course of regular business.
FCMB Group Plc Annual Report and Accounts 2017 121
Introduction Operating Review
Corporate Governance
Financial Statements
Shareholder Information
Other National Disclosures
Branches and Account Opening Information
Financial assets pledged as collateral
The total financial assets recognised in the statement of financial position that had been pledged as collateral for liabilities at 31 December 2017 and 31 December 2016 are shown in the preceding table.
Financial assets are pledged as collateral as part of securities borrowing, clearing and client’s collection transactions under terms that are usual and customary for such activities.
(d) Market Risk
Market risk is the risk that changes in market prices such as interest rate, equity/commodity prices, foreign exchange rates will affect the Group’s income or the value of its holdings in financial instruments. The objective of the Group’s market risk management is to manage and control market risk exposures within acceptable parameters in order to ensure the Group’s solvency while optimizing the return on risk.
Management of market risk
Market risk is the risk that movements in market factors including foreign exchange rates and interest rates, credit spreads and equity prices, will reduce the Group’s income or the value of its portfolios. FCMB classifies its market risk into asset and liability management (ALM) risk, investment risk and trading risk.
The Group separates its market risk exposures between trading and non-trading portfolios. Trading portfolios are mainly held by the Treasury
and Financial Services group and include positions from market making and proprietary positions taking together with financial assets and liabilities that are managed on fair value basis.
The Group has a robust methodology and procedures for the identification, assessment, control, monitoring and reporting of market risks within its trading portfolio and the rest of the Group’s balance sheet. The Market and Liquidity Risk Management Department within Risk Management Division is responsible for measuring market risk exposures in accordance with the policies defined by the Board, monitoring and reporting the exposures against the prescribed limits.
Overall authority for market risk is vested by the Board in ALCO, which sets up limits for each type of risk in aggregate. However, Market and Liquidity Risk Department within Risk Management is responsible for limit tracking and reporting to the Chief Risk Officer and ultimately, Assets and Liability Committee. The Group employs a range of tools to monitor and ensure risk acceptance is kept within defined limit. Detail of market risk exposures as at 31 December 2017 are provided below:
Market risk measures
The table below sets out the allocation of assets and liabilities subject to price risk, classified by trading and non-trading portfolio:
Notes to the Consolidated and Separate Financial Statementsfor the year ended 31 December 2017 continued
FCMB Group Plc Annual Report and Accounts 2017122
Introduction Operating Review
Corporate Governance
Financial Statements
Shareholder Information
Other National Disclosures
Branches and Account Opening Information
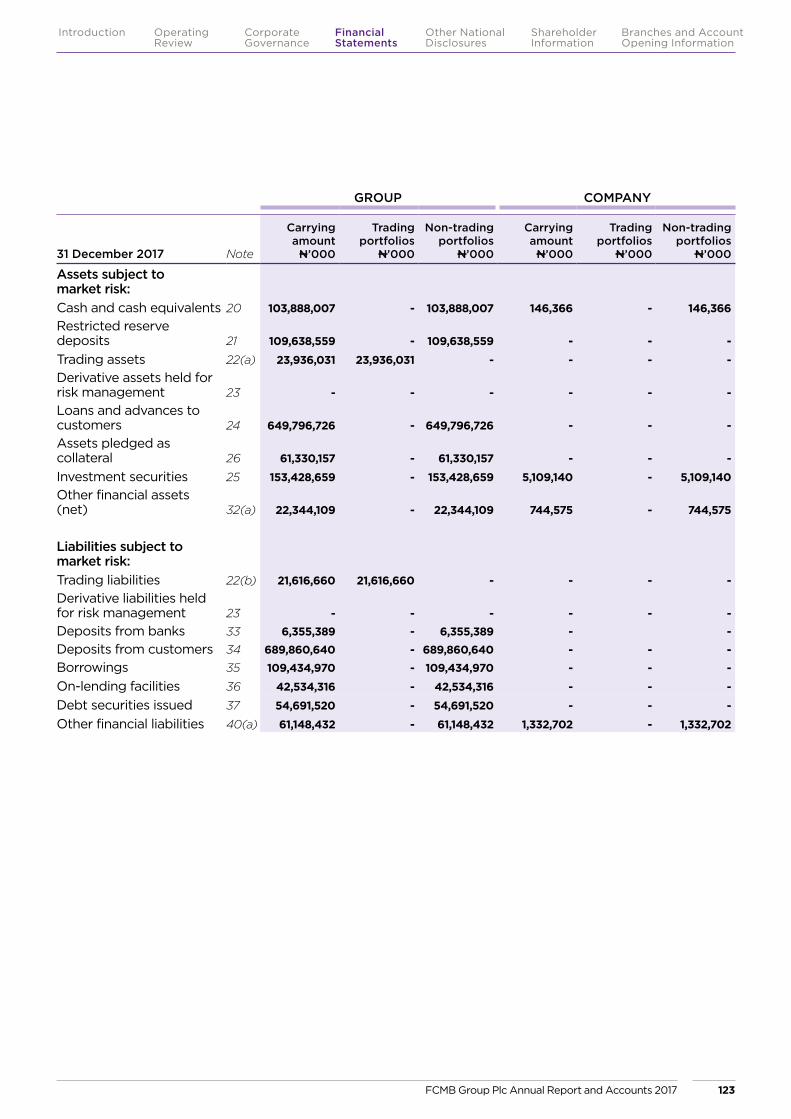
GROUP COMPANY
31 December 2017 Note
Carrying amount
N’000
Trading portfolios
N’000
Non-trading portfolios
N’000
Carrying amount
N’000
Trading portfolios
N’000
Non-trading portfolios
N’000
Assets subject to market risk:Cash and cash equivalents 20 103,888,007 - 103,888,007 146,366 - 146,366Restricted reserve deposits 21 109,638,559 - 109,638,559 - - -
Trading assets 22(a) 23,936,031 23,936,031 - - - - Derivative assets held for risk management 23 - - - - - - Loans and advances to customers 24 649,796,726 - 649,796,726 - - - Assets pledged as collateral 26 61,330,157 - 61,330,157 - - -
Investment securities 25 153,428,659 - 153,428,659 5,109,140 - 5,109,140Other financial assets (net) 32(a) 22,344,109 - 22,344,109 744,575 - 744,575
Liabilities subject to market risk:Trading liabilities 22(b) 21,616,660 21,616,660 - - - - Derivative liabilities held for risk management 23 - - - - - - Deposits from banks 33 6,355,389 - 6,355,389 - - Deposits from customers 34 689,860,640 - 689,860,640 - - - Borrowings 35 109,434,970 - 109,434,970 - - -
On-lending facilities 36 42,534,316 - 42,534,316 - - -
Debt securities issued 37 54,691,520 - 54,691,520 - - -
Other financial liabilities 40(a) 61,148,432 - 61,148,432 1,332,702 - 1,332,702
FCMB Group Plc Annual Report and Accounts 2017 123
Introduction Operating Review
Corporate Governance
Financial Statements
Shareholder Information
Other National Disclosures
Branches and Account Opening Information
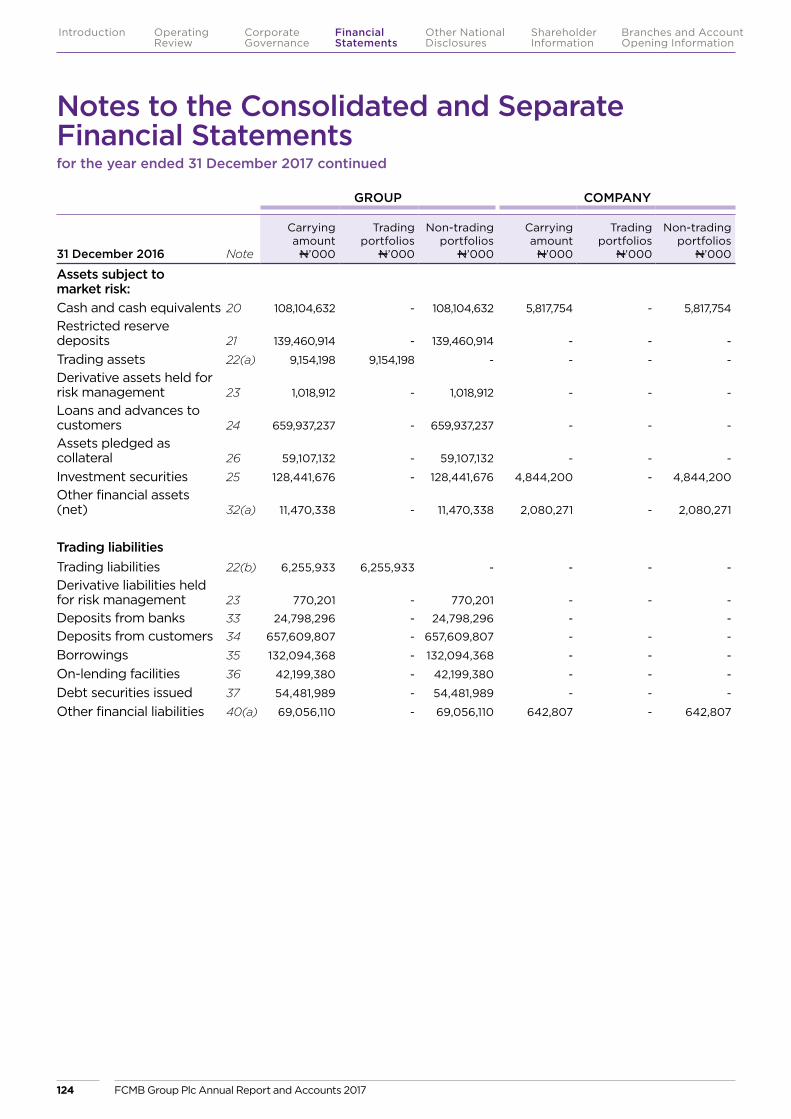
GROUP COMPANY
31 December 2016 Note
Carrying amount
N’000
Trading portfolios
N’000
Non-trading portfolios
N’000
Carrying amount
N’000
Trading portfolios
N’000
Non-trading portfolios
N’000
Assets subject to market risk:Cash and cash equivalents 20 108,104,632 - 108,104,632 5,817,754 - 5,817,754
Restricted reserve deposits 21 139,460,914 - 139,460,914 - - -
Trading assets 22(a) 9,154,198 9,154,198 - - - -
Derivative assets held for risk management 23 1,018,912 - 1,018,912 - - -
Loans and advances to customers 24 659,937,237 - 659,937,237 - - -
Assets pledged as collateral 26 59,107,132 - 59,107,132 - - -
Investment securities 25 128,441,676 - 128,441,676 4,844,200 - 4,844,200
Other financial assets (net) 32(a) 11,470,338 - 11,470,338 2,080,271 - 2,080,271
Trading liabilitiesTrading liabilities 22(b) 6,255,933 6,255,933 - - - -
Derivative liabilities held for risk management 23 770,201 - 770,201 - - -
Deposits from banks 33 24,798,296 - 24,798,296 - -
Deposits from customers 34 657,609,807 - 657,609,807 - - -
Borrowings 35 132,094,368 - 132,094,368 - - -
On-lending facilities 36 42,199,380 - 42,199,380 - - -
Debt securities issued 37 54,481,989 - 54,481,989 - - -
Other financial liabilities 40(a) 69,056,110 - 69,056,110 642,807 - 642,807
Notes to the Consolidated and Separate Financial Statementsfor the year ended 31 December 2017 continued
FCMB Group Plc Annual Report and Accounts 2017124
Introduction Operating Review
Corporate Governance
Financial Statements
Shareholder Information
Other National Disclosures
Branches and Account Opening Information
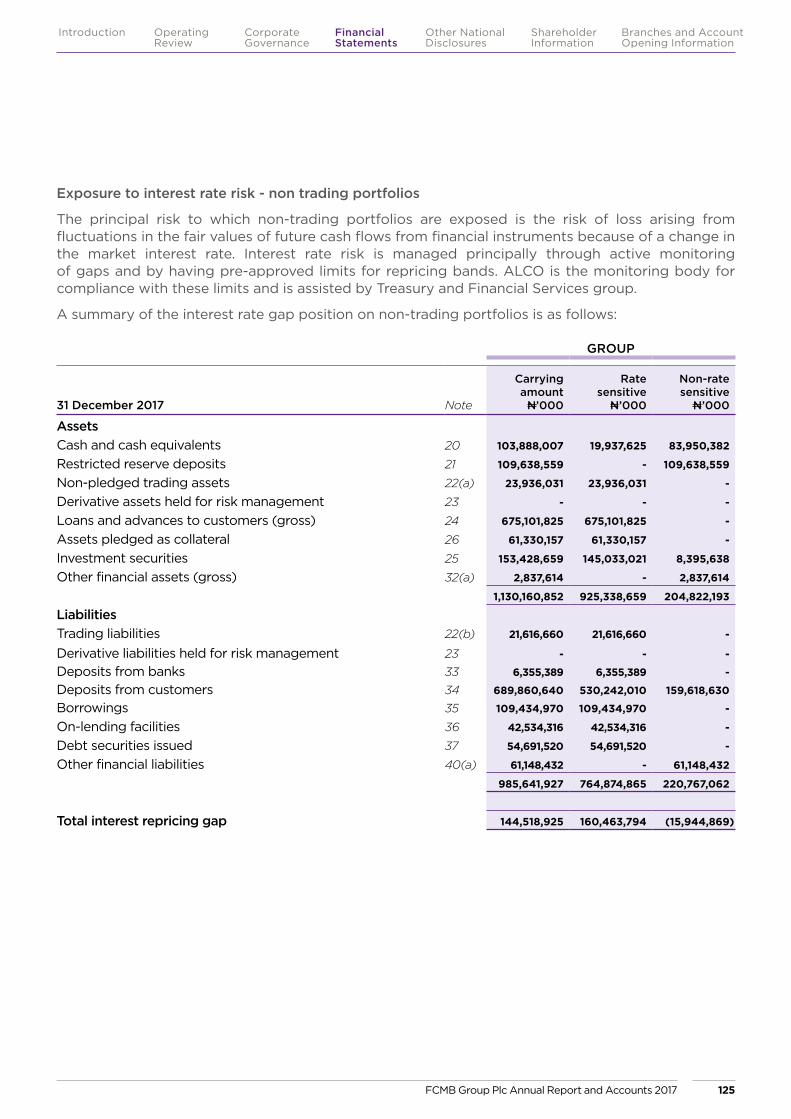
Exposure to interest rate risk - non trading portfolios
The principal risk to which non-trading portfolios are exposed is the risk of loss arising from fluctuations in the fair values of future cash flows from financial instruments because of a change in the market interest rate. Interest rate risk is managed principally through active monitoring of gaps and by having pre-approved limits for repricing bands. ALCO is the monitoring body for compliance with these limits and is assisted by Treasury and Financial Services group.
A summary of the interest rate gap position on non-trading portfolios is as follows:
GROUP
31 December 2017 Note
Carrying amount
N’000
Rate sensitive
N’000
Non-rate sensitive
N’000
AssetsCash and cash equivalents 20 103,888,007 19,937,625 83,950,382
Restricted reserve deposits 21 109,638,559 - 109,638,559
Non-pledged trading assets 22(a) 23,936,031 23,936,031 -
Derivative assets held for risk management 23 - - -
Loans and advances to customers (gross) 24 675,101,825 675,101,825 -
Assets pledged as collateral 26 61,330,157 61,330,157 -
Investment securities 25 153,428,659 145,033,021 8,395,638
Other financial assets (gross) 32(a) 2,837,614 - 2,837,614
1,130,160,852 925,338,659 204,822,193
LiabilitiesTrading liabilities 22(b) 21,616,660 21,616,660 -
Derivative liabilities held for risk management 23 - - -
Deposits from banks 33 6,355,389 6,355,389 -
Deposits from customers 34 689,860,640 530,242,010 159,618,630
Borrowings 35 109,434,970 109,434,970 -
On-lending facilities 36 42,534,316 42,534,316 -
Debt securities issued 37 54,691,520 54,691,520 -
Other financial liabilities 40(a) 61,148,432 - 61,148,432
985,641,927 764,874,865 220,767,062
Total interest repricing gap 144,518,925 160,463,794 (15,944,869)
FCMB Group Plc Annual Report and Accounts 2017 125
Introduction Operating Review
Corporate Governance
Financial Statements
Shareholder Information
Other National Disclosures
Branches and Account Opening Information
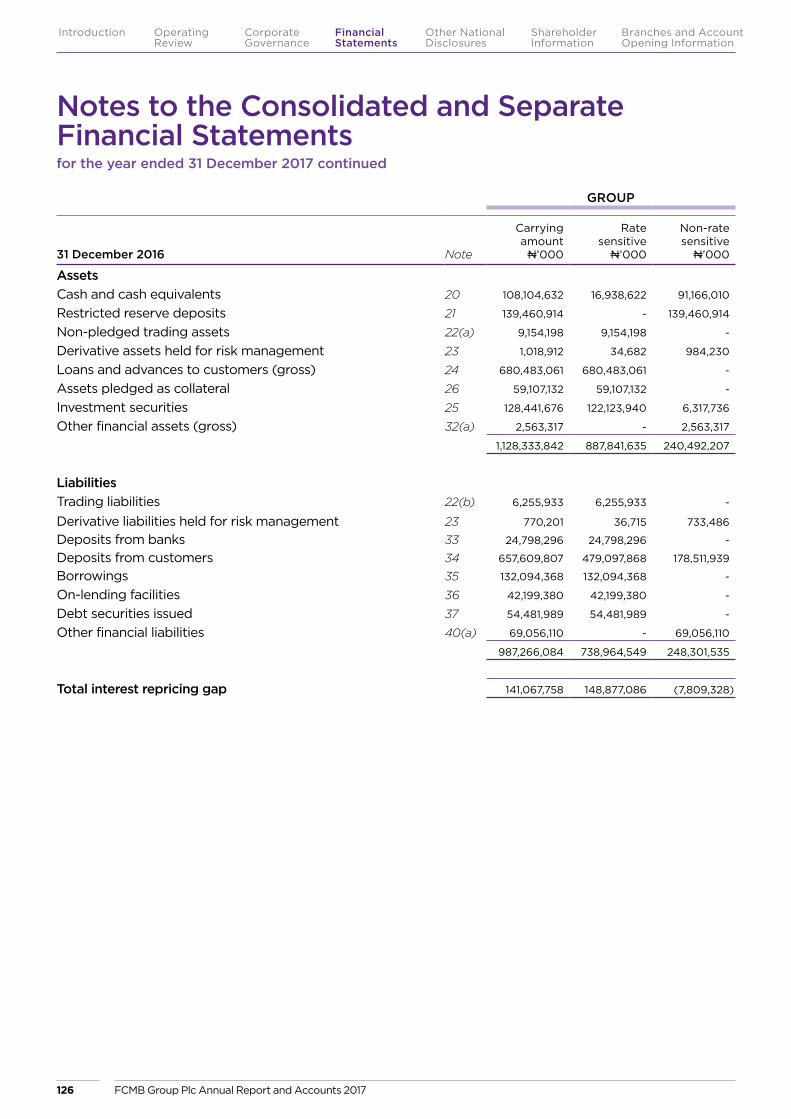
GROUP
31 December 2016 Note
Carrying amount
N’000
Rate sensitive
N’000
Non-rate sensitive
N’000
AssetsCash and cash equivalents 20 108,104,632 16,938,622 91,166,010
Restricted reserve deposits 21 139,460,914 - 139,460,914
Non-pledged trading assets 22(a) 9,154,198 9,154,198 -
Derivative assets held for risk management 23 1,018,912 34,682 984,230
Loans and advances to customers (gross) 24 680,483,061 680,483,061 -
Assets pledged as collateral 26 59,107,132 59,107,132 -
Investment securities 25 128,441,676 122,123,940 6,317,736
Other financial assets (gross) 32(a) 2,563,317 - 2,563,317
1,128,333,842 887,841,635 240,492,207
LiabilitiesTrading liabilities 22(b) 6,255,933 6,255,933 -
Derivative liabilities held for risk management 23 770,201 36,715 733,486
Deposits from banks 33 24,798,296 24,798,296 -
Deposits from customers 34 657,609,807 479,097,868 178,511,939
Borrowings 35 132,094,368 132,094,368 -
On-lending facilities 36 42,199,380 42,199,380 -
Debt securities issued 37 54,481,989 54,481,989 -
Other financial liabilities 40(a) 69,056,110 - 69,056,110
987,266,084 738,964,549 248,301,535
Total interest repricing gap 141,067,758 148,877,086 (7,809,328)
Notes to the Consolidated and Separate Financial Statementsfor the year ended 31 December 2017 continued
FCMB Group Plc Annual Report and Accounts 2017126
Introduction Operating Review
Corporate Governance
Financial Statements
Shareholder Information
Other National Disclosures
Branches and Account Opening Information

GROUP
31 December 2017 Note
0–30 days
N’000
31–90 days
N’000
91–180 days
N’000
181–365 days
N’000
1–5 years
N’000
Above 5 yearsN’000
Total rate sensitive
N’000
Assets subject to market risk:Cash and cash equivalents 20 19,937,625 - - - - - 19,937,625
Non-pledged trading assets 22(a) 181,385 500,000 11,090,000 10,264,646 100,000 1,800,000 23,936,031
Loans and advances to customers (gross) 24 32,422,182 53,620,898 23,502,179 48,799,609 414,118,473 102,638,484 675,101,825
Assets pledged as collateral 26 4,183,853 10,350,000 2,034,482 7,050,000 14,401,800 23,310,022 61,330,157
Investment securities 25 34,576,812 19,385,378 19,994,121 17,370,179 27,098,847 26,607,684 145,033,021
91,301,857 83,856,276 56,620,782 83,484,434 455,719,120 154,356,190 925,338,659
Liabilities subject to market risk:Trading liabilities 22(b) 21,616,660 - - - - - 21,616,660
Deposits from banks 33 6,355,389 - - - - - 6,355,389
Deposits from customers 34 433,237,968 73,476,091 14,378,225 5,634,063 3,515,663 - 530,242,010
Borrowings 35 114,489 - 6,613,130 22,940,489 79,766,862 - 109,434,970
On-lending facilities 36 4,038,928 - 150,099 1,707,557 17,533,585 19,104,147 42,534,316
Debt securities issued 37 - - - - 28,790,231 25,901,289 54,691,520
465,363,434 73,476,091 21,141,454 30,282,109 129,606,341 45,005,436 764,874,865
Total interest repricing gap (374,061,577) 10,380,185 35,479,328 53,202,325 326,112,779 109,350,754 160,463,794
FCMB Group Plc Annual Report and Accounts 2017 127
Introduction Operating Review
Corporate Governance
Financial Statements
Shareholder Information
Other National Disclosures
Branches and Account Opening Information
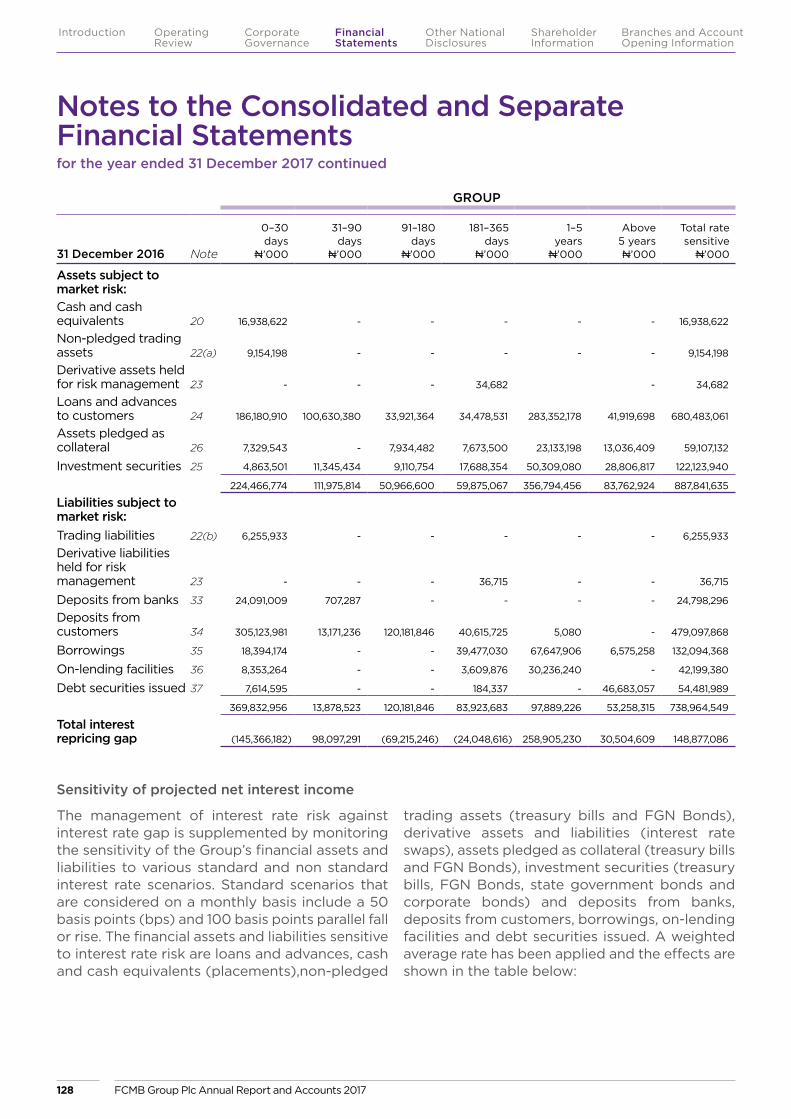
GROUP
31 December 2016 Note
0–30 days
N’000
31–90 days
N’000
91–180 days
N’000
181–365 days
N’000
1–5 years
N’000
Above 5 yearsN’000
Total rate sensitive
N’000
Assets subject to market risk:Cash and cash equivalents 20 16,938,622 - - - - - 16,938,622
Non-pledged trading assets 22(a) 9,154,198 - - - - - 9,154,198
Derivative assets held for risk management 23 - - - 34,682 - 34,682
Loans and advances to customers 24 186,180,910 100,630,380 33,921,364 34,478,531 283,352,178 41,919,698 680,483,061
Assets pledged as collateral 26 7,329,543 - 7,934,482 7,673,500 23,133,198 13,036,409 59,107,132
Investment securities 25 4,863,501 11,345,434 9,110,754 17,688,354 50,309,080 28,806,817 122,123,940
224,466,774 111,975,814 50,966,600 59,875,067 356,794,456 83,762,924 887,841,635
Liabilities subject to market risk:Trading liabilities 22(b) 6,255,933 - - - - - 6,255,933
Derivative liabilities held for risk management 23 - - - 36,715 - - 36,715
Deposits from banks 33 24,091,009 707,287 - - - - 24,798,296
Deposits from customers 34 305,123,981 13,171,236 120,181,846 40,615,725 5,080 - 479,097,868
Borrowings 35 18,394,174 - - 39,477,030 67,647,906 6,575,258 132,094,368
On-lending facilities 36 8,353,264 - - 3,609,876 30,236,240 - 42,199,380
Debt securities issued 37 7,614,595 - - 184,337 - 46,683,057 54,481,989
369,832,956 13,878,523 120,181,846 83,923,683 97,889,226 53,258,315 738,964,549
Total interest repricing gap (145,366,182) 98,097,291 (69,215,246) (24,048,616) 258,905,230 30,504,609 148,877,086
Sensitivity of projected net interest income
The management of interest rate risk against interest rate gap is supplemented by monitoring the sensitivity of the Group’s financial assets and liabilities to various standard and non standard interest rate scenarios. Standard scenarios that are considered on a monthly basis include a 50 basis points (bps) and 100 basis points parallel fall or rise. The financial assets and liabilities sensitive to interest rate risk are loans and advances, cash and cash equivalents (placements),non-pledged
trading assets (treasury bills and FGN Bonds), derivative assets and liabilities (interest rate swaps), assets pledged as collateral (treasury bills and FGN Bonds), investment securities (treasury bills, FGN Bonds, state government bonds and corporate bonds) and deposits from banks, deposits from customers, borrowings, on-lending facilities and debt securities issued. A weighted average rate has been applied and the effects are shown in the table below:
Notes to the Consolidated and Separate Financial Statementsfor the year ended 31 December 2017 continued
FCMB Group Plc Annual Report and Accounts 2017128
Introduction Operating Review
Corporate Governance
Financial Statements
Shareholder Information
Other National Disclosures
Branches and Account Opening Information
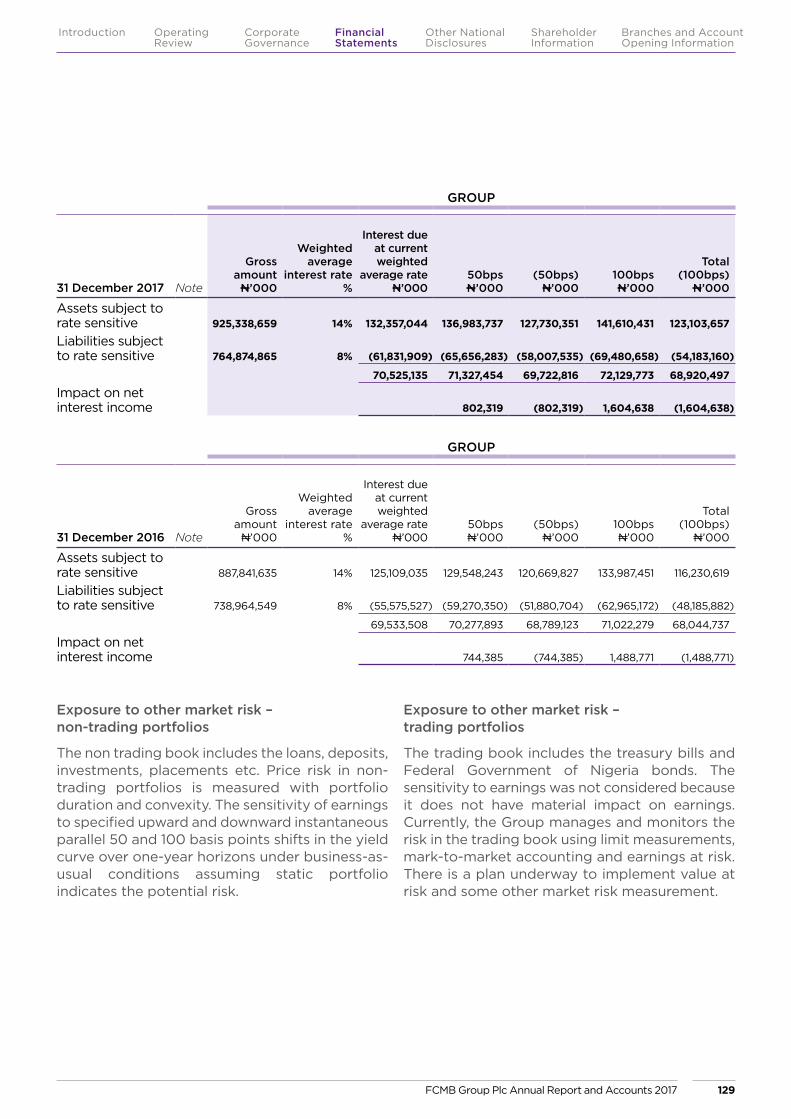
GROUP
31 December 2017 Note
Gross amount
N’000
Weighted average
interest rate%
Interest due at current weighted
average rateN’000
50bpsN’000
(50bps)N’000
100bpsN’000
Total(100bps)
N’000
Assets subject to rate sensitive 925,338,659 14% 132,357,044 136,983,737 127,730,351 141,610,431 123,103,657
Liabilities subject to rate sensitive 764,874,865 8% (61,831,909) (65,656,283) (58,007,535) (69,480,658) (54,183,160)
70,525,135 71,327,454 69,722,816 72,129,773 68,920,497
Impact on net interest income 802,319 (802,319) 1,604,638 (1,604,638)
GROUP
31 December 2016 Note
Gross amount
N’000
Weighted average
interest rate%
Interest due at current weighted
average rateN’000
50bpsN’000
(50bps)N’000
100bpsN’000
Total(100bps)
N’000
Assets subject to rate sensitive 887,841,635 14% 125,109,035 129,548,243 120,669,827 133,987,451 116,230,619
Liabilities subject to rate sensitive 738,964,549 8% (55,575,527) (59,270,350) (51,880,704) (62,965,172) (48,185,882)
69,533,508 70,277,893 68,789,123 71,022,279 68,044,737
Impact on net interest income 744,385 (744,385) 1,488,771 (1,488,771)
Exposure to other market risk – non-trading portfolios
The non trading book includes the loans, deposits, investments, placements etc. Price risk in non-trading portfolios is measured with portfolio duration and convexity. The sensitivity of earnings to specified upward and downward instantaneous parallel 50 and 100 basis points shifts in the yield curve over one-year horizons under business-as-usual conditions assuming static portfolio indicates the potential risk.
Exposure to other market risk – trading portfolios
The trading book includes the treasury bills and Federal Government of Nigeria bonds. The sensitivity to earnings was not considered because it does not have material impact on earnings. Currently, the Group manages and monitors the risk in the trading book using limit measurements, mark-to-market accounting and earnings at risk. There is a plan underway to implement value at risk and some other market risk measurement.
FCMB Group Plc Annual Report and Accounts 2017 129
Introduction Operating Review
Corporate Governance
Financial Statements
Shareholder Information
Other National Disclosures
Branches and Account Opening Information
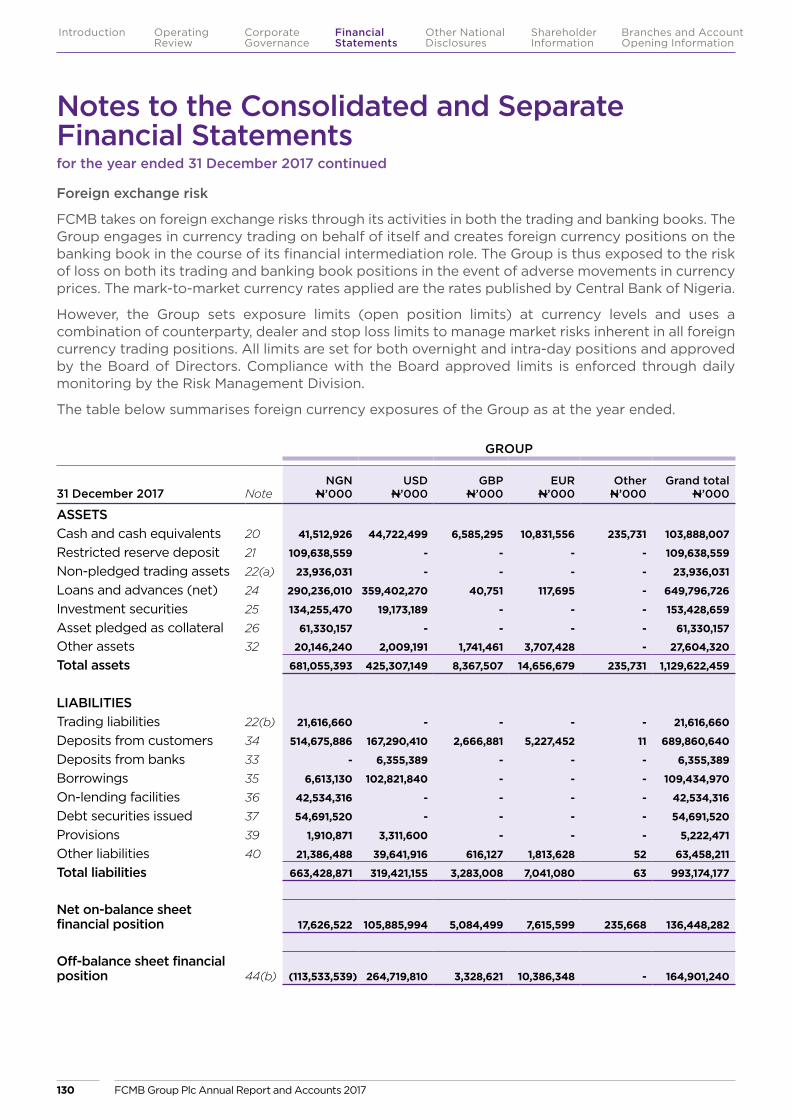
Foreign exchange risk
FCMB takes on foreign exchange risks through its activities in both the trading and banking books. The Group engages in currency trading on behalf of itself and creates foreign currency positions on the banking book in the course of its financial intermediation role. The Group is thus exposed to the risk of loss on both its trading and banking book positions in the event of adverse movements in currency prices. The mark-to-market currency rates applied are the rates published by Central Bank of Nigeria.
However, the Group sets exposure limits (open position limits) at currency levels and uses a combination of counterparty, dealer and stop loss limits to manage market risks inherent in all foreign currency trading positions. All limits are set for both overnight and intra-day positions and approved by the Board of Directors. Compliance with the Board approved limits is enforced through daily monitoring by the Risk Management Division.
The table below summarises foreign currency exposures of the Group as at the year ended.
GROUP
31 December 2017 NoteNGN
N’000USD
N’000GBP
N’000EUR
N’000Other
N’000Grand total
N’000
ASSETSCash and cash equivalents 20 41,512,926 44,722,499 6,585,295 10,831,556 235,731 103,888,007
Restricted reserve deposit 21 109,638,559 - - - - 109,638,559
Non-pledged trading assets 22(a) 23,936,031 - - - - 23,936,031
Loans and advances (net) 24 290,236,010 359,402,270 40,751 117,695 - 649,796,726
Investment securities 25 134,255,470 19,173,189 - - - 153,428,659
Asset pledged as collateral 26 61,330,157 - - - - 61,330,157
Other assets 32 20,146,240 2,009,191 1,741,461 3,707,428 - 27,604,320
Total assets 681,055,393 425,307,149 8,367,507 14,656,679 235,731 1,129,622,459
LIABILITIESTrading liabilities 22(b) 21,616,660 - - - - 21,616,660
Deposits from customers 34 514,675,886 167,290,410 2,666,881 5,227,452 11 689,860,640
Deposits from banks 33 - 6,355,389 - - - 6,355,389
Borrowings 35 6,613,130 102,821,840 - - - 109,434,970
On-lending facilities 36 42,534,316 - - - - 42,534,316
Debt securities issued 37 54,691,520 - - - - 54,691,520
Provisions 39 1,910,871 3,311,600 - - - 5,222,471
Other liabilities 40 21,386,488 39,641,916 616,127 1,813,628 52 63,458,211
Total liabilities 663,428,871 319,421,155 3,283,008 7,041,080 63 993,174,177
Net on-balance sheet financial position 17,626,522 105,885,994 5,084,499 7,615,599 235,668 136,448,282
Off-balance sheet financial position 44(b) (113,533,539) 264,719,810 3,328,621 10,386,348 - 164,901,240
Notes to the Consolidated and Separate Financial Statementsfor the year ended 31 December 2017 continued
FCMB Group Plc Annual Report and Accounts 2017130
Introduction Operating Review
Corporate Governance
Financial Statements
Shareholder Information
Other National Disclosures
Branches and Account Opening Information
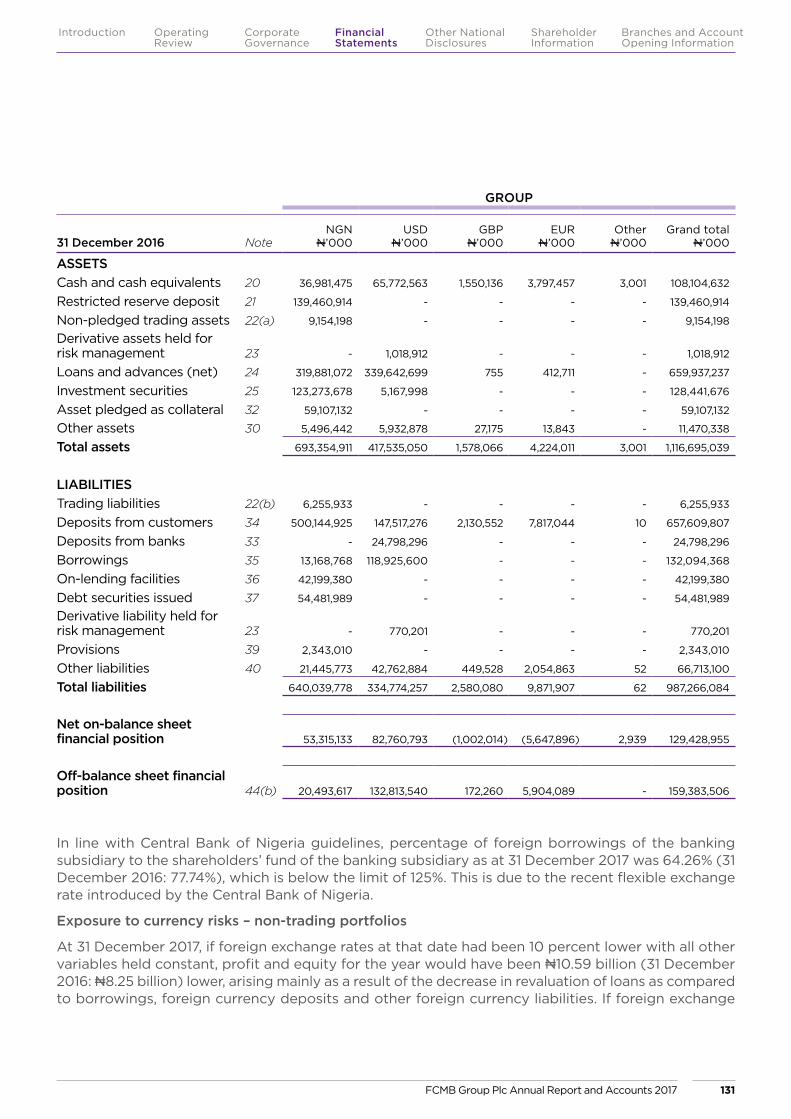
GROUP
31 December 2016 NoteNGN
N’000USD
N’000GBP
N’000EUR
N’000Other
N’000Grand total
N’000
ASSETSCash and cash equivalents 20 36,981,475 65,772,563 1,550,136 3,797,457 3,001 108,104,632
Restricted reserve deposit 21 139,460,914 - - - - 139,460,914
Non-pledged trading assets 22(a) 9,154,198 - - - - 9,154,198
Derivative assets held for risk management 23 - 1,018,912 - - - 1,018,912
Loans and advances (net) 24 319,881,072 339,642,699 755 412,711 - 659,937,237
Investment securities 25 123,273,678 5,167,998 - - - 128,441,676
Asset pledged as collateral 32 59,107,132 - - - - 59,107,132
Other assets 30 5,496,442 5,932,878 27,175 13,843 - 11,470,338
Total assets 693,354,911 417,535,050 1,578,066 4,224,011 3,001 1,116,695,039
LIABILITIESTrading liabilities 22(b) 6,255,933 - - - - 6,255,933
Deposits from customers 34 500,144,925 147,517,276 2,130,552 7,817,044 10 657,609,807
Deposits from banks 33 - 24,798,296 - - - 24,798,296
Borrowings 35 13,168,768 118,925,600 - - - 132,094,368
On-lending facilities 36 42,199,380 - - - - 42,199,380
Debt securities issued 37 54,481,989 - - - - 54,481,989
Derivative liability held for risk management 23 - 770,201 - - - 770,201
Provisions 39 2,343,010 - - - - 2,343,010
Other liabilities 40 21,445,773 42,762,884 449,528 2,054,863 52 66,713,100
Total liabilities 640,039,778 334,774,257 2,580,080 9,871,907 62 987,266,084
Net on-balance sheet financial position 53,315,133 82,760,793 (1,002,014) (5,647,896) 2,939 129,428,955
Off-balance sheet financial position 44(b) 20,493,617 132,813,540 172,260 5,904,089 - 159,383,506
In line with Central Bank of Nigeria guidelines, percentage of foreign borrowings of the banking subsidiary to the shareholders’ fund of the banking subsidiary as at 31 December 2017 was 64.26% (31 December 2016: 77.74%), which is below the limit of 125%. This is due to the recent flexible exchange rate introduced by the Central Bank of Nigeria.
Exposure to currency risks – non-trading portfolios
At 31 December 2017, if foreign exchange rates at that date had been 10 percent lower with all other variables held constant, profit and equity for the year would have been N10.59 billion (31 December 2016: N8.25 billion) lower, arising mainly as a result of the decrease in revaluation of loans as compared to borrowings, foreign currency deposits and other foreign currency liabilities. If foreign exchange
FCMB Group Plc Annual Report and Accounts 2017 131
Introduction Operating Review
Corporate Governance
Financial Statements
Shareholder Information
Other National Disclosures
Branches and Account Opening Information
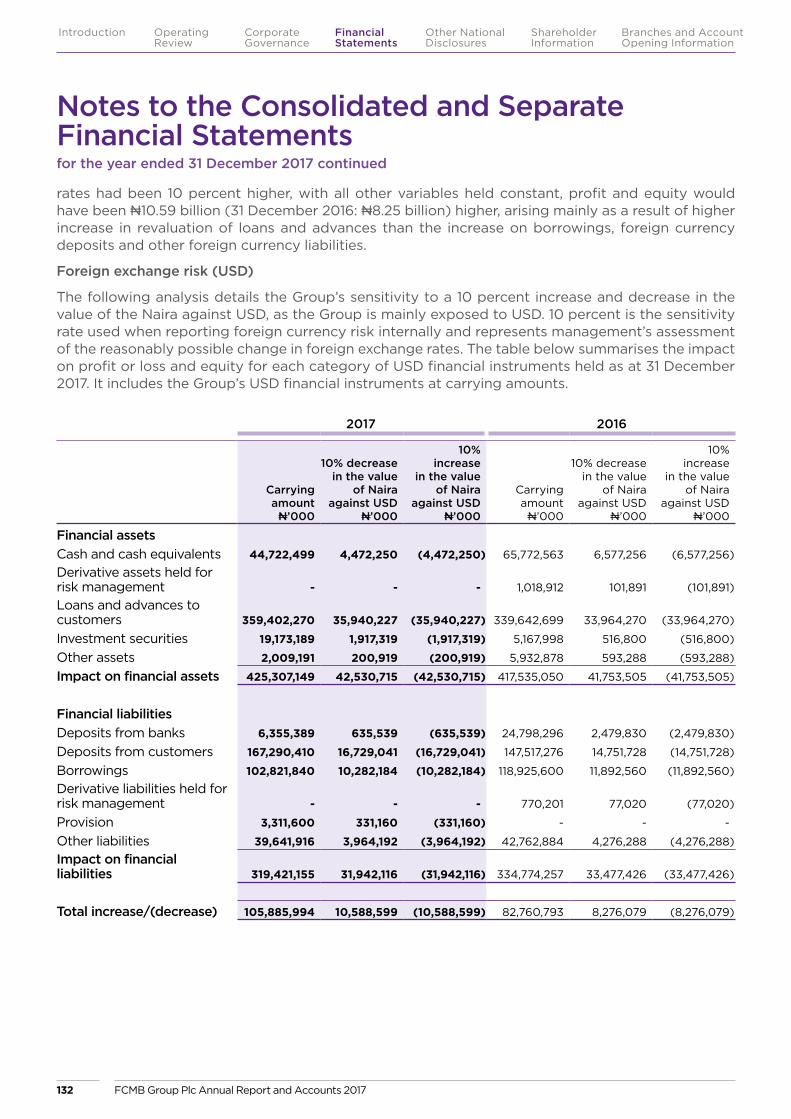
rates had been 10 percent higher, with all other variables held constant, profit and equity would have been N10.59 billion (31 December 2016: N8.25 billion) higher, arising mainly as a result of higher increase in revaluation of loans and advances than the increase on borrowings, foreign currency deposits and other foreign currency liabilities.
Foreign exchange risk (USD)
The following analysis details the Group’s sensitivity to a 10 percent increase and decrease in the value of the Naira against USD, as the Group is mainly exposed to USD. 10 percent is the sensitivity rate used when reporting foreign currency risk internally and represents management’s assessment of the reasonably possible change in foreign exchange rates. The table below summarises the impact on profit or loss and equity for each category of USD financial instruments held as at 31 December 2017. It includes the Group’s USD financial instruments at carrying amounts.
2017 2016
Carrying amount
N’000
10% decrease in the value
of Naira against USD
N’000
10% increase
in the value of Naira
against USD N’000
Carrying amount
N’000
10% decrease in the value
of Naira against USD
N’000
10% increase
in the value of Naira
against USD N’000
Financial assetsCash and cash equivalents 44,722,499 4,472,250 (4,472,250) 65,772,563 6,577,256 (6,577,256)
Derivative assets held for risk management - - - 1,018,912 101,891 (101,891)
Loans and advances to customers 359,402,270 35,940,227 (35,940,227) 339,642,699 33,964,270 (33,964,270)
Investment securities 19,173,189 1,917,319 (1,917,319) 5,167,998 516,800 (516,800)
Other assets 2,009,191 200,919 (200,919) 5,932,878 593,288 (593,288)
Impact on financial assets 425,307,149 42,530,715 (42,530,715) 417,535,050 41,753,505 (41,753,505)
Financial liabilitiesDeposits from banks 6,355,389 635,539 (635,539) 24,798,296 2,479,830 (2,479,830)
Deposits from customers 167,290,410 16,729,041 (16,729,041) 147,517,276 14,751,728 (14,751,728)
Borrowings 102,821,840 10,282,184 (10,282,184) 118,925,600 11,892,560 (11,892,560)
Derivative liabilities held for risk management - - - 770,201 77,020 (77,020)
Provision 3,311,600 331,160 (331,160) - - -
Other liabilities 39,641,916 3,964,192 (3,964,192) 42,762,884 4,276,288 (4,276,288)
Impact on financial liabilities 319,421,155 31,942,116 (31,942,116) 334,774,257 33,477,426 (33,477,426)
Total increase/(decrease) 105,885,994 10,588,599 (10,588,599) 82,760,793 8,276,079 (8,276,079)
Notes to the Consolidated and Separate Financial Statementsfor the year ended 31 December 2017 continued
FCMB Group Plc Annual Report and Accounts 2017132
Introduction Operating Review
Corporate Governance
Financial Statements
Shareholder Information
Other National Disclosures
Branches and Account Opening Information

Foreign exchange risk (GBP)
The following analysis details the Group’s sensitivity to a 10 percent increase and decrease in the value of the Naira against GBP, as the Group is exposed to GBP. 10 percent is the sensitivity rate used when reporting foreign currency risk internally and represents management’s assessment of the reasonably possible change in foreign exchange rates. The table below summarises the impact on profit or loss and equity for each category of GBP financial instruments held as at 31 December 2017. It includes the Group’s GBP financial instruments at carrying amounts.
2017 2016
Carrying amount
N’000
10% decrease in the value
of Naira against GDP
N’000
10% increase
in the value of Naira
against GDP N’000
Carrying amount
N’000
10% decrease in the value
of Naira against GDP
N’000
10% increase
in the value of Naira
against GDP N’000
Financial assetsCash and cash equivalents 6,585,295 658,530 (658,530) 1,550,136 155,014 (155,014)
Loans and advances to customers 40,751 4,075 (4,075) 755 76 (76)
Other assets 1,741,461 174,146 (174,146) 27,175 2,718 (2,718)
Impact on financial assets 8,367,507 836,751 (836,751) 1,578,066 157,808 (157,808)
Financial liabilitiesDeposits from customers 2,666,881 266,688 (266,688) 2,130,552 213,055 (213,055)
Other liabilities 616,127 61,613 (61,613) 449,528 44,953 (44,953)
Impact on financial liabilities 3,283,008 328,301 (328,301) 2,580,080 258,008 (258,008)
Total increase/(decrease) 5,084,499 508,450 (508,450) (1,002,014) (100,200) 100,200
FCMB Group Plc Annual Report and Accounts 2017 133
Introduction Operating Review
Corporate Governance
Financial Statements
Shareholder Information
Other National Disclosures
Branches and Account Opening Information
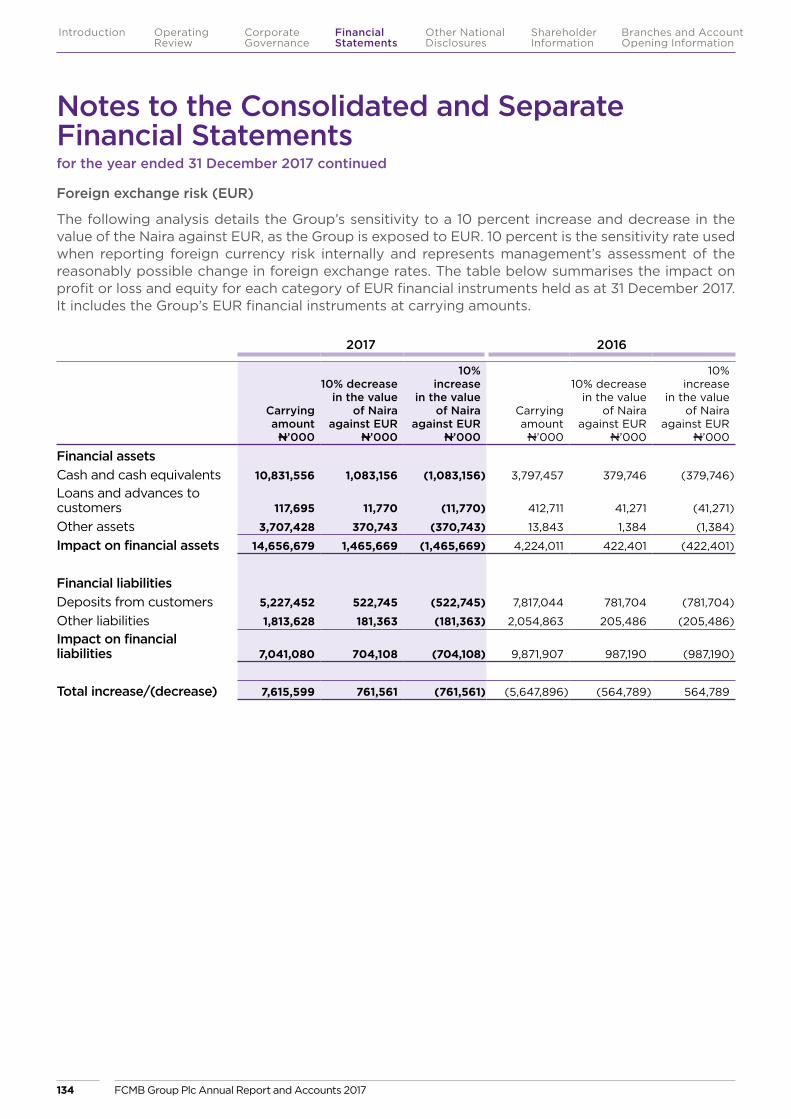
Foreign exchange risk (EUR)
The following analysis details the Group’s sensitivity to a 10 percent increase and decrease in the value of the Naira against EUR, as the Group is exposed to EUR. 10 percent is the sensitivity rate used when reporting foreign currency risk internally and represents management’s assessment of the reasonably possible change in foreign exchange rates. The table below summarises the impact on profit or loss and equity for each category of EUR financial instruments held as at 31 December 2017. It includes the Group’s EUR financial instruments at carrying amounts.
2017 2016
Carrying amount
N’000
10% decrease in the value
of Naira against EUR
N’000
10% increase
in the value of Naira
against EUR N’000
Carrying amount
N’000
10% decrease in the value
of Naira against EUR
N’000
10% increase
in the value of Naira
against EUR N’000
Financial assetsCash and cash equivalents 10,831,556 1,083,156 (1,083,156) 3,797,457 379,746 (379,746)
Loans and advances to customers 117,695 11,770 (11,770) 412,711 41,271 (41,271)
Other assets 3,707,428 370,743 (370,743) 13,843 1,384 (1,384)
Impact on financial assets 14,656,679 1,465,669 (1,465,669) 4,224,011 422,401 (422,401)
Financial liabilitiesDeposits from customers 5,227,452 522,745 (522,745) 7,817,044 781,704 (781,704)
Other liabilities 1,813,628 181,363 (181,363) 2,054,863 205,486 (205,486)
Impact on financial liabilities 7,041,080 704,108 (704,108) 9,871,907 987,190 (987,190)
Total increase/(decrease) 7,615,599 761,561 (761,561) (5,647,896) (564,789) 564,789
Notes to the Consolidated and Separate Financial Statementsfor the year ended 31 December 2017 continued
FCMB Group Plc Annual Report and Accounts 2017134
Introduction Operating Review
Corporate Governance
Financial Statements
Shareholder Information
Other National Disclosures
Branches and Account Opening Information
(e) Operational Risk Management
FCMB defines operational risk as the risk of loss resulting from inadequate or failed internal processes, people and systems or from external events. Our operational risk processes capture the following major types of losses/exposures:
� Fraud (internal and external).
� Fines, penalties or expenses incurred as a result of settlement delays and regulatory infractions.
� Losses arising from litigation processes including out-of-court settlements.
� Un-reconciled cash (teller, vault, ATM) shortages written-off in the course of the year.
� Losses incurred as a result of damages to the physical assets.
� Losses incurred as a result of disruption to business or system failure – system malfunction, downtime and/or disruption.
The Group’s appetite for operational risk losses is set by the Board Risk, Audit and Finance Committee on an annual basis and this sets the tone for operational risk management practices in the course of the year. The appetite is set in terms of the maximum amount of operational risk losses the Group expects to incur given risk-reward considerations for the year.
All business and process owners across the Group proactively identify weak-points/risks across their respective functions, activities, processes and systems using the Risk and Control Self-Assessment (RCSA). The Risk Management Division validates the risk maps for reasonability of assessments and completeness and recommends appropriate mitigating controls to reduce and eliminate inherent process risks. The Group conducts RCSA twice in a year but the risk register (outcome of the RCSA) is regularly updated, triggered by change(s) to processes, activities, systems or other reasons such as introduction of new product/service or the occurrence of risk events.
The completed RCSAs are further subjected to analysis by the Risk Management Division in order to understand the major vulnerabilities in
the Group and their root causes. The outcome of such assessments, apart from being escalated to Executive Management and Board, are useful for improving the control environment. They are a risk-based form of addressing major issues that cut across most functions in the Group, thereby increasing effectiveness and efficiency of resolution.
The Group also conducts risk assessment for all new products and services including any major changes to existing products, services and processes.
Operational risk indicators are used to track and measure as well as monitor operational risk exposures across all activities, processes and systems. Key Risk indicators (KRIs) are defined for significant risks that require active monitoring and control. This process enables us to identify and resolve control issues before they crystallise into losses or minimise losses and other damages. Tolerance levels are set for each risk indicator and used as the basis for reporting risk exposures to the respective risk committees including departmental/divisional Operational Risk Committees and the Board Risk, Audit and Finance Committee (BRAFC).
Operational risk losses are periodically collated and analysed by the Risk Management Division. The analysed loss experience enables the Group to determine causal factors and put in place new controls and processes to mitigate the risk of re-occurrence. In addition, the loss collation and analysis process provides the Group with the basis for justifying the cost of new and improved controls and assessing their effectiveness.
The Group’s loss experience is escalated to the Board Risk, Audit and Finance Committee supported by clearly defined remedial action plans to correct the root causes leading to the losses. Periodic operational risk meetings are held across the Group to boost risk awareness and entrench risk management culture in the Group. This meeting also affords risk owners to better appreciate control gaps and required remedial actions.
Operational risk management processes have been linked to performance management through
FCMB Group Plc Annual Report and Accounts 2017 135
Introduction Operating Review
Corporate Governance
Financial Statements
Shareholder Information
Other National Disclosures
Branches and Account Opening Information
the use of a Risk and Control Index that represents a key component of employee performance appraisals. This initiative has helped to drive the desired behaviour in employees, ensuring that there is a concerted effort by all employees to manage operational risks across the Group.
Independent assurance of the adequacy and effectiveness of the operational risk management process is provided by the Group Internal Audit (GIA) function on an annual basis. The assessment report is presented to the Board Risk, Audit and Finance Committee as part of the annual review process.
The Group uses a combination of provision and insurance to mitigate residual risks arising from operational risk events. A number of insurance policies have been undertaken by the Group to minimise the loss in the event of an operational risk incident while provision is also made for expected operational risk losses in order to minimise major variations in the financial performance of the Group.
Capital is reserved for unexpected operational risks losses based on Basel II Basic Indicator Approach as advised by the Central Bank of Nigeria. Existing operational risk practices will enable the Group to adopt the more advanced approaches in the near future – the standardised approach and advanced measurement approach (AMA).
The implemented operational risk management structures provide the Group with the capacity to continuously improve its processes and controls, thereby minimising losses and protecting shareholder value.
Operational risk loss experience
The Group continues to manage its various operational risk exposures in order to be within the Board approved risk appetite. It also ensures that all operational risk losses are recognised immediately in the financial period.
In line with the provisions of the Basel II Accord, operational risk within credit and market risks shall be duly recognised for effective management and accountability. However, for capital computation purposes, operational risk within credit risk shall be measured under credit
risk while those captured under market risk will be measured under operational risk (Basel II Accord, paragraph 673).
Existing controls have been strengthened to address the identified lapses and the Group continues to collaborate with other stakeholders including regulators to curb the spate of fraud and virtual banking operational risk exposures, which have understandably grown in recent time across the industry because of increased automation and migration of customers to alternate channels.
In response to observed trend and emerging risks, the Group took the following measures to curb the spate of operational risk events:
� All day (24/7) functional fraud monitoring team continues.
� Implementation of a fraud monitoring solution to detect fraudulent card related transactions.
� Implementation of an automated fraud alert system that monitors suspicious inflow (transactions from other banks) and outflow transactions from various e-channel platforms based on fraud trends.
� Monthly fraud awareness tips sent to customers and periodic fraud awareness training for staff.
� Proactive implementation of fraud prevention rules based on global and local fraud trends and in line with the Group’s risk appetite.
� Activities around the major areas of vulnerabilities have been reviewed in order to strengthen the controls in these areas.
� A second level authentication is being extended to critical internal and alternate channel applications.
Information security management is getting increased attention in the Group. The information security office (ISO) has been set-up within Risk Management to improve security monitoring and incident response. Also, the Group has developed a Cyber Security Strategy cum Road Map. Implementation of the developed strategy has just commenced and this is estimated to be completed in eighteen months within which
Notes to the Consolidated and Separate Financial Statementsfor the year ended 31 December 2017 continued
FCMB Group Plc Annual Report and Accounts 2017136
Introduction Operating Review
Corporate Governance
Financial Statements
Shareholder Information
Other National Disclosures
Branches and Account Opening Information
the Group is expected to graduate increasingly to a higher levels of maturity within the implementation period.
Operational Risk Management function in FCMB extends to the management of reputational and strategic risks.
Strategic risk: the risk of incurring an economic loss as a result of adverse impact of internal and external factors on the Group’s earnings and/or ability to achieve its strategic objectives. It is the current or prospective risk to earnings and capital arising from adverse business decisions, improper implementation of decisions or lack of responsiveness to changes in the business environment. It is also the risk associated with future business plans and strategies, including plans for entering new business lines, expanding existing services and enhancing infrastructure.
The Group is exposed to strategic risks in its business planning activities and strategic execution risk in all key operations impacted by the Group’s strategy. The crystallisation of this risk could occur as a result of wrong strategic/ business decisions (e.g. poorly planned and executed decisions regarding mergers, divestures, acquisitions, etc.), inadequate corporate strategy, improper analysis that can impact the implementation of key decisions, inability to respond promptly to business opportunities, lack of responsiveness to industry changes, improper communication of the Group’s strategic objectives, inability to recruit personnel with skills and experience required to execute strategy and lack of complete and accurate information. These could all directly or indirectly erode the Group’s earnings.
FCMB addresses strategic risk through its strategic risk management framework, providing guidance for the management of the Group’s strategic risks. It describes the processes, systems and controls established by the Group to identify, assess, monitor, control and report strategic risk. The Group also has a three year rolling corporate strategy plan, which is reviewed annually and closely monitored to ensure that strategic plans are properly aligned with the Group’s operating
model. The Group scans the environment for any economic, regulatory, legal and political changes that might affect its strategy.
Reputational risk: the potential loss due to damage or erosion of goodwill as a result of failed risk management, weak corporate governance practices, environmental, social and ethical performance, poor customer relationship management practices, non-compliance with regulatory and statutory requirements, weak financial performance or any other factor that affects stakeholder perceptions of the Group.
Reputational risks to the Group could crystallise as a result of operating in a highly regulated environment with significant vulnerability to regulatory actions that may adversely impact the Group’s reputation. FCMB recognizes the following as its sources of reputational risk among others:
� Poor corporate governance: conflict of interest, executive compensation, influence on Board members, insider related lending.
� Compliance breaches: violation of regulations and laws, aiding/abetting illegal activities, tax structures or fraud, fraudulent disclosures.
� Poor employee relations: discrimination/harassment, poor employment conditions and welfare.
� Poor financial performance: missed projection and earnings surprise, significant earnings volatility, financial irregularities issues.
� Social, environmental and ethical issues: bribes/kick-backs, facilitating corruption, community/environmental neglect.
� Control failures: significant operational risk failures.
� Communications/crisis management: adverse stakeholder relations (media, investors, regulators, customers, trade unions, etc.).
� Poor customer relationship management: mis-selling, unfair/deceptive practices (e.g. high pricing, hidden transaction costs, illegal charges, over-charging, etc.), mishandling of complaints, privacy/confidentiality breaches.
FCMB Group Plc Annual Report and Accounts 2017 137
Introduction Operating Review
Corporate Governance
Financial Statements
Shareholder Information
Other National Disclosures
Branches and Account Opening Information
Reputational risk can materialise as a result of adverse opinions of stakeholders, operating losses, litigation, sanctions or fines imposed by regulators, failure of directors, management and staff to adhere to ethical code of conduct, failure to deliver quality service to customers, failure to address issues of public concern, labour unrest and failure to adhere to good employment practices. Consequently, the Group could suffer loss due to decline in customer base and loss of market share as well as deterioration of brand value.
The reputational risk management framework outlines how reputation risk is to be identified, assessed, mitigated and monitored. The Business and Operational Risk Management department monitors the major drivers of this risk. The Group also has formal policies (whistle blower policies, confidentiality policies, performance management framework and policies, code of business ethics, service delivery model, CRM Strategy/Service Charter, etc.) and procedures to control exposure to its recognised reputational risk drivers. In addition, the Group has developed a self-assessment process to mitigate identified reputational loss events. Events in relation to customer query are tracked to ensure they are treated within the established service level agreement and issues are escalated where necessary. The Group consciously seeks to understand stakeholders’ expectations and perception by conducting survey, which it uses to design and execute appropriate management responses.
Operational risk awareness
The Group intensified its operational risk awareness campaign in the course of the year through several mechanisms including electronic newsletters, risk meetings and workshops, continuous training and education of staff and customers. This is to embed risk management across the entire organisation and significantly improve the risk management culture and buy-in amongst all employees.
Group operational risk practices
The subsidiary companies continue to improve on their operational risk management activities
and reporting, thereby enhancing the enterprise risk management practices in the Group.
(f) Capital Management
The Central Bank of Nigeria requires each Bank with international authorisation to hold minimum regulatory capital of N50 billion and maintain a capital adequacy ratio (total regulatory capital to risk weighted assets) of 15%. Capital adequacy ratio (CAR) is a measure of the ratio of capital to risk weighted assets (RWA).
The Risk Management Committee (RMC) has the delegated mandate of ensuring that capital levels (capital adequacy ratio) remain adequate and appropriate for the level of risks undertaken in the normal course of business. The committee is responsible for implementing the capital strategy of the Group, which includes:
� Ensuring the Group fully complies with minimum regulatory capital adequacy requirements and remains a going concern.
� Ensuring the Group is adequately capitalized – that the Group has enough capital to support its level of risk exposures.
� Ensuring disciplined and selective asset growth (based on desired obligor risk profile).
� Maintaining expected losses (EL) within defined limits as a direct consequence of selective and disciplined asset growth.
� Ensuring risks taken by the respective business lines are within approved limits and allocated capital.
� Ensuring business lines generate adequate risk adjusted returns on allocated capital.
� Driving business unit and overall Group performance through the application of economic capital budgeting.
The Group’s regulatory capital can be segmented into 2 tiers:
� Tier 1 capital includes share capital, retained earnings and reserves created by appropriations to earnings. Book value of goodwill (where applicable) is deducted in arriving at Tier 1 capital. Deferred tax and regulatory risk
Notes to the Consolidated and Separate Financial Statementsfor the year ended 31 December 2017 continued
FCMB Group Plc Annual Report and Accounts 2017138
Introduction Operating Review
Corporate Governance
Financial Statements
Shareholder Information
Other National Disclosures
Branches and Account Opening Information
reserve (RRR) are also deducted from capital but the RRR is recognised as a balance sheet item (exposures are risk-weighted net of the provisions in the RRR).
� Tier 2 capital includes preference shares, minority interests arising on consolidation, qualifying debt stock, fixed assets revaluation reserves, foreign currency revaluation reserves, general provisions subject to a maximum of 1.25% of risk assets, and hybrid instruments – convertible bonds debt security qualifies for the tier 2 capital having met the conditions specified by CBN.
As directed by the CBN, the banking subsidiary adopts the following approaches for the computation of capital adequacy ratio under Pillar 1:
� Standardised approach for credit risk
� Standardised approach for market risk and
� Basic indicator approach for operational risk
In line with the CBN guideline for the standardised approach, the risk weighted assets (RWA) for credit risks are derived using the CBN specified risk weights (RW) for the different asset classes.
The banking subsidiary also complies with the Pillar 2 requirement, which requires it to do an assessment of internal capital required to cover all material risk exposures, including the credit, market and operational risks addressed under Pillar 1. This process known as Internal Capital Adequacy Assessment Process (ICAAP) was completed for the 2016 financial year and submitted to the Central Bank of Nigeria (CBN) by April, 2017. The ICAAP reveals that the Bank has sufficient capital under normal business conditions but would require additional capital under severe stress testing scenarios, triggered by events leading to significant non-performing loans and resultant provisioning. Apart from the possibility of having savings from the operating expenses and the raising of additional tier 1 capital, the Bank will continue to intensify effort in the following areas:
� Proactive loan monitoring and portfolio review of risk assets.
� Proactive identification of loans showing signs of defaults to put them on remedial management.
� Intense recovery of bad loans.
� Implementation of the Bank’s portfolio plan, including gradual deleveraging and diversification of the loan book.
� Implementation of the Bank’s revised lending framework and risk acceptance criteria (RAC).
� Investment of funds in safer, alternative earning assets.
� Optimise capital – risk adjusted pricing and return on capital/performance management.
� Investment in product innovation.
� Delivery of quality and superior service to customers. This will improve patronage and referral.
� Optimisation of alternate channel opportunities.
� Expansion of payment and settlement opportunities in transaction banking.
� Cost management – optimal staffing and management of capital expenditure.
� Control and monitoring of cost to income ratio.
� Growing of stable low cost deposits.
� Continuous tracking and trapping of retail banking opportunities with corporate customers.
Internal capital adequacy assessment process (ICAAP)
The Banking subsidiary observes the following procedures in the internal capital adequacy assessment process (ICAAP): (i) Computation of capital adequacy ratio (CAR)
and capital requirement under Pillar 1.(ii) Material risk identification and assessment
(MRIA) process.(iii) Stress testing and scenario analysis.(iv) Internal capital assessment.(v) ICAAP review and approval.
FCMB Group Plc Annual Report and Accounts 2017 139
Introduction Operating Review
Corporate Governance
Financial Statements
Shareholder Information
Other National Disclosures
Branches and Account Opening Information

(i) Computation of capital adequacy ratio (CAR) and capital requirement under Pillar 1
The banking subsidiary computed the capital adequacy ratio and capital requirement to cover Pillar 1 risks using the following methodologies:
� Credit risk – standardised approach;
� Market risk – standardised approach;
� Operational risk – basic indicator approach.
(ii) Material risk identification and assessment (MRIA) process
One of the key purposes of the ICAAP is to embed the principles of risk and capital management in the banking subsidiary’s business activities. The MRIA process identifies the key risk exposures of the Bank, determines management’s assessment of the residual risk exposures and the corresponding capital requirements. The steps below are essential to completing this risk assessment.
Risk identification
A catalogue of material risks relevant to the banking subsidiary are identified through a combination of the following activities:
(a) Review of the banking subsidiary’s operating environment – a forward and backward looking analysis of the Banking subsidiary’s operating environment and business activities was conducted in order to identify various threats in the business and operating environment, including regulatory changes and implication on the business;
(b) Identification of the sources of risk through a review of the products, services, business areas and activities that could generate the risks within the banking subsidiary;
(c) Review of available data from the business, risk and internal audit functions to assist with the material risk identification assessment (MRIA) process. The following are examples of some key data considered in completing the MRIA:– Most recent risk and control self-assessment
(RCSA) results;
– Near misses, incidents and frauds reports;– Internal audit findings.
(d) Material risk assessment workshop: a material risk identification and assessment (MRIA) workshop was conducted to identify and assess the major risk exposures of the Bank – other than credit, market and operational risks. The workshop included key stakeholders representing the major functions and departments of the banking subsidiary (for enterprise risk management) or the related business units (for specific/functional risk management). This workshop leveraged on different experiences and perspectives of the participants in the risk identification and assessment process. To ensure its effectiveness, the following guidelines were followed:– The number of attendees was diverse but
restricted;– All relevant business process expertise and
experience was represented;– Sufficient time was allowed for the
deliberation;– The workshop started with an introduction
by Risk Management on ICAAP and highlight of the purpose of the workshop;
– People were encouraged to express identified threats in their own words. This is to ensure they are not constrained to any risk management jargon and therefore limited in their expression.
The risks identified were reviewed and assessed at the workshop to determine the residual risk and capital requirement.
Risk assessment
The activities carried out are as follows:
(a) An assessment of the identified risks is conducted considering existing documentation, experience and expert judgement;
(b) The inherent likelihood of occurrence and impact of the risk is determined;
(c) The controls designed to mitigate the risks are reviewed in order to determine the residual risk exposure of the bank.
Notes to the Consolidated and Separate Financial Statementsfor the year ended 31 December 2017 continued
FCMB Group Plc Annual Report and Accounts 2017140
Introduction Operating Review
Corporate Governance
Financial Statements
Shareholder Information
Other National Disclosures
Branches and Account Opening Information

Although coordinated by Risk Management, the initial assessment above is done in conjunction with key stakeholders across the business, before a more elaborate workshop is held with management and key business and process owners. The risk assessment for the material risks culminated in the computation of capital for each risk exposure with the methodology also presented and validated at the workshop.
Usually, more than one material risk assessment workshop is held in order to complete and finalise review of the risk exposures, data and methodology used for the computation. This also becomes necessary in order to determine and agree the action plans to address observed lapses and gaps. The ICAAP documentation for the MRIA include:
� Definition and sources of the risk;
� Manifestation of the risk and how it could impact the banking subsidiary;
� Current mitigation techniques of the risks; and
� Capital required for the residual risk exposure.
The ICAAP is also forward looking, ensuring that the capital plan considers the banking subsidiary’s strategic business plan and stress scenarios.
(iii) Stress testing and scenario analysis
Extreme but plausible scenario was run on the business projections and related total capital (ICAAP) required under normal condition in order to compute the capital required under stress condition and determine the need for any additional capital. This exercise was conducted by a group of people across the Bank to ensure that they were relevant and robust enough.
We ensured that:
� The assumptions about the level of adverse shock scenarios and their duration were severe but plausible.
� The model used was risk sensitive to view the outcome based on changes to the different parameters or risk factors.
� The exercise was conducted on the base case projections to assess the adequacy of FCMB’s capital levels, capital buffer and capital ratios. The stress testing exercise determines the potential volatility of capital requirements with respect to the five year financial projections. The base case capital projections and stressed capital can vary based on changes to key assumptions or risk factors. The conservative approach has been adopted to ensure that the outcome of the exercise is reasonable and representative of a likely outcome in a stressed condition/situation.
The following sensitivities were considered before coming up with a plausible scenario and the macro- economic stress, which considers some of them:
� Reduction in net interest margin
� Increased operational costs
� Increased credit losses
� Sector concentration risk
� Liquidity stress.
(iv) Assessment of internal capital
The banking subsidiary’s internal capital (which is the capital required to cover material risk exposures) as determined by the internal capital adequacy assessment process (ICAAP) was compared to the capital available under normal and stressed condition to determine the capital planning buffer (CPB) required by the bank and the amount of shortfall to be provided.
(v) ICAAP review and approval
Although the Executive Management of the banking subsidiary and other key stakeholders play key role in the preparation of the Bank’s ICAAP, the Board of Directors (BOD) has overall responsibility for the ICAAP. Therefore, it is involved in the review of the ICAAP and the final approval of the document lies with it. Subsequent to the final review and approval of the Board of Directors, the ICAAP document is forwarded to the Central Bank of Nigeria (CBN), preparatory to its supervisory review and evaluation process (SREP).
FCMB Group Plc Annual Report and Accounts 2017 141
Introduction Operating Review
Corporate Governance
Financial Statements
Shareholder Information
Other National Disclosures
Branches and Account Opening Information
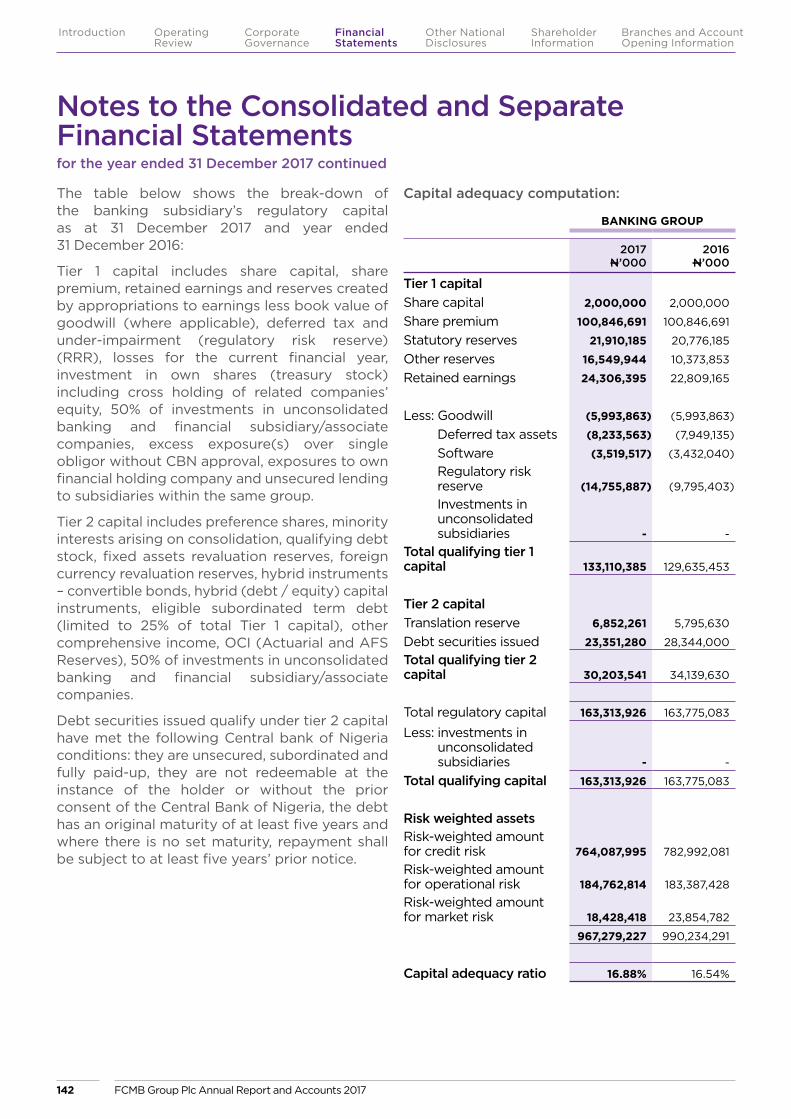
The table below shows the break-down of the banking subsidiary’s regulatory capital as at 31 December 2017 and year ended 31 December 2016:
Tier 1 capital includes share capital, share premium, retained earnings and reserves created by appropriations to earnings less book value of goodwill (where applicable), deferred tax and under-impairment (regulatory risk reserve) (RRR), losses for the current financial year, investment in own shares (treasury stock) including cross holding of related companies’ equity, 50% of investments in unconsolidated banking and financial subsidiary/associate companies, excess exposure(s) over single obligor without CBN approval, exposures to own financial holding company and unsecured lending to subsidiaries within the same group.
Tier 2 capital includes preference shares, minority interests arising on consolidation, qualifying debt stock, fixed assets revaluation reserves, foreign currency revaluation reserves, hybrid instruments – convertible bonds, hybrid (debt / equity) capital instruments, eligible subordinated term debt (limited to 25% of total Tier 1 capital), other comprehensive income, OCI (Actuarial and AFS Reserves), 50% of investments in unconsolidated banking and financial subsidiary/associate companies.
Debt securities issued qualify under tier 2 capital have met the following Central bank of Nigeria conditions: they are unsecured, subordinated and fully paid-up, they are not redeemable at the instance of the holder or without the prior consent of the Central Bank of Nigeria, the debt has an original maturity of at least five years and where there is no set maturity, repayment shall be subject to at least five years’ prior notice.
Capital adequacy computation:
BANKING GROUP
2017N’000
2016N’000
Tier 1 capitalShare capital 2,000,000 2,000,000
Share premium 100,846,691 100,846,691
Statutory reserves 21,910,185 20,776,185
Other reserves 16,549,944 10,373,853
Retained earnings 24,306,395 22,809,165
Less: Goodwill (5,993,863) (5,993,863)
Deferred tax assets (8,233,563) (7,949,135)
Software (3,519,517) (3,432,040)
Regulatory risk reserve (14,755,887) (9,795,403)
Investments in unconsolidated subsidiaries - -
Total qualifying tier 1 capital 133,110,385 129,635,453
Tier 2 capitalTranslation reserve 6,852,261 5,795,630
Debt securities issued 23,351,280 28,344,000
Total qualifying tier 2 capital 30,203,541 34,139,630
Total regulatory capital 163,313,926 163,775,083
Less: investments in unconsolidated subsidiaries - -
Total qualifying capital 163,313,926 163,775,083
Risk weighted assetsRisk-weighted amount for credit risk 764,087,995 782,992,081
Risk-weighted amount for operational risk 184,762,814 183,387,428
Risk-weighted amount for market risk 18,428,418 23,854,782
967,279,227 990,234,291
Capital adequacy ratio 16.88% 16.54%
Notes to the Consolidated and Separate Financial Statementsfor the year ended 31 December 2017 continued
FCMB Group Plc Annual Report and Accounts 2017142
Introduction Operating Review
Corporate Governance
Financial Statements
Shareholder Information
Other National Disclosures
Branches and Account Opening Information
Note on capital adequacy ratio
The Basel II capital adequacy ratio was 16.88% for the banking group as at 31 December 2017 (31 December 2016: 16.54%), being above the CBN minimum capital adequacy requirements of 15%.
The banking group successfully completed its internal capital adequacy assessment process (ICAAP) project in order to ensure that all material risk exposures are adequately covered by capital and improve the capital management practices in the Banking Subsidiary. The result of the first ICAAP exercise has started yielding fruits, with key capital optimisation initiatives being implemented to ensure efficient use of capital and desired risk adjusted returns.
4 Use of Estimates and Judgements
The preparation of the consolidated and separate financial statements in conformity with IFRS requires management to make judgments, estimates and assumptions that affect the application of accounting policies and the reported amounts of assets, liabilities, income and expenses. Actual results may differ from these estimates.
Estimates and underlying assumptions are reviewed on an ongoing basis. Revisions to accounting estimates are recognised in the period in which the estimates are revised and in any future periods affected.
Management discusses with the Group Audit Committee the development, selection and disclosure of the Group’s critical accounting policies and their application and assumptions made relating to major estimation uncertainties. Information about assumptions and estimation uncertainties that have a significant risk of resulting in a material adjustment within the next financial year and about critical judgements in applying accounting policies that have the most significant effect on the amounts recognised in the consolidated and separate financial statements is disclosed below.
These disclosures supplement the commentary on financial risk management (see note 3).
Key sources of estimation uncertainty
(a) Impairment
Financial assets accounted for at amortised cost are evaluated for impairment on a basis described in the Group’s accounting policy.
The specific component of the total allowances for impairment applies to financial assets evaluated individually for impairment and is based upon management’s best estimate of the present value of the cash flows that are expected to be received. In estimating these cash flows, management makes judgements about a debtor’s financial situation and the net realisable value of any underlying collateral. Each impaired assets is assessed on its merits, and the workout strategy and estimate of cash flows considered recoverable are independently approved by the Credit Risk functions.
A collective component of the total allowance is established for:
� groups of homogeneous loans that are not considered individually significant; and
� groups of assets that are individually significant but that were not found to be individually impaired (IBNR).
Collective allowance for groups of homogeneous loans is established using statistical methods such as roll rate methodology or, for small portfolios with insufficient information, a formula approach based on historic loss rate experience. The roll rate methodology uses statistical analysis of historical data on delinquency to estimate the amount of loss. The estimate of loss arrived at on the basis of historical information is then reviewed to ensure that it appropriately reflects the economic conditions and product mix at the reporting date. Roll rates and loss rates are regularly benchmarked against actual loss experience.
Collective allowance for groups of assets that are individually significant but that were not found to be individually impaired (IBNR) cover credit losses inherent in portfolios of loans and advances, and held-to-maturity investment securities with similar credit risk characteristics
FCMB Group Plc Annual Report and Accounts 2017 143
Introduction Operating Review
Corporate Governance
Financial Statements
Shareholder Information
Other National Disclosures
Branches and Account Opening Information
when there is objective evidence to suggest that they contain impaired loans and advances, and held-to-maturity investment securities, but the individual impaired items cannot yet be identified. In assessing the need for collective loss allowances, management considers factors such as credit quality, portfolio size, concentrations and economic factors. In order to estimate the required allowance, assumptions are made to define the way inherent losses are modelled and to determine the required input parameters, based on historical experience and current economic conditions. The accuracy of the allowances depends on the estimates of future cash flows for specific counterparty allowances and the model assumptions and parameters used in determining collective allowances.
Investments in equity securities classified as available for sale were evaluated for impairment in line with the requirement of IFRS. For an investment in an equity security, a significant or prolonged decline in its fair value below its cost is objective evidence of impairment. In this respect, the Group regards a decline in fair value in excess of 20 percent to be significant and a decline in a quoted market price that persisted for 9 months or longer to be prolonged.
An assessment as to whether an investment in debt securities is impaired may be complex. In making such an assessment, the Group considers the following factors:
� The market’s assessment of credit worthiness as reflected in the bond yields.
� The rating agencies’ assessments of the credit worthiness.
� The ability of the country to access the capital markets for new debt issuance.
� The probability of debt being restructured resulting in holders suffering losses through voluntary or mandatory debt forgiveness.
(b) Fair Value
The determination of fair value for financial assets and financial liabilities for which there is no observable market price requires the use of valuation techniques as described in the Group’s
accounting policy. For financial instruments that trade infrequently and have little price transparency, fair value is less objective, and requires varying degrees of judgment depending on liquidity, concentration, uncertainty of market factors, pricing assumptions and other risks affecting the specific instrument.
The Group measures fair values using the following fair value hierarchy that reflects the significance of the inputs used in making the requirements:
� Level 1: Quoted market price in an active market for an identical instrument.
� Level 2: Valuation techniques based on observable inputs. This category includes instruments valued using: quoted market prices in active markets for similar instruments; quoted prices for similar instruments in markets that are considered less than active; or other valuation techniques where all significant inputs are directly or indirectly observable from market data.
� Level 3: Valuation techniques using significant unobservable inputs. This category includes all instruments where the valuation technique includes inputs not based on observable data and the unobservable inputs have a significant effect on the instruments valuation. This category includes instruments that are valued based on quoted prices for similar instruments where significant unobservable adjustments or assumptions are required to reflect differences between the instruments.
Fair values of financial assets and financial liabilities that are traded in active markets are based on quoted market prices or dealer price quotations. For all other financial instruments the Group determines fair value using valuation techniques.
Valuation techniques include net present value and discounted cash flow models, comparison to similar instruments for which market observable prices exist, Black-Scholes and polynomial option pricing models and other valuation models. Assumptions and inputs used in valuation techniques include risk-free and benchmark interest rates, credit spreads and other premia
Notes to the Consolidated and Separate Financial Statementsfor the year ended 31 December 2017 continued
FCMB Group Plc Annual Report and Accounts 2017144
Introduction Operating Review
Corporate Governance
Financial Statements
Shareholder Information
Other National Disclosures
Branches and Account Opening Information

GROUP
31 December 2017 Note Level 1 N’000
Level 2 N’000
Level 3 N’000
Total N’000
ASSETSTrading assets 22(a) 23,936,031 - - 23,936,031
Assets pledged as collateral 26 61,330,157 - - 61,330,157
Investment securities 25(b)(c) 83,416,686 - - 83,416,686
168,682,874 - - 168,682,874
LIABILITIESTrading liabilities 22(b) 21,616,660 - - 21,616,660
21,616,660 - - 21,616,660
used in estimating discount rates, bond and equity prices, foreign currency exchange rates, equity and equity index prices and expected price volatilities and correlations. The objective of valuation techniques is to arrive at a fair value determination that reflects the price of the financial instrument at the reporting date, that would have been determined by market participants acting at arms length.
The Group uses widely recognized valuation models for determining the fair value of common and more simple financial instruments, like interest rate and currency swaps that use only observable market data and require little management judgment and estimation. Observable prices and model inputs are usually available in the market for listed debt and equity securities exchange traded derivatives and simple over the counter derivatives like interest swaps. Availability of observable market prices and model inputs reduces the need for management judgment and estimation and also reduces the uncertainty associated with determination of fair values. Availability of observable market prices and inputs varies depending on the products and markets and is prone to changes based on specific events and general conditions in the financial markets.
For more complex instruments, the Group uses proprietary valuation models, which are usually developed from recognized valuation models. Some or all of the significant inputs into these models may not be observable in the market and are derived from market prices or rates or are estimated based on assumptions. Example of instruments involving significant unobservable inputs include certain over the counter structured derivatives, certain loans and security for which there is no active market and retained interests in securitizations. Valuation models that employ significant unobservable inputs require a higher degree of management judgment and estimation in the determination of fair value. Management judgment and estimation are usually required for selection of the appropriate valuation model to be used, determination of expected future cash flows on the financial instrument being valued, determination of probability of counterparty default and prepayments and selection of appropriate discount rates.
Financial Instruments measured at fair value
The table below analyses financial instruments measured at fair value at the end of the reporting period, by the level in the fair value hierarchy into which the fair value measurement is categorised:
FCMB Group Plc Annual Report and Accounts 2017 145
Introduction Operating Review
Corporate Governance
Financial Statements
Shareholder Information
Other National Disclosures
Branches and Account Opening Information

31 December 2016 Note Level 1 N’000
Level 2 N’000
Level 3 N’000
Total N’000
ASSETSTrading assets 22(a) 9,154,198 - - 9,154,198
Derivative assets held for risk management 23 - 1,018,912 - 1,018,912
Assets pledged as collateral 26 5,760,773 - - 5,760,773
Investment securities 25(b) (c) 44,482,386 - - 44,482,386
59,397,357 1,018,912 - 60,416,269
LIABILITIESTrading liabilities 22(b) 6,255,933 - - 6,255,933
Derivative liabilities held for risk management 23 - 770,201 - 770,201
6,255,933 770,201 - 7,026,134
There were no instruments measured at level 3 of the fair value hierarchy and as such no table to show a reconciliation from the beginning balance to the ending balances for fair value measurements in level 3 of the fair value hierarchy.
Financial instruments not measured at fair value
The table below sets out the fair value of financial instruments not measured at fair value and analyses them by level in the fair value hierarchy into which each fair value measurement is categorised.
GROUP
31 December 2017 Note Level 1 N’000
Level 2 N’000
Level 3 N’000
Total fair value
N’000
Total carrying amount
N’000
ASSETSCash and cash equivalents 20 - 103,888,007 - 103,888,007 103,888,007
Restricted reserve deposits 21 - 109,638,559 - 109,638,559 109,638,559 Loans and advances to customers 24 - 642,925,828 - 642,925,828 649,796,726
Assets pledged as collateral 26 - 76,778,955 - 76,778,955 58,888,057
Investment securities 25(a)(d) - 77,690,362 - 77,690,362 75,424,801
Other financial assets 32(a)(c) - 22,344,109 - 22,344,109 22,344,109
LIABILITIESDeposits from banks 33 - 6,355,389 - 6,355,389 6,355,389
Deposits from customers 34 - 669,845,963 - 669,845,963 689,860,640
Borrowings 35 - 121,970,195 - 121,970,195 109,434,970
On-lending facilities 36 - 59,980,946 - 59,980,946 42,534,316
Debt securities issued 37 - 61,920,982 - 61,920,982 54,691,520
Other financial liabilities 40(a) - 61,148,432 - 61,148,432 61,148,432
Notes to the Consolidated and Separate Financial Statementsfor the year ended 31 December 2017 continued
FCMB Group Plc Annual Report and Accounts 2017146
Introduction Operating Review
Corporate Governance
Financial Statements
Shareholder Information
Other National Disclosures
Branches and Account Opening Information
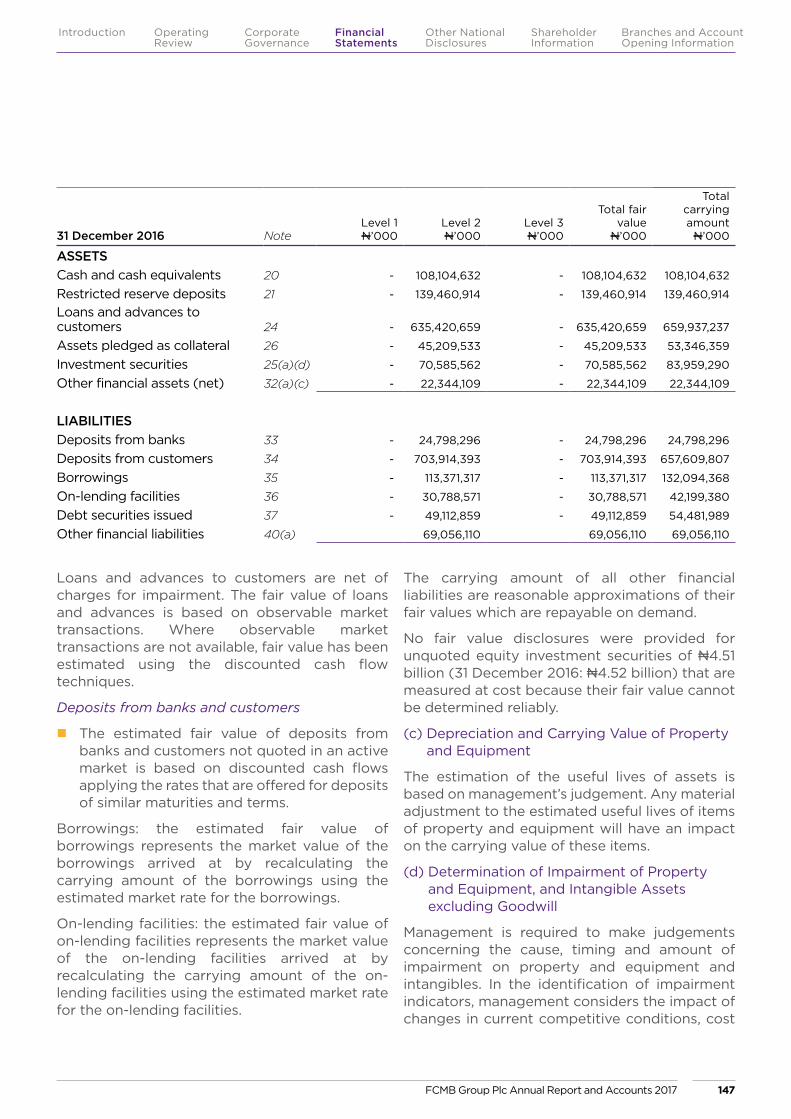
Loans and advances to customers are net of charges for impairment. The fair value of loans and advances is based on observable market transactions. Where observable market transactions are not available, fair value has been estimated using the discounted cash flow techniques.
Deposits from banks and customers
� The estimated fair value of deposits from banks and customers not quoted in an active market is based on discounted cash flows applying the rates that are offered for deposits of similar maturities and terms.
Borrowings: the estimated fair value of borrowings represents the market value of the borrowings arrived at by recalculating the carrying amount of the borrowings using the estimated market rate for the borrowings.
On-lending facilities: the estimated fair value of on-lending facilities represents the market value of the on-lending facilities arrived at by recalculating the carrying amount of the on-lending facilities using the estimated market rate for the on-lending facilities.
The carrying amount of all other financial liabilities are reasonable approximations of their fair values which are repayable on demand.
No fair value disclosures were provided for unquoted equity investment securities of N4.51 billion (31 December 2016: N4.52 billion) that are measured at cost because their fair value cannot be determined reliably.
(c) Depreciation and Carrying Value of Property and Equipment
The estimation of the useful lives of assets is based on management’s judgement. Any material adjustment to the estimated useful lives of items of property and equipment will have an impact on the carrying value of these items.
(d) Determination of Impairment of Property and Equipment, and Intangible Assets excluding Goodwill
Management is required to make judgements concerning the cause, timing and amount of impairment on property and equipment and intangibles. In the identification of impairment indicators, management considers the impact of changes in current competitive conditions, cost
31 December 2016 Note Level 1 N’000
Level 2 N’000
Level 3 N’000
Total fair value
N’000
Total carrying amount
N’000
ASSETSCash and cash equivalents 20 - 108,104,632 - 108,104,632 108,104,632
Restricted reserve deposits 21 - 139,460,914 - 139,460,914 139,460,914
Loans and advances to customers 24 - 635,420,659 - 635,420,659 659,937,237
Assets pledged as collateral 26 - 45,209,533 - 45,209,533 53,346,359
Investment securities 25(a)(d) - 70,585,562 - 70,585,562 83,959,290
Other financial assets (net) 32(a)(c) - 22,344,109 - 22,344,109 22,344,109
LIABILITIESDeposits from banks 33 - 24,798,296 - 24,798,296 24,798,296
Deposits from customers 34 - 703,914,393 - 703,914,393 657,609,807
Borrowings 35 - 113,371,317 - 113,371,317 132,094,368
On-lending facilities 36 - 30,788,571 - 30,788,571 42,199,380
Debt securities issued 37 - 49,112,859 - 49,112,859 54,481,989
Other financial liabilities 40(a) 69,056,110 69,056,110 69,056,110
FCMB Group Plc Annual Report and Accounts 2017 147
Introduction Operating Review
Corporate Governance
Financial Statements
Shareholder Information
Other National Disclosures
Branches and Account Opening Information

of capital, availability of funding, technological obsolescence, discontinuance of services and other circumstances that could indicate that impairment exists. The Group applies the impairment assessment to its separate cash generating units. This requires management to make significant judgements and estimates concerning the existence of impairment indicators, separate cash generating units, remaining useful lives of assets, projected cash flows and net realisable values. Management’s judgement is also required when assessing whether a previously recognised impairment loss should be reversed.
(e) Income Taxes
The Group is subject to income taxes in two jurisdictions. Significant estimates are required in determining the Group wide provision for income taxes. There are many transactions and calculations for which the ultimate tax determination is uncertain during the ordinary course of business. The Group recognises liabilities for anticipated tax audit issues based on estimates of whether additional taxes will be due. Where the final tax outcome of these matters is different from the amounts that were initially recorded, such differences will impact the income tax and deferred tax provisions in the period in which such determination is made.
(f) Deferred Tax
The Group recognizes deferred tax assets based on management’s profit forecasts (which are based on the available evidence, including historical levels of profitability), which indicates that it is probable that the Group’s entities will have future taxable profits against which these assets can be used.
(g) Determination of Regulatory Risk Reserves
Provisions under prudential guidelines are determined using the time based provisioning regime prescribed by the Revised Central Bank of Nigeria (CBN) Prudential Guidelines. This is at variance with the incurred loss model required by
IFRS under IAS 39. As a result of the differences in the methodology/provision regime, there will be variances in the impairment allowances required under the two methodologies.
Paragraph 12.4 of the revised Prudential Guidelines for Deposit Money Banks in Nigeria stipulates that Banks would be required to make provisions for loans as prescribed in the relevant IFRS Standards when IFRS is adopted. However, Banks would be required to comply with the following:
(i) Provisions for loans recognised in the profit or loss account should be determined based on the requirements of IFRS. However, the IFRS provision should be compared with provisions determined under prudential guidelines and the expected impact/changes in general reserves should be treated as follows:
� Prudential Provisions is greater than IFRS provisions; the excess provision resulting should be transferred from the retained reserve account to a “regulatory risk reserve”.
� Prudential Provisions is less than IFRS provisions; IFRS determined provision is charged to the statement of profit or loss and other comprehensive income. The cumulative balance in the regulatory risk reserve is thereafter reversed to the retained earnings account.
(ii) The non-distributable reserve (excluding regulatory risk reserve) should be classified under Tier 1 as part of the core capital.
The banking subsidiary has complied with the requirements of the guidelines as follows:
Notes to the Consolidated and Separate Financial Statementsfor the year ended 31 December 2017 continued
FCMB Group Plc Annual Report and Accounts 2017148
Introduction Operating Review
Corporate Governance
Financial Statements
Shareholder Information
Other National Disclosures
Branches and Account Opening Information
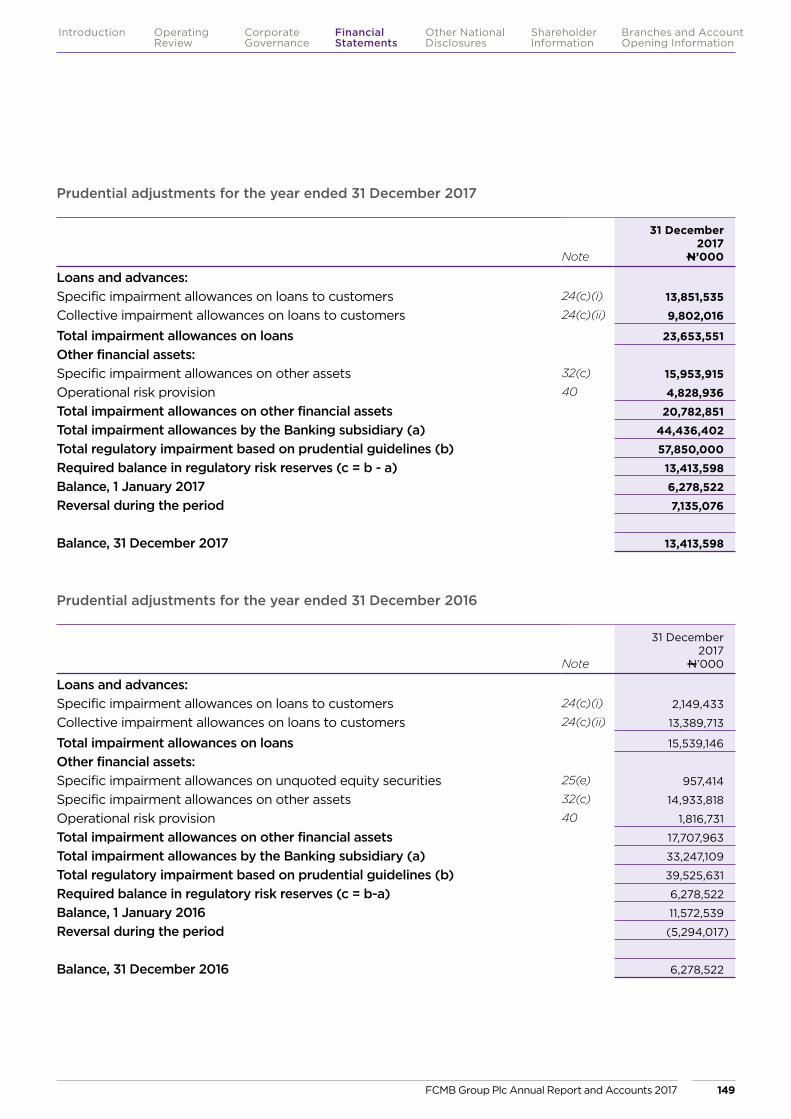
Note
31 December2017
N’000
Loans and advances:Specific impairment allowances on loans to customers 24(c)(i) 13,851,535
Collective impairment allowances on loans to customers 24(c)(ii) 9,802,016
Total impairment allowances on loans 23,653,551
Other financial assets: Specific impairment allowances on other assets 32(c) 15,953,915
Operational risk provision 40 4,828,936
Total impairment allowances on other financial assets 20,782,851
Total impairment allowances by the Banking subsidiary (a) 44,436,402
Total regulatory impairment based on prudential guidelines (b) 57,850,000
Required balance in regulatory risk reserves (c = b - a) 13,413,598
Balance, 1 January 2017 6,278,522
Reversal during the period 7,135,076
Balance, 31 December 2017 13,413,598
Note
31 December2017
N’000
Loans and advances:Specific impairment allowances on loans to customers 24(c)(i) 2,149,433
Collective impairment allowances on loans to customers 24(c)(ii) 13,389,713
Total impairment allowances on loans 15,539,146
Other financial assets: Specific impairment allowances on unquoted equity securities 25(e) 957,414
Specific impairment allowances on other assets 32(c) 14,933,818
Operational risk provision 40 1,816,731
Total impairment allowances on other financial assets 17,707,963
Total impairment allowances by the Banking subsidiary (a) 33,247,109
Total regulatory impairment based on prudential guidelines (b) 39,525,631
Required balance in regulatory risk reserves (c = b-a) 6,278,522
Balance, 1 January 2016 11,572,539
Reversal during the period (5,294,017)
Balance, 31 December 2016 6,278,522
Prudential adjustments for the year ended 31 December 2017
Prudential adjustments for the year ended 31 December 2016
FCMB Group Plc Annual Report and Accounts 2017 149
Introduction Operating Review
Corporate Governance
Financial Statements
Shareholder Information
Other National Disclosures
Branches and Account Opening Information
5 Operating Segments
The Group has eight reportable segments, as described below, which are the Group’s strategic divisions. The strategic divisions offer different products and services, and are managed separately based on the Group’s management and internal reporting structure. For each of the strategic divisions, the Group Executive Management Committee reviews internal management reports on at least a quarterly basis. The following summary describes the operations in each of the Group’s reportable segments.
Investment Banking – provides comprehensive banking services to highly structured large corporate organisations. The Group is also involved in capital raising activities for organisations both in money and capital markets as well as provides financial advisory services to organisations in raising funds.
Asset Management – administer and manages the pension fund assets and other investment portfolios for structured retiree savings account holders and other equity fund account holders.
SME Banking – provides banking services to Small and Medium Enterprises (SME) and commercial registered businesses with an annual turnover less than N2.5 billion.
Commercial Banking – provides banking services to Small and Medium Enterprises (SME) and commercial registered businesses with an annual turnover between N2.5 billion and N5 billion.
Corporate Banking – incorporating direct debit facilities, current accounts, deposits, overdrafts, loan and other credit facilities, foreign currency and derivative products. The corporate banking business unit caters for the specific needs of companies and financial institutions with an annual turnover in excess of N5 billion.
Personal Banking – incorporating private banking services, private customer current accounts, savings, deposits, investment savings products, custody, credit and debit cards, consumer loans and mortgages. Retail banking business unit caters for needs of individuals.
Institutional Banking – government financing, financial institutions, multilateral agencies. The business unit caters for governments at the various levels and their agencies.
Treasury and Financial Markets – Treasury and financial markets group provides funding support to various business segments while ensuring the liquidity of the Group is not compromised. The Group is also involved in currency trading incorporating financial instruments trading and structured financing.
Information regarding the results of each reporting segment is included below. Performance is measured based on segment profit before tax, as included in the internal management reports that are reviewed by the Executive Management Committee. Segment profit is used to measure performance as management believes that such information is the most relevant in evaluating the results of certain segments relative to other entities that operate within these industries.
No single external customer accounts for 10% or more of the Group’s revenue.
Information about operating segments
Notes to the Consolidated and Separate Financial Statementsfor the year ended 31 December 2017 continued
FCMB Group Plc Annual Report and Accounts 2017150
Introduction Operating Review
Corporate Governance
Financial Statements
Shareholder Information
Other National Disclosures
Branches and Account Opening Information

GR
OU
P
31 D
ecem
ber
20
17
Inve
stm
ent
Ban
king
N’0
00
Ass
et
Man
agem
ent
N’0
00
SME
B
anki
ngN
’00
0
Com
mer
cial
B
anki
ngN
’00
0
Cor
por
ate
Ban
king
N’0
00
Per
sona
l B
anki
ng
N’0
00
Inst
itut
iona
l B
anki
ngN
’00
0
Trea
sury
&
Fina
ncia
l M
arke
ts
N’0
00
Tota
lN
’00
0
Exte
rnal
reve
nues
: N
et in
tere
st in
com
e 2,
575,
061
122,
732
18,10
2,27
31,7
14,4
40
15,18
0,9
3828
,292
,867
3,38
0,12
71,1
56,6
9770
,525
,135
Net
fee
and
com
mis
sion
in
com
e 2,
151,3
03
320
,141
5,26
7,77
258
0,3
45
2,76
0,6
694
,40
6,26
338
3,70
135
2,16
516
,222
,359
Net
tra
din
g in
com
e 64
5,59
9 -
-
-
-
-
-
1,7
53,3
172,
398,
916
Net
loss
from
oth
er fi
nanc
ial
inst
rum
ents
at
FV
TPL
-
-
-
-
-
-
-
111,8
9111
1,891
Oth
er r
even
ue
366,
800
135,
504
2,
508,
663
360
,928
4,3
10,2
734
,390
,891
339,
235
971,9
3113
,384
,225
Inte
r-se
gmen
t re
venu
e -
-
1,0
58,9
854
4,9
57(1
,970
,915
)1,2
10,0
9631
2,97
1(6
56,0
94)
-
Tota
l seg
men
t ne
t re
venu
e 5,
738,
763
578,
377
26,9
37,6
932,
700
,670
20,2
80,9
6538
,30
0,11
74
,416
,034
3,68
9,90
710
2,64
2,52
6
Oth
er m
ater
ial n
on-c
ash
item
s:
Imp
airm
ent
loss
es o
n fin
anci
al a
sset
s 9,
567
3,6
93
6,0
05,
242
1,735
,530
11,8
77,8
302,
987,
547
48,
097
-
22
,667
,50
6
Dep
reci
atio
n an
d
amor
tisat
ion
exp
ense
s 13
1,766
13,8
90
1,681
,40
519
2,90
450
1,981
2,0
85,8
88 4
93,6
86
158,
192
5,25
9,71
2
Rep
orta
ble
seg
men
t p
rofit
/(l
oss)
bef
ore
inco
me
tax
2,0
39,3
06
250
,075
32
4,8
53
(1,6
39,3
24)
(71,8
32)
9,0
64,9
45
(592
,239
)2,
086
,60
811
,462
,392
Rep
orta
ble
seg
men
t as
sets
26
,30
6,57
5 4
,483
,80
5 90
,427
,283
20
,776
,636
4
37,2
10,6
7410
5,74
7,27
83,
664
,40
5 33
1,367
,24
41,0
19,9
83,9
00
Rep
orta
ble
seg
men
t lia
bili
ties
24,12
9,87
3 2
,220
,730
23
3,0
09,
051
27
,199,
108
15
5,65
1,372
260
,086
,439
45,
802,
878
21
8,23
5,59
596
6,33
5,0
46
(i)
The
bus
ines
s se
gm
ent
resu
lts
are
as f
ollo
ws:
FCMB Group Plc Annual Report and Accounts 2017 151
Introduction Operating Review
Corporate Governance
Financial Statements
Shareholder Information
Other National Disclosures
Branches and Account Opening Information
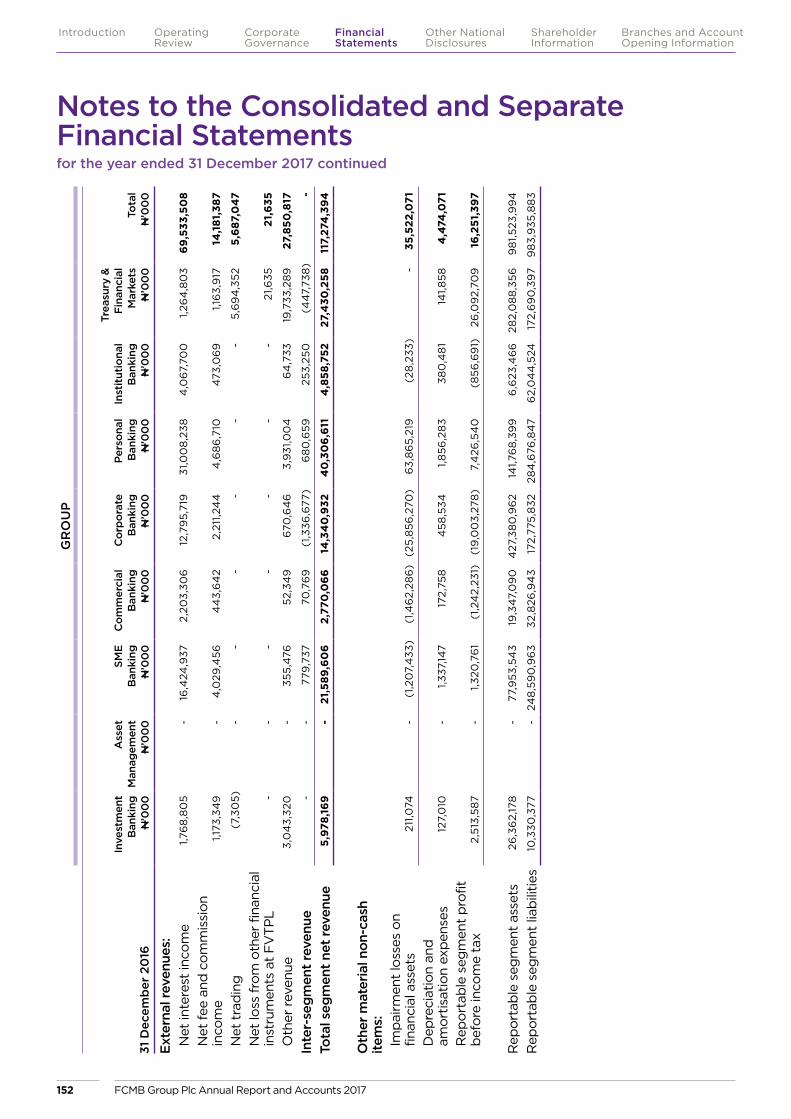
GR
OU
P
31 D
ecem
ber
20
16
Inve
stm
ent
Ban
king
N’0
00
Ass
et
Man
agem
ent
N’0
00
SME
B
anki
ngN
’00
0
Com
mer
cial
B
anki
ngN
’00
0
Cor
por
ate
Ban
king
N’0
00
Per
sona
l B
anki
ng
N’0
00
Inst
itut
iona
l B
anki
ngN
’00
0
Trea
sury
&
Fina
ncia
l M
arke
ts
N’0
00
Tota
lN
’00
0
Exte
rnal
reve
nues
: N
et in
tere
st in
com
e 1,7
68
,80
5 -
16
,424
,937
2,20
3,30
612
,79
5,71
931
,00
8,2
384
,06
7,70
01,2
64
,80
369
,533
,50
8
Net
fee
and
com
mis
sion
in
com
e 1,1
73,3
49
-
4,0
29,4
564
43,
64
22,
211,2
44
4,6
86
,710
473
,06
91,1
63,
917
14,1
81,3
87
Net
tra
din
g
(7,3
05)
-
-
-
-
-
-
5,6
94
,352
5,6
87,0
47
Net
loss
from
oth
er fi
nanc
ial
inst
rum
ents
at
FV
TPL
-
-
-
-
-
-
-
21,6
3521
,635
Oth
er r
even
ue
3,0
43,
320
-
35
5,4
7652
,34
96
70,6
46
3,9
31,0
04
64
,733
19,7
33,2
89
27,8
50,8
17
Inte
r-se
gmen
t re
venu
e -
-
77
9,7
3770
,76
9(1
,336
,677
)6
80
,659
253,
250
(44
7,73
8)
-
Tota
l seg
men
t ne
t re
venu
e 5,
978,
169
-
21,5
89,6
06
2,77
0,0
66
14,3
40
,932
40
,30
6,6
114
,858
,752
27,4
30,2
5811
7,27
4,3
94
Oth
er m
ater
ial n
on-c
ash
item
s:
Imp
airm
ent
loss
es o
n fin
anci
al a
sset
s 2
11,0
74
-
(1,2
07,
433
)(1
,46
2,28
6)
(25,
856
,270
)6
3,8
65,
219
(28
,233
) -
35
,522
,071
Dep
reci
atio
n an
d
amor
tisat
ion
exp
ense
s 12
7,0
10 -
1,3
37,14
7 17
2,75
8
458
,534
1,856
,28
338
0,4
81
141,8
584
,474
,071
Rep
orta
ble
seg
men
t p
rofit
b
efor
e in
com
e ta
x 2,
513,
587
-
1,320
,76
1(1
,24
2,23
1)(1
9,0
03,
278
)7,
426
,54
0(8
56,6
91)
26,0
92,
709
16,2
51,3
97
Rep
orta
ble
seg
men
t as
sets
26
,36
2,17
8 -
77
,953
,54
319
,34
7,0
90
427
,38
0,9
62
141,7
68
,39
96
,623
,46
628
2,0
88
,356
98
1,523
,99
4
Rep
orta
ble
seg
men
t lia
bili
ties
10,3
30,3
77 -
24
8,5
90
,96
332
,826
,94
317
2,77
5,8
3228
4,6
76,8
47
62,
04
4,5
2417
2,6
90
,39
79
83,
935
,88
3
Notes to the Consolidated and Separate Financial Statementsfor the year ended 31 December 2017 continued
FCMB Group Plc Annual Report and Accounts 2017152
Introduction Operating Review
Corporate Governance
Financial Statements
Shareholder Information
Other National Disclosures
Branches and Account Opening Information
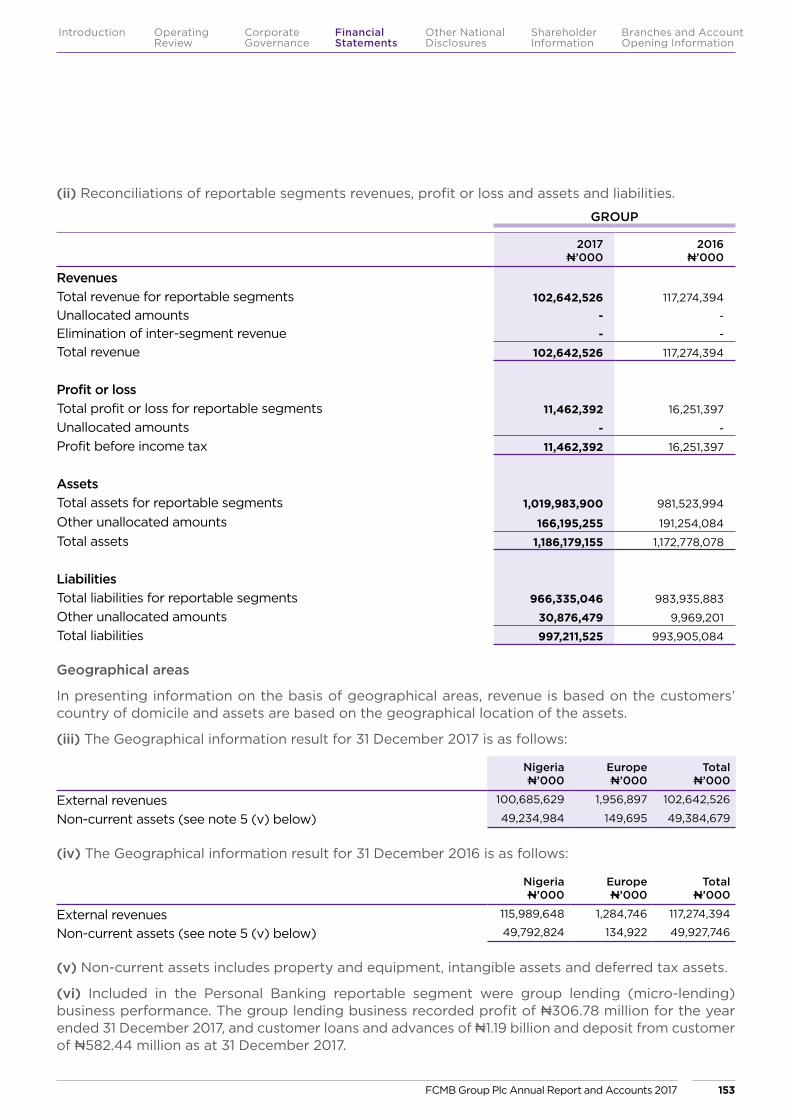
(ii) Reconciliations of reportable segments revenues, profit or loss and assets and liabilities.
GROUP
2017N’000
2016N’000
Revenues Total revenue for reportable segments 102,642,526 117,274,394
Unallocated amounts - -
Elimination of inter-segment revenue - -
Total revenue 102,642,526 117,274,394
Profit or loss Total profit or loss for reportable segments 11,462,392 16,251,397
Unallocated amounts - -
Profit before income tax 11,462,392 16,251,397
Assets Total assets for reportable segments 1,019,983,900 981,523,994
Other unallocated amounts 166,195,255 191,254,084
Total assets 1,186,179,155 1,172,778,078
Liabilities Total liabilities for reportable segments 966,335,046 983,935,883
Other unallocated amounts 30,876,479 9,969,201
Total liabilities 997,211,525 993,905,084
Geographical areas
In presenting information on the basis of geographical areas, revenue is based on the customers’ country of domicile and assets are based on the geographical location of the assets.
(iii) The Geographical information result for 31 December 2017 is as follows:
NigeriaN’000
EuropeN’000
TotalN’000
External revenues 100,685,629 1,956,897 102,642,526
Non-current assets (see note 5 (v) below) 49,234,984 149,695 49,384,679
(iv) The Geographical information result for 31 December 2016 is as follows:
NigeriaN’000
EuropeN’000
TotalN’000
External revenues 115,989,648 1,284,746 117,274,394
Non-current assets (see note 5 (v) below) 49,792,824 134,922 49,927,746
(v) Non-current assets includes property and equipment, intangible assets and deferred tax assets.
(vi) Included in the Personal Banking reportable segment were group lending (micro-lending) business performance. The group lending business recorded profit of N306.78 million for the year ended 31 December 2017, and customer loans and advances of N1.19 billion and deposit from customer of N582.44 million as at 31 December 2017.
FCMB Group Plc Annual Report and Accounts 2017 153
Introduction Operating Review
Corporate Governance
Financial Statements
Shareholder Information
Other National Disclosures
Branches and Account Opening Information
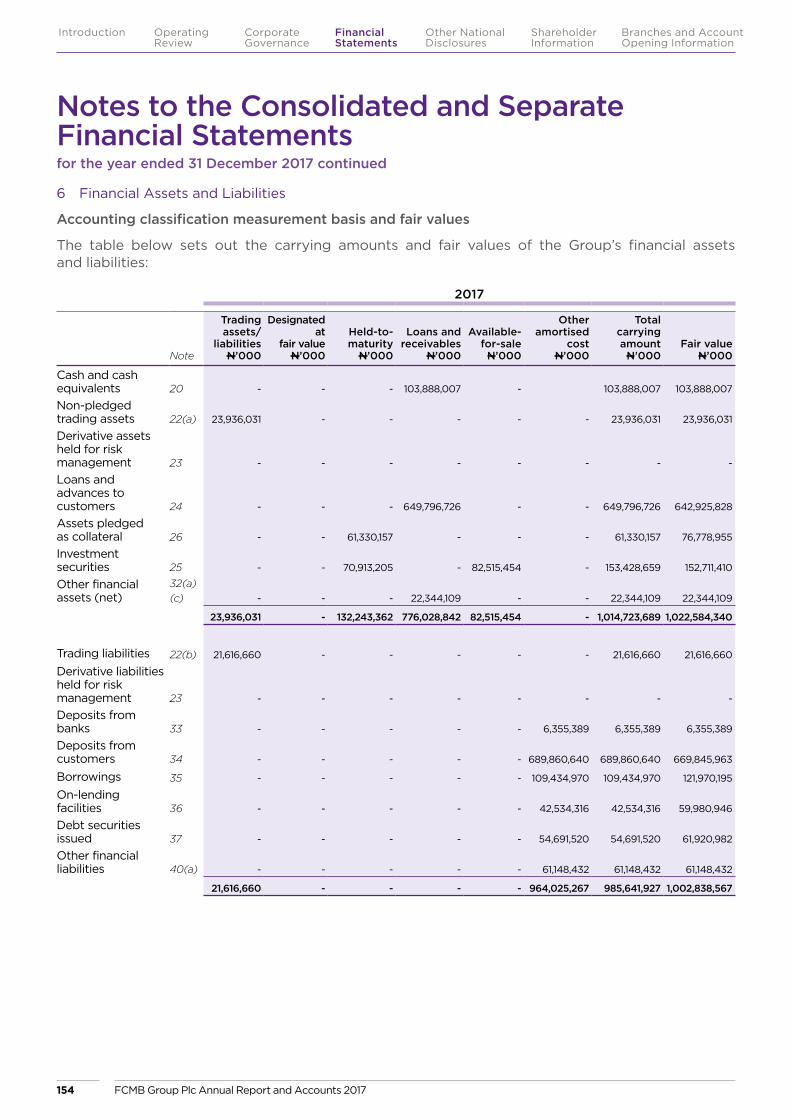
6 Financial Assets and Liabilities
Accounting classification measurement basis and fair values
The table below sets out the carrying amounts and fair values of the Group’s financial assets and liabilities:
2017
Note
Trading assets/
liabilities N’000
Designated at
fair valueN’000
Held-to-maturity
N’000
Loans and receivables
N’000
Available-for-sale N’000
Other amortised
cost N’000
Total carrying amount
N’000 Fair value
N’000
Cash and cash equivalents 20 - - - 103,888,007 - 103,888,007 103,888,007
Non-pledged trading assets 22(a) 23,936,031 - - - - - 23,936,031 23,936,031
Derivative assets held for risk management 23 - - - - - - - -
Loans and advances to customers 24 - - - 649,796,726 - - 649,796,726 642,925,828
Assets pledged as collateral 26 - - 61,330,157 - - - 61,330,157 76,778,955
Investment securities 25 - - 70,913,205 - 82,515,454 - 153,428,659 152,711,410
Other financial assets (net)
32(a)(c) - - - 22,344,109 - - 22,344,109 22,344,109
23,936,031 - 132,243,362 776,028,842 82,515,454 - 1,014,723,689 1,022,584,340
Trading liabilities 22(b) 21,616,660 - - - - - 21,616,660 21,616,660
Derivative liabilities held for risk management 23 - - - - - - - -
Deposits from banks 33 - - - - - 6,355,389 6,355,389 6,355,389
Deposits from customers 34 - - - - - 689,860,640 689,860,640 669,845,963
Borrowings 35 - - - - - 109,434,970 109,434,970 121,970,195
On-lending facilities 36 - - - - - 42,534,316 42,534,316 59,980,946
Debt securities issued 37 - - - - - 54,691,520 54,691,520 61,920,982
Other financial liabilities 40(a) - - - - - 61,148,432 61,148,432 61,148,432
21,616,660 - - - - 964,025,267 985,641,927 1,002,838,567
Notes to the Consolidated and Separate Financial Statementsfor the year ended 31 December 2017 continued
FCMB Group Plc Annual Report and Accounts 2017154
Introduction Operating Review
Corporate Governance
Financial Statements
Shareholder Information
Other National Disclosures
Branches and Account Opening Information
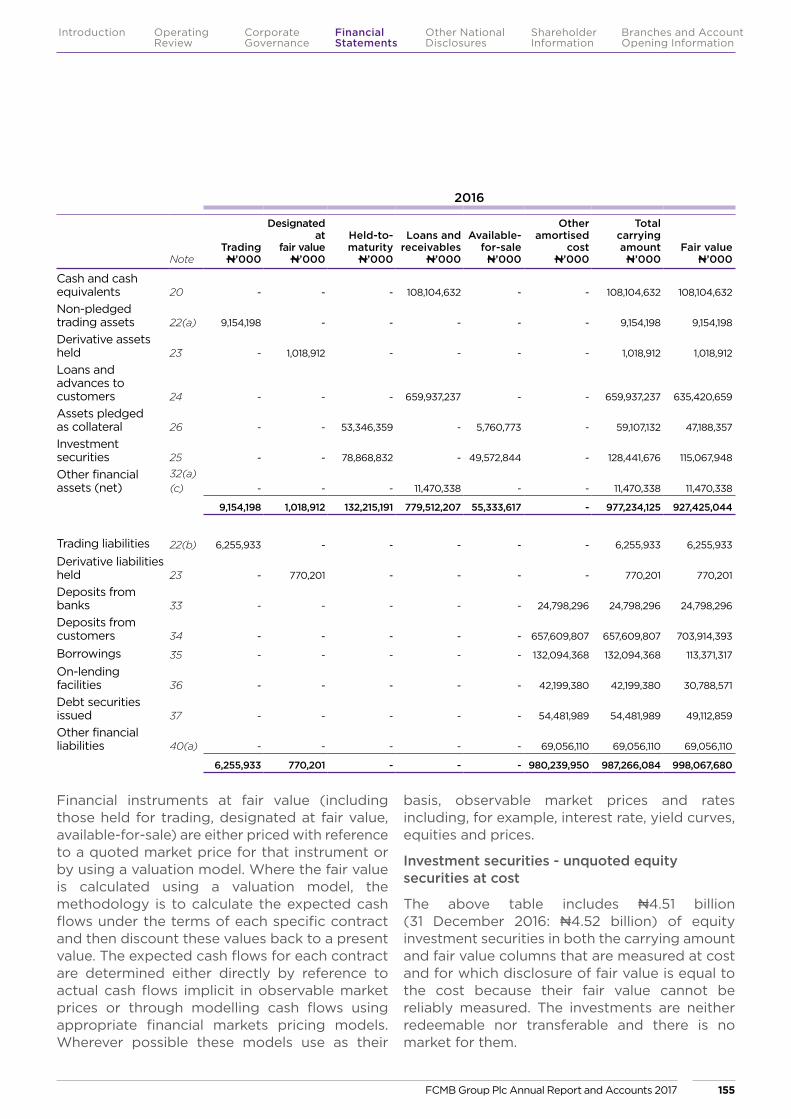
2016
NoteTrading N’000
Designated at
fair valueN’000
Held-to-maturity
N’000
Loans and receivables
N’000
Available-for-sale N’000
Other amortised
cost N’000
Total carrying amount
N’000 Fair value
N’000
Cash and cash equivalents 20 - - - 108,104,632 - - 108,104,632 108,104,632
Non-pledged trading assets 22(a) 9,154,198 - - - - - 9,154,198 9,154,198
Derivative assets held 23 - 1,018,912 - - - - 1,018,912 1,018,912
Loans and advances to customers 24 - - - 659,937,237 - - 659,937,237 635,420,659
Assets pledged as collateral 26 - - 53,346,359 - 5,760,773 - 59,107,132 47,188,357
Investment securities 25 - - 78,868,832 - 49,572,844 - 128,441,676 115,067,948
Other financial assets (net)
32(a)(c) - - - 11,470,338 - - 11,470,338 11,470,338
9,154,198 1,018,912 132,215,191 779,512,207 55,333,617 - 977,234,125 927,425,044
Trading liabilities 22(b) 6,255,933 - - - - - 6,255,933 6,255,933
Derivative liabilities held 23 - 770,201 - - - - 770,201 770,201
Deposits from banks 33 - - - - - 24,798,296 24,798,296 24,798,296
Deposits from customers 34 - - - - - 657,609,807 657,609,807 703,914,393
Borrowings 35 - - - - - 132,094,368 132,094,368 113,371,317
On-lending facilities 36 - - - - - 42,199,380 42,199,380 30,788,571
Debt securities issued 37 - - - - - 54,481,989 54,481,989 49,112,859
Other financial liabilities 40(a) - - - - - 69,056,110 69,056,110 69,056,110
6,255,933 770,201 - - - 980,239,950 987,266,084 998,067,680
Financial instruments at fair value (including those held for trading, designated at fair value, available-for-sale) are either priced with reference to a quoted market price for that instrument or by using a valuation model. Where the fair value is calculated using a valuation model, the methodology is to calculate the expected cash flows under the terms of each specific contract and then discount these values back to a present value. The expected cash flows for each contract are determined either directly by reference to actual cash flows implicit in observable market prices or through modelling cash flows using appropriate financial markets pricing models. Wherever possible these models use as their
basis, observable market prices and rates including, for example, interest rate, yield curves, equities and prices.
Investment securities - unquoted equity securities at cost
The above table includes N4.51 billion (31 December 2016: N4.52 billion) of equity investment securities in both the carrying amount and fair value columns that are measured at cost and for which disclosure of fair value is equal to the cost because their fair value cannot be reliably measured. The investments are neither redeemable nor transferable and there is no market for them.
FCMB Group Plc Annual Report and Accounts 2017 155
Introduction Operating Review
Corporate Governance
Financial Statements
Shareholder Information
Other National Disclosures
Branches and Account Opening Information

GROUP COMPANY
7 Interest and Discount Income2017
N’0002016
N’0002017
N’0002016
N’000
Cash and cash equivalents 858,722 737,089 420,084 311,792
Loans and advances to customers (see note (a)) 106,800,484 101,352,180 - -
Investments in government & corporate securities:– Available-for-sale 9,133,477 7,061,490 64,492 -
– Held-for-trading 177,295 145,197 - -
– Held-to-maturity 15,387,066 15,813,079 401,989 163,682
132,357,044 125,109,035 886,565 475,474
(a) Included in this amount is N3.14 billion (2016: N2.44 billion) interest income accrued on impaired loans and advances to customers.
(b) Included in the total interest income calculated using the effective interest method reported above that relate to financial assets not carried at fair value through profit or loss is N132.18 billion (2016: N124.96 billion)
GROUP COMPANY
8 Interest Expense2017
N’0002016
N’0002017
N’0002016
N’000
Deposits from banks 3,464,702 3,511,872 - -
Deposits from customers 39,155,220 31,049,656 - -
42,619,922 34,561,528 - -
Borrowings 9,146,704 12,517,031 - -
Debt securities issued 8,299,147 7,429,899 - -
On-lending facilities 1,766,136 1,067,069 - -
61,831,909 55,575,527 - -
(a) There is no negative interest on government securities and consequently, no interest expense on same.
(b) Total interest expense, calculated using the effective interest rate method reported above does not include interest expense on financial liabilities carried at fair value through profit or loss.
Notes to the Consolidated and Separate Financial Statementsfor the year ended 31 December 2017 continued
FCMB Group Plc Annual Report and Accounts 2017156
Introduction Operating Review
Corporate Governance
Financial Statements
Shareholder Information
Other National Disclosures
Branches and Account Opening Information
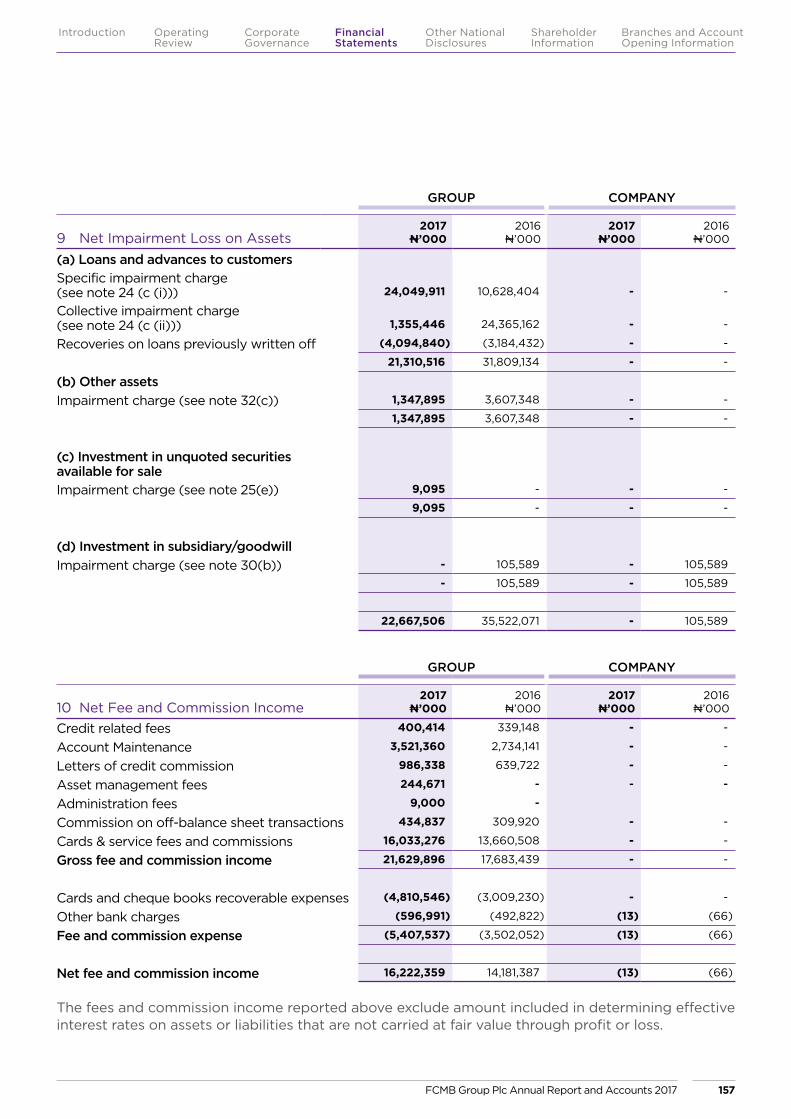
GROUP COMPANY
9 Net Impairment Loss on Assets2017
N’0002016
N’0002017
N’0002016
N’000
(a) Loans and advances to customers
Specific impairment charge (see note 24 (c (i))) 24,049,911 10,628,404 - -
Collective impairment charge (see note 24 (c (ii))) 1,355,446 24,365,162 - -
Recoveries on loans previously written off (4,094,840) (3,184,432) - -
21,310,516 31,809,134 - -
(b) Other assetsImpairment charge (see note 32(c)) 1,347,895 3,607,348 - -
1,347,895 3,607,348 - -
(c) Investment in unquoted securities available for saleImpairment charge (see note 25(e)) 9,095 - - -
9,095 - - -
(d) Investment in subsidiary/goodwillImpairment charge (see note 30(b)) - 105,589 - 105,589
- 105,589 - 105,589
22,667,506 35,522,071 - 105,589
GROUP COMPANY
10 Net Fee and Commission Income2017
N’0002016
N’0002017
N’0002016
N’000
Credit related fees 400,414 339,148 - -
Account Maintenance 3,521,360 2,734,141 - -
Letters of credit commission 986,338 639,722 - -
Asset management fees 244,671 - - -
Administration fees 9,000 -
Commission on off-balance sheet transactions 434,837 309,920 - -
Cards & service fees and commissions 16,033,276 13,660,508 - -
Gross fee and commission income 21,629,896 17,683,439 - -
Cards and cheque books recoverable expenses (4,810,546) (3,009,230) - -
Other bank charges (596,991) (492,822) (13) (66)
Fee and commission expense (5,407,537) (3,502,052) (13) (66)
Net fee and commission income 16,222,359 14,181,387 (13) (66)
The fees and commission income reported above exclude amount included in determining effective interest rates on assets or liabilities that are not carried at fair value through profit or loss.
FCMB Group Plc Annual Report and Accounts 2017 157
Introduction Operating Review
Corporate Governance
Financial Statements
Shareholder Information
Other National Disclosures
Branches and Account Opening Information
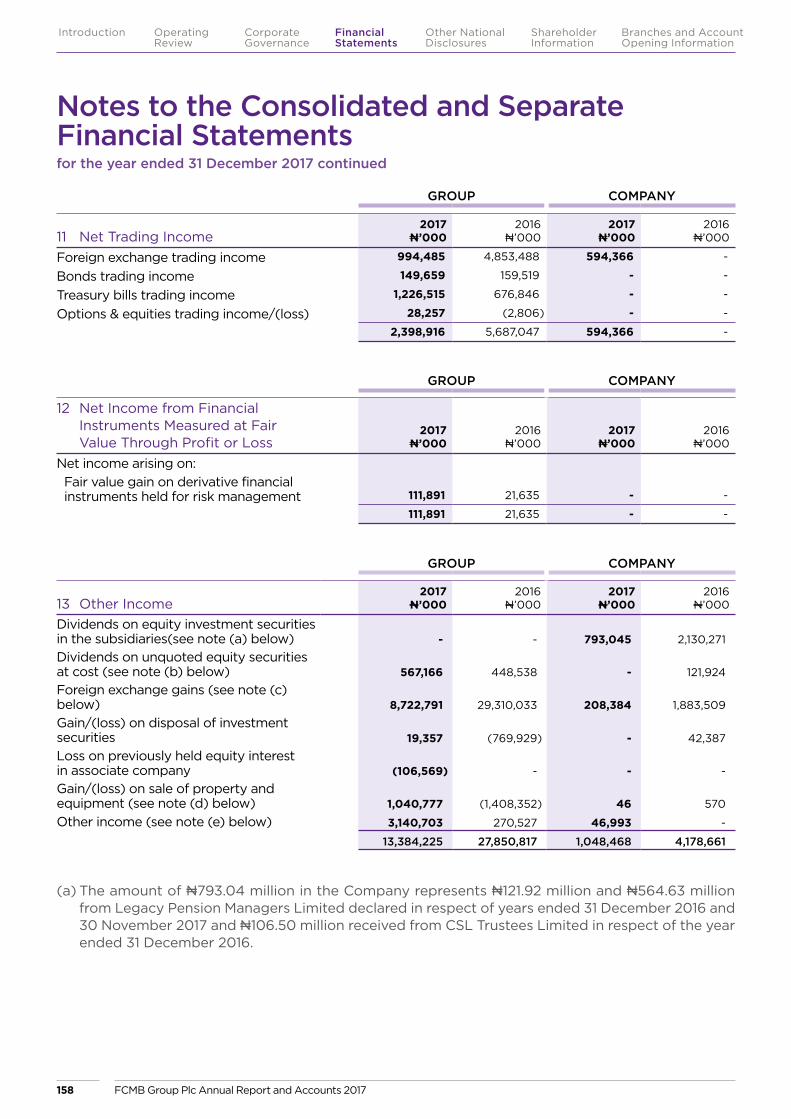
(a) The amount of N793.04 million in the Company represents N121.92 million and N564.63 million from Legacy Pension Managers Limited declared in respect of years ended 31 December 2016 and 30 November 2017 and N106.50 million received from CSL Trustees Limited in respect of the year ended 31 December 2016.
GROUP COMPANY
11 Net Trading Income 2017
N’0002016
N’0002017
N’0002016
N’000
Foreign exchange trading income 994,485 4,853,488 594,366 -
Bonds trading income 149,659 159,519 - -
Treasury bills trading income 1,226,515 676,846 - -
Options & equities trading income/(loss) 28,257 (2,806) - -
2,398,916 5,687,047 594,366 -
GROUP COMPANY
12 Net Income from Financial Instruments Measured at Fair Value Through Profit or Loss
2017N’000
2016N’000
2017N’000
2016N’000
Net income arising on:
Fair value gain on derivative financial instruments held for risk management 111,891 21,635 - -
111,891 21,635 - -
GROUP COMPANY
13 Other Income 2017
N’0002016
N’0002017
N’0002016
N’000
Dividends on equity investment securities in the subsidiaries(see note (a) below) - - 793,045 2,130,271
Dividends on unquoted equity securities at cost (see note (b) below) 567,166 448,538 - 121,924
Foreign exchange gains (see note (c) below) 8,722,791 29,310,033 208,384 1,883,509
Gain/(loss) on disposal of investment securities 19,357 (769,929) - 42,387
Loss on previously held equity interest in associate company (106,569) - - -
Gain/(loss) on sale of property and equipment (see note (d) below) 1,040,777 (1,408,352) 46 570
Other income (see note (e) below) 3,140,703 270,527 46,993 -
13,384,225 27,850,817 1,048,468 4,178,661
Notes to the Consolidated and Separate Financial Statementsfor the year ended 31 December 2017 continued
FCMB Group Plc Annual Report and Accounts 2017158
Introduction Operating Review
Corporate Governance
Financial Statements
Shareholder Information
Other National Disclosures
Branches and Account Opening Information
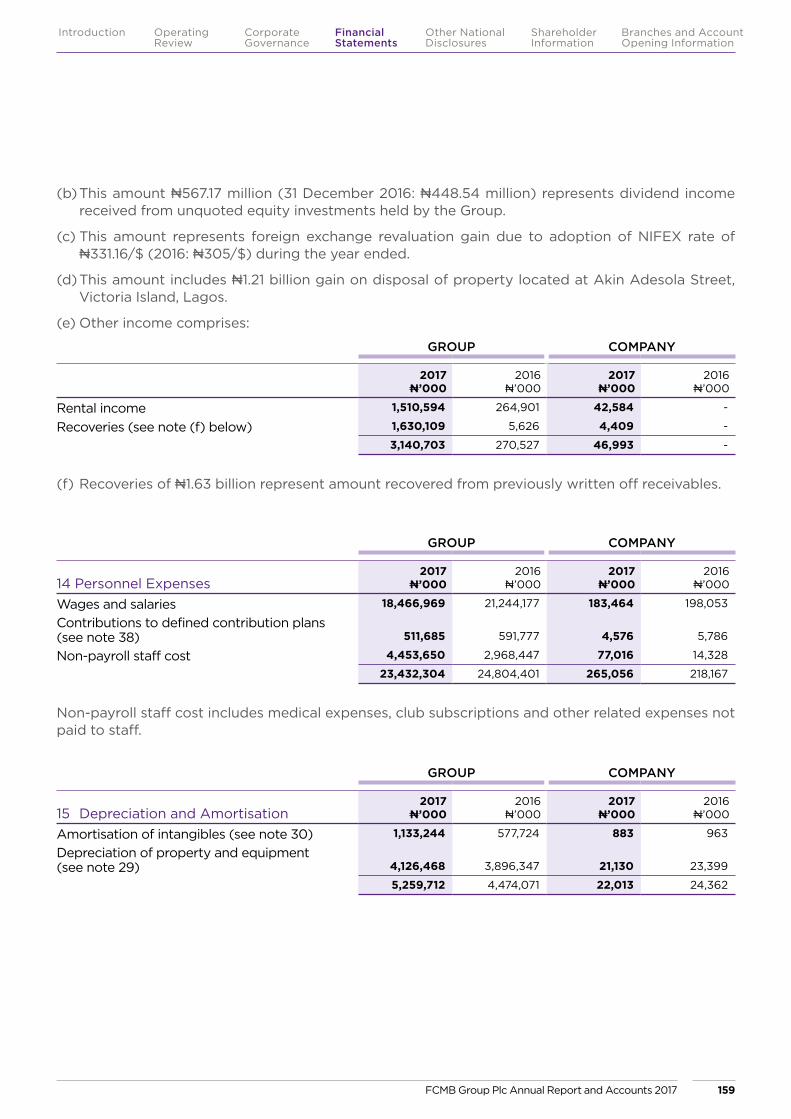
(b) This amount N567.17 million (31 December 2016: N448.54 million) represents dividend income received from unquoted equity investments held by the Group.
(c) This amount represents foreign exchange revaluation gain due to adoption of NIFEX rate of N331.16/$ (2016: N305/$) during the year ended.
(d) This amount includes N1.21 billion gain on disposal of property located at Akin Adesola Street, Victoria Island, Lagos.
(e) Other income comprises:
GROUP COMPANY
2017N’000
2016N’000
2017N’000
2016N’000
Rental income 1,510,594 264,901 42,584 -
Recoveries (see note (f) below) 1,630,109 5,626 4,409 -
3,140,703 270,527 46,993 -
(f) Recoveries of N1.63 billion represent amount recovered from previously written off receivables.
GROUP COMPANY
14 Personnel Expenses 2017
N’0002016
N’0002017
N’0002016
N’000
Wages and salaries 18,466,969 21,244,177 183,464 198,053
Contributions to defined contribution plans (see note 38) 511,685 591,777 4,576 5,786
Non-payroll staff cost 4,453,650 2,968,447 77,016 14,328
23,432,304 24,804,401 265,056 218,167
Non-payroll staff cost includes medical expenses, club subscriptions and other related expenses not paid to staff.
GROUP COMPANY
15 Depreciation and Amortisation 2017
N’0002016
N’0002017
N’0002016
N’000
Amortisation of intangibles (see note 30) 1,133,244 577,724 883 963
Depreciation of property and equipment (see note 29) 4,126,468 3,896,347 21,130 23,399
5,259,712 4,474,071 22,013 24,362
FCMB Group Plc Annual Report and Accounts 2017 159
Introduction Operating Review
Corporate Governance
Financial Statements
Shareholder Information
Other National Disclosures
Branches and Account Opening Information
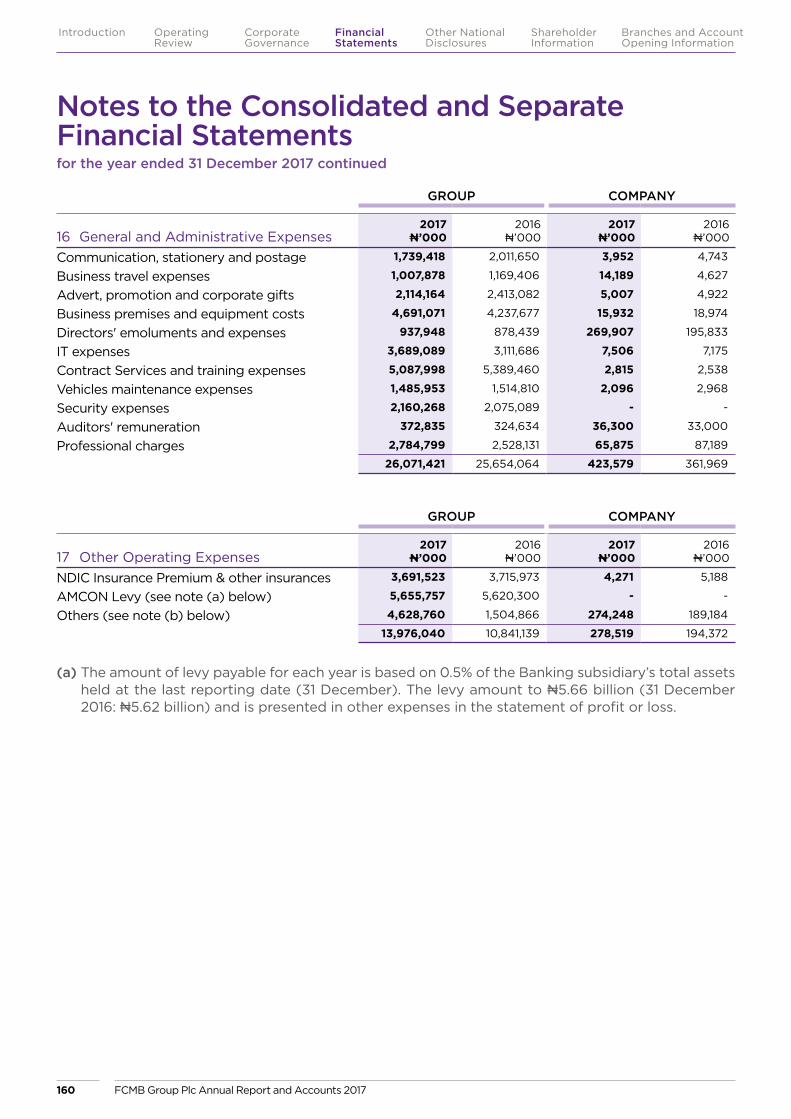
GROUP COMPANY
17 Other Operating Expenses2017
N’0002016
N’0002017
N’0002016
N’000
NDIC Insurance Premium & other insurances 3,691,523 3,715,973 4,271 5,188
AMCON Levy (see note (a) below) 5,655,757 5,620,300 - -
Others (see note (b) below) 4,628,760 1,504,866 274,248 189,184
13,976,040 10,841,139 278,519 194,372
(a) The amount of levy payable for each year is based on 0.5% of the Banking subsidiary’s total assets held at the last reporting date (31 December). The levy amount to N5.66 billion (31 December 2016: N5.62 billion) and is presented in other expenses in the statement of profit or loss.
GROUP COMPANY
16 General and Administrative Expenses2017
N’0002016
N’0002017
N’0002016
N’000
Communication, stationery and postage 1,739,418 2,011,650 3,952 4,743
Business travel expenses 1,007,878 1,169,406 14,189 4,627
Advert, promotion and corporate gifts 2,114,164 2,413,082 5,007 4,922
Business premises and equipment costs 4,691,071 4,237,677 15,932 18,974
Directors' emoluments and expenses 937,948 878,439 269,907 195,833
IT expenses 3,689,089 3,111,686 7,506 7,175
Contract Services and training expenses 5,087,998 5,389,460 2,815 2,538
Vehicles maintenance expenses 1,485,953 1,514,810 2,096 2,968
Security expenses 2,160,268 2,075,089 - -
Auditors' remuneration 372,835 324,634 36,300 33,000
Professional charges 2,784,799 2,528,131 65,875 87,189
26,071,421 25,654,064 423,579 361,969
Notes to the Consolidated and Separate Financial Statementsfor the year ended 31 December 2017 continued
FCMB Group Plc Annual Report and Accounts 2017160
Introduction Operating Review
Corporate Governance
Financial Statements
Shareholder Information
Other National Disclosures
Branches and Account Opening Information

(b) Others comprisesGROUP COMPANY
2017N’000
2016N’000
2017N’000
2016N’000
AGM, meetings and shareholders expenses 362,467 306,386 215,673 163,667
Donation and sponsorship expenses 395,360 169,018 - -
Entertainment expenses 344,467 333,065 7,047 7,062
Fraud and forgery expense 6,399 16,411 - -
Rental expenses 201,696 182,601 17,893 9,703
Regulatory charges 6,523 8,641 6,523 8,641
Other accounts written off 94,948 123,146 212 111
PENCOM Recovery Agent Fee 1,941 - - -
Pension Protection Fund Expenses 59,960 - - -
Provision for litigation 2,782,729 276,838 121 -
Industrial training fund levy 188,263 - 5,314 -
Nigeria Social Insurance Trust Fund expenses 155,745 - 1,465 -
Penalties (see note 48) 28,262 88,760 20,000 -
4,628,760 1,504,866 274,248 189,184
GROUP COMPANY
18 Earnings Per Share2017
N’0002016
N’0002017
N’0002016
N’000
Basic and diluted earnings per shareProfit attributable to equity holders 9,410,204 14,338,882 1,524,886 3,730,260
Weighted average number of ordinary shares in issue 19,802,710 19,802,710 19,802,710 19,802,710
0.48 0.72 0.08 0.19
The Group does not have dilutive potential ordinary shares as at 31 December 2017 (31 December 2016: nil).
FCMB Group Plc Annual Report and Accounts 2017 161
Introduction Operating Review
Corporate Governance
Financial Statements
Shareholder Information
Other National Disclosures
Branches and Account Opening Information

GROUP COMPANY
19 Tax Expense2017
N’0002016
N’0002017
N’0002016
N’000
(i) Current tax expense:Minimum tax (see note 19(iv)) 996,366 988,364 - -
National Information Technology Development Agency (NITDA) levy (see note 19(v)) 131,229 159,471 10,573 19,351
Tertiary education tax (see note 19(v)) 107,402 35,014 4,760 -
Capital gain tax (see note 19(v)) 89,519 - - -
Corporate income tax (see note 19(v)) 1,055,148 539,435 - -
(ii) Deferred tax expense:Origination of temporary differences (see note 31(b)) (327,476) 190,231 - -
Income tax expense 1,055,822 924,151 15,333 19,351
Total tax expense 2,052,188 1,912,515 15,333 19,351
GROUP COMPANY
%2017
N’000 %2017
N’000
(iii) Reconciliation of effective tax rateProfit before tax 11,462,392 1,540,219Income tax using the domestic corporation tax rate 30.0 3,438,718 30.0 462,066National Information Technology Development Agency (NITDA) levy 1.1 131,229 0.7 10,573Non-deductible expenses 25.9 2,973,616 0.9 14,051Tax exempt income (99.7) (11,431,007) (26.3) (404,493)Minimum tax 8.7 996,366 0.0 - Unrecognised tax losses 50.1 5,746,345 (4.7) (71,624)Capital gain tax 0.8 89,519 0.0 - Tertiary education tax 0.9 107,402 0.3 4,760Total tax expense 17.9 2,052,188 1.0 15,333
Notes to the Consolidated and Separate Financial Statementsfor the year ended 31 December 2017 continued
FCMB Group Plc Annual Report and Accounts 2017162
Introduction Operating Review
Corporate Governance
Financial Statements
Shareholder Information
Other National Disclosures
Branches and Account Opening Information

(iv)
The Banking subsidiary was assessed based on the minimum tax legislation for the year ended 31 December 2017 because of a tax exemption granted via Companies Income Tax (Exemption of Bonds and Short Term Government Securities) Order, 2011 as contained in a gazette issued by the President of the Federal Republic of Nigeria, which took effect from 2 January 2012.
The Order exempts all interests earned on Bonds (Federal, state, local and corporate bodies including supra-national) and other short term securities such as Treasury Bills and Promissory Notes from being subjected to tax imposed under the Companies Income Tax Act. The Order is valid for a period of 10 years from the effective date of the Order, except for Bonds issued by the Federal Government, which will continue to enjoy the exemption.
A significant portion of the Banking subsidiary’s income was derived from short-term securities and government bonds, and as a result, the Bank’s current income tax assessment for the year under review yields a tax credit in its favour. Consequently, the Banking subsidiary has applied
the provisions of the Companies Income Tax Act that mandates a minimum tax assessment, where a tax payer does not have any tax liability arising from its tax assessment.
Excess dividend tax in line with Section 15A of Companies Income Tax Act stipulates that where a company pays dividend in a year where no tax is payable due to no total profit or total profit that is less than the amount of dividend paid, whether or not the recipient of the dividend is a Nigeria company, the company paying the dividend shall be charged to a tax at the rate of 30% of the amount of dividend paid as if that is the total profit of the company. During the year ended 31 December 2017, the Banking subsidiary was not liable to excess dividend tax (31 December 2016: Nil).
The Group utilized the services of the following tax consultants during the year under review:
NAME OF PROFESSIONAL Pedabo Associates Ltd.
FRC NUMBER FRC/2013/ICAN/00000000908
GROUP COMPANY
%2016
N’000 %2016
N’000
(iii) Reconciliation of effective tax rateProfit before tax 15,978,648 3,749,611
Income tax using the domestic corporation tax rate 30.0 4,793,594 30.0 1,124,883
National Information Technology Development Agency (NITDA) levy 1.0 159,471 0.5 19,351
Non-deductible expenses 90.1 14,398,317 0.0 -
Tax exempt income (95.9) (15,325,815) (15.1) (567,722)
Minimum tax 6.2 988,364 0.0 -
Unrecognised tax losses (19.4) (3,101,416) (14.9) (557,161)
Total tax expense 12.0 1,912,515 0.5 19,351
FCMB Group Plc Annual Report and Accounts 2017 163
Introduction Operating Review
Corporate Governance
Financial Statements
Shareholder Information
Other National Disclosures
Branches and Account Opening Information

GROUP COMPANY
2017N’000
2016N’000
2017N’000
2016N’000
(v) Current income tax liabilityBeginning of the year 2,859,562 3,497,954 44,582 25,231
Tax paid (410,944) (1,935,705) - -
Tax refund (see note (a) below) (968,119) (424,971) - -
Minimum tax 996,366 988,364 - -
Capital gain tax 89,519 - - -
National Information Technology Development Agency (NITDA) levy 131,229 159,471 10,573 19,351
Tertiary education tax 107,402 35,014 4,760 -
Income tax expense 1,055,148 539,435 - -
3,860,163 2,859,562 59,915 44,582
Current 3,860,163 2,859,562 59,915 44,582
Non-current - - - -
3,860,163 2,859,562 59,915 44,582
(a) Amount represents arrears of withholding tax credit notes utilized during the year. Withholding tax is an advance payment of company income tax (CIT) deducted at source used to net off the tax liability for the year.
GROUP COMPANY
20 Cash and Cash Equivalents2017
N’0002016
N’0002017
N’0002016
N’000
Cash 27,454,048 27,925,361 - -
Current balances within Nigeria 1,860,535 4,152,938 146,366 202,180
Current balances outside Nigeria (see (b) below) 43,934,323 53,217,994 - -
Placements with local banks 10,617,721 6,629,419 - 5,615,574
Placements with foreign banks 9,319,904 10,309,203 - -
Unrestricted balances with Central banks 10,701,476 5,869,717 - -
103,888,007 108,104,632 146,366 5,817,754
Current 103,888,007 108,104,632 146,366 5,817,754
Non-current - - - -
103,888,007 108,104,632 146,366 5,817,754
(a) Cash and cash equivalents comprise balances with less than three months maturity from the date of acquisition, including cash in hand, deposits held at call with other banks and other short-term highly liquid investments with original maturities less than three months.
(b) Balance with banks outside Nigeria include N16.78 billion (Dec 2016: N22.62 billion) which represents the Naira value of foreign currency amounts held by the Banking subsidiary on behalf of customers in respect of letters of credit transactions. The corresponding liability is included in other liabilities (see note 40).
Notes to the Consolidated and Separate Financial Statementsfor the year ended 31 December 2017 continued
FCMB Group Plc Annual Report and Accounts 2017164
Introduction Operating Review
Corporate Governance
Financial Statements
Shareholder Information
Other National Disclosures
Branches and Account Opening Information
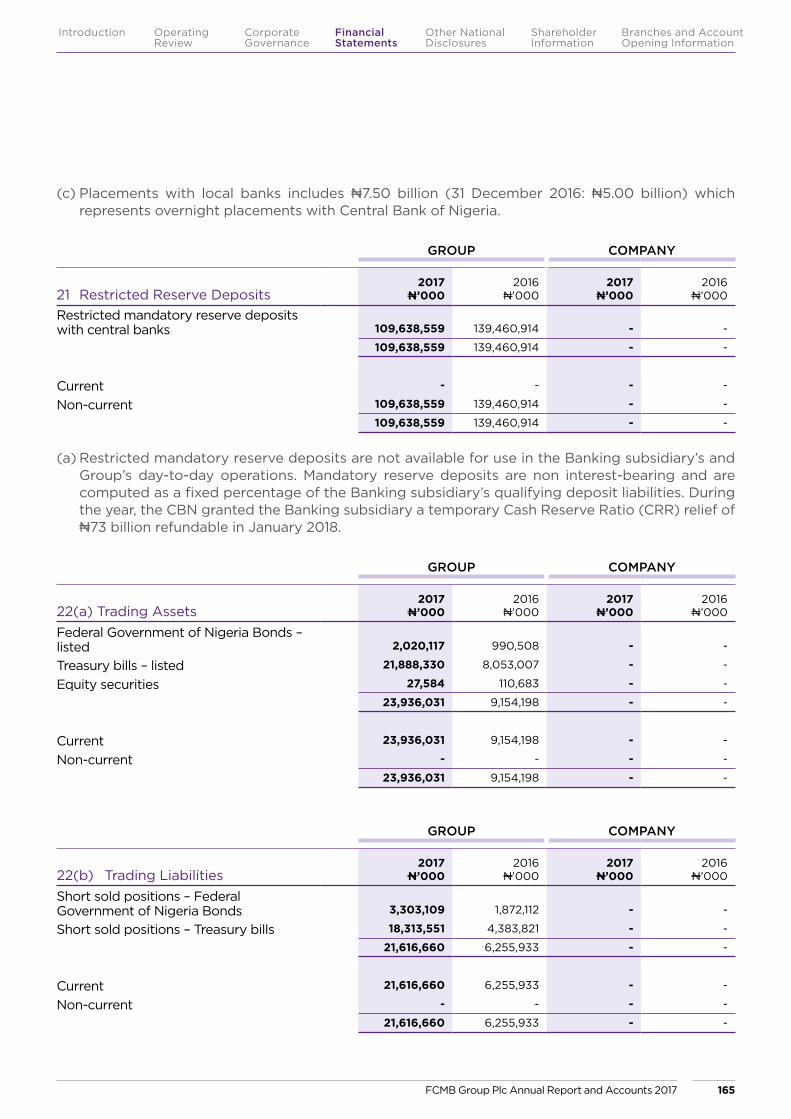
GROUP COMPANY
22(a) Trading Assets2017
N’0002016
N’0002017
N’0002016
N’000
Federal Government of Nigeria Bonds – listed 2,020,117 990,508 - -
Treasury bills – listed 21,888,330 8,053,007 - -
Equity securities 27,584 110,683 - -
23,936,031 9,154,198 - -
Current 23,936,031 9,154,198 - -
Non-current - - - -
23,936,031 9,154,198 - -
GROUP COMPANY
21 Restricted Reserve Deposits2017
N’0002016
N’0002017
N’0002016
N’000
Restricted mandatory reserve deposits with central banks 109,638,559 139,460,914 - -
109,638,559 139,460,914 - -
Current - - - -
Non-current 109,638,559 139,460,914 - -
109,638,559 139,460,914 - -
(a) Restricted mandatory reserve deposits are not available for use in the Banking subsidiary’s and Group’s day-to-day operations. Mandatory reserve deposits are non interest-bearing and are computed as a fixed percentage of the Banking subsidiary’s qualifying deposit liabilities. During the year, the CBN granted the Banking subsidiary a temporary Cash Reserve Ratio (CRR) relief of N73 billion refundable in January 2018.
(c) Placements with local banks includes N7.50 billion (31 December 2016: N5.00 billion) which represents overnight placements with Central Bank of Nigeria.
GROUP COMPANY
22(b) Trading Liabilities2017
N’0002016
N’0002017
N’0002016
N’000
Short sold positions – Federal Government of Nigeria Bonds 3,303,109 1,872,112 - -
Short sold positions – Treasury bills 18,313,551 4,383,821 - -
21,616,660 6,255,933 - -
Current 21,616,660 6,255,933 - -
Non-current - - - -
21,616,660 6,255,933 - -
FCMB Group Plc Annual Report and Accounts 2017 165
Introduction Operating Review
Corporate Governance
Financial Statements
Shareholder Information
Other National Disclosures
Branches and Account Opening Information
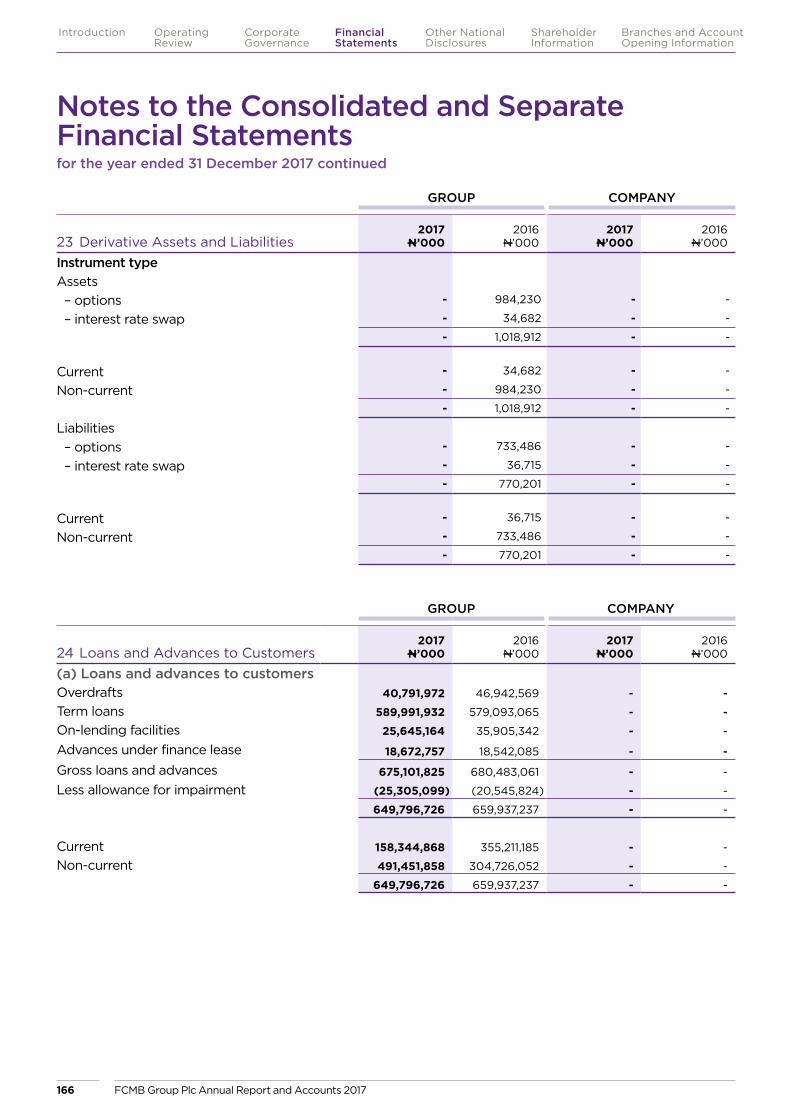
GROUP COMPANY
23 Derivative Assets and Liabilities2017
N’0002016
N’0002017
N’0002016
N’000
Instrument typeAssets– options - 984,230 - -
– interest rate swap - 34,682 - -
- 1,018,912 - -
Current - 34,682 - -
Non-current - 984,230 - -
- 1,018,912 - -
Liabilities– options - 733,486 - -
– interest rate swap - 36,715 - -
- 770,201 - -
Current - 36,715 - -
Non-current - 733,486 - -
- 770,201 - -
GROUP COMPANY
24 Loans and Advances to Customers2017
N’0002016
N’0002017
N’0002016
N’000
(a) Loans and advances to customersOverdrafts 40,791,972 46,942,569 - -
Term loans 589,991,932 579,093,065 - -
On-lending facilities 25,645,164 35,905,342 - -
Advances under finance lease 18,672,757 18,542,085 - -
Gross loans and advances 675,101,825 680,483,061 - -
Less allowance for impairment (25,305,099) (20,545,824) - -
649,796,726 659,937,237 - -
Current 158,344,868 355,211,185 - -
Non-current 491,451,858 304,726,052 - -
649,796,726 659,937,237 - -
Notes to the Consolidated and Separate Financial Statementsfor the year ended 31 December 2017 continued
FCMB Group Plc Annual Report and Accounts 2017166
Introduction Operating Review
Corporate Governance
Financial Statements
Shareholder Information
Other National Disclosures
Branches and Account Opening Information

GROUP
2017 2016
Gross amount
Impairment allowance
Carrying amount
Gross amount
Impairment allowance
Carrying amount
Retail customers:Mortgage lending 2,446,497 (63,370) 2,383,127 2,309,871 (50,082) 2,259,789
Personal loans 88,837,096 (1,886,261) 86,950,835 118,549,418 (7,165,024) 111,384,394
Credit cards 3,736,278 (86,613) 3,649,665 3,296,269 (189,268) 3,107,001
Corporate customers:Finance leases 18,672,757 (394,858) 18,277,899 18,542,085 (640,502) 17,901,583
Other secured lending 561,409,197 (22,873,997) 538,535,200 537,785,418 (12,500,948) 525,284,470
675,101,825 (25,305,099) 649,796,726 680,483,061 (20,545,824) 659,937,237
Retail customers represents loans availed to individuals, unregistered small and medium scale businesses and all other unstructured business ventures; while Corporate customers represents loans availed to corporate bodies and government agencies.
GROUP COMPANY
2017N’000
2016N’000
2017N’000
2016N’000
(b) Finance leasesLoan and advances to customer at amortised cost include the following finance lease:Gross investment:Less than one year 6,021,839 6,600,748 - -
Between one and five years 17,477,878 16,844,892 - -
More than five years 3,377,909 3,151,694 - -
26,877,626 26,597,334 - -
Unearned finance income (8,204,869) (8,055,249) - -
Net investment in finance leases 18,672,757 18,542,085 - -
Less impairment allowance (394,858) (640,502) - -
18,277,899 17,901,583 - -
Net investment in finance leasesNet investment in finance leases, receivables:Less than one year 4,919,672 5,432,213 - -
Between one and five years 11,825,294 11,294,752 - -
More than five years 1,927,791 1,815,120 - -
18,672,757 18,542,085 - -
FCMB Group Plc Annual Report and Accounts 2017 167
Introduction Operating Review
Corporate Governance
Financial Statements
Shareholder Information
Other National Disclosures
Branches and Account Opening Information
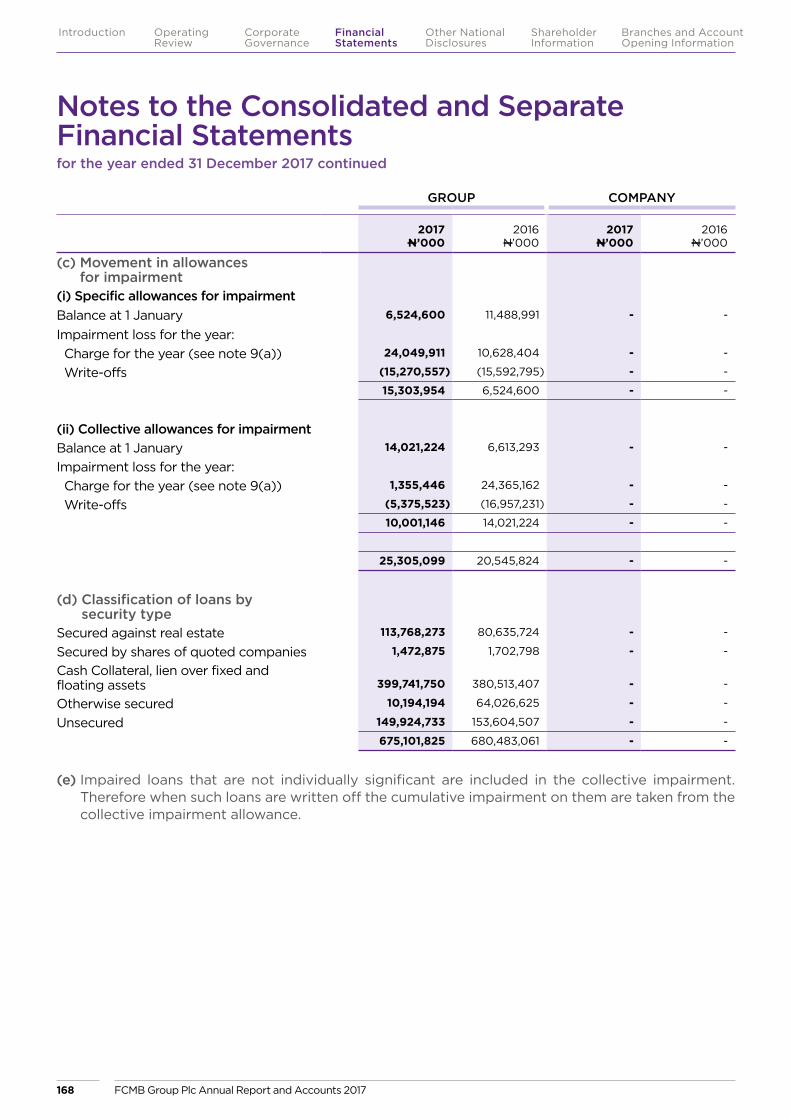
GROUP COMPANY
2017N’000
2016N’000
2017N’000
2016N’000
(c) Movement in allowances for impairment
(i) Specific allowances for impairmentBalance at 1 January 6,524,600 11,488,991 - -
Impairment loss for the year:Charge for the year (see note 9(a)) 24,049,911 10,628,404 - -
Write-offs (15,270,557) (15,592,795) - -
15,303,954 6,524,600 - -
(ii) Collective allowances for impairmentBalance at 1 January 14,021,224 6,613,293 - -
Impairment loss for the year:Charge for the year (see note 9(a)) 1,355,446 24,365,162 - -
Write-offs (5,375,523) (16,957,231) - -
10,001,146 14,021,224 - -
25,305,099 20,545,824 - -
(d) Classification of loans by security type
Secured against real estate 113,768,273 80,635,724 - -
Secured by shares of quoted companies 1,472,875 1,702,798 - -
Cash Collateral, lien over fixed and floating assets 399,741,750 380,513,407 - -
Otherwise secured 10,194,194 64,026,625 - -
Unsecured 149,924,733 153,604,507 - -
675,101,825 680,483,061 - -
(e) Impaired loans that are not individually significant are included in the collective impairment. Therefore when such loans are written off the cumulative impairment on them are taken from the collective impairment allowance.
Notes to the Consolidated and Separate Financial Statementsfor the year ended 31 December 2017 continued
FCMB Group Plc Annual Report and Accounts 2017168
Introduction Operating Review
Corporate Governance
Financial Statements
Shareholder Information
Other National Disclosures
Branches and Account Opening Information
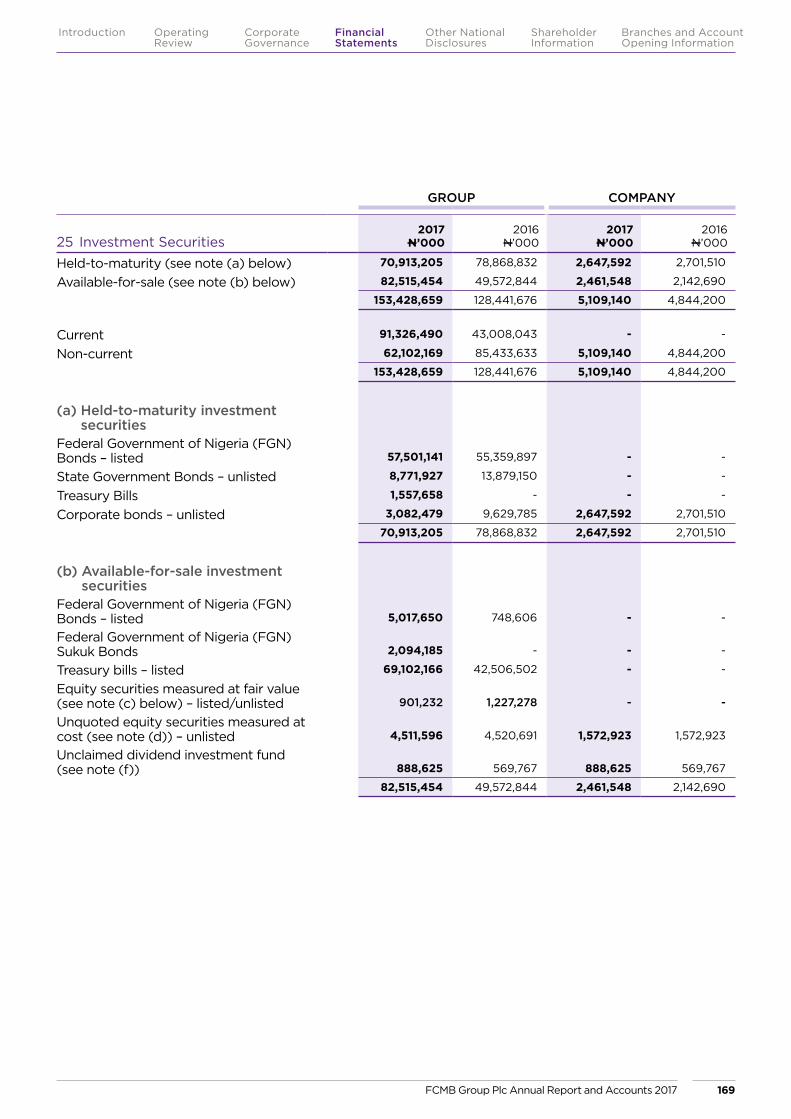
GROUP COMPANY
25 Investment Securities2017
N’0002016
N’0002017
N’0002016
N’000
Held-to-maturity (see note (a) below) 70,913,205 78,868,832 2,647,592 2,701,510
Available-for-sale (see note (b) below) 82,515,454 49,572,844 2,461,548 2,142,690
153,428,659 128,441,676 5,109,140 4,844,200
Current 91,326,490 43,008,043 - -
Non-current 62,102,169 85,433,633 5,109,140 4,844,200
153,428,659 128,441,676 5,109,140 4,844,200
(a) Held-to-maturity investment securities
Federal Government of Nigeria (FGN) Bonds – listed 57,501,141 55,359,897 - -
State Government Bonds – unlisted 8,771,927 13,879,150 - -
Treasury Bills 1,557,658 - - -
Corporate bonds – unlisted 3,082,479 9,629,785 2,647,592 2,701,510
70,913,205 78,868,832 2,647,592 2,701,510
(b) Available-for-sale investment securities
Federal Government of Nigeria (FGN) Bonds – listed 5,017,650 748,606 - -
Federal Government of Nigeria (FGN) Sukuk Bonds 2,094,185 - - -
Treasury bills – listed 69,102,166 42,506,502 - -
Equity securities measured at fair value (see note (c) below) – listed/unlisted 901,232 1,227,278 - -
Unquoted equity securities measured at cost (see note (d)) – unlisted 4,511,596 4,520,691 1,572,923 1,572,923
Unclaimed dividend investment fund (see note (f)) 888,625 569,767 888,625 569,767
82,515,454 49,572,844 2,461,548 2,142,690
FCMB Group Plc Annual Report and Accounts 2017 169
Introduction Operating Review
Corporate Governance
Financial Statements
Shareholder Information
Other National Disclosures
Branches and Account Opening Information
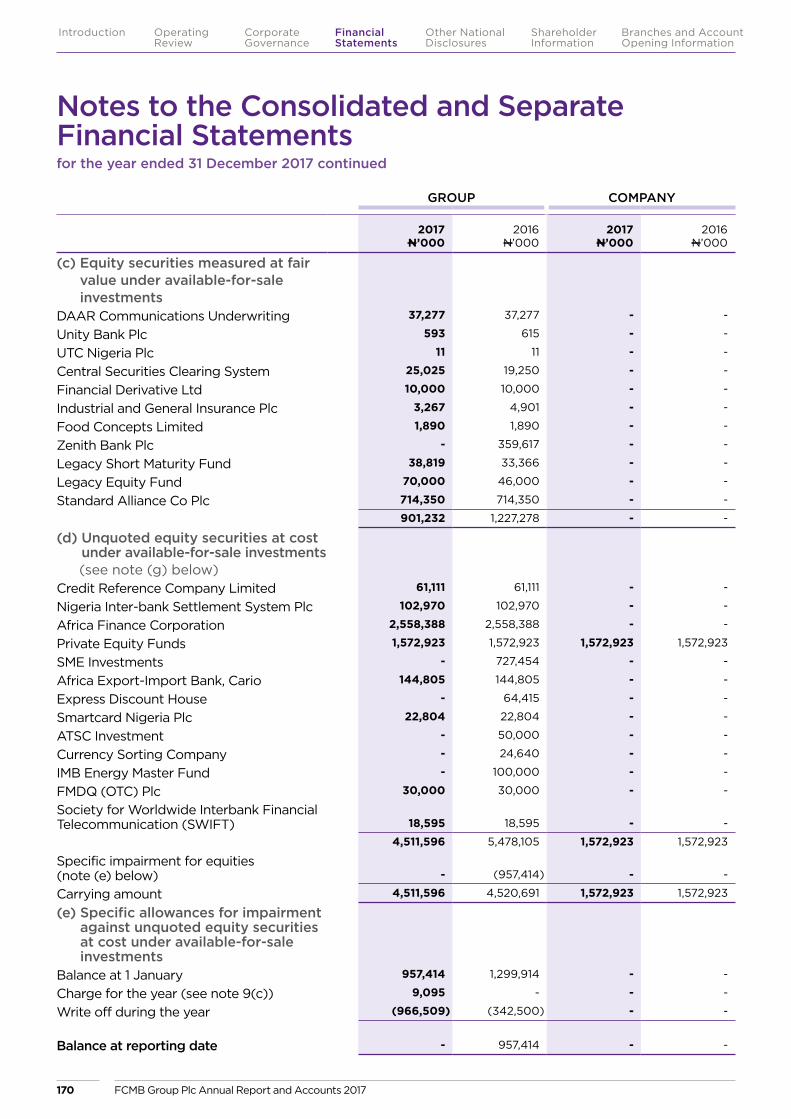
GROUP COMPANY
2017N’000
2016N’000
2017N’000
2016N’000
(c) Equity securities measured at fair value under available-for-sale investments
DAAR Communications Underwriting 37,277 37,277 - -
Unity Bank Plc 593 615 - -
UTC Nigeria Plc 11 11 - -
Central Securities Clearing System 25,025 19,250 - -
Financial Derivative Ltd 10,000 10,000 - -
Industrial and General Insurance Plc 3,267 4,901 - -
Food Concepts Limited 1,890 1,890 - -
Zenith Bank Plc - 359,617 - -
Legacy Short Maturity Fund 38,819 33,366 - -
Legacy Equity Fund 70,000 46,000 - -
Standard Alliance Co Plc 714,350 714,350 - -
901,232 1,227,278 - -
(d) Unquoted equity securities at cost under available-for-sale investments
(see note (g) below) Credit Reference Company Limited 61,111 61,111 - -
Nigeria Inter-bank Settlement System Plc 102,970 102,970 - -
Africa Finance Corporation 2,558,388 2,558,388 - -
Private Equity Funds 1,572,923 1,572,923 1,572,923 1,572,923
SME Investments - 727,454 - -
Africa Export-Import Bank, Cario 144,805 144,805 - -
Express Discount House - 64,415 - -
Smartcard Nigeria Plc 22,804 22,804 - -
ATSC Investment - 50,000 - -
Currency Sorting Company - 24,640 - -
IMB Energy Master Fund - 100,000 - -
FMDQ (OTC) Plc 30,000 30,000 - -
Society for Worldwide Interbank Financial Telecommunication (SWIFT) 18,595 18,595 - -
4,511,596 5,478,105 1,572,923 1,572,923
Specific impairment for equities (note (e) below) - (957,414) - -
Carrying amount 4,511,596 4,520,691 1,572,923 1,572,923
(e) Specific allowances for impairment against unquoted equity securities at cost under available-for-sale investments
Balance at 1 January 957,414 1,299,914 - -
Charge for the year (see note 9(c)) 9,095 - - -
Write off during the year (966,509) (342,500) - -
Balance at reporting date - 957,414 - -
Notes to the Consolidated and Separate Financial Statementsfor the year ended 31 December 2017 continued
FCMB Group Plc Annual Report and Accounts 2017170
Introduction Operating Review
Corporate Governance
Financial Statements
Shareholder Information
Other National Disclosures
Branches and Account Opening Information

(f) In line with the Security and Exchange Commission (SEC) rule, CardinalStone Registrars Limited (Registrars to the Holding Company) , had transferred a total of N685.66 million as the end of the year (2016: N496.95 million) which represented 90% of the total unclaimed dividend under their custody to the Company. The Company earned an income of N130.16 million (2016: N56.62 million) within the year from the investment of the unclaimed dividend.
(g) The available-for-sale investments unquoted equity were measured at cost because the fair value could not be reliably measured.
(h) Movement in investment securities
The movement in investment securities for the Group may be summarised as follows:
GROUP
Equity securities
measured at cost through profit or loss
N’000
Debt securities at
amortised cost
N’000
Debt securities at fair value
through other comprehensive
incomeN’000
Equity securities
at fair value through other
comprehensive incomeN’000
TotalN’000
Balance at 1 January 2017 5,090,458 78,868,832 43,255,108 1,227,278 128,441,676
Exchange differences - (10,386) - - (10,386)
Additions - 20,575,584 99,540,386 - 120,115,970
Disposals (647,651) (25,231,189) (67,787,765) (375,304) (94,041,909)
Gains from changes in fair value recognised in profit or loss - - - - -
Gains from changes in fair value recognised in other comprehensive income - - 1,206,272 49,258 1,255,530
Item reclassified subsequently to profit or loss due to disposal - - - - -
Impairment written off against unquoted equity securities at cost 957,414 - - - 957,414
Interest accrued - 13,020,511 - - 13,020,511
Coupon interest received - (16,310,147) - - (16,310,147)
Balance at 31 December 2017 5,400,221 70,913,205 76,214,001 901,232 153,428,659
Balance at 1 January 2016 5,809,936 86,518,754 40,027,381 2,954,076 135,310,147
Exchange differences - (1,474,304) - - (1,474,304)
Additions 298,534 22,301,096 51,213,124 14,213 73,826,967
Disposals (1,360,512) (28,600,918) (46,282,368) (1,740,374) (77,984,172)
Gains from changes in fair value recognised in profit or loss - - - - -
(Loss)/gains from changes in fair value recognised in other comprehensive income - - (1,703,029) 1,606,650 (96,379)
Item reclassified subsequently to profit or loss due to disposal - - - (1,607,287) (1,607,287)
Impairment written off against unquoted equity securities at cost 342,500 - - - 342,500
Interest accrued - 15,308,815 - - 15,308,815
Coupon interest received - (15,184,611) - - (15,184,611)
Balance at 31 December 2016 5,090,458 78,868,832 43,255,108 1,227,278 128,441,676
FCMB Group Plc Annual Report and Accounts 2017 171
Introduction Operating Review
Corporate Governance
Financial Statements
Shareholder Information
Other National Disclosures
Branches and Account Opening Information

COMPANY
Equity securities
measured at cost through profit or loss
N’000
Debt securities at
amortised cost
N’000
Debt securities at fair value
through other comprehensive
incomeN’000
Equity securities
at fair value through other
comprehensive incomeN’000
TotalN’000
Balance at 1 January 2017 2,142,690 2,701,510 - - 4,844,200
Additions 318,858 - - - 318,858
Disposals - (57,907) - - (57,907)
Interest accrued - 267,780 - 267,780
Coupon interest received - (263,791) - (263,791)
Balance at 31 December 2017 2,461,548 2,647,592 - - 5,109,140
Balance at 1 January 2016 1,844,155 169,466 - - 2,013,621
Additions 298,535 2,442,000 - - 2,740,535
Interest accrued - 189,173 - - 189,173
Coupon interest received - (99,129) - - (99,129)
Balance at 31 December 2016 2,142,690 2,701,510 - - 4,844,200
The movement in investment securities for the Company may be summarised as follows:
GROUP COMPANY
26 Assets Pledged as Collateral2017
N’0002016
N’0002017
N’0002016
N’000
The nature and carrying amounts of the non tradable financial assets pledged as collaterals are as follows:Treasury Bills – listed:– Available for sale 2,442,100 3,827,205 - -
2,442,100 3,827,205 - -
Federal Government of Nigeria (FGN) Bonds – listed:– Available for sale - 1,933,568 - -
– Held to maturity 58,888,057 53,346,359 - -
58,888,057 55,279,927 - -
61,330,157 59,107,132 - -
Current 19,434,482 11,734,482 - -
Non-current 41,895,675 47,372,650 - -
61,330,157 59,107,132 - -
As at the year end, the Group held no collateral, which it was permitted to sell or re-pledge in the absence of default by the owner of the collateral (31 December 2016: nil).
Notes to the Consolidated and Separate Financial Statementsfor the year ended 31 December 2017 continued
FCMB Group Plc Annual Report and Accounts 2017172
Introduction Operating Review
Corporate Governance
Financial Statements
Shareholder Information
Other National Disclosures
Branches and Account Opening Information

GROUP COMPANY
CounterpartiesReasons for pledged securities
2017N’000
2016N’000
2017N’000
2016N’000
Nigeria Inter-bank Settlement Plc (NIBSS)
Cards, POS transactions settlements 2,334,482 2,184,482 - -
Interswitch Nigeria Limited
Cards, POS transactions settlements 292,382 302,382 - -
Federal Inland Revenue Service(FIRS)
Third parties collection transactions 1,595,700 2,554,895 - -
Central Bank of Nigeria (CBN)
Third parties clearing instruments/On-lending facilities to customers 30,405,280 19,547,680 - -
Bank of Industry (BOI) On-lending facilities to customers 6,135,160 15,135,160 - -
System Specs/Remita Remita Transfer Transactions 354,300 - - -
Standard Bank London Borrowed funds repo transactions 20,212,853 17,382,533 - -
Stanbic IBTC Borrowed funds repo transactions - 2,000,000 - -
61,330,157 59,107,132 - -
The assets pledged as collateral were given to the counter parties without transferring the ownership to them. These are held by the counterparty for the term of the transaction being collateralized. These represents pledged assets to these parties;
FCMB Group Plc Annual Report and Accounts 2017 173
Introduction Operating Review
Corporate Governance
Financial Statements
Shareholder Information
Other National Disclosures
Branches and Account Opening Information
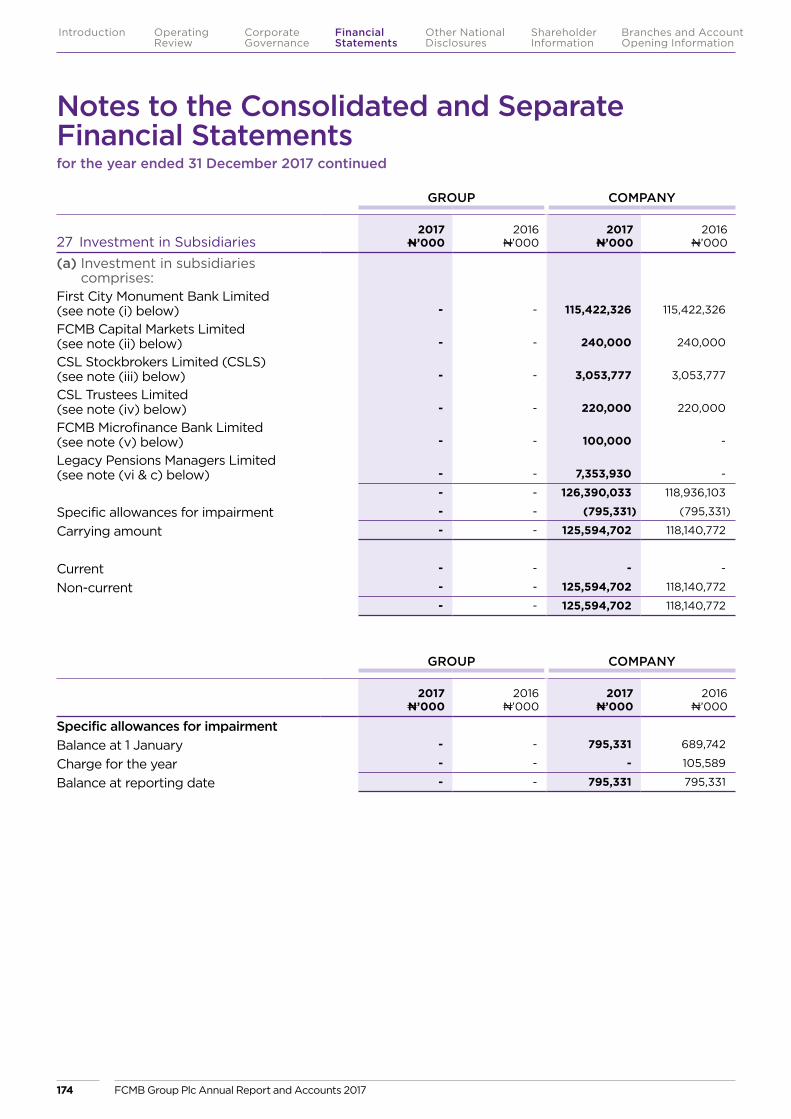
GROUP COMPANY
27 Investment in Subsidiaries2017
N’0002016
N’0002017
N’0002016
N’000
(a) Investment in subsidiaries comprises:
First City Monument Bank Limited (see note (i) below) - - 115,422,326 115,422,326
FCMB Capital Markets Limited (see note (ii) below) - - 240,000 240,000
CSL Stockbrokers Limited (CSLS) (see note (iii) below) - - 3,053,777 3,053,777
CSL Trustees Limited (see note (iv) below) - - 220,000 220,000
FCMB Microfinance Bank Limited (see note (v) below) - - 100,000 -
Legacy Pensions Managers Limited (see note (vi & c) below) - - 7,353,930 -
- - 126,390,033 118,936,103
Specific allowances for impairment - - (795,331) (795,331)
Carrying amount - - 125,594,702 118,140,772
Current - - - -
Non-current - - 125,594,702 118,140,772
- - 125,594,702 118,140,772
GROUP COMPANY
2017N’000
2016N’000
2017N’000
2016N’000
Specific allowances for impairmentBalance at 1 January - - 795,331 689,742
Charge for the year - - - 105,589
Balance at reporting date - - 795,331 795,331
Notes to the Consolidated and Separate Financial Statementsfor the year ended 31 December 2017 continued
FCMB Group Plc Annual Report and Accounts 2017174
Introduction Operating Review
Corporate Governance
Financial Statements
Shareholder Information
Other National Disclosures
Branches and Account Opening Information
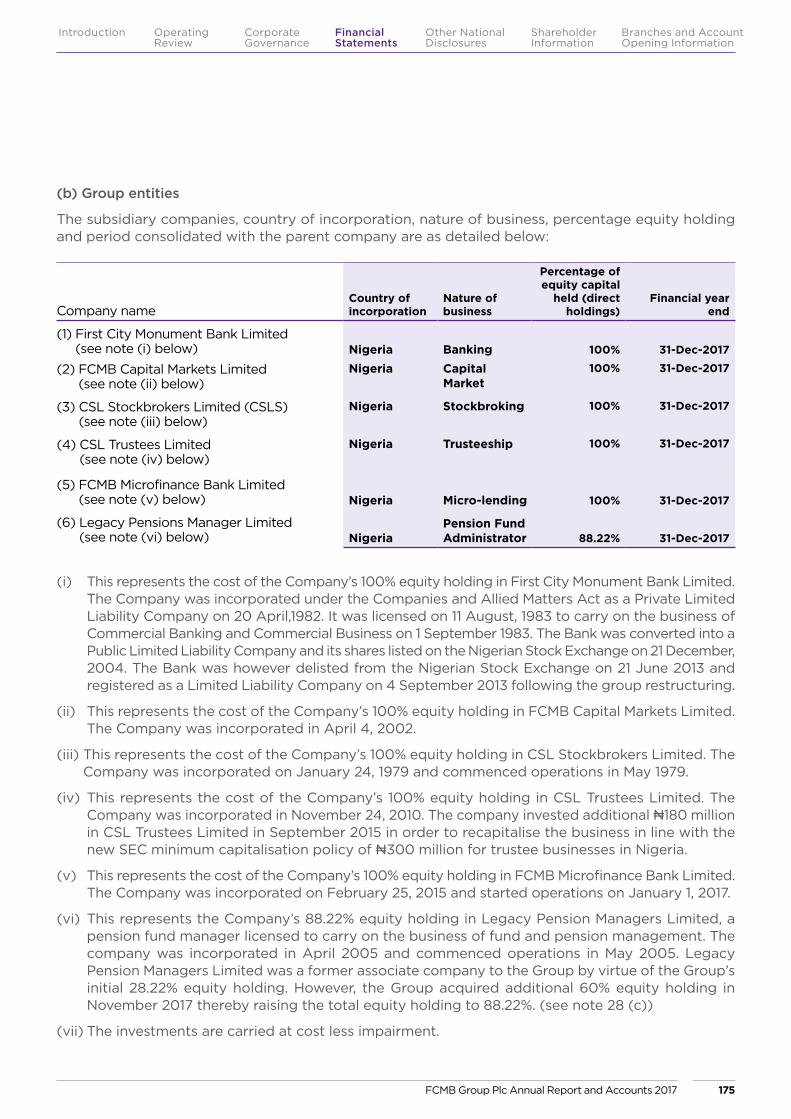
Company nameCountry of incorporation
Nature of business
Percentage of equity capital
held (direct holdings)
Financial year end
(1) First City Monument Bank Limited (see note (i) below) Nigeria Banking 100% 31-Dec-2017
(2) FCMB Capital Markets Limited (see note (ii) below)
Nigeria Capital Market
100% 31-Dec-2017
(3) CSL Stockbrokers Limited (CSLS) (see note (iii) below)
Nigeria Stockbroking 100% 31-Dec-2017
(4) CSL Trustees Limited (see note (iv) below)
Nigeria Trusteeship 100% 31-Dec-2017
(5) FCMB Microfinance Bank Limited (see note (v) below) Nigeria Micro-lending 100% 31-Dec-2017
(6) Legacy Pensions Manager Limited (see note (vi) below) Nigeria
Pension Fund Administrator 88.22% 31-Dec-2017
(b) Group entities
The subsidiary companies, country of incorporation, nature of business, percentage equity holding and period consolidated with the parent company are as detailed below:
(i) This represents the cost of the Company’s 100% equity holding in First City Monument Bank Limited. The Company was incorporated under the Companies and Allied Matters Act as a Private Limited Liability Company on 20 April,1982. It was licensed on 11 August, 1983 to carry on the business of Commercial Banking and Commercial Business on 1 September 1983. The Bank was converted into a Public Limited Liability Company and its shares listed on the Nigerian Stock Exchange on 21 December, 2004. The Bank was however delisted from the Nigerian Stock Exchange on 21 June 2013 and registered as a Limited Liability Company on 4 September 2013 following the group restructuring.
(ii) This represents the cost of the Company’s 100% equity holding in FCMB Capital Markets Limited. The Company was incorporated in April 4, 2002.
(iii) This represents the cost of the Company’s 100% equity holding in CSL Stockbrokers Limited. The Company was incorporated on January 24, 1979 and commenced operations in May 1979.
(iv) This represents the cost of the Company’s 100% equity holding in CSL Trustees Limited. The Company was incorporated in November 24, 2010. The company invested additional N180 million in CSL Trustees Limited in September 2015 in order to recapitalise the business in line with the new SEC minimum capitalisation policy of N300 million for trustee businesses in Nigeria.
(v) This represents the cost of the Company’s 100% equity holding in FCMB Microfinance Bank Limited. The Company was incorporated on February 25, 2015 and started operations on January 1, 2017.
(vi) This represents the Company’s 88.22% equity holding in Legacy Pension Managers Limited, a pension fund manager licensed to carry on the business of fund and pension management. The company was incorporated in April 2005 and commenced operations in May 2005. Legacy Pension Managers Limited was a former associate company to the Group by virtue of the Group’s initial 28.22% equity holding. However, the Group acquired additional 60% equity holding in November 2017 thereby raising the total equity holding to 88.22%. (see note 28 (c))
(vii) The investments are carried at cost less impairment.
FCMB Group Plc Annual Report and Accounts 2017 175
Introduction Operating Review
Corporate Governance
Financial Statements
Shareholder Information
Other National Disclosures
Branches and Account Opening Information
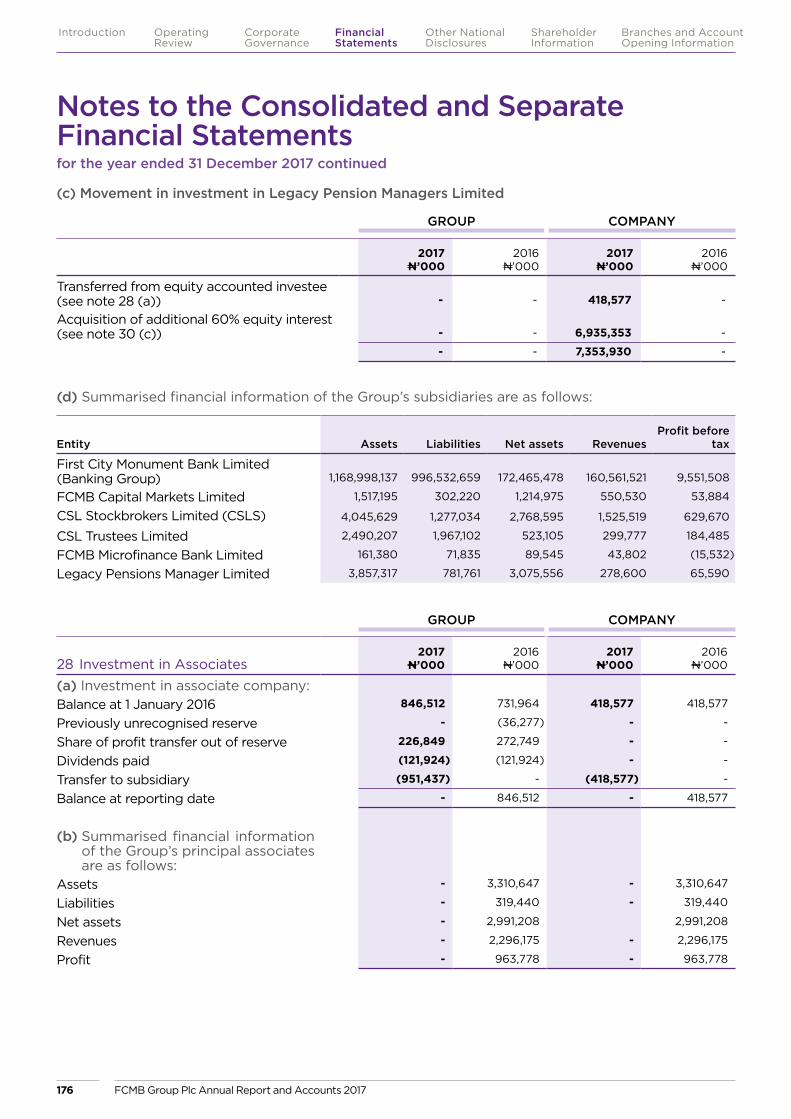
(c) Movement in investment in Legacy Pension Managers Limited
GROUP COMPANY
2017N’000
2016N’000
2017N’000
2016N’000
Transferred from equity accounted investee (see note 28 (a)) - - 418,577 -
Acquisition of additional 60% equity interest (see note 30 (c)) - - 6,935,353 -
- - 7,353,930 -
(d) Summarised financial information of the Group’s subsidiaries are as follows:
Entity Assets Liabilities Net assets RevenuesProfit before
tax
First City Monument Bank Limited (Banking Group) 1,168,998,137 996,532,659 172,465,478 160,561,521 9,551,508
FCMB Capital Markets Limited 1,517,195 302,220 1,214,975 550,530 53,884
CSL Stockbrokers Limited (CSLS) 4,045,629 1,277,034 2,768,595 1,525,519 629,670
CSL Trustees Limited 2,490,207 1,967,102 523,105 299,777 184,485
FCMB Microfinance Bank Limited 161,380 71,835 89,545 43,802 (15,532)
Legacy Pensions Manager Limited 3,857,317 781,761 3,075,556 278,600 65,590
GROUP COMPANY
28 Investment in Associates2017
N’0002016
N’0002017
N’0002016
N’000
(a) Investment in associate company:Balance at 1 January 2016 846,512 731,964 418,577 418,577
Previously unrecognised reserve - (36,277) - -
Share of profit transfer out of reserve 226,849 272,749 - -
Dividends paid (121,924) (121,924) - -
Transfer to subsidiary (951,437) - (418,577) -
Balance at reporting date - 846,512 - 418,577
(b) Summarised financial information of the Group’s principal associates are as follows:
Assets - 3,310,647 - 3,310,647
Liabilities - 319,440 - 319,440
Net assets - 2,991,208 2,991,208
Revenues - 2,296,175 - 2,296,175
Profit - 963,778 - 963,778
Notes to the Consolidated and Separate Financial Statementsfor the year ended 31 December 2017 continued
FCMB Group Plc Annual Report and Accounts 2017176
Introduction Operating Review
Corporate Governance
Financial Statements
Shareholder Information
Other National Disclosures
Branches and Account Opening Information
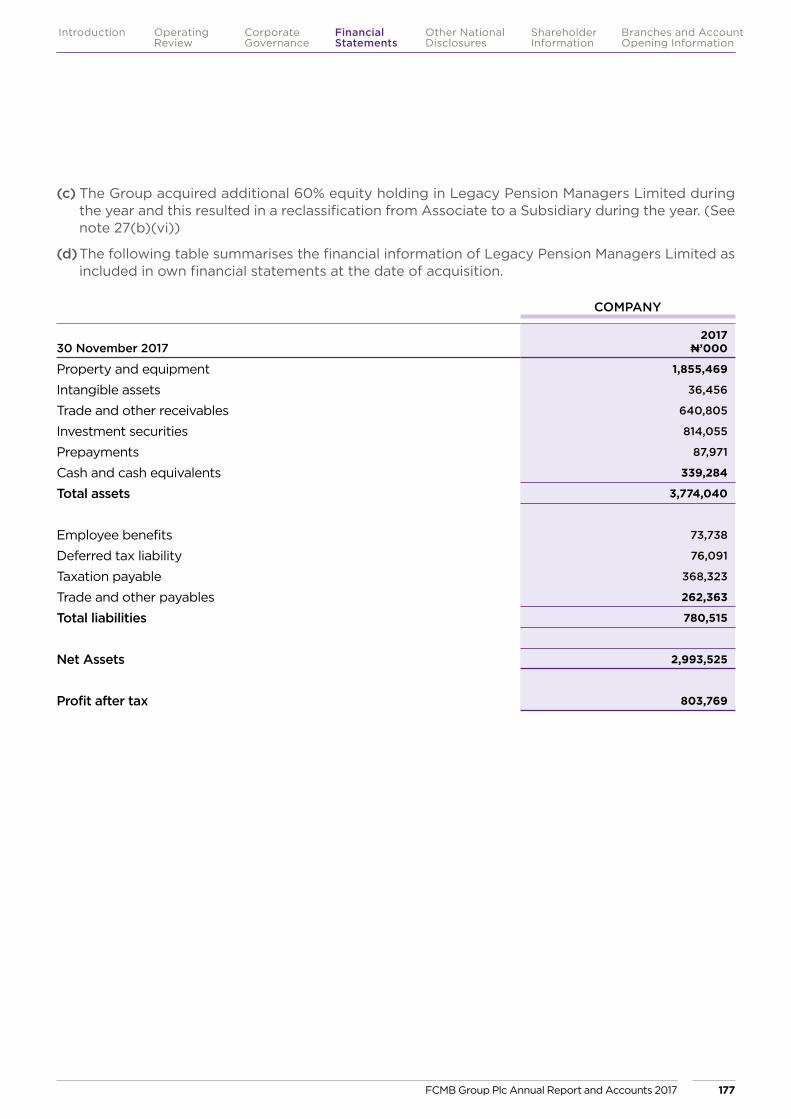
COMPANY
30 November 20172017
N’000
Property and equipment 1,855,469
Intangible assets 36,456
Trade and other receivables 640,805
Investment securities 814,055
Prepayments 87,971
Cash and cash equivalents 339,284
Total assets 3,774,040
Employee benefits 73,738
Deferred tax liability 76,091
Taxation payable 368,323
Trade and other payables 262,363
Total liabilities 780,515
Net Assets 2,993,525
Profit after tax 803,769
(c) The Group acquired additional 60% equity holding in Legacy Pension Managers Limited during the year and this resulted in a reclassification from Associate to a Subsidiary during the year. (See note 27(b)(vi))
(d) The following table summarises the financial information of Legacy Pension Managers Limited as included in own financial statements at the date of acquisition.
FCMB Group Plc Annual Report and Accounts 2017 177
Introduction Operating Review
Corporate Governance
Financial Statements
Shareholder Information
Other National Disclosures
Branches and Account Opening Information
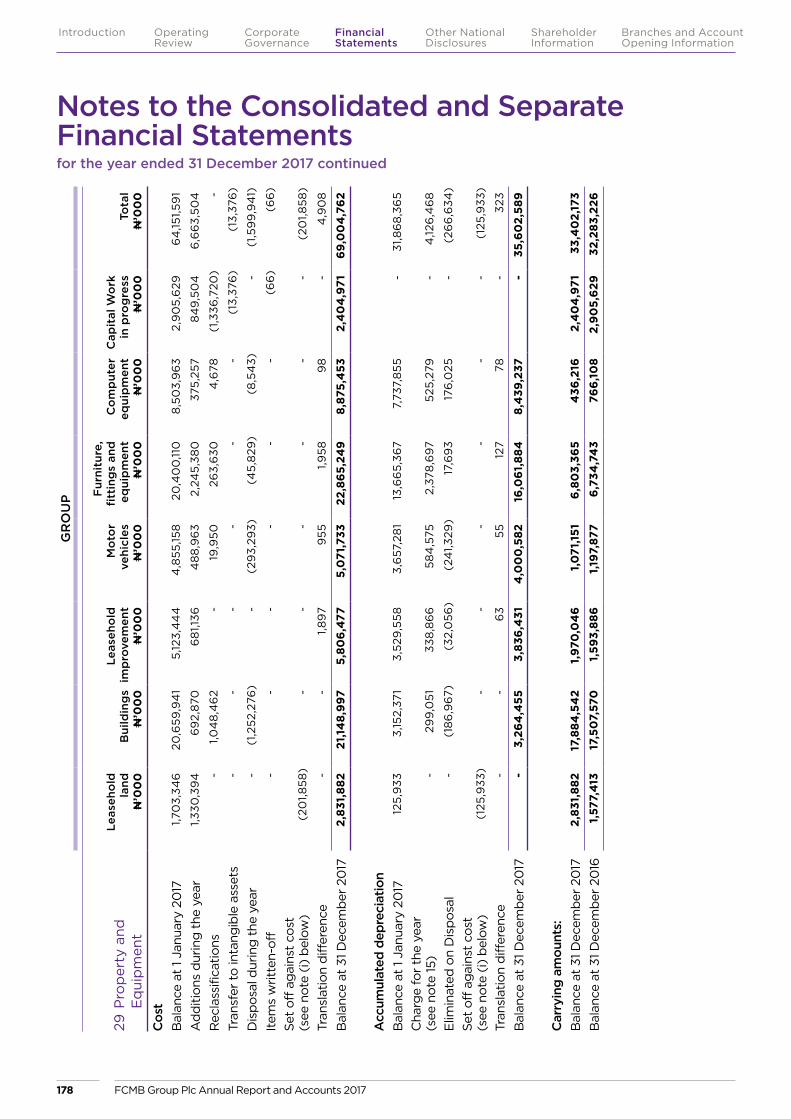
GR
OU
P
29 P
rop
erty
and
E
qui
pm
ent
Lea
seho
ld
land
N’0
00
B
uild
ing
s N
’00
0
Lea
seho
ld
imp
rove
men
t N
’00
0
Mo
tor
vehi
cles
N
’00
0
Fur
nitu
re,
fitt
ing
s an
d
equi
pm
ent
N’0
00
Co
mp
uter
eq
uip
men
t N
’00
0
Cap
ital
Wo
rk
in p
rog
ress
N
’00
0To
tal
N’0
00
Cos
t B
alan
ce a
t 1 J
anua
ry 2
017
1,70
3,34
620
,659
,94
15,
123,
44
44
,855
,158
20,4
00
,110
8,5
03,
96
32,
90
5,6
296
4,15
1,59
1
Ad
diti
ons
dur
ing
the
yea
r1,3
30,3
94
69
2,8
706
81,1
364
88
,96
32,
245,
380
375,
257
84
9,5
04
6,6
63,
504
Rec
lass
ifica
tions
-
1,0
48
,46
2 -
19
,950
263,
630
4,6
78(1
,336
,720
) -
Tran
sfer
to
inta
ngib
le a
sset
s -
-
-
-
-
-
(1
3,37
6)
(13,
376
)
Dis
pos
al d
urin
g t
he y
ear
-
(1,2
52,2
76)
-
(29
3,29
3)(4
5,8
29)
(8,5
43)
-
(1,5
99
,94
1)
Item
s w
ritte
n-of
f -
-
-
-
-
-
(6
6)
(66
)
Set
off a
gai
nst
cost
(s
ee n
ote
(i)
bel
ow)
(20
1,858
) -
-
-
-
-
-
(2
01,8
58)
Tran
slat
ion
diff
eren
ce -
-
1,8
97
955
1,958
98
-
4,9
08
Bal
ance
at
31 D
ecem
ber
20
172,
831,
882
21,1
48,
997
5,80
6,4
775,
071
,733
22,8
65,
249
8,87
5,4
532,
40
4,9
7169
,00
4,7
62
Acc
umul
ated
dep
reci
atio
nB
alan
ce a
t 1 J
anua
ry 2
017
125,
933
3,15
2,37
13,
529
,558
3,6
57,2
81
13,6
65,
367
7,73
7,8
55 -
31
,86
8,3
65
Cha
rge
for
the
year
(s
ee n
ote
15)
-
299
,051
338
,86
658
4,5
752,
378
,69
752
5,27
9 -
4
,126
,46
8
Elim
inat
ed o
n D
isp
osal
-
(18
6,9
67)
(32,
056
)(2
41,3
29)
17,6
93
176
,025
-
(2
66
,634
)
Set
off a
gai
nst
cost
(s
ee n
ote
(i)
bel
ow)
(125
,933
) -
-
-
-
-
-
(1
25,9
33)
Tran
slat
ion
diff
eren
ce -
-
6
355
127
78 -
32
3
Bal
ance
at
31 D
ecem
ber
20
17 -
3,
264
,455
3,83
6,4
314
,00
0,5
8216
,061
,884
8,4
39,2
37 -
35
,60
2,58
9
Car
ryin
g am
ount
s:B
alan
ce a
t 31
Dec
emb
er 2
017
2,83
1,88
217
,884
,54
21,
970
,04
61,
071
,151
6,8
03,
365
436
,216
2,4
04
,971
33,4
02,
173
Bal
ance
at
31 D
ecem
ber
20
161,
577,
413
17,5
07,
570
1,59
3,88
61,
197,
877
6,7
34,7
43
766
,10
82,
90
5,6
2932
,283
,226
Notes to the Consolidated and Separate Financial Statementsfor the year ended 31 December 2017 continued
FCMB Group Plc Annual Report and Accounts 2017178
Introduction Operating Review
Corporate Governance
Financial Statements
Shareholder Information
Other National Disclosures
Branches and Account Opening Information
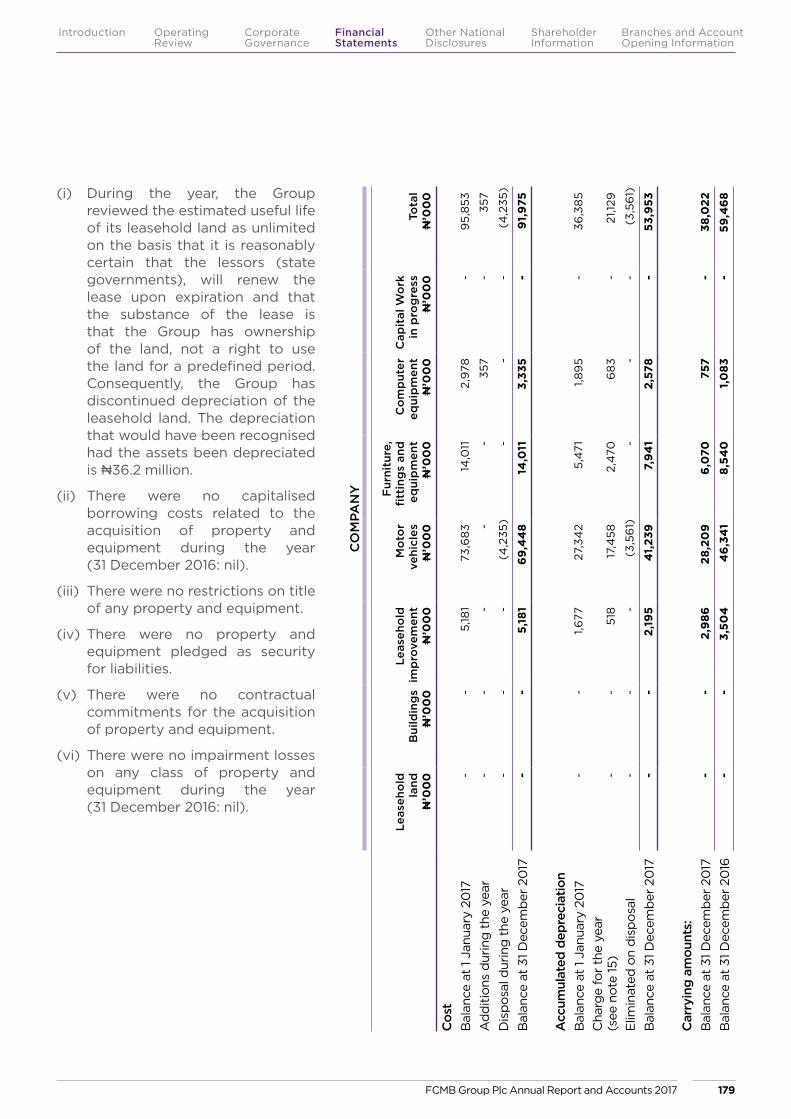
(i) During the year, the Group reviewed the estimated useful life of its leasehold land as unlimited on the basis that it is reasonably certain that the lessors (state governments), will renew the lease upon expiration and that the substance of the lease is that the Group has ownership of the land, not a right to use the land for a predefined period. Consequently, the Group has discontinued depreciation of the leasehold land. The depreciation that would have been recognised had the assets been depreciated is N36.2 million.
(ii) There were no capitalised borrowing costs related to the acquisition of property and equipment during the year (31 December 2016: nil).
(iii) There were no restrictions on title of any property and equipment.
(iv) There were no property and equipment pledged as security for liabilities.
(v) There were no contractual commitments for the acquisition of property and equipment.
(vi) There were no impairment losses on any class of property and equipment during the year (31 December 2016: nil).
CO
MPA
NY
Lea
seho
ld
land
N’0
00
B
uild
ing
s N
’00
0
Lea
seho
ld
imp
rove
men
t N
’00
0
Mo
tor
vehi
cles
N
’00
0
Fur
nitu
re,
fitt
ing
s an
d
equi
pm
ent
N’0
00
Co
mp
uter
eq
uip
men
t N
’00
0
Cap
ital
Wo
rk
in p
rog
ress
N
’00
0To
tal
N’0
00
Cos
t B
alan
ce a
t 1 J
anua
ry 2
017
-
-
5,18
173
,68
314
,011
2,9
78 -
9
5,8
53
Ad
diti
ons
dur
ing
the
yea
r -
-
-
-
-
35
7 -
35
7
Dis
pos
al d
urin
g t
he y
ear
-
-
-
(4,2
35)
-
-
-
(4,2
35)
Bal
ance
at
31 D
ecem
ber
20
17 -
-
5,
181
69,4
48
14,0
113,
335
-
91,
975
Acc
umul
ated
dep
reci
atio
nB
alan
ce a
t 1 J
anua
ry 2
017
-
-
1,677
27,3
42
5,4
711,8
95
-
36,3
85
Cha
rge
for
the
year
(s
ee n
ote
15)
-
-
518
17,4
582,
470
68
3 -
21
,129
Elim
inat
ed o
n d
isp
osal
-
-
-
(3,5
61)
-
-
-
(3,5
61)
Bal
ance
at
31 D
ecem
ber
20
17 -
-
2,
195
41,
239
7,9
41
2,57
8 -
53
,953
Car
ryin
g am
ount
s:B
alan
ce a
t 31
Dec
emb
er 2
017
-
-
2,9
8628
,20
96
,070
757
-
38,0
22
Bal
ance
at
31 D
ecem
ber
20
16 -
-
3,
504
46
,34
18,
540
1,0
83 -
5
9,4
68
FCMB Group Plc Annual Report and Accounts 2017 179
Introduction Operating Review
Corporate Governance
Financial Statements
Shareholder Information
Other National Disclosures
Branches and Account Opening Information
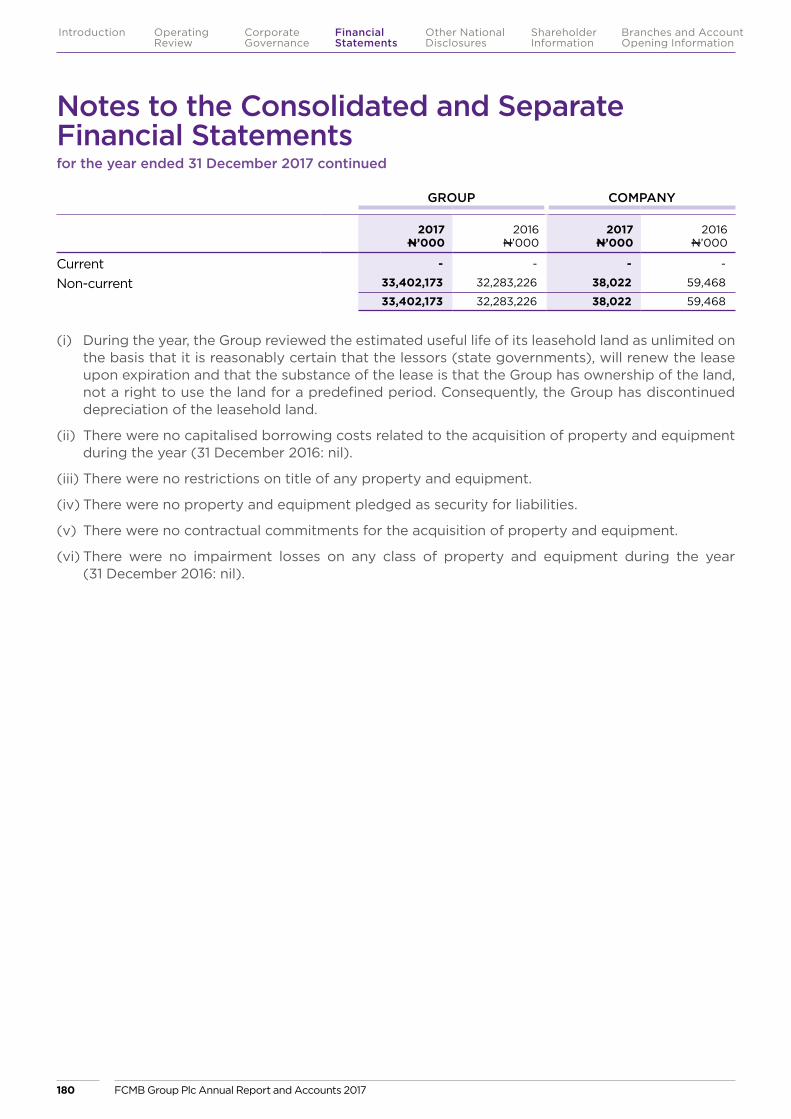
GROUP COMPANY
2017N’000
2016N’000
2017N’000
2016N’000
Current - - - -
Non-current 33,402,173 32,283,226 38,022 59,468
33,402,173 32,283,226 38,022 59,468
(i) During the year, the Group reviewed the estimated useful life of its leasehold land as unlimited on the basis that it is reasonably certain that the lessors (state governments), will renew the lease upon expiration and that the substance of the lease is that the Group has ownership of the land, not a right to use the land for a predefined period. Consequently, the Group has discontinued depreciation of the leasehold land.
(ii) There were no capitalised borrowing costs related to the acquisition of property and equipment during the year (31 December 2016: nil).
(iii) There were no restrictions on title of any property and equipment.
(iv) There were no property and equipment pledged as security for liabilities.
(v) There were no contractual commitments for the acquisition of property and equipment.
(vi) There were no impairment losses on any class of property and equipment during the year (31 December 2016: nil).
Notes to the Consolidated and Separate Financial Statementsfor the year ended 31 December 2017 continued
FCMB Group Plc Annual Report and Accounts 2017180
Introduction Operating Review
Corporate Governance
Financial Statements
Shareholder Information
Other National Disclosures
Branches and Account Opening Information
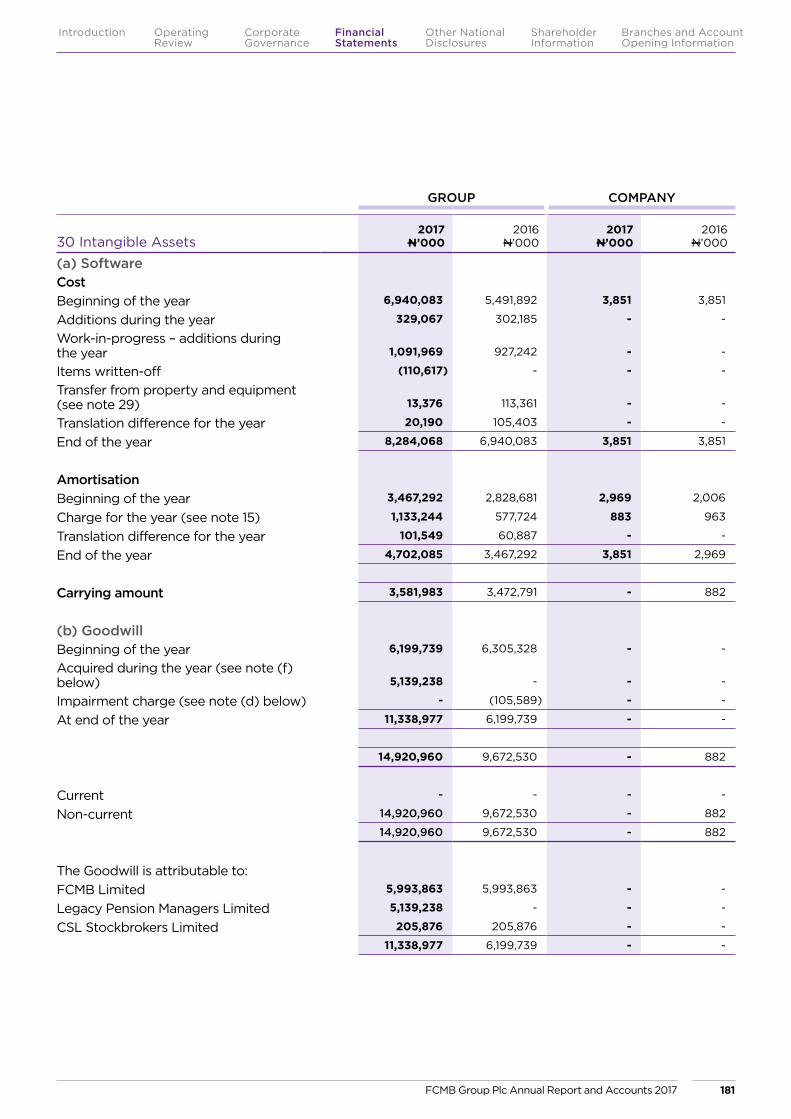
GROUP COMPANY
30 Intangible Assets2017
N’0002016
N’0002017
N’0002016
N’000
(a) SoftwareCostBeginning of the year 6,940,083 5,491,892 3,851 3,851
Additions during the year 329,067 302,185 - -
Work-in-progress – additions during the year 1,091,969 927,242 - -
Items written-off (110,617) - - -
Transfer from property and equipment (see note 29) 13,376 113,361 - -
Translation difference for the year 20,190 105,403 - -
End of the year 8,284,068 6,940,083 3,851 3,851
AmortisationBeginning of the year 3,467,292 2,828,681 2,969 2,006
Charge for the year (see note 15) 1,133,244 577,724 883 963
Translation difference for the year 101,549 60,887 - -
End of the year 4,702,085 3,467,292 3,851 2,969
Carrying amount 3,581,983 3,472,791 - 882
(b) GoodwillBeginning of the year 6,199,739 6,305,328 - -
Acquired during the year (see note (f) below) 5,139,238 - - -
Impairment charge (see note (d) below) - (105,589) - -
At end of the year 11,338,977 6,199,739 - -
14,920,960 9,672,530 - 882
Current - - - -
Non-current 14,920,960 9,672,530 - 882
14,920,960 9,672,530 - 882
The Goodwill is attributable to:FCMB Limited 5,993,863 5,993,863 - -
Legacy Pension Managers Limited 5,139,238 - - -
CSL Stockbrokers Limited 205,876 205,876 - -
11,338,977 6,199,739 - -
FCMB Group Plc Annual Report and Accounts 2017 181
Introduction Operating Review
Corporate Governance
Financial Statements
Shareholder Information
Other National Disclosures
Branches and Account Opening Information

N’000
Consideration transferred (cash) (see note 27 (c)) 6,935,353
Pre-existing interest in Legacy Pension Managers Limited 844,868
Total Consideration 7,780,221
Non-controlling interest, based on their proportionate interest in the recognised amounts of the assets and liabilities of Legacy Pension 352,542
Identifiable net assets as at 30 November 2017 (see note 28 (d)) (2,993,525)
Goodwill 5,139,238
(c) Acquisition of Legacy Pension Managers Limited
Goodwill arising from the acquisition has been recognised as follows;
(d) Goodwill is reviewed annually or more frequently for impairment when there are objective indicators that impairment may have occurred by comparing the carrying value to its recoverable amount. The recoverable amount has been calculated based on the value in use of the Cash Generating Units (CGUs), determined by discounting the future cashflows expected to be generated from the continuing use of the CGUs assets and their ultimate disposal. No Impairment charge was taken during the year (2016: N105.59 million) because the recoverable amount of these CGUs were determined to be higher than the carrying amounts.
The key assumptions used in the calculation of value in use were as follows:
(e) For Legacy Pension Managers Limited and CSL Stockbrokers Limited, the discount rate was a post-tax measure derived using the capital asset pricing model (CAPM) approach and that reflects the inherent risks of the specific CGU.
The discount rate for FCMB Limited was a pre-tax measure based on the rate of the Bank’s year 2020 Naira bond issued in the relevant market and in the same currency as the cash flows, adjusted for a risk premium to reflect the systematic risk of the specific CGU.
Three years of cash flows were included in the discounted cash flow model. The terminal growth rate was derived from the average GDP growth rate of Nigeria from 1982 to 2017.
Forecast profit before taxes was based on expectations of future outcomes taking into account past experience, adjusted for the anticipated revenue growth. Revenue growth was projected taking into account the average growth levels experienced over the past four years and the estimated growth for the next three years.
Legacy Pension Limited CSL Stockbrokers Limited FCMB Limited
31 December 2017
31 December 2016
31 December 2017
31 December 2016
31 December 2017
31 December 2016
Discount rate (see note (d)) 26.50% - 26.50% 23.50% 16.16% 18.29%
Terminal growth rate 4.50% - 3.00% 3.00% 3.93% 3.00%
Forecast profit before taxes (average of next 5 years)
N4.039 billion -
N1.392 billion
N907.8 million
N19.03 billion
N16.26 billion
Notes to the Consolidated and Separate Financial Statementsfor the year ended 31 December 2017 continued
FCMB Group Plc Annual Report and Accounts 2017182
Introduction Operating Review
Corporate Governance
Financial Statements
Shareholder Information
Other National Disclosures
Branches and Account Opening Information
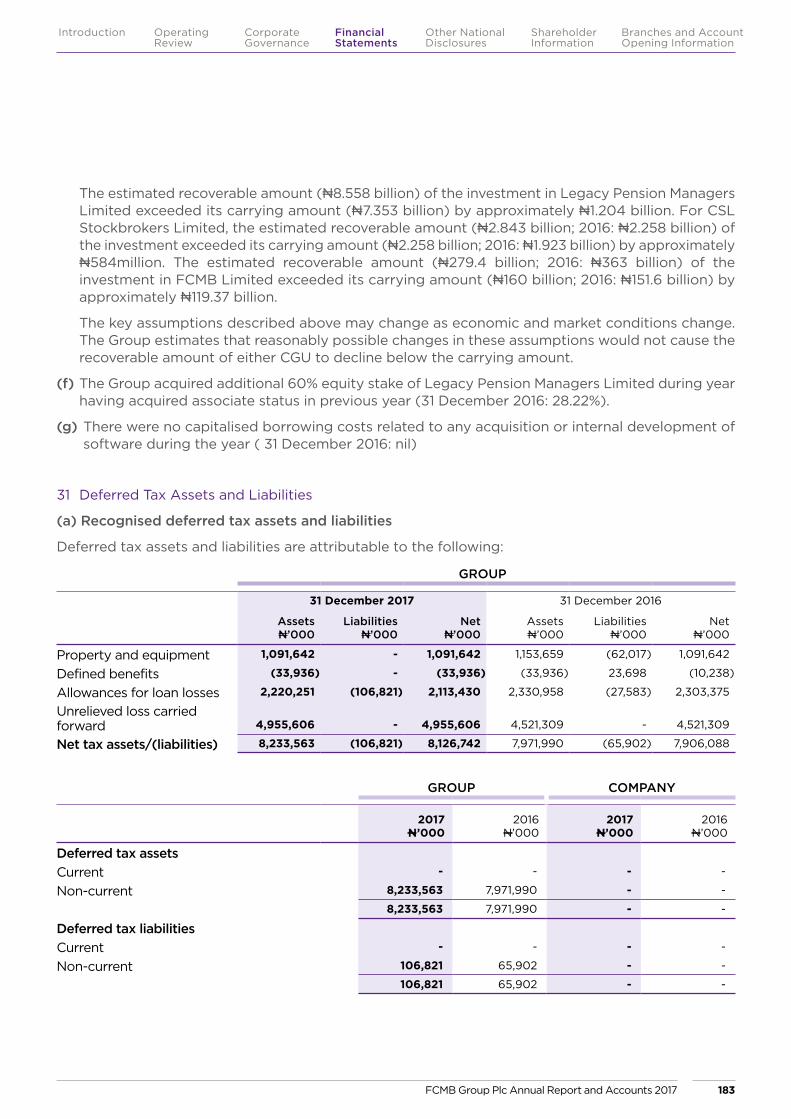
The estimated recoverable amount (N8.558 billion) of the investment in Legacy Pension Managers Limited exceeded its carrying amount (N7.353 billion) by approximately N1.204 billion. For CSL Stockbrokers Limited, the estimated recoverable amount (N2.843 billion; 2016: N2.258 billion) of the investment exceeded its carrying amount (N2.258 billion; 2016: N1.923 billion) by approximately N584million. The estimated recoverable amount (N279.4 billion; 2016: N363 billion) of the investment in FCMB Limited exceeded its carrying amount (N160 billion; 2016: N151.6 billion) by approximately N119.37 billion.
The key assumptions described above may change as economic and market conditions change. The Group estimates that reasonably possible changes in these assumptions would not cause the recoverable amount of either CGU to decline below the carrying amount.
(f) The Group acquired additional 60% equity stake of Legacy Pension Managers Limited during year having acquired associate status in previous year (31 December 2016: 28.22%).
(g) There were no capitalised borrowing costs related to any acquisition or internal development of software during the year ( 31 December 2016: nil)
GROUP
31 December 2017 31 December 2016
AssetsN’000
LiabilitiesN’000
NetN’000
Assets N’000
LiabilitiesN’000
NetN’000
Property and equipment 1,091,642 - 1,091,642 1,153,659 (62,017) 1,091,642
Defined benefits (33,936) - (33,936) (33,936) 23,698 (10,238)
Allowances for loan losses 2,220,251 (106,821) 2,113,430 2,330,958 (27,583) 2,303,375
Unrelieved loss carried forward 4,955,606 - 4,955,606 4,521,309 - 4,521,309
Net tax assets/(liabilities) 8,233,563 (106,821) 8,126,742 7,971,990 (65,902) 7,906,088
31 Deferred Tax Assets and Liabilities
(a) Recognised deferred tax assets and liabilities
Deferred tax assets and liabilities are attributable to the following:
GROUP COMPANY
2017N’000
2016N’000
2017N’000
2016N’000
Deferred tax assetsCurrent - - - -
Non-current 8,233,563 7,971,990 - -
8,233,563 7,971,990 - -
Deferred tax liabilitiesCurrent - - - -
Non-current 106,821 65,902 - -
106,821 65,902 - -
FCMB Group Plc Annual Report and Accounts 2017 183
Introduction Operating Review
Corporate Governance
Financial Statements
Shareholder Information
Other National Disclosures
Branches and Account Opening Information
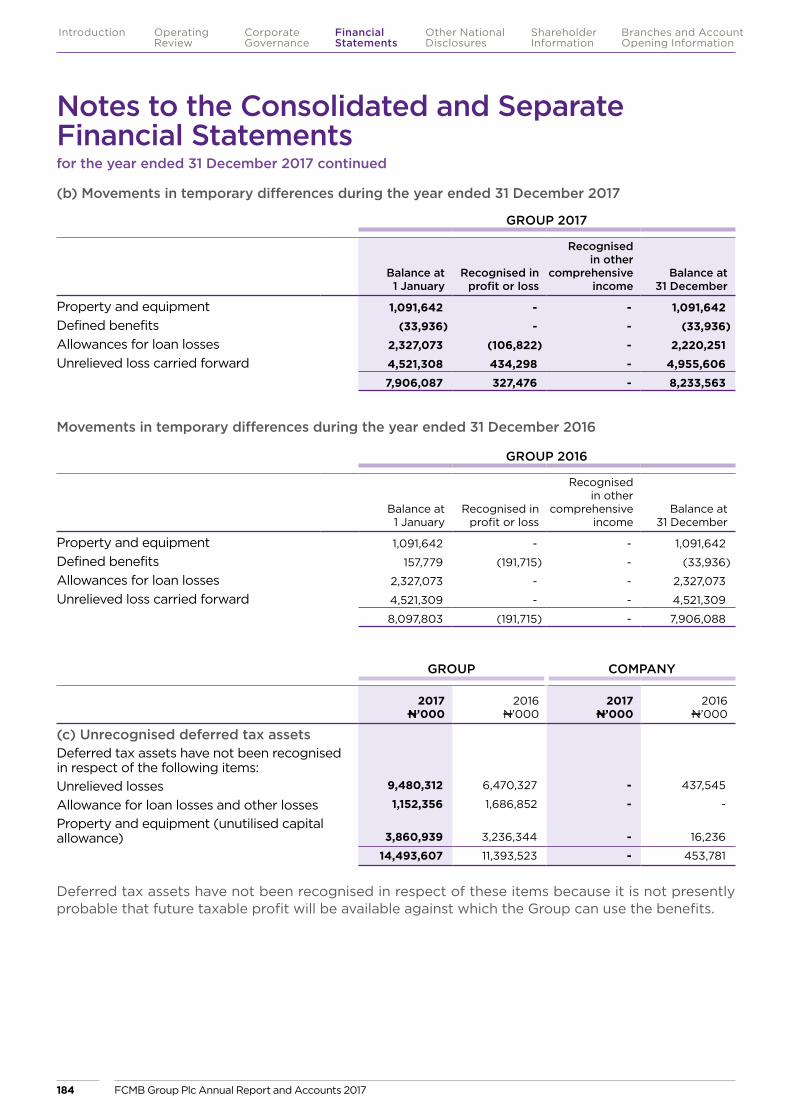
(b) Movements in temporary differences during the year ended 31 December 2017
Movements in temporary differences during the year ended 31 December 2016
GROUP 2017
Balance at 1 January
Recognised in profit or loss
Recognised in other
comprehensive income
Balance at 31 December
Property and equipment 1,091,642 - - 1,091,642Defined benefits (33,936) - - (33,936)Allowances for loan losses 2,327,073 (106,822) - 2,220,251Unrelieved loss carried forward 4,521,308 434,298 - 4,955,606
7,906,087 327,476 - 8,233,563
GROUP 2016
Balance at 1 January
Recognised in profit or loss
Recognised in other
comprehensive income
Balance at 31 December
Property and equipment 1,091,642 - - 1,091,642
Defined benefits 157,779 (191,715) - (33,936)
Allowances for loan losses 2,327,073 - - 2,327,073
Unrelieved loss carried forward 4,521,309 - - 4,521,309
8,097,803 (191,715) - 7,906,088
Deferred tax assets have not been recognised in respect of these items because it is not presently probable that future taxable profit will be available against which the Group can use the benefits.
GROUP COMPANY
2017N’000
2016N’000
2017N’000
2016N’000
(c) Unrecognised deferred tax assetsDeferred tax assets have not been recognised in respect of the following items:Unrelieved losses 9,480,312 6,470,327 - 437,545
Allowance for loan losses and other losses 1,152,356 1,686,852 - -
Property and equipment (unutilised capital allowance) 3,860,939 3,236,344 - 16,236
14,493,607 11,393,523 - 453,781
Notes to the Consolidated and Separate Financial Statementsfor the year ended 31 December 2017 continued
FCMB Group Plc Annual Report and Accounts 2017184
Introduction Operating Review
Corporate Governance
Financial Statements
Shareholder Information
Other National Disclosures
Branches and Account Opening Information

GROUP COMPANY
32 Other Assets2017
N’0002016
N’0002017
N’0002016
N’000
(a) Other financial assetsE-settlement receivables 16,907,651 17,292,226 - -
Margin call receivables 3,812,632 3,090,043 - -
Agric SMEIS receivables 552,232 432,736 - -
Related parties receivables 1,635,903 10,310 - -
Insurance claims and fraud receivables 1,519,875 1,508,945 - -
Deposits with the Court (note (d) below) 9,149,072 184,099 - -
Accounts receivable – corporate and state bonds 2,278,407 1,717,511 - -
Accounts receivable – others 2,837,614 2,563,317 744,575 2,080,271
38,693,386 26,799,187 744,575 2,080,271
Less specific allowances for impairment (note (c) below) (16,349,277) (15,328,849) - -
22,344,109 11,470,338 744,575 2,080,271
(b) Other non-financial assets:Prepayments 4,625,840 4,808,149 4,000 4,261
Consumables 634,371 500,632 - -
5,260,211 5,308,781 4,000 4,261
27,604,320 16,779,119 748,575 2,084,532
Current 5,910,673 1,635,951 748,575 2,084,532
Non-current 21,693,647 15,143,168 - -
27,604,320 16,779,119 748,575 2,084,532
(c) Movement in impairment on other financial assets
At start of the year 15,328,849 17,542,788 - -
Increase in impairment during the year (see note 9(b)) 1,347,895 3,607,348 - -
Translation difference 9,389 - - -
Amounts written off (336,856) (5,821,287) - -
At year end 16,349,277 15,328,849 - -
(d) The amount represents deposits with the court in respect of an ongoing suit against the Banking subsidiary in United Kingdom as ordered by the court.
FCMB Group Plc Annual Report and Accounts 2017 185
Introduction Operating Review
Corporate Governance
Financial Statements
Shareholder Information
Other National Disclosures
Branches and Account Opening Information
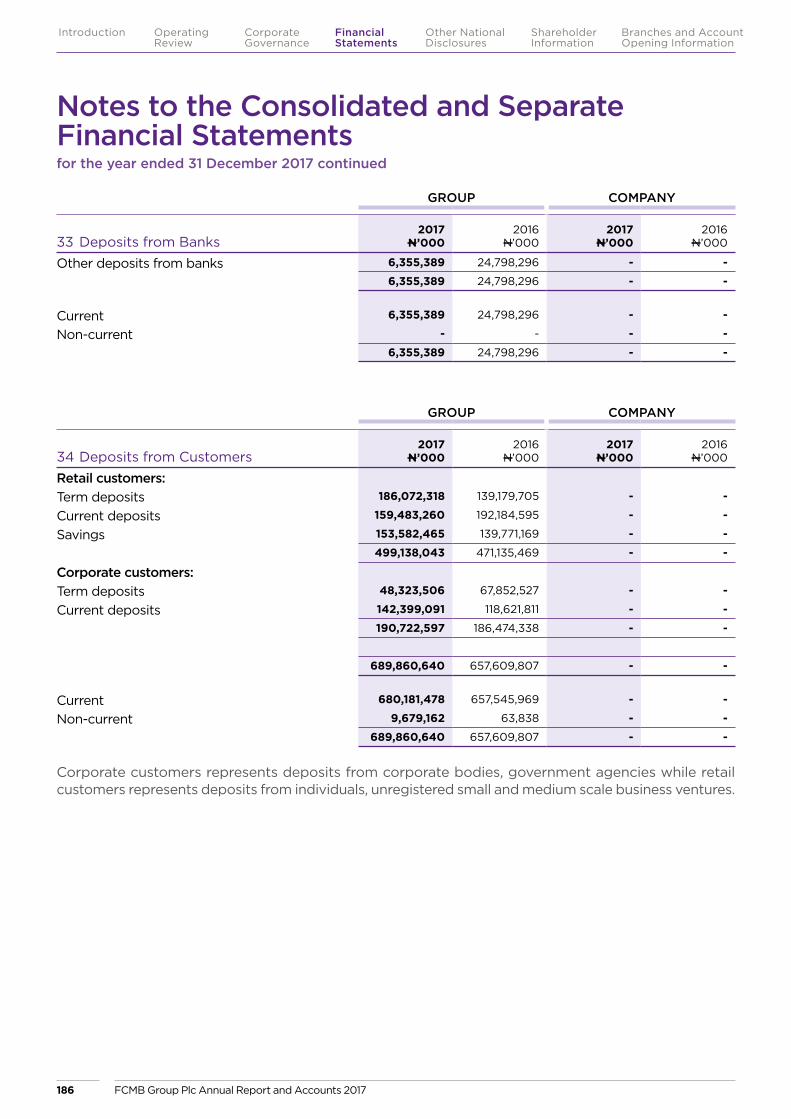
GROUP COMPANY
34 Deposits from Customers2017
N’0002016
N’0002017
N’0002016
N’000
Retail customers:Term deposits 186,072,318 139,179,705 - -
Current deposits 159,483,260 192,184,595 - -
Savings 153,582,465 139,771,169 - -
499,138,043 471,135,469 - -
Corporate customers:Term deposits 48,323,506 67,852,527 - -
Current deposits 142,399,091 118,621,811 - -
190,722,597 186,474,338 - -
689,860,640 657,609,807 - -
Current 680,181,478 657,545,969 - -
Non-current 9,679,162 63,838 - -
689,860,640 657,609,807 - -
Corporate customers represents deposits from corporate bodies, government agencies while retail customers represents deposits from individuals, unregistered small and medium scale business ventures.
GROUP COMPANY
33 Deposits from Banks2017
N’0002016
N’0002017
N’0002016
N’000
Other deposits from banks 6,355,389 24,798,296 - -
6,355,389 24,798,296 - -
Current 6,355,389 24,798,296 - -
Non-current - - - -
6,355,389 24,798,296 - -
Notes to the Consolidated and Separate Financial Statementsfor the year ended 31 December 2017 continued
FCMB Group Plc Annual Report and Accounts 2017186
Introduction Operating Review
Corporate Governance
Financial Statements
Shareholder Information
Other National Disclosures
Branches and Account Opening Information
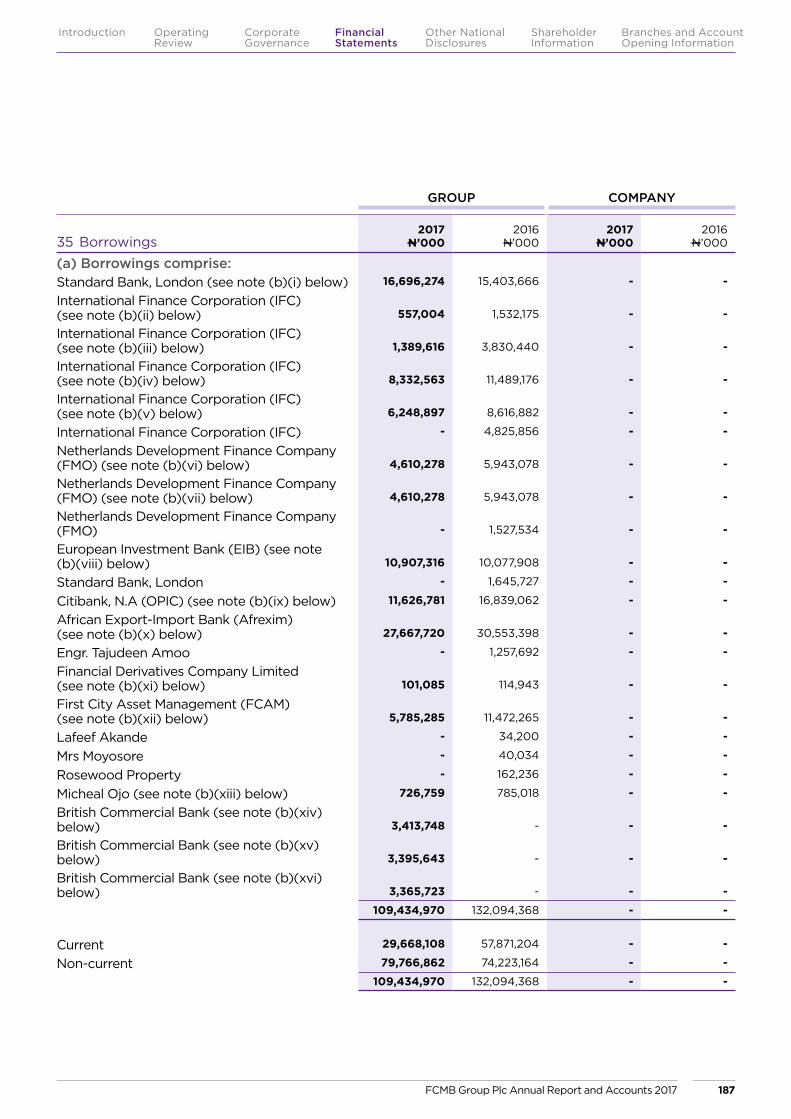
GROUP COMPANY
35 Borrowings2017
N’0002016
N’0002017
N’0002016
N’000
(a) Borrowings comprise:Standard Bank, London (see note (b)(i) below) 16,696,274 15,403,666 - -
International Finance Corporation (IFC) (see note (b)(ii) below) 557,004 1,532,175 - -
International Finance Corporation (IFC) (see note (b)(iii) below) 1,389,616 3,830,440 - -
International Finance Corporation (IFC) (see note (b)(iv) below) 8,332,563 11,489,176 - -
International Finance Corporation (IFC) (see note (b)(v) below) 6,248,897 8,616,882 - -
International Finance Corporation (IFC) - 4,825,856 - -
Netherlands Development Finance Company (FMO) (see note (b)(vi) below) 4,610,278 5,943,078 - -
Netherlands Development Finance Company (FMO) (see note (b)(vii) below) 4,610,278 5,943,078 - -
Netherlands Development Finance Company (FMO) - 1,527,534 - -
European Investment Bank (EIB) (see note (b)(viii) below) 10,907,316 10,077,908 - -
Standard Bank, London - 1,645,727 - -
Citibank, N.A (OPIC) (see note (b)(ix) below) 11,626,781 16,839,062 - -
African Export-Import Bank (Afrexim) (see note (b)(x) below) 27,667,720 30,553,398 - -
Engr. Tajudeen Amoo - 1,257,692 - -
Financial Derivatives Company Limited (see note (b)(xi) below) 101,085 114,943 - -
First City Asset Management (FCAM) (see note (b)(xii) below) 5,785,285 11,472,265 - -
Lafeef Akande - 34,200 - -
Mrs Moyosore - 40,034 - -
Rosewood Property - 162,236 - -
Micheal Ojo (see note (b)(xiii) below) 726,759 785,018 - -
British Commercial Bank (see note (b)(xiv) below) 3,413,748 - - -
British Commercial Bank (see note (b)(xv) below) 3,395,643 - - -
British Commercial Bank (see note (b)(xvi) below) 3,365,723 - - -
109,434,970 132,094,368 - -
Current 29,668,108 57,871,204 - -
Non-current 79,766,862 74,223,164 - -
109,434,970 132,094,368 - -
FCMB Group Plc Annual Report and Accounts 2017 187
Introduction Operating Review
Corporate Governance
Financial Statements
Shareholder Information
Other National Disclosures
Branches and Account Opening Information

(b) i) The amount of N16,696,274,000 (31 December 2016: N15,403,666,000 (USD 50,000,000) represents a secured renewed facility granted by Standard Bank, London repayable after a tenor of 5 years, maturing 30 June 2018 with an interest rate of 3 months LIBOR + 3.0% payable quarterly. The facility is secured by Federal Government of Nigeria bonds.
ii) The amount of N557,003,760 (31 December 2016: N1,532,175,182 (USD 20,000,000)) represents the outstanding balance of the unsecured convertible facility granted by International Finance Corporation (IFC) repayable after a tenor of 7 years, maturing 15 May 2018 with an interest rate of 6-months LIBOR plus spread of 400-450 basis points payable semi-annually.
iii) The amount of N1,389,616,000 (31 December 2016: N3,830,439,793 (USD 50,000,000)) represents the outstanding balance of the unsecured facility granted by International Finance Corporation (IFC) repayable after a tenor of 7 years maturing 15 May 2018 with an interest rate of 6-months LIBOR plus spread of 400-450 basis points payable semi-annually.
iv) The amount of N8,332,563,254 (December 2016: N11,489,175,796 (USD 50,000,000)) represents an unsecured facility granted by International Finance Corporation (IFC) repayable after a tenor of 5 years maturing 9 October 2019 with an interest rate of 3 months LIBOR + 3.65%.
v) The amount of N6,248,897,128 (31 December 2016: N8,616,881,848 (USD 37,500,000)) represents an unsecured facility granted by International Finance Corporation (IFC) repayable after a tenor of 5 years maturing 9 October 2019 with an interest rate of 6 months LIBOR + 4.75%.
vi) The amount of N4,610,278,232 (31 December 2016: N5,943,078,366 (USD 25,000,000)) represents an unsecured facility granted by Netherlands Development Finance Company (FMO) repayable after a tenor of 6 years maturing 30 June 2020 with an interest rate of 6 months LIBOR + 4.5%.
vii) The amount of N4,610,278,150 (31 December 2016: N5,943,078,366 (USD 25,000,000)) represents an unsecured facility granted by Netherlands Development Finance Company (FMO) repayable after a tenor of 6 years maturing 30 June 2020 with an interest rate of 6 months LIBOR + 4.5%.
viii) The amount of N10,907,315,673 (December 2016: N10,077,908,423 (USD 32,877,500)) represents an unsecured facility granted by European Investment (EIB) repayable after a tenor of 8 years maturing 22 September 2022 with an interest rate of LIBOR plus 4%.
ix) The amount of N11,626,781,155 (31 December 2016: N16,839,061,760 (USD 75,000,000)) represents a facility granted by OPIC, repayable after a tenor of 4 year maturing 15 August 2019 based on weekly certificate interest rate (CIR) payable quarterly.
x) The amount of N27,667,720,168 (31 December 2016: N30,553,398,269) represents a facility granted by African Export Import (AFRIEXIM) Bank, repayable after a tenor of 5 years maturing 14 September 2021 with a nominal interest rate of 7.06% payable quarterly.
xi) The amount of N101,084,931 (December 2016: N114,943,000) represents the outstanding balance of the unsecured facilities granted by Financial Derivatives Company Limited at average nominal interest of 17.75% maturing 20 May 2018.
xii) The amount of N5,785,285,008 (31 December 2016: N11,472,265,000) represents a unsecured facility granted by First City Asset Management Limited (FCAM), repayable after a tenor of 1 year maturing 2018 with an interest rate of 16.67%.
xiii) The amount of N726,759,331 (31 December 2016: N785,018,000) represents an unsecured facility granted by Micheal Ojo, at interest rate of 14.40%, maturing 19 April 2018.
Notes to the Consolidated and Separate Financial Statementsfor the year ended 31 December 2017 continued
FCMB Group Plc Annual Report and Accounts 2017188
Introduction Operating Review
Corporate Governance
Financial Statements
Shareholder Information
Other National Disclosures
Branches and Account Opening Information

xiv) The amount of N3,413,748,697 (USD10,000,000.00) (31 December 2016: Nil) represents an unsecured facility granted by the British Commercial Bank repayable after a tenor of 179 days maturing 8 January 2018 with an interest rate of 6 months LIBOR + 5.2%.
xv) The amount of N3,395,642,823 (USD10,000,000.00)(31 December 2016: Nil) represents an unsecured facility granted by the British Commercial Bank repayable after a tenor of 179 days maturing 6 February 2018 with an interest rate of 6 months LIBOR + 5.2%.
xvi) The amount of N3,365,722,615 (USD10,000,000.00) (31 December 2016: Nil) represents an unsecured facility granted by the British Commercial Bank repayable after a tenor of 179 days maturing 26 March 2018 with an interest rate of 6 months LIBOR + 5.1%.
The Banking subsidiary have not had any defaults of principal, interest or other breaches with respect to their liabilities during the year.
GROUP COMPANY
2017N’000
2016N’000
2017N’000
2016N’000
(c) Movement in borrowings account during the year was as follows:
Balance, beginning of the year 132,094,368 113,700,194 - -
Additions during the year 10,298,880 33,996,484 - -
Repayments during the year (43,184,244) (68,348,938) - -
Translation difference 10,225,966 52,746,628 - -
109,434,970 132,094,368 - -
(a) On-lending facilities represents government intervention funds granted by Nigeria government financial institutions, Bank of Industry (BOI) and Central Bank of Nigeria under manufacturing, agriculture, power, small and medium scale companies sectors and Commercial Agriculture Credit Scheme (CACS) respectively for on-lending to the Bank’s qualified customers. These facilities are given to the Bank at low interest rates, between 0%-10%, for on-lending at a low rate specified under the schemes. However, the Bank bears the credit risk for these facilities.
GROUP COMPANY
36 On-Lending Facilities (See note (a) below)
2017N’000
2016N’000
2017N’000
2016N’000
Bank of industry (BOI) 25,041,640 30,683,610 - -
Commercial Agriculture Credit Scheme (CACS) 5,274,089 8,998,286 - -
Micro, Small and Medium Enterprises Development Fund (MSMEDF) 12,218,587 2,517,484 - -
42,534,316 42,199,380 - -
Current 4,154,030 7,164,017 - -
Non-current 38,380,286 35,035,363 - -
42,534,316 42,199,380 - -
FCMB Group Plc Annual Report and Accounts 2017 189
Introduction Operating Review
Corporate Governance
Financial Statements
Shareholder Information
Other National Disclosures
Branches and Account Opening Information
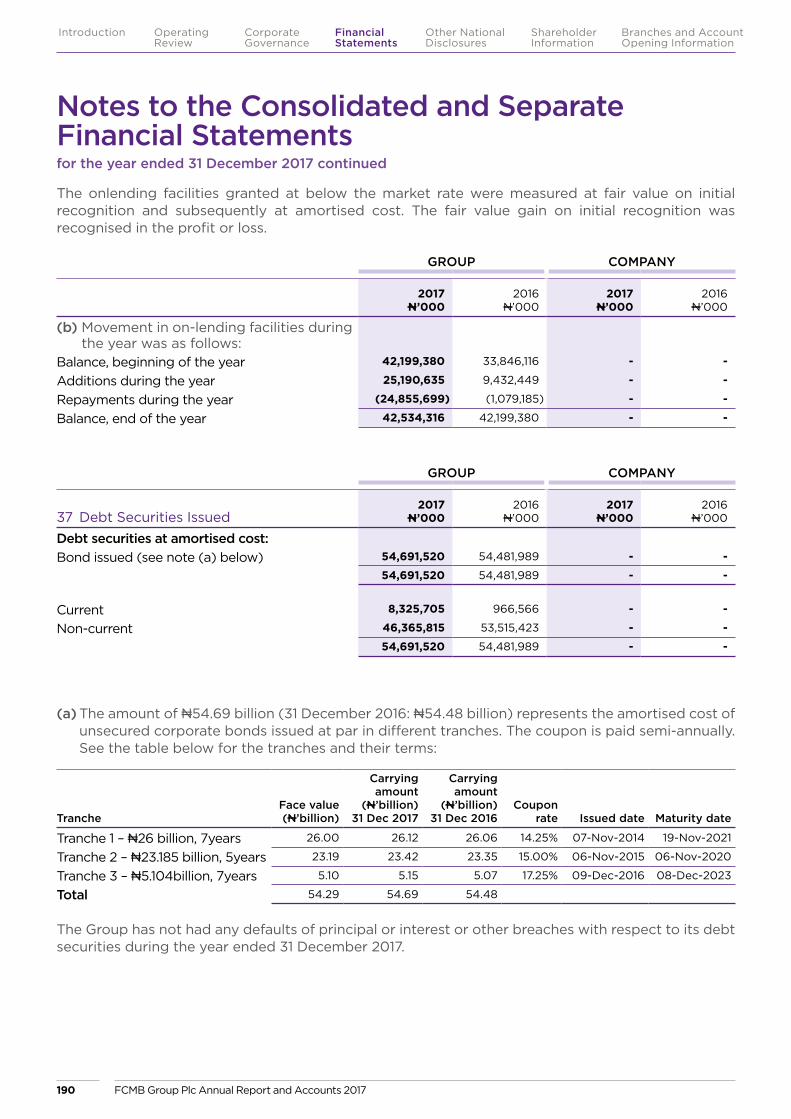
GROUP COMPANY
2017N’000
2016N’000
2017N’000
2016N’000
(b) Movement in on-lending facilities during the year was as follows:
Balance, beginning of the year 42,199,380 33,846,116 - -
Additions during the year 25,190,635 9,432,449 - -
Repayments during the year (24,855,699) (1,079,185) - -
Balance, end of the year 42,534,316 42,199,380 - -
GROUP COMPANY
37 Debt Securities Issued2017
N’0002016
N’0002017
N’0002016
N’000
Debt securities at amortised cost:Bond issued (see note (a) below) 54,691,520 54,481,989 - -
54,691,520 54,481,989 - -
Current 8,325,705 966,566 - -
Non-current 46,365,815 53,515,423 - -
54,691,520 54,481,989 - -
(a) The amount of N54.69 billion (31 December 2016: N54.48 billion) represents the amortised cost of unsecured corporate bonds issued at par in different tranches. The coupon is paid semi-annually. See the table below for the tranches and their terms:
TrancheFace value (N’billion)
Carrying amount
(N’billion) 31 Dec 2017
Carrying amount
(N’billion) 31 Dec 2016
Coupon rate Issued date Maturity date
Tranche 1 – N26 billion, 7years 26.00 26.12 26.06 14.25% 07-Nov-2014 19-Nov-2021
Tranche 2 – N23.185 billion, 5years 23.19 23.42 23.35 15.00% 06-Nov-2015 06-Nov-2020
Tranche 3 – N5.104billion, 7years 5.10 5.15 5.07 17.25% 09-Dec-2016 08-Dec-2023
Total 54.29 54.69 54.48
The Group has not had any defaults of principal or interest or other breaches with respect to its debt securities during the year ended 31 December 2017.
The onlending facilities granted at below the market rate were measured at fair value on initial recognition and subsequently at amortised cost. The fair value gain on initial recognition was recognised in the profit or loss.
Notes to the Consolidated and Separate Financial Statementsfor the year ended 31 December 2017 continued
FCMB Group Plc Annual Report and Accounts 2017190
Introduction Operating Review
Corporate Governance
Financial Statements
Shareholder Information
Other National Disclosures
Branches and Account Opening Information
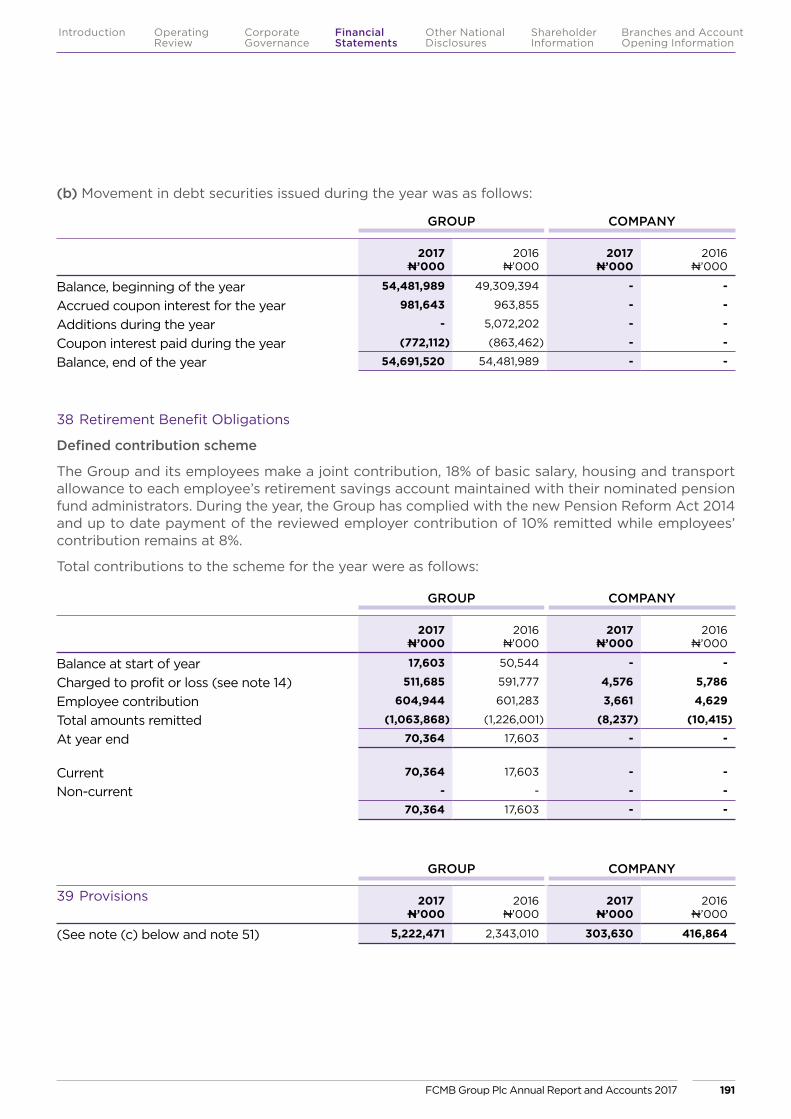
(b) Movement in debt securities issued during the year was as follows:
GROUP COMPANY
2017N’000
2016N’000
2017N’000
2016N’000
Balance, beginning of the year 54,481,989 49,309,394 - -
Accrued coupon interest for the year 981,643 963,855 - -
Additions during the year - 5,072,202 - -
Coupon interest paid during the year (772,112) (863,462) - -
Balance, end of the year 54,691,520 54,481,989 - -
38 Retirement Benefit Obligations
Defined contribution scheme
The Group and its employees make a joint contribution, 18% of basic salary, housing and transport allowance to each employee’s retirement savings account maintained with their nominated pension fund administrators. During the year, the Group has complied with the new Pension Reform Act 2014 and up to date payment of the reviewed employer contribution of 10% remitted while employees’ contribution remains at 8%.
Total contributions to the scheme for the year were as follows:
GROUP COMPANY
2017N’000
2016N’000
2017N’000
2016N’000
Balance at start of year 17,603 50,544 - -
Charged to profit or loss (see note 14) 511,685 591,777 4,576 5,786
Employee contribution 604,944 601,283 3,661 4,629
Total amounts remitted (1,063,868) (1,226,001) (8,237) (10,415)
At year end 70,364 17,603 - -
Current 70,364 17,603 - -
Non-current - - - -
70,364 17,603 - -
GROUP COMPANY
39 Provisions 2017N’000
2016N’000
2017N’000
2016N’000
(See note (c) below and note 51) 5,222,471 2,343,010 303,630 416,864
FCMB Group Plc Annual Report and Accounts 2017 191
Introduction Operating Review
Corporate Governance
Financial Statements
Shareholder Information
Other National Disclosures
Branches and Account Opening Information
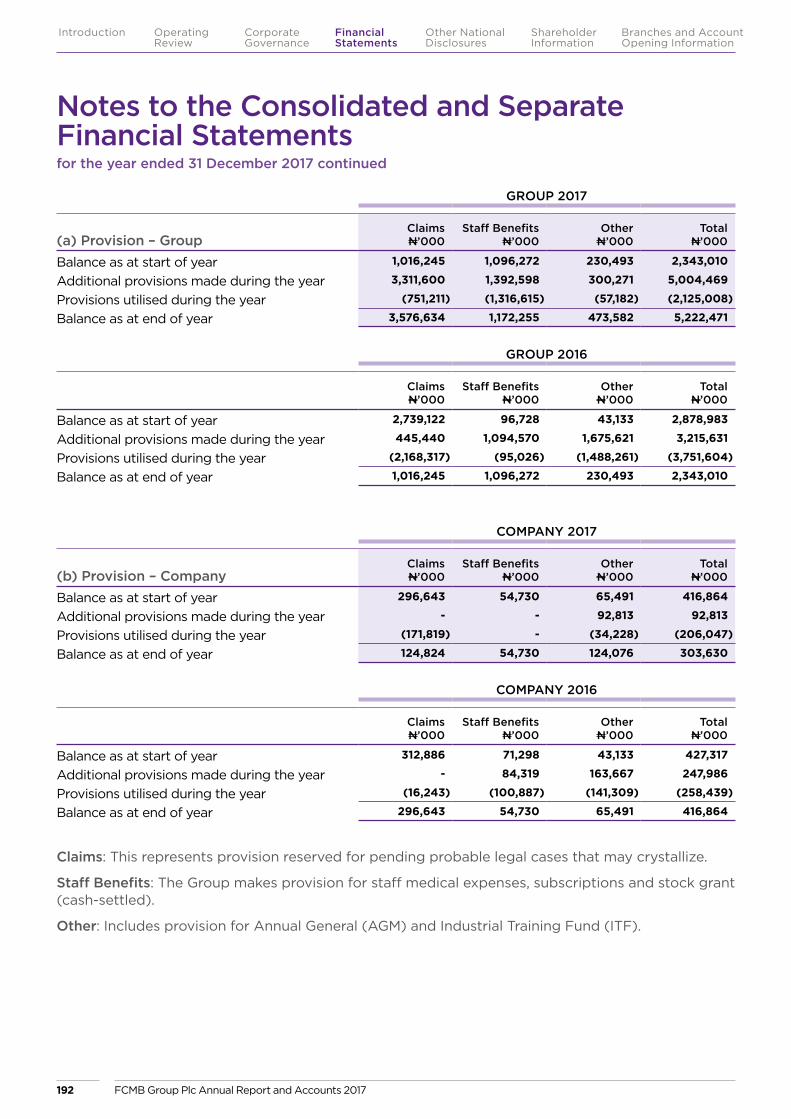
GROUP 2017
(a) Provision – GroupClaims N’000
Staff Benefits N’000
Other N’000
Total N’000
Balance as at start of year 1,016,245 1,096,272 230,493 2,343,010
Additional provisions made during the year 3,311,600 1,392,598 300,271 5,004,469
Provisions utilised during the year (751,211) (1,316,615) (57,182) (2,125,008)
Balance as at end of year 3,576,634 1,172,255 473,582 5,222,471
GROUP 2016
Claims N’000
Staff Benefits N’000
Other N’000
Total N’000
Balance as at start of year 2,739,122 96,728 43,133 2,878,983
Additional provisions made during the year 445,440 1,094,570 1,675,621 3,215,631
Provisions utilised during the year (2,168,317) (95,026) (1,488,261) (3,751,604)
Balance as at end of year 1,016,245 1,096,272 230,493 2,343,010
COMPANY 2017
(b) Provision – CompanyClaims N’000
Staff Benefits N’000
Other N’000
Total N’000
Balance as at start of year 296,643 54,730 65,491 416,864
Additional provisions made during the year - - 92,813 92,813
Provisions utilised during the year (171,819) - (34,228) (206,047)
Balance as at end of year 124,824 54,730 124,076 303,630
COMPANY 2016
Claims N’000
Staff Benefits N’000
Other N’000
Total N’000
Balance as at start of year 312,886 71,298 43,133 427,317
Additional provisions made during the year - 84,319 163,667 247,986
Provisions utilised during the year (16,243) (100,887) (141,309) (258,439)
Balance as at end of year 296,643 54,730 65,491 416,864
Claims: This represents provision reserved for pending probable legal cases that may crystallize.
Staff Benefits: The Group makes provision for staff medical expenses, subscriptions and stock grant (cash-settled).
Other: Includes provision for Annual General (AGM) and Industrial Training Fund (ITF).
Notes to the Consolidated and Separate Financial Statementsfor the year ended 31 December 2017 continued
FCMB Group Plc Annual Report and Accounts 2017192
Introduction Operating Review
Corporate Governance
Financial Statements
Shareholder Information
Other National Disclosures
Branches and Account Opening Information
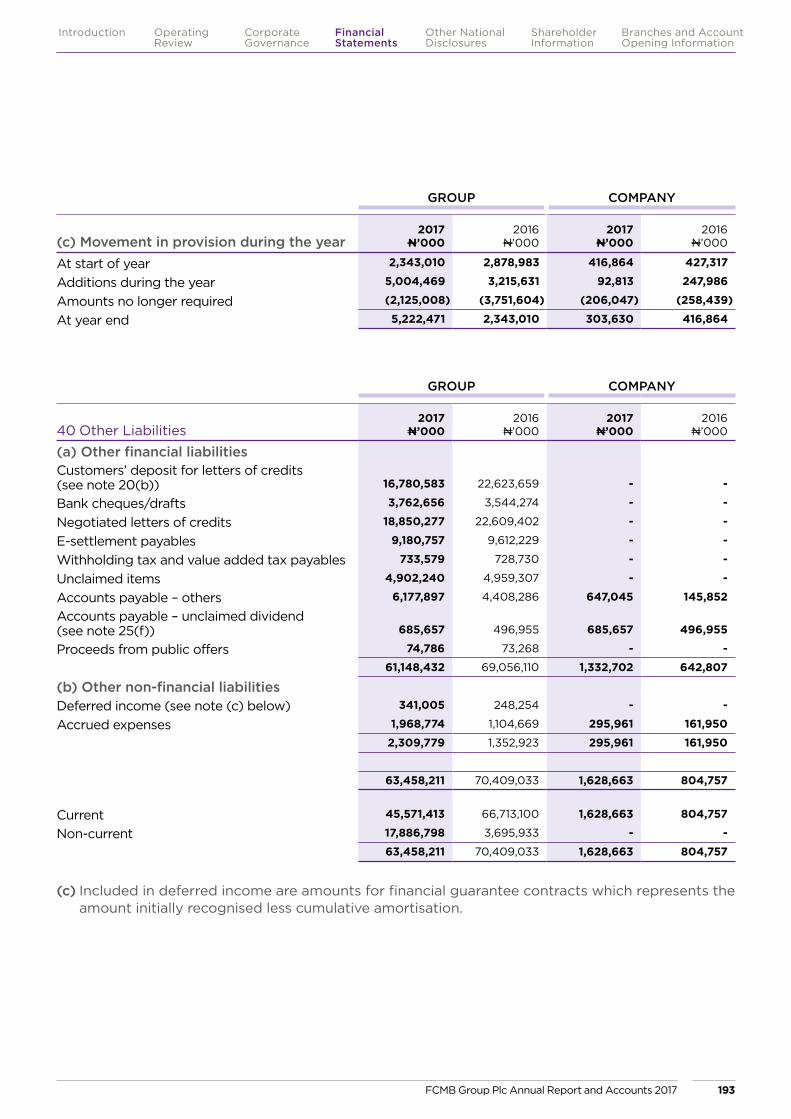
(c) Included in deferred income are amounts for financial guarantee contracts which represents the amount initially recognised less cumulative amortisation.
GROUP COMPANY
40 Other Liabilities2017
N’0002016
N’0002017
N’0002016
N’000
(a) Other financial liabilitiesCustomers’ deposit for letters of credits (see note 20(b)) 16,780,583 22,623,659 - -
Bank cheques/drafts 3,762,656 3,544,274 - -
Negotiated letters of credits 18,850,277 22,609,402 - -
E-settlement payables 9,180,757 9,612,229 - -
Withholding tax and value added tax payables 733,579 728,730 - -
Unclaimed items 4,902,240 4,959,307 - -
Accounts payable – others 6,177,897 4,408,286 647,045 145,852
Accounts payable – unclaimed dividend (see note 25(f)) 685,657 496,955 685,657 496,955
Proceeds from public offers 74,786 73,268 - -
61,148,432 69,056,110 1,332,702 642,807
(b) Other non-financial liabilitiesDeferred income (see note (c) below) 341,005 248,254 - -
Accrued expenses 1,968,774 1,104,669 295,961 161,950
2,309,779 1,352,923 295,961 161,950
63,458,211 70,409,033 1,628,663 804,757
Current 45,571,413 66,713,100 1,628,663 804,757
Non-current 17,886,798 3,695,933 - -
63,458,211 70,409,033 1,628,663 804,757
GROUP COMPANY
(c) Movement in provision during the year2017
N’0002016
N’0002017
N’0002016
N’000
At start of year 2,343,010 2,878,983 416,864 427,317
Additions during the year 5,004,469 3,215,631 92,813 247,986
Amounts no longer required (2,125,008) (3,751,604) (206,047) (258,439)
At year end 5,222,471 2,343,010 303,630 416,864
FCMB Group Plc Annual Report and Accounts 2017 193
Introduction Operating Review
Corporate Governance
Financial Statements
Shareholder Information
Other National Disclosures
Branches and Account Opening Information
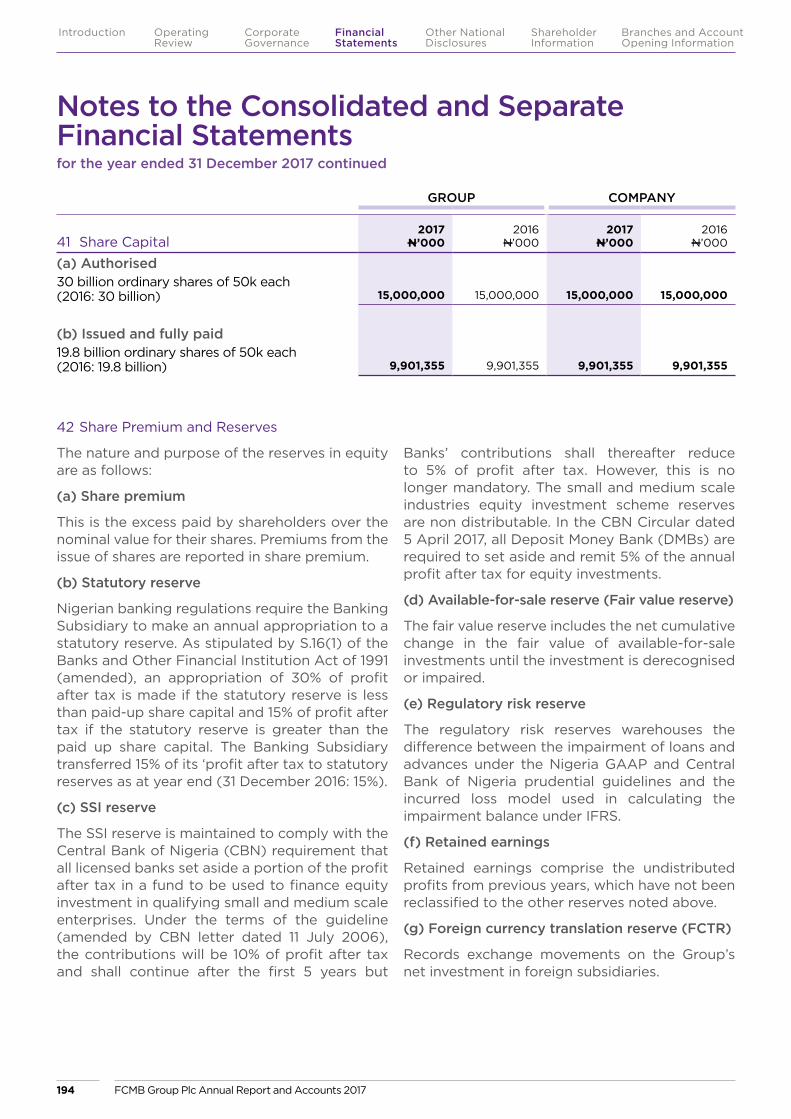
GROUP COMPANY
41 Share Capital2017
N’0002016
N’0002017
N’0002016
N’000
(a) Authorised 30 billion ordinary shares of 50k each (2016: 30 billion) 15,000,000 15,000,000 15,000,000 15,000,000
(b) Issued and fully paid 19.8 billion ordinary shares of 50k each (2016: 19.8 billion) 9,901,355 9,901,355 9,901,355 9,901,355
42 Share Premium and Reserves
The nature and purpose of the reserves in equity are as follows:
(a) Share premium
This is the excess paid by shareholders over the nominal value for their shares. Premiums from the issue of shares are reported in share premium.
(b) Statutory reserve
Nigerian banking regulations require the Banking Subsidiary to make an annual appropriation to a statutory reserve. As stipulated by S.16(1) of the Banks and Other Financial Institution Act of 1991 (amended), an appropriation of 30% of profit after tax is made if the statutory reserve is less than paid-up share capital and 15% of profit after tax if the statutory reserve is greater than the paid up share capital. The Banking Subsidiary transferred 15% of its ‘profit after tax to statutory reserves as at year end (31 December 2016: 15%).
(c) SSI reserve
The SSI reserve is maintained to comply with the Central Bank of Nigeria (CBN) requirement that all licensed banks set aside a portion of the profit after tax in a fund to be used to finance equity investment in qualifying small and medium scale enterprises. Under the terms of the guideline (amended by CBN letter dated 11 July 2006), the contributions will be 10% of profit after tax and shall continue after the first 5 years but
Banks’ contributions shall thereafter reduce to 5% of profit after tax. However, this is no longer mandatory. The small and medium scale industries equity investment scheme reserves are non distributable. In the CBN Circular dated 5 April 2017, all Deposit Money Bank (DMBs) are required to set aside and remit 5% of the annual profit after tax for equity investments.
(d) Available-for-sale reserve (Fair value reserve)
The fair value reserve includes the net cumulative change in the fair value of available-for-sale investments until the investment is derecognised or impaired.
(e) Regulatory risk reserve
The regulatory risk reserves warehouses the difference between the impairment of loans and advances under the Nigeria GAAP and Central Bank of Nigeria prudential guidelines and the incurred loss model used in calculating the impairment balance under IFRS.
(f) Retained earnings
Retained earnings comprise the undistributed profits from previous years, which have not been reclassified to the other reserves noted above.
(g) Foreign currency translation reserve (FCTR)
Records exchange movements on the Group’s net investment in foreign subsidiaries.
Notes to the Consolidated and Separate Financial Statementsfor the year ended 31 December 2017 continued
FCMB Group Plc Annual Report and Accounts 2017194
Introduction Operating Review
Corporate Governance
Financial Statements
Shareholder Information
Other National Disclosures
Branches and Account Opening Information

43 Non-Controlling Interest (NCI)
Disclosure of NCI in the Group’s subsidiary
The following table summarises the information relating to the Group’s subsidiary, Legacy Pension Managers Limited
COMPANY
31 December 2017
NCI Percentage 11.78%
Total Assets 3,857,317
Total Liabilities 781,761
Net Assets 3,075,556
Net assets attributable to NCI 362,206
Movement in NCIOpening balance -
Addition due to acquisition of Legacy Pension Managers Limited 352,542
Share of post acquisition profit 8,918
Share of other comprehensive income 746
Total NCI at year end 362,206
44 Contingencies
(a) Legal proceedings
The Group in its ordinary course of business is presently involved in 334 cases as a defendant (31 December 2016: 343) and 32 cases as a plaintiff (31 December 2016: 42). The total amount claimed in the 334 cases against the Banking subsidiary is estimated at N51.37 billion (31 December 2016: N51.87 billion) while the total amount claimed in the 32 cases instituted by the Banking subsidiary is N1.95 billion (31 December 2016: N7.70 billion). The Directors of the Group are of the opinion that none of the aforementioned cases is likely to have material adverse effect on the Group and are not aware of any other pending and or threatened claims or litigation which may be material to the financial statements. Based on the realistic reserves as recommended by solicitors in charge of these ongoing litigations, a provision of $10,000,000 (N3.31 billion) has been made for the year ended 31 December 2017. See note
39(a) for the provisions made in the books for claims. The Court, also granted an injunction over the assets of FCMB Limited in the sum of £20,300,000 (N9.149 billion). The Banking subsidiary has exercised their rights under the Freezing Order to pay this money into the Court Funds Office discharging the Freezing Order. The £20,300,000 (N9.149 billion) currently at the Court Funds Office remains the property of the Banking subsidiary pending further order of the Court. See note 32(a).
(b) Other contingent liabilities and commitments
In common with other banks, the Group conducts business involving acceptances and issuance of performance bonds and indemnities. The majority of these facilities are offset by corresponding obligations of third parties. Contingent liabilities and commitments comprise acceptances, guarantees and letters of credit.
Nature of instruments
An acceptance is an undertaking by a bank to pay a bill of exchange drawn on a customer. The Group expects most acceptances to be presented, but reimbursement by the customer is normally immediate. Guarantees and letters of credit are given as security to support the performance of a customer to third parties. As the Group will only be required to meet these obligations in the event of the customer’s default, the cash requirements of these instruments are expected to be considerably below their nominal amounts. Other contingent liabilities include transaction related to customs and performance bonds and are, generally, short-term commitments to third parties which are not directly dependent on the customer’s creditworthiness. Commitments to lend are agreements to lend to a customer in the future, subject to certain conditions. Such commitments are either made for a fixed year, or have no specific maturity dates but are cancellable by the lender subject to notice requirements. Documentary credits commit the Group to make payments to third parties, on production of documents, which are usually reimbursed immediately by customers. The following tables summarise the nominal principal amount of contingent liabilities and commitments with contingent risk.
FCMB Group Plc Annual Report and Accounts 2017 195
Introduction Operating Review
Corporate Governance
Financial Statements
Shareholder Information
Other National Disclosures
Branches and Account Opening Information

Acceptances, bonds, guarantees and other obligations for the account of customers:
GROUP COMPANY
2017N’000
2016N’000
2017N’000
2016N’000
Performance bonds and guarantees 98,409,992 94,047,228 - -
Clean line letters of credit 66,404,271 65,336,278 - -
164,814,263 159,383,506 - -
Other commitment 86,977 - - -
164,901,240 159,383,506 - -
Current 81,355,010 80,200,040 - -
Non-current 83,546,230 79,183,466 - -
164,901,240 159,383,506 - -
Clean line letters of credit, which represent irrevocable assurances that the Banking subsidiary will make payments in the event that a customer cannot meet its obligations, carry the same credit risk as loans.
Notes to the Consolidated and Separate Financial Statementsfor the year ended 31 December 2017 continued
FCMB Group Plc Annual Report and Accounts 2017196
Introduction Operating Review
Corporate Governance
Financial Statements
Shareholder Information
Other National Disclosures
Branches and Account Opening Information
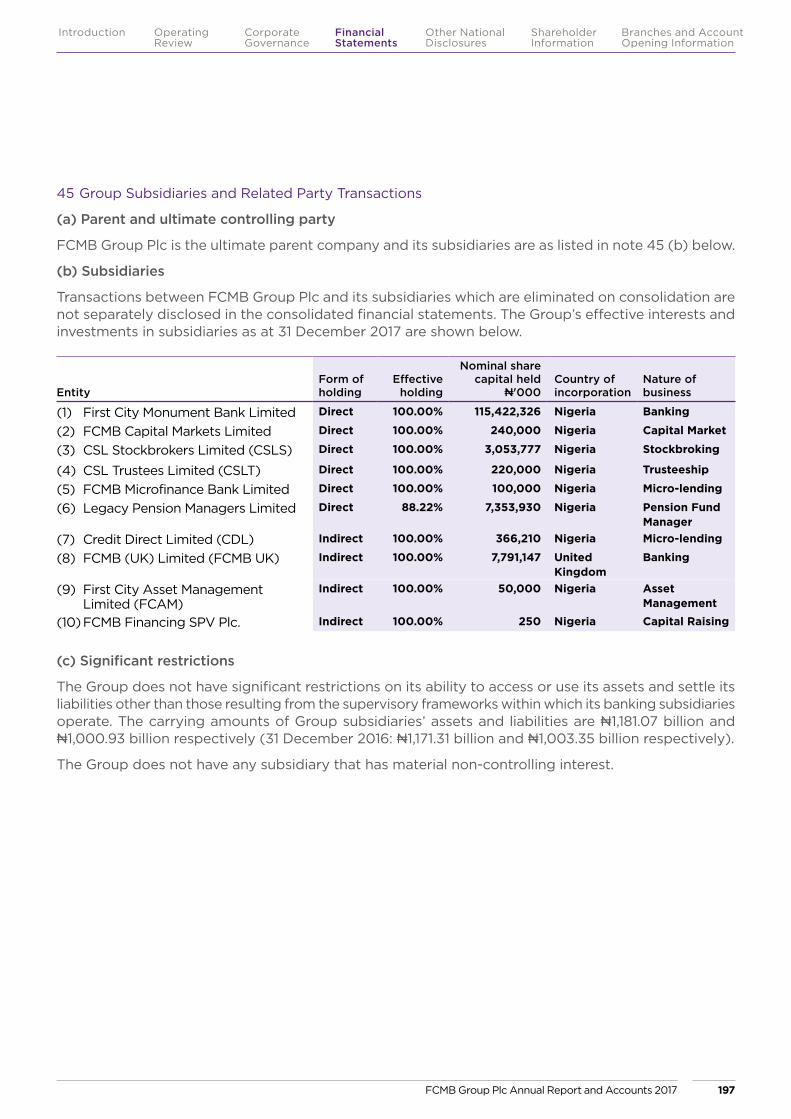
45 Group Subsidiaries and Related Party Transactions
(a) Parent and ultimate controlling party
FCMB Group Plc is the ultimate parent company and its subsidiaries are as listed in note 45 (b) below.
(b) Subsidiaries
Transactions between FCMB Group Plc and its subsidiaries which are eliminated on consolidation are not separately disclosed in the consolidated financial statements. The Group’s effective interests and investments in subsidiaries as at 31 December 2017 are shown below.
EntityForm of holding
Effective holding
Nominal share capital held
N'000Country of incorporation
Nature of business
(1) First City Monument Bank Limited Direct 100.00% 115,422,326 Nigeria Banking
(2) FCMB Capital Markets Limited Direct 100.00% 240,000 Nigeria Capital Market
(3) CSL Stockbrokers Limited (CSLS) Direct 100.00% 3,053,777 Nigeria Stockbroking
(4) CSL Trustees Limited (CSLT) Direct 100.00% 220,000 Nigeria Trusteeship
(5) FCMB Microfinance Bank Limited Direct 100.00% 100,000 Nigeria Micro-lending
(6) Legacy Pension Managers Limited Direct 88.22% 7,353,930 Nigeria Pension Fund Manager
(7) Credit Direct Limited (CDL) Indirect 100.00% 366,210 Nigeria Micro-lending
(8) FCMB (UK) Limited (FCMB UK) Indirect 100.00% 7,791,147 United Kingdom
Banking
(9) First City Asset Management Limited (FCAM)
Indirect 100.00% 50,000 Nigeria Asset Management
(10) FCMB Financing SPV Plc. Indirect 100.00% 250 Nigeria Capital Raising
(c) Significant restrictions
The Group does not have significant restrictions on its ability to access or use its assets and settle its liabilities other than those resulting from the supervisory frameworks within which its banking subsidiaries operate. The carrying amounts of Group subsidiaries’ assets and liabilities are N1,181.07 billion and N1,000.93 billion respectively (31 December 2016: N1,171.31 billion and N1,003.35 billion respectively).
The Group does not have any subsidiary that has material non-controlling interest.
FCMB Group Plc Annual Report and Accounts 2017 197
Introduction Operating Review
Corporate Governance
Financial Statements
Shareholder Information
Other National Disclosures
Branches and Account Opening Information

FC
MB
G
roup
Plc
FC
MB
Li
mit
ed
Gro
upF
CM
B C
M
Lim
ited
CSL
St
ock
bro
kers
Li
mit
ed
Gro
upC
SL T
rust
ees
Lim
ited
FC
MB
MF
B
Lim
ited
Leg
acy
pen
sio
nsTo
tal
Co
nso
lidat
ion
Jour
nal
Ent
ries
Gro
up
Res
ults
of
oper
atio
nsIn
tere
st a
nd
dis
coun
t in
com
e88
6,56
513
1,29
0,3
49
165,
237
348,
863
94,9
7434
,429
27,7
5813
2,84
8,17
5(4
91,13
1)13
2,35
7,0
44
Inte
rest
exp
ense
-
(62,
322,
494
) -
-
-
(5
46)
-
(62,
323,
04
0)
491
,131
(61,
831,
909)
Net
inte
rest
in
com
e88
6,56
568
,967
,855
165,
237
348,
863
94,9
7433
,883
27,7
5870
,525
,135
-
70,5
25,13
5
Oth
er in
com
e1,
642,
821
29,2
71,17
238
5,29
31,1
76,6
5620
4,8
03
9,37
325
0,8
42
32,9
40
,960
(823
,569
)32
,117,
391
Op
erat
ing
inco
me
2,52
9,38
698
,239
,027
550
,530
1,52
5,51
929
9,77
74
3,25
627
8,60
010
3,4
66,0
95(8
23,5
69)
102,
642,
526
Op
erat
ing
ex
pen
ses
(989
,167)
(66,
034
,198)
(492
,083
)(8
90,8
46)
(115
,292
)(5
7,86
2)(2
09,
317)
(68,
788,
765)
49,
288
(68,
739,
477)
Pro
visi
on
exp
ense
-
(22,
653,
321)
(4,5
63)
(5,0
03)
-
(926
)(3
,693
)(2
2,66
7,50
6) -
(2
2,66
7,50
6)
Sha
re o
f p
ost
tax
re
sult
of
asso
ciat
e -
-
--
--
--
226,
849
226,
849
Pro
fit/(
loss
)
bef
ore
tax
1,54
0,2
199,
551,
508
53,8
8462
9,67
018
4,4
85(1
5,53
2)65
,590
12
,00
9,82
4(5
47,4
32)
11,4
62,3
92
Inco
me
tax
exp
ense
(15,
333)
(1,9
59,7
95)
-
(52,
843)
(34
,325
) -
10
,108
(2,0
52,18
8) -
(2
,052
,188)
Pro
fit/(
loss
) af
ter
tax
1,52
4,8
867,
591,7
1353
,884
576,
827
150
,160
(15,
532)
75,6
98
9,95
7,63
6
(547
,432
)9,
410
,20
4
Oth
er
com
pre
hens
ive
inco
me
-
2,2
72,2
38
-
33,
594
-
-
6
,329
2,
312,
161
-
2,31
2,16
1
Tota
l co
mpr
ehen
sive
in
com
e fo
r th
e ye
ar1,
524
,886
9,86
3,95
153
,884
610
,421
150
,160
(15,
532)
82,0
27
12,2
69,7
97(7
74,2
81)
11,7
22,3
65
(d)
Co
nden
sed
fina
ncia
l inf
orm
atio
n
(i)
The
co
nden
sed
fina
ncia
l dat
a o
f th
e co
nso
lidat
ed e
ntit
ies
as a
t 31
Dec
emb
er 2
017
wer
e as
fo
llow
s:
Notes to the Consolidated and Separate Financial Statementsfor the year ended 31 December 2017 continued
FCMB Group Plc Annual Report and Accounts 2017198
Introduction Operating Review
Corporate Governance
Financial Statements
Shareholder Information
Other National Disclosures
Branches and Account Opening Information
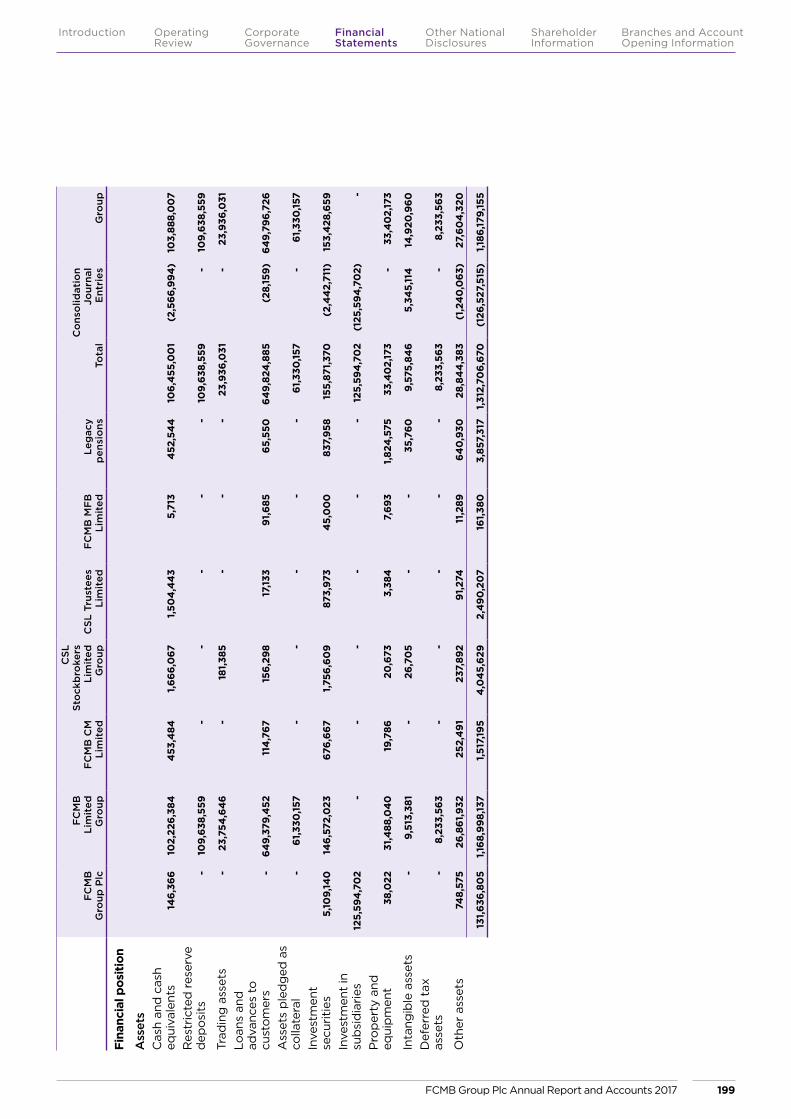
FC
MB
G
roup
Plc
FC
MB
Li
mit
ed
Gro
upF
CM
B C
M
Lim
ited
CSL
St
ock
bro
kers
Li
mit
ed
Gro
upC
SL T
rust
ees
Lim
ited
FC
MB
MF
B
Lim
ited
Leg
acy
pen
sio
nsTo
tal
Co
nso
lidat
ion
Jour
nal
Ent
ries
Gro
up
Fina
ncia
l pos
ition
Ass
ets
Cas
h an
d c
ash
equi
vale
nts
146,
366
102,
226,
384
453
,484
1,66
6,0
671,
504
,44
35,
713
452
,54
410
6,4
55,0
01
(2,5
66,9
94)
103,
888,
00
7
Res
tric
ted
res
erve
d
epo
sits
-
109,
638,
559
-
-
-
-
-
109,
638,
559
-
109,
638,
559
Trad
ing
ass
ets
-
23,7
54,6
46
-
181,
385
-
-
-
23,9
36,0
31 -
23
,936
,031
Loan
s an
d
adva
nces
to
cu
sto
mer
s -
64
9,37
9,4
5211
4,7
6715
6,29
817
,133
91,6
8565
,550
649,
824
,885
(28,
159)
649,
796,
726
Ass
ets
ple
dg
ed a
s co
llate
ral
-
61,3
30,15
7 -
-
-
-
-
61
,330
,157
-
61,3
30,15
7
Inve
stm
ent
secu
riti
es5,
109,
140
146,
572,
023
676,
667
1,756
,60
987
3,97
34
5,0
00
837,
958
155,
871,
370
(2,4
42,
711)
153,
428
,659
Inve
stm
ent
in
sub
sid
iari
es12
5,59
4,7
02
-
-
-
-
-
-
125,
594
,70
2(1
25,5
94,7
02)
-
Pro
per
ty a
nd
equi
pm
ent
38,0
2231
,488
,04
019
,786
20,6
733,
384
7,69
31,
824
,575
33,4
02,
173
-
33,4
02,
173
Inta
ngib
le a
sset
s -
9,
513,
381
-
26,7
05
-
-
35,7
609,
575,
846
5,3
45,
114
14
,920
,960
Def
erre
d t
ax
asse
ts -
8,
233,
563
-
-
-
-
-
8,23
3,56
3 -
8,
233,
563
Oth
er a
sset
s74
8,57
526
,861
,932
252,
491
237,
892
91,2
7411
,289
640
,930
28,8
44
,383
(1,2
40
,063
)27
,60
4,3
20
131,
636,
805
1,168
,998
,137
1,51
7,19
54
,04
5,62
92,
490
,20
716
1,38
03,
857,
317
1,31
2,70
6,67
0(1
26,5
27,5
15)
1,186
,179,
155
FCMB Group Plc Annual Report and Accounts 2017 199
Introduction Operating Review
Corporate Governance
Financial Statements
Shareholder Information
Other National Disclosures
Branches and Account Opening Information
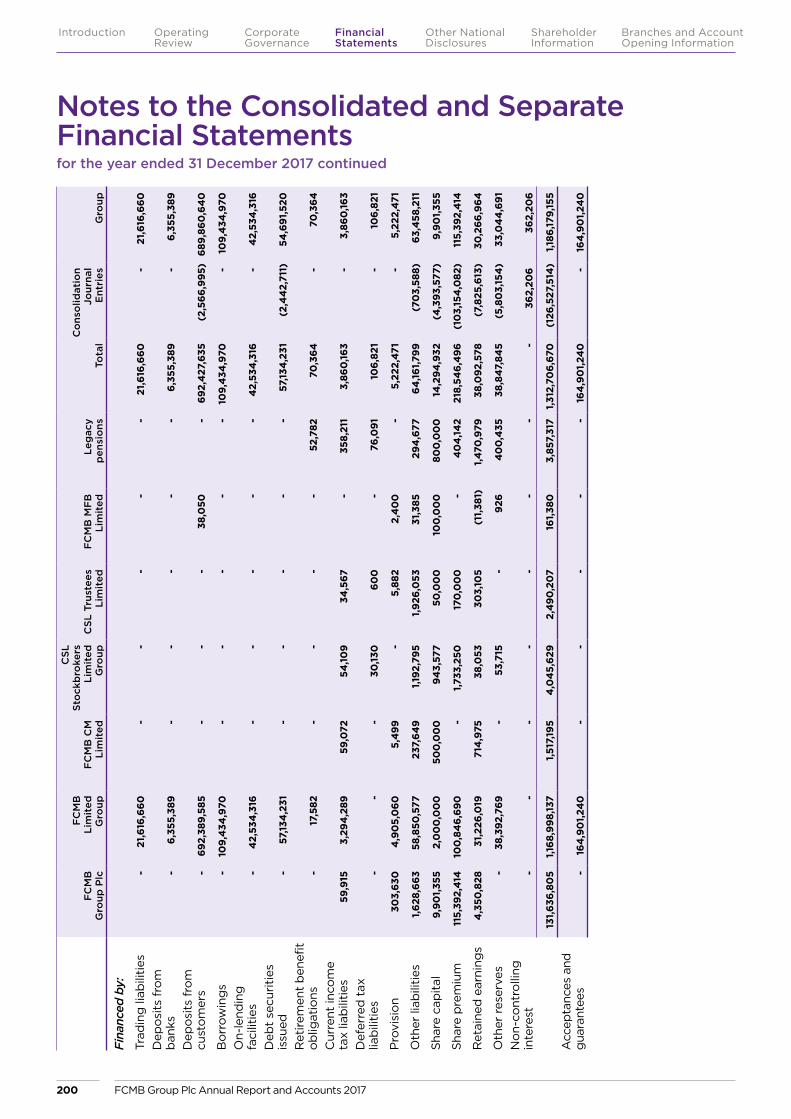
FC
MB
G
roup
Plc
FC
MB
Li
mit
ed
Gro
upF
CM
B C
M
Lim
ited
CSL
St
ock
bro
kers
Li
mit
ed
Gro
upC
SL T
rust
ees
Lim
ited
FC
MB
MF
B
Lim
ited
Leg
acy
pen
sio
nsTo
tal
Co
nso
lidat
ion
Jour
nal
Ent
ries
Gro
up
Fina
nced
by:
Trad
ing
liab
iliti
es -
21
,616
,660
-
-
-
-
-
21,6
16,6
60 -
21
,616
,660
Dep
osi
ts f
rom
b
anks
-
6,35
5,38
9 -
-
-
-
-
6,
355,
389
-
6,35
5,38
9
Dep
osi
ts f
rom
cu
sto
mer
s -
69
2,38
9,58
5 -
-
-
3
8,0
50
-
692,
427
,635
(2,5
66,9
95)
689,
860
,64
0
Bo
rrow
ing
s -
10
9,4
34,9
70 -
-
-
-
-
10
9,4
34,9
70 -
10
9,4
34,9
70
On-
lend
ing
fa
cilit
ies
-
42,
534
,316
-
-
-
-
-
42,
534
,316
-
42,
534
,316
Deb
t se
curi
ties
is
sued
-
57,13
4,2
31 -
-
-
-
-
57
,134
,231
(2,4
42,
711)
54,6
91,5
20
Ret
irem
ent
ben
efit
o
blig
atio
ns -
17
,582
-
-
-
-
52,
782
70,3
64 -
70
,364
Cur
rent
inco
me
tax
liab
iliti
es59
,915
3,29
4,2
8959
,072
54,10
934
,567
-
358,
211
3,86
0,16
3 -
3,
860
,163
Def
erre
d t
ax
liab
iliti
es -
-
-
30
,130
600
-
76,0
91 1
06,
821
-
10
6,82
1
Pro
visi
on
303,
630
4,9
05,
060
5,4
99 -
5,
882
2,4
00
-
5,2
22,4
71
-
5,22
2,47
1
Oth
er li
abili
ties
1,62
8,66
358
,850
,577
237,
649
1,192
,795
1,92
6,0
5331
,385
294
,677
64,16
1,799
(70
3,58
8)63
,458
,211
Sha
re c
apit
al9,
901,
355
2,0
00
,00
050
0,0
00
943,
577
50,0
00
100
,00
080
0,0
00
14,2
94,9
32(4
,393
,577
)9,
901,
355
Sha
re p
rem
ium
115,
392,
414
100
,84
6,69
0 -
1,7
33,2
5017
0,0
00
-
40
4,14
221
8,54
6,4
96(1
03,
154
,082
)11
5,39
2,41
4
Ret
aine
d e
arni
ngs
4,3
50,8
2831
,226
,019
714
,975
38
,053
30
3,10
5 (1
1,38
1)1,
470
,979
38,0
92,5
78(7
,825
,613
)30
,266
,964
Oth
er r
eser
ves
-
38,3
92,7
69 -
53
,715
-
926
4
00
,435
38,8
47,8
45
(5,8
03,
154
)33
,04
4,6
91
No
n-co
ntro
lling
in
tere
st -
-
-
-
-
-
-
-
3
62,2
06
36
2,20
6
131,
636,
805
1,168
,998
,137
1,51
7,19
5 4
,04
5,62
9
2,4
90,2
07
161,
380
3,
857,
317
1,31
2,70
6,67
0
(126
,527
,514
)1,1
86,17
9,15
5
Acc
epta
nces
and
g
uara
ntee
s -
1
64,9
01,
240
-
-
-
-
-
16
4,9
01,
240
-
164
,90
1,24
0
Notes to the Consolidated and Separate Financial Statementsfor the year ended 31 December 2017 continued
FCMB Group Plc Annual Report and Accounts 2017200
Introduction Operating Review
Corporate Governance
Financial Statements
Shareholder Information
Other National Disclosures
Branches and Account Opening Information

FC
MB
G
roup
Plc
FC
MB
Li
mit
ed
Gro
upF
CM
B C
M
Lim
ited
CSL
St
ock
bro
kers
Li
mit
ed
Gro
upC
SL T
rust
ees
Lim
ited
FC
MB
MF
B
Lim
ited
Leg
acy
pen
sio
nsTo
tal
Co
nso
lidat
ion
Jour
nal
Ent
ries
Gro
up
Res
ults
of
oper
atio
nsIn
tere
st a
nd
dis
coun
t in
com
e47
5,47
412
3,92
5,27
313
7,87
56
21,4
754
9,0
50 -
-
12
5,16
0,0
97(5
1,06
2)12
5,10
9,0
35
Inte
rest
exp
ense
-
(55,
630
,093
) -
(3
11,0
68)
-
-
-
(55,
94
1,161
)36
5,63
4(5
5,57
5,52
7)
Net
inte
rest
in
com
e47
5,47
46
8,29
5,18
013
7,87
531
0,4
07
49,
050
-
-
69,2
18,9
3631
4,5
7269
,533
,50
8
Oth
er in
com
e4
,178,
595
44
,285
,792
46
5,52
59
02,
055
242,
237
-
-
50,0
74,2
04
(2,3
33,3
18)
47,7
40
,886
Op
erat
ing
inco
me
4,6
54,0
6911
2,58
0,9
726
03,
40
01,2
12,4
62
291,2
87 -
-
11
9,34
2,19
0(2
,067
,79
6)
117,
274
,39
4
Op
erat
ing
ex
pen
ses
(79
8,87
0)
(63,
426
,387
)(5
78,6
83)
(86
5,82
7)(1
03,
90
9)
-
-
(65,
773,
675)
-
(65,
773,
675)
Pro
visi
on
exp
ense
(10
5,58
9)
(35,
310
,997
) 19
,46
2 (1
24,9
47)
-
-
-
(35,
522,
071
) -
(3
5,52
2,0
71)
Sha
re o
f p
ost
tax
re
sult
of
asso
ciat
e -
-
-
-
-
-
-
2
72,7
49
27
2,74
9
Pro
fit b
efor
e ta
x3,
749,
611
13,8
43,
589
4
4,17
922
1,688
18
7,37
8 -
-
18
,04
6,4
44
(1,7
95,
047
)16
,251
,397
Tax
(19,
351)
(1,7
67,7
76)
(7,0
21)
(64
,105)
(54
,26
2) -
-
(1
,912
,515
) -
(1
,912
,515
)
Pro
fit a
fter
tax
3,73
0,2
6012
,075
,813
37
,158
157,
583
133,
116
-
-
16,13
3,92
9(1
,795
,047
)14
,338
,882
Oth
er
com
pre
hens
ive
inco
me
-
4,10
2,29
9
-
20,7
97 -
-
-
4
,123,
09
6 -
4
,123,
09
6
Tota
l co
mpr
ehen
sive
in
com
e fo
r th
e pe
riod
3,73
0,2
6016
,178,
112
37,15
817
8,38
0 1
33,11
6
-
-
20,2
57,0
25(1
,795
,047
)18
,461
,978
(ii)
The
co
nden
sed
fina
ncia
l dat
a o
f th
e co
nso
lidat
ed e
ntit
ies
as a
t 31
Dec
emb
er 2
016
wer
e as
fo
llow
s:
FCMB Group Plc Annual Report and Accounts 2017 201
Introduction Operating Review
Corporate Governance
Financial Statements
Shareholder Information
Other National Disclosures
Branches and Account Opening Information

FC
MB
G
roup
Plc
FC
MB
Li
mit
ed
Gro
upF
CM
B C
M
Lim
ited
CSL
St
ock
bro
kers
Li
mit
ed
Gro
upC
SL T
rust
ees
Lim
ited
FC
MB
MF
B
Lim
ited
Leg
acy
pen
sio
nsTo
tal
Co
nso
lidat
ion
Jour
nal
Ent
ries
Gro
up
Fina
ncia
l pos
ition
Ass
ets
Cas
h an
d c
ash
equi
vale
nts
5,81
7,75
410
6,4
24,3
224
54,13
460
9,55
51,
841,
853
-
-
115,
147,
618
(7,0
42,
986)
108,
104
,632
Res
tric
ted
res
erve
d
epo
sits
-
139,
460
,914
-
-
-
-
-
139,
460
,914
-
139,
460
,914
Trad
ing
ass
ets
-
8,41
1,62
9 -
7
42,
569
-
-
-
9,
154
,198
-
9,15
4,19
8
Der
ivat
ive
asse
ts
held
for
risk
m
anag
emen
t -
1,0
18,9
12 -
-
-
-
-
1,0
18,9
12 -
1,0
18,9
12
Loan
s an
d
adva
nces
to
cu
sto
mer
s -
65
9,70
0,2
2314
8,97
471
,163
16,8
77 -
-
65
9,93
7,23
7 -
65
9,93
7,23
7
Ass
ets
ple
dg
ed a
s co
llate
ral
-
59,10
7,13
2 -
-
-
-
-
59
,107,
132
-
59,10
7,13
2
Inve
stm
ent
secu
riti
es4
,84
4,2
00
123,
257,
882
840
,523
1,014
,910
926,
163
-
-
130
,883
,678
(2,4
42,
00
2)12
8,4
41,6
76
Inve
stm
ent
in
sub
sid
iari
es11
8,14
0,7
72 -
-
-
-
-
-
11
8,14
0,7
72(1
18,14
0,7
72)
-
Inve
stm
ent
in
asso
ciat
es 4
18,5
77
-
-
-
-
-
-
418,
577
427
,935
84
6,51
2
Pro
per
ty a
nd
equi
pm
ent
59,4
6832
,147,
706
37,4
3132
,466
6,15
5 -
-
32
,283
,226
-
32,2
83,2
26
Inta
ngib
le a
sset
s88
29,
425
,90
3 -
39
,869
-
-
-
9,4
66,6
54 2
05,
876
9,
672,
530
Def
erre
d t
ax
asse
ts -
7
,94
9,13
4
22,
856
-
-
-
-
7,
971,
990
-
7,97
1,99
0
Oth
er a
sset
s2,
084
,532
16,5
31,4
4716
,889
228,
760
68,4
31 -
-
18
,930
,059
(2,15
0,9
40
)16
,779
,119
131,
366,
185
1,163
,435
,20
41,
520
,80
72,
739,
292
2,85
9,47
9 -
-
1,
301,
920
,967
(129
,142,
889)
1,172
,778
,078
Notes to the Consolidated and Separate Financial Statementsfor the year ended 31 December 2017 continued
FCMB Group Plc Annual Report and Accounts 2017202
Introduction Operating Review
Corporate Governance
Financial Statements
Shareholder Information
Other National Disclosures
Branches and Account Opening Information
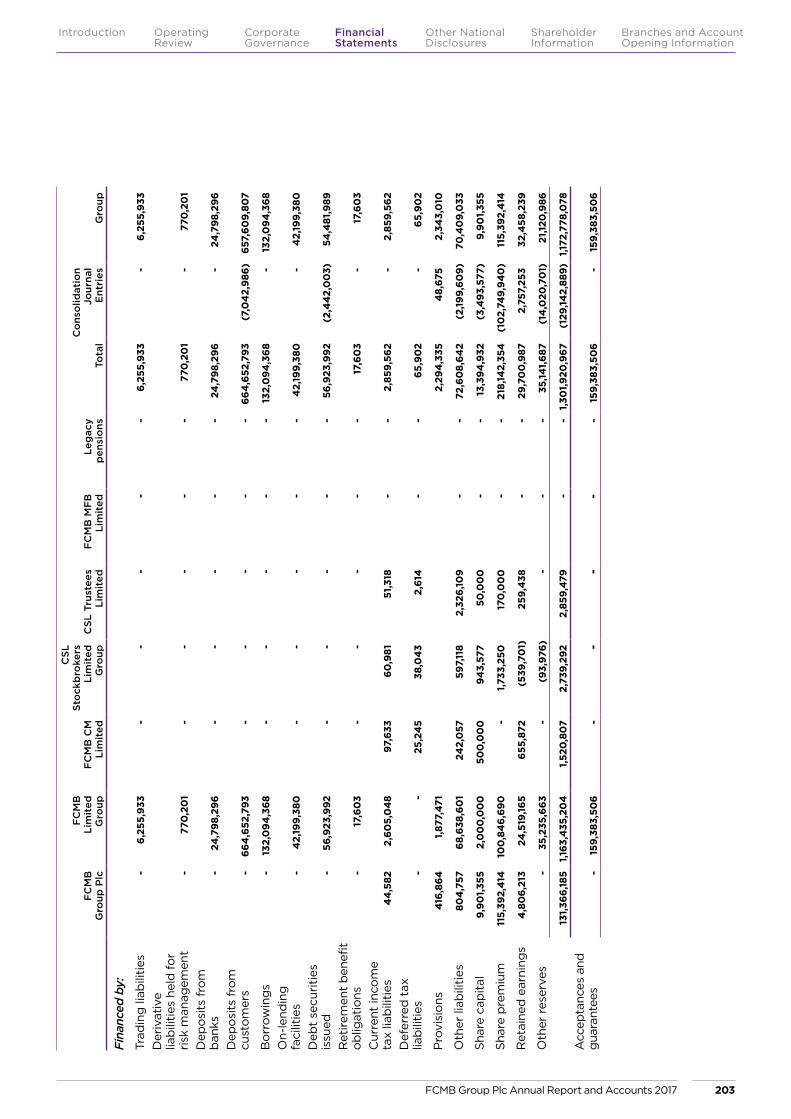
FC
MB
G
roup
Plc
FC
MB
Li
mit
ed
Gro
upF
CM
B C
M
Lim
ited
CSL
St
ock
bro
kers
Li
mit
ed
Gro
upC
SL T
rust
ees
Lim
ited
FC
MB
MF
B
Lim
ited
Leg
acy
pen
sio
nsTo
tal
Co
nso
lidat
ion
Jour
nal
Ent
ries
Gro
up
Fina
nced
by:
Trad
ing
liab
iliti
es -
6,
255,
933
-
-
-
-
-
6,25
5,93
3 -
6,
255,
933
Der
ivat
ive
liab
iliti
es h
eld
for
risk
man
agem
ent
-
770
,20
1 -
-
-
-
-
77
0,2
01
-
770
,20
1
Dep
osi
ts f
rom
b
anks
-
24,7
98,2
96 -
-
-
-
-
24
,798
,296
-
24,7
98,2
96
Dep
osi
ts f
rom
cu
sto
mer
s -
66
4,6
52,7
93 -
-
-
-
-
66
4,6
52,7
93(7
,04
2,98
6)65
7,60
9,80
7
Bo
rrow
ing
s -
13
2,0
94,3
68 -
-
-
-
-
13
2,0
94,3
68 -
13
2,0
94,3
68
On-
lend
ing
fa
cilit
ies
-
42,
199,
380
-
-
-
-
-
42,
199,
380
-
42,
199,
380
Deb
t se
curi
ties
is
sued
-
56,9
23,9
92 -
-
-
-
-
56
,923
,992
(2,4
42,
00
3)54
,481
,989
Ret
irem
ent
ben
efit
o
blig
atio
ns -
17
,60
3 -
-
-
-
-
17
,60
3 -
17
,60
3
Cur
rent
inco
me
tax
liab
iliti
es4
4,5
822,
605,
04
8 9
7,63
3 6
0,9
81
51,
318
-
-
2,85
9,56
2 -
2,
859,
562
Def
erre
d t
ax
liab
iliti
es -
-
2
5,24
5 3
8,0
43
2,6
14
-
-
65,9
02
-
65,9
02
Pro
visi
ons
416
,864
1,
877,
471
2,29
4,3
35 4
8,67
52,
343,
010
Oth
er li
abili
ties
804
,757
68,6
38,6
01
242,
057
597,
118
2,32
6,10
9 -
-
72
,60
8,64
2(2
,199,
609)
70,4
09,
033
Sha
re c
apit
al9,
901,
355
2,0
00
,00
050
0,0
00
943,
577
50,0
00
-
-
13,3
94,9
32(3
,493
,577
)9,
901,
355
Sha
re p
rem
ium
115,
392,
414
100
,84
6,69
0 -
1
,733
,250
1
70,0
00
-
-
21
8,14
2,35
4(1
02,
749,
940
)11
5,39
2,41
4
Ret
aine
d e
arni
ngs
4,8
06,
213
24,5
19,16
565
5,87
2 (5
39,7
01)
259,
438
-
-
29
,70
0,9
872,
757,
253
32,4
58,2
39
Oth
er r
eser
ves
-
35,2
35,6
63 -
(9
3,97
6) -
-
-
35
,141,
687
(14
,020
,70
1)21
,120
,986
131,
366,
185
1,163
,435
,20
4
1,52
0,8
07
2,73
9,29
2 2,
859,
479
-
-
1,
301,
920
,967
(1
29,14
2,88
9)1,1
72,7
78,0
78
Acc
epta
nces
and
g
uara
ntee
s -
15
9,38
3,50
6
-
-
-
-
-
159,
383,
506
-
159,
383,
506
FCMB Group Plc Annual Report and Accounts 2017 203
Introduction Operating Review
Corporate Governance
Financial Statements
Shareholder Information
Other National Disclosures
Branches and Account Opening Information
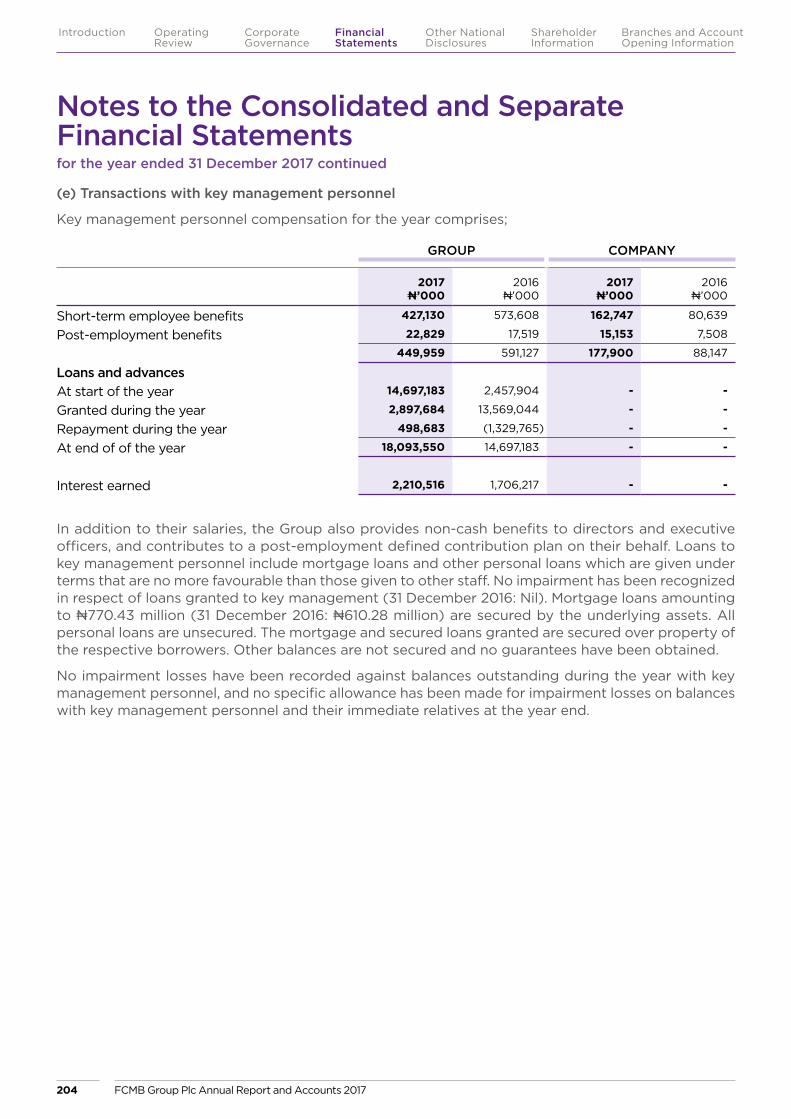
(e) Transactions with key management personnel
Key management personnel compensation for the year comprises;
In addition to their salaries, the Group also provides non-cash benefits to directors and executive officers, and contributes to a post-employment defined contribution plan on their behalf. Loans to key management personnel include mortgage loans and other personal loans which are given under terms that are no more favourable than those given to other staff. No impairment has been recognized in respect of loans granted to key management (31 December 2016: Nil). Mortgage loans amounting to N770.43 million (31 December 2016: N610.28 million) are secured by the underlying assets. All personal loans are unsecured. The mortgage and secured loans granted are secured over property of the respective borrowers. Other balances are not secured and no guarantees have been obtained.
No impairment losses have been recorded against balances outstanding during the year with key management personnel, and no specific allowance has been made for impairment losses on balances with key management personnel and their immediate relatives at the year end.
GROUP COMPANY
2017N’000
2016N’000
2017N’000
2016N’000
Short-term employee benefits 427,130 573,608 162,747 80,639
Post-employment benefits 22,829 17,519 15,153 7,508
449,959 591,127 177,900 88,147
Loans and advances At start of the year 14,697,183 2,457,904 - -
Granted during the year 2,897,684 13,569,044 - -
Repayment during the year 498,683 (1,329,765) - -
At end of of the year 18,093,550 14,697,183 - -
Interest earned 2,210,516 1,706,217 - -
Notes to the Consolidated and Separate Financial Statementsfor the year ended 31 December 2017 continued
FCMB Group Plc Annual Report and Accounts 2017204
Introduction Operating Review
Corporate Governance
Financial Statements
Shareholder Information
Other National Disclosures
Branches and Account Opening Information
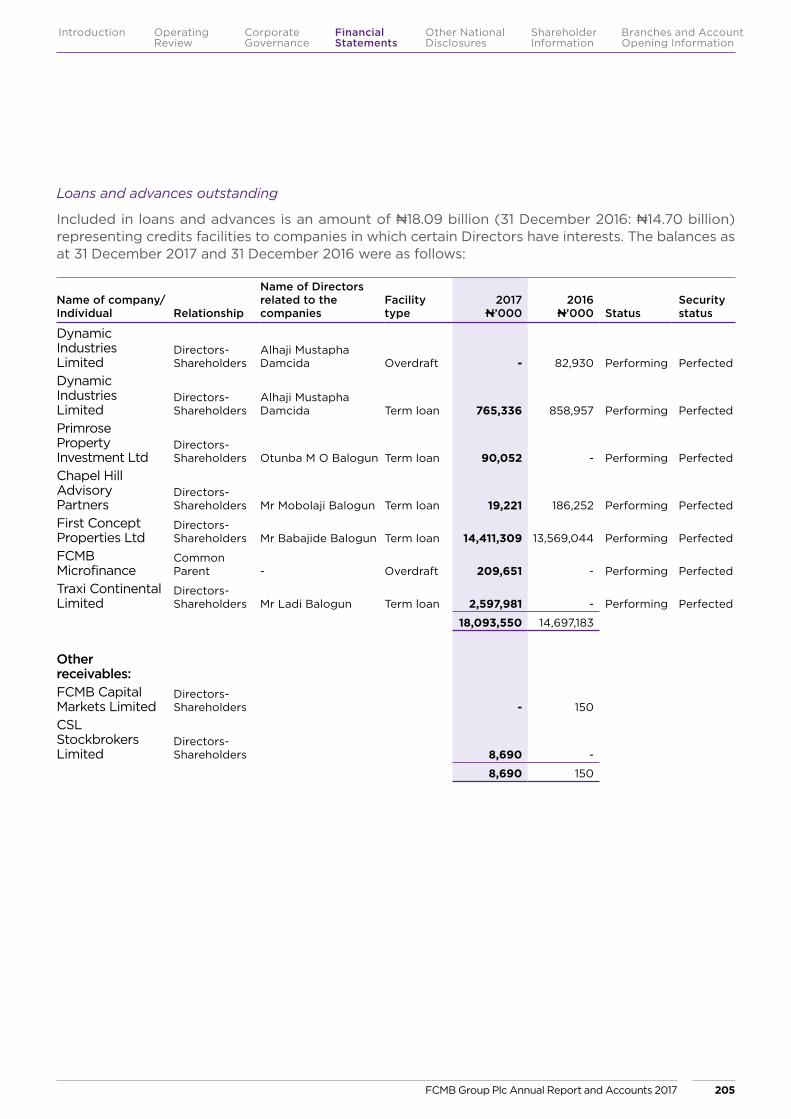
Name of company/Individual Relationship
Name of Directors related to the companies
Facility type
2017N’000
2016N’000 Status
Security status
Dynamic Industries Limited
Directors-Shareholders
Alhaji Mustapha Damcida Overdraft - 82,930 Performing Perfected
Dynamic Industries Limited
Directors-Shareholders
Alhaji Mustapha Damcida Term loan 765,336 858,957 Performing Perfected
Primrose Property Investment Ltd
Directors-Shareholders Otunba M O Balogun Term loan 90,052 - Performing Perfected
Chapel Hill Advisory Partners
Directors-Shareholders Mr Mobolaji Balogun Term loan 19,221 186,252 Performing Perfected
First Concept Properties Ltd
Directors-Shareholders Mr Babajide Balogun Term loan 14,411,309 13,569,044 Performing Perfected
FCMB Microfinance
Common Parent - Overdraft 209,651 - Performing Perfected
Traxi Continental Limited
Directors-Shareholders Mr Ladi Balogun Term loan 2,597,981 - Performing Perfected
18,093,550 14,697,183
Other receivables:FCMB Capital Markets Limited
Directors-Shareholders - 150
CSL Stockbrokers Limited
Directors-Shareholders 8,690 -
8,690 150
Loans and advances outstanding
Included in loans and advances is an amount of N18.09 billion (31 December 2016: N14.70 billion) representing credits facilities to companies in which certain Directors have interests. The balances as at 31 December 2017 and 31 December 2016 were as follows:
FCMB Group Plc Annual Report and Accounts 2017 205
Introduction Operating Review
Corporate Governance
Financial Statements
Shareholder Information
Other National Disclosures
Branches and Account Opening Information
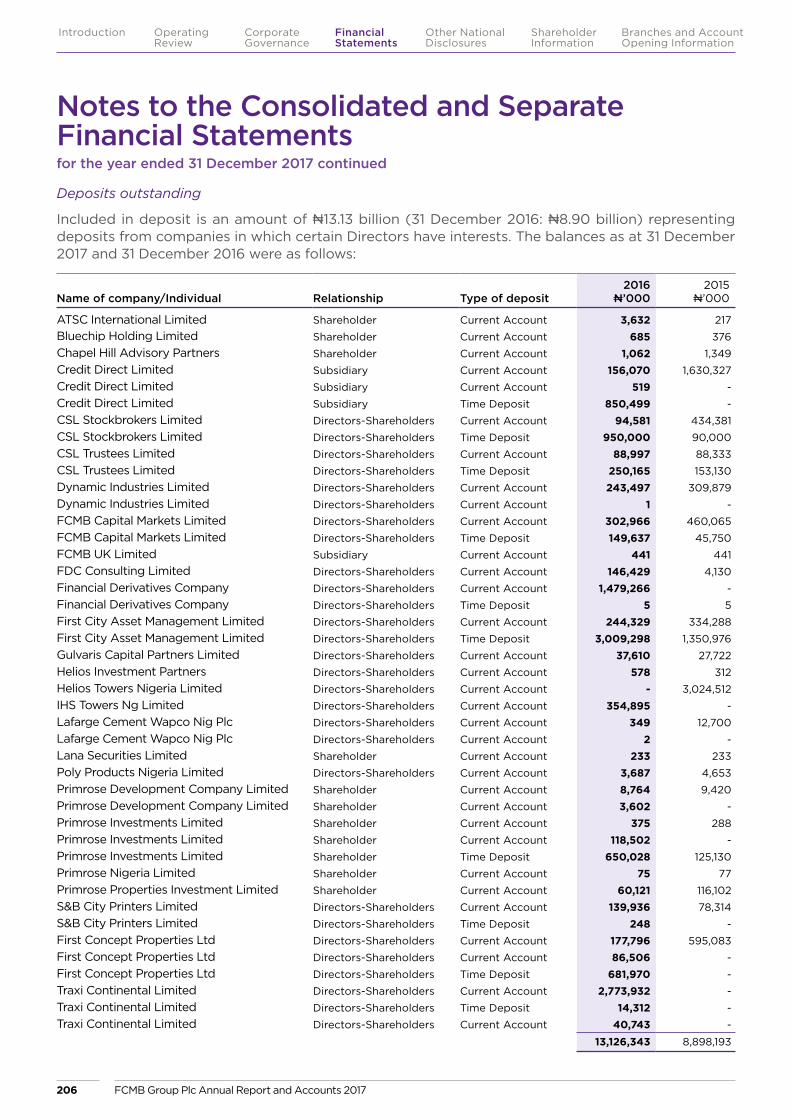
Deposits outstanding
Included in deposit is an amount of N13.13 billion (31 December 2016: N8.90 billion) representing deposits from companies in which certain Directors have interests. The balances as at 31 December 2017 and 31 December 2016 were as follows:
Name of company/Individual Relationship Type of deposit2016
N’0002015
N’000
ATSC International Limited Shareholder Current Account 3,632 217Bluechip Holding Limited Shareholder Current Account 685 376Chapel Hill Advisory Partners Shareholder Current Account 1,062 1,349Credit Direct Limited Subsidiary Current Account 156,070 1,630,327Credit Direct Limited Subsidiary Current Account 519 - Credit Direct Limited Subsidiary Time Deposit 850,499 - CSL Stockbrokers Limited Directors-Shareholders Current Account 94,581 434,381CSL Stockbrokers Limited Directors-Shareholders Time Deposit 950,000 90,000CSL Trustees Limited Directors-Shareholders Current Account 88,997 88,333CSL Trustees Limited Directors-Shareholders Time Deposit 250,165 153,130Dynamic Industries Limited Directors-Shareholders Current Account 243,497 309,879Dynamic Industries Limited Directors-Shareholders Current Account 1 - FCMB Capital Markets Limited Directors-Shareholders Current Account 302,966 460,065FCMB Capital Markets Limited Directors-Shareholders Time Deposit 149,637 45,750FCMB UK Limited Subsidiary Current Account 441 441FDC Consulting Limited Directors-Shareholders Current Account 146,429 4,130Financial Derivatives Company Directors-Shareholders Current Account 1,479,266 - Financial Derivatives Company Directors-Shareholders Time Deposit 5 5First City Asset Management Limited Directors-Shareholders Current Account 244,329 334,288First City Asset Management Limited Directors-Shareholders Time Deposit 3,009,298 1,350,976Gulvaris Capital Partners Limited Directors-Shareholders Current Account 37,610 27,722Helios Investment Partners Directors-Shareholders Current Account 578 312Helios Towers Nigeria Limited Directors-Shareholders Current Account - 3,024,512IHS Towers Ng Limited Directors-Shareholders Current Account 354,895 - Lafarge Cement Wapco Nig Plc Directors-Shareholders Current Account 349 12,700Lafarge Cement Wapco Nig Plc Directors-Shareholders Current Account 2 - Lana Securities Limited Shareholder Current Account 233 233Poly Products Nigeria Limited Directors-Shareholders Current Account 3,687 4,653Primrose Development Company Limited Shareholder Current Account 8,764 9,420 Primrose Development Company Limited Shareholder Current Account 3,602 - Primrose Investments Limited Shareholder Current Account 375 288Primrose Investments Limited Shareholder Current Account 118,502 - Primrose Investments Limited Shareholder Time Deposit 650,028 125,130Primrose Nigeria Limited Shareholder Current Account 75 77Primrose Properties Investment Limited Shareholder Current Account 60,121 116,102S&B City Printers Limited Directors-Shareholders Current Account 139,936 78,314S&B City Printers Limited Directors-Shareholders Time Deposit 248 - First Concept Properties Ltd Directors-Shareholders Current Account 177,796 595,083First Concept Properties Ltd Directors-Shareholders Current Account 86,506 - First Concept Properties Ltd Directors-Shareholders Time Deposit 681,970 - Traxi Continental Limited Directors-Shareholders Current Account 2,773,932 - Traxi Continental Limited Directors-Shareholders Time Deposit 14,312 - Traxi Continental Limited Directors-Shareholders Current Account 40,743 -
13,126,343 8,898,193
Notes to the Consolidated and Separate Financial Statementsfor the year ended 31 December 2017 continued
FCMB Group Plc Annual Report and Accounts 2017206
Introduction Operating Review
Corporate Governance
Financial Statements
Shareholder Information
Other National Disclosures
Branches and Account Opening Information
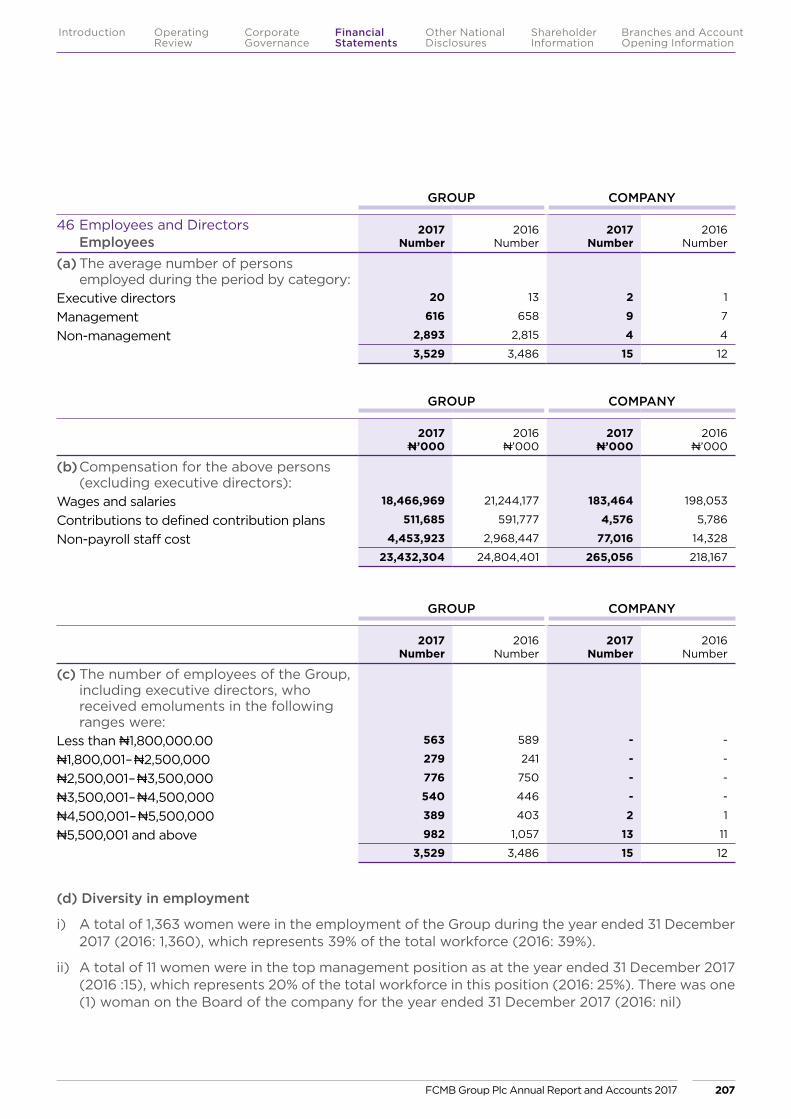
GROUP COMPANY
46 Employees and Directors Employees
2017Number
2016Number
2017Number
2016Number
(a) The average number of persons employed during the period by category:
Executive directors 20 13 2 1
Management 616 658 9 7
Non-management 2,893 2,815 4 4
3,529 3,486 15 12
GROUP COMPANY
2017N’000
2016N’000
2017N’000
2016N’000
(b) Compensation for the above persons (excluding executive directors):
Wages and salaries 18,466,969 21,244,177 183,464 198,053
Contributions to defined contribution plans 511,685 591,777 4,576 5,786
Non-payroll staff cost 4,453,923 2,968,447 77,016 14,328
23,432,304 24,804,401 265,056 218,167
GROUP COMPANY
2017Number
2016Number
2017Number
2016Number
(c) The number of employees of the Group, including executive directors, who received emoluments in the following ranges were:
Less than N1,800,000.00 563 589 - -
N1,800,001–N2,500,000 279 241 - -
N2,500,001–N3,500,000 776 750 - -
N3,500,001–N4,500,000 540 446 - -
N4,500,001–N5,500,000 389 403 2 1
N5,500,001 and above 982 1,057 13 11
3,529 3,486 15 12
(d) Diversity in employment
i) A total of 1,363 women were in the employment of the Group during the year ended 31 December 2017 (2016: 1,360), which represents 39% of the total workforce (2016: 39%).
ii) A total of 11 women were in the top management position as at the year ended 31 December 2017 (2016 :15), which represents 20% of the total workforce in this position (2016: 25%). There was one (1) woman on the Board of the company for the year ended 31 December 2017 (2016: nil)
FCMB Group Plc Annual Report and Accounts 2017 207
Introduction Operating Review
Corporate Governance
Financial Statements
Shareholder Information
Other National Disclosures
Branches and Account Opening Information

(e) Directors
The remuneration paid to the directors of the Group (excluding pension and certain allowances) was:
GROUP COMPANY
2017N’000
2016N’000
2017N’000
2016N’000
Fees 152,975 181,742 78,375 85,500
Sitting allowances 53,300 59,150 22,100 21,600
Executive compensation 427,130 573,608 162,747 80,639
633,405 814,500 263,222 187,739
Directors’ other expenses 304,543 63,939 6,685 8,094
937,948 878,439 269,907 195,833
The Directors’ remuneration shown above includes: The Chairman 10,500 10,500 10,500 10,500
Highest paid director 95,858 80,965 95,858 80,639
iii) The analysis by grade is as shown below:
GROUP
Grade level2017 2016
Male Female Total Male Female Total
Assistant General Manager (AGM) 24 5 29 21 6 27
Deputy General Manager (DGM) 15 4 19 19 5 24
General Manager (GM) 4 2 6 5 4 9
Total 43 11 54 45 15 60
Executive Director (ED) 9 2 11 5 1 6
Group Chief Executive/Chief Executive Officer (GCE/CEO) 8 - 8 6 - 6
Non-Executive Director 19 5 24 17 3 20
Total 36 7 43 28 4 32
iv) The Group is committed to maintain a positive work environment and to conduct business in a positive, professional manner and will ensure equal employment opportunity.
Notes to the Consolidated and Separate Financial Statementsfor the year ended 31 December 2017 continued
FCMB Group Plc Annual Report and Accounts 2017208
Introduction Operating Review
Corporate Governance
Financial Statements
Shareholder Information
Other National Disclosures
Branches and Account Opening Information
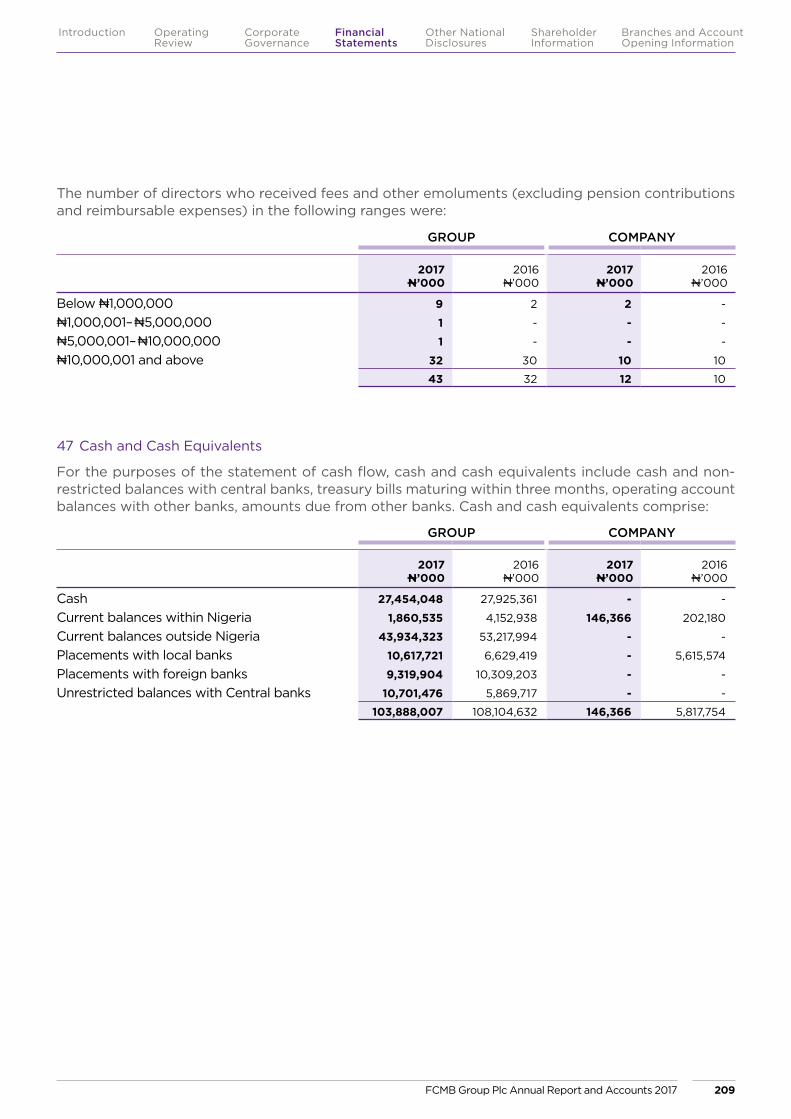
The number of directors who received fees and other emoluments (excluding pension contributions and reimbursable expenses) in the following ranges were:
GROUP COMPANY
2017N’000
2016N’000
2017N’000
2016N’000
Below N1,000,000 9 2 2 -
N1,000,001–N5,000,000 1 - - -
N5,000,001–N10,000,000 1 - - -
N10,000,001 and above 32 30 10 10
43 32 12 10
47 Cash and Cash Equivalents
For the purposes of the statement of cash flow, cash and cash equivalents include cash and non-restricted balances with central banks, treasury bills maturing within three months, operating account balances with other banks, amounts due from other banks. Cash and cash equivalents comprise:
GROUP COMPANY
2017N’000
2016N’000
2017N’000
2016N’000
Cash 27,454,048 27,925,361 - -
Current balances within Nigeria 1,860,535 4,152,938 146,366 202,180
Current balances outside Nigeria 43,934,323 53,217,994 - -
Placements with local banks 10,617,721 6,629,419 - 5,615,574
Placements with foreign banks 9,319,904 10,309,203 - -
Unrestricted balances with Central banks 10,701,476 5,869,717 - -
103,888,007 108,104,632 146,366 5,817,754
FCMB Group Plc Annual Report and Accounts 2017 209
Introduction Operating Review
Corporate Governance
Financial Statements
Shareholder Information
Other National Disclosures
Branches and Account Opening Information
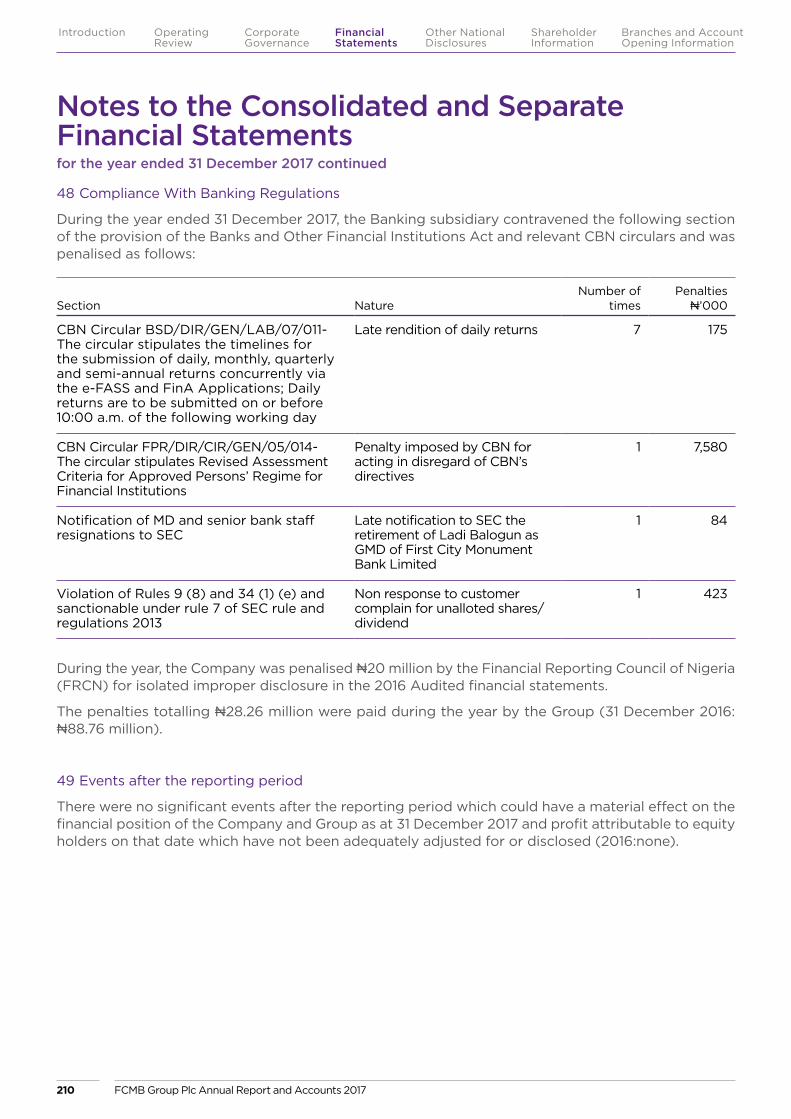
Section Nature Number of
times Penalties
N’000
CBN Circular BSD/DIR/GEN/LAB/07/011-The circular stipulates the timelines for the submission of daily, monthly, quarterly and semi-annual returns concurrently via the e-FASS and FinA Applications; Daily returns are to be submitted on or before 10:00 a.m. of the following working day
Late rendition of daily returns 7 175
CBN Circular FPR/DIR/CIR/GEN/05/014-The circular stipulates Revised Assessment Criteria for Approved Persons’ Regime for Financial Institutions
Penalty imposed by CBN for acting in disregard of CBN’s directives
1 7,580
Notification of MD and senior bank staff resignations to SEC
Late notification to SEC the retirement of Ladi Balogun as GMD of First City Monument Bank Limited
1 84
Violation of Rules 9 (8) and 34 (1) (e) and sanctionable under rule 7 of SEC rule and regulations 2013
Non response to customer complain for unalloted shares/dividend
1 423
48 Compliance With Banking Regulations
During the year ended 31 December 2017, the Banking subsidiary contravened the following section of the provision of the Banks and Other Financial Institutions Act and relevant CBN circulars and was penalised as follows:
During the year, the Company was penalised N20 million by the Financial Reporting Council of Nigeria (FRCN) for isolated improper disclosure in the 2016 Audited financial statements.
The penalties totalling N28.26 million were paid during the year by the Group (31 December 2016: N88.76 million).
49 Events after the reporting period
There were no significant events after the reporting period which could have a material effect on the financial position of the Company and Group as at 31 December 2017 and profit attributable to equity holders on that date which have not been adequately adjusted for or disclosed (2016:none).
Notes to the Consolidated and Separate Financial Statementsfor the year ended 31 December 2017 continued
FCMB Group Plc Annual Report and Accounts 2017210
Introduction Operating Review
Corporate Governance
Financial Statements
Shareholder Information
Other National Disclosures
Branches and Account Opening Information
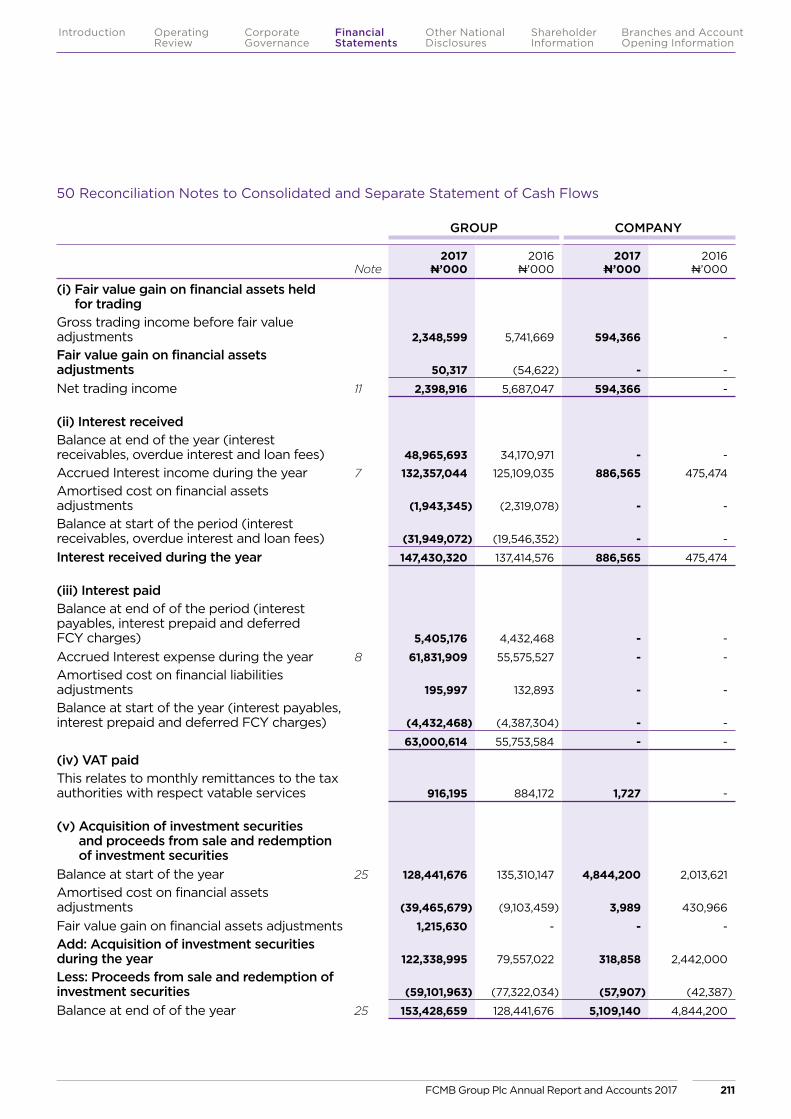
50 Reconciliation Notes to Consolidated and Separate Statement of Cash Flows
GROUP COMPANY
Note2017
N’0002016
N’0002017
N’0002016
N’000
(i) Fair value gain on financial assets held for trading
Gross trading income before fair value adjustments 2,348,599 5,741,669 594,366 -
Fair value gain on financial assets adjustments 50,317 (54,622) - -
Net trading income 11 2,398,916 5,687,047 594,366 -
(ii) Interest receivedBalance at end of the year (interest receivables, overdue interest and loan fees) 48,965,693 34,170,971 - -
Accrued Interest income during the year 7 132,357,044 125,109,035 886,565 475,474
Amortised cost on financial assets adjustments (1,943,345) (2,319,078) - -
Balance at start of the period (interest receivables, overdue interest and loan fees) (31,949,072) (19,546,352) - -
Interest received during the year 147,430,320 137,414,576 886,565 475,474
(iii) Interest paidBalance at end of of the period (interest payables, interest prepaid and deferred FCY charges) 5,405,176 4,432,468 - -
Accrued Interest expense during the year 8 61,831,909 55,575,527 - -
Amortised cost on financial liabilities adjustments 195,997 132,893 - -
Balance at start of the year (interest payables, interest prepaid and deferred FCY charges) (4,432,468) (4,387,304) - -
63,000,614 55,753,584 - -
(iv) VAT paidThis relates to monthly remittances to the tax authorities with respect vatable services 916,195 884,172 1,727 -
(v) Acquisition of investment securities and proceeds from sale and redemption of investment securities
Balance at start of the year 25 128,441,676 135,310,147 4,844,200 2,013,621
Amortised cost on financial assets adjustments (39,465,679) (9,103,459) 3,989 430,966
Fair value gain on financial assets adjustments 1,215,630 - - -
Add: Acquisition of investment securities during the year 122,338,995 79,557,022 318,858 2,442,000
Less: Proceeds from sale and redemption of investment securities (59,101,963) (77,322,034) (57,907) (42,387)
Balance at end of of the year 25 153,428,659 128,441,676 5,109,140 4,844,200
FCMB Group Plc Annual Report and Accounts 2017 211
Introduction Operating Review
Corporate Governance
Financial Statements
Shareholder Information
Other National Disclosures
Branches and Account Opening Information

GROUP COMPANY
Note2017
N’0002016
N’0002017
N’0002016
N’000
(vi) Effect of exchange rate fluctuations on cash and cash equivalents held
Balance at end of of the year on net translated foreign balances at closing exchange rates 72,135,364 115,692,662 3,125,220 1,518,678
Balance at start of the year on net translated foreign balances at opening exchange rates (70,653,357) (68,424,778) (2,346,235) (13,331)
1,482,007 47,267,884 778,985 1,505,347
(vii) Net (decrease)/increase in other liabilities
Closing balance for the year 40 63,458,211 70,409,033 1,628,663 804,757
Total amounts remitted under retirement benefit obligations 38 (1,063,868) (298,759) (8,237) (10,415)
Opening balance for the year 40 (70,409,033) (86,796,251) (804,757) (575,720)
Net (decrease)/increase in other liabilities (8,014,690) (16,685,977) 815,669 218,622
(viii) Net increase/(decrease) in provisionOpening balance for the year 39 (2,343,010) (2,878,983) (416,864) (427,317)
Closing balance for the year 39 5,222,471 2,343,010 303,630 416,864
Net increase/(decrease) in provision 2,879,461 (535,973) (113,234) (10,453)
(ix) Proceeds from sale of property and equipment
Gain/(loss) on sale of property and equipment 13 1,040,777 (1,408,352) 46 570
Cost eliminated on disposal during the year 29 1,599,941 3,707,901 4,235 49,698
Accumulated depreciation and impairment losses – eliminated on Disposal 29 (266,634) (2,051,637) (3,561) (22,997)
2,374,084 247,912 720 27,271
(x) Net interest incomeInterest income 7 132,357,044 125,109,035 886,565 475,474
Interest expense 8 (61,831,909) (55,575,527) - -
70,525,135 69,533,508 886,565 475,474
(xi) Net decrease/(increase) restricted reserve deposits
Opening balance for the year 21 139,460,914 125,552,318 - -
Closing balance for the year 21 (109,638,559) (139,460,914) - -
29,822,355 (13,908,596) - -
(xii) Net increase in Derivative assets held held for risk management
Opening balance for the year 23 1,018,912 1,479,760 - -
Fair value gain on financial assets adjustments (1,018,912) 511,135 - -
Closing balance for the year 23 - (1,018,912) - -
- 971,983 - -
Notes to the Consolidated and Separate Financial Statementsfor the year ended 31 December 2017 continued
FCMB Group Plc Annual Report and Accounts 2017212
Introduction Operating Review
Corporate Governance
Financial Statements
Shareholder Information
Other National Disclosures
Branches and Account Opening Information
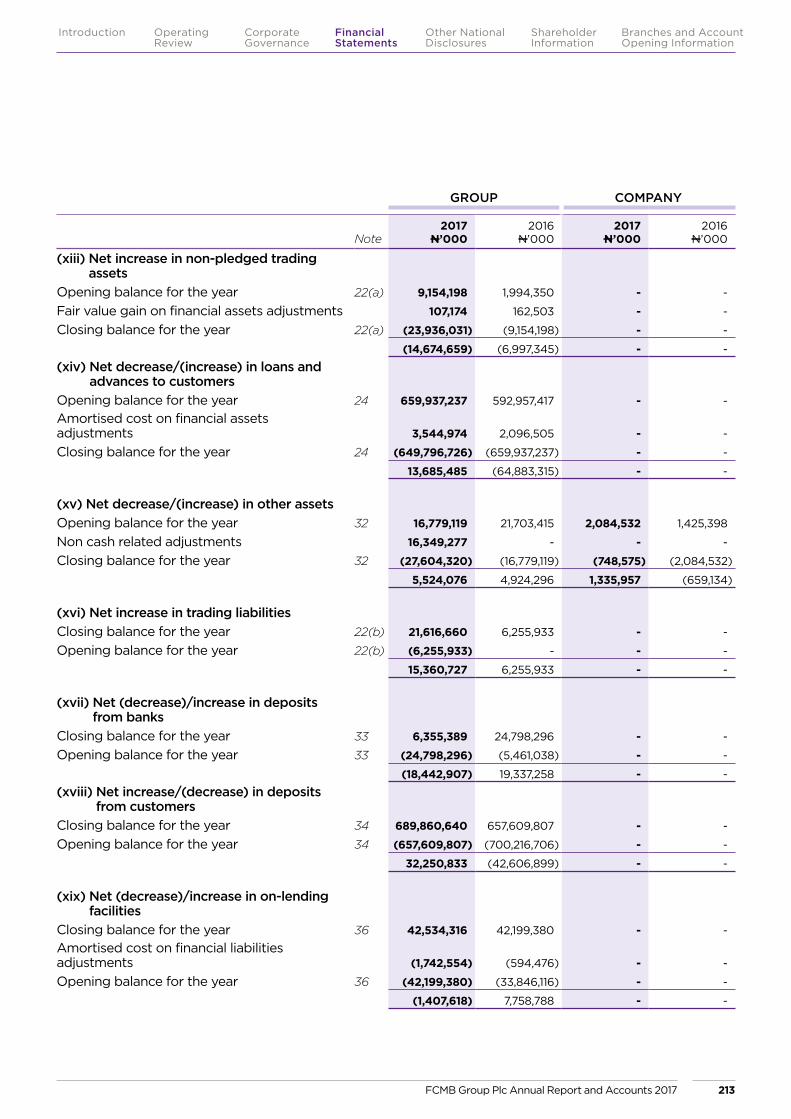
GROUP COMPANY
Note2017
N’0002016
N’0002017
N’0002016
N’000
(xiii) Net increase in non-pledged trading assets
Opening balance for the year 22(a) 9,154,198 1,994,350 - -
Fair value gain on financial assets adjustments 107,174 162,503 - -
Closing balance for the year 22(a) (23,936,031) (9,154,198) - -
(14,674,659) (6,997,345) - -
(xiv) Net decrease/(increase) in loans and advances to customers
Opening balance for the year 24 659,937,237 592,957,417 - -
Amortised cost on financial assets adjustments 3,544,974 2,096,505 - -
Closing balance for the year 24 (649,796,726) (659,937,237) - -
13,685,485 (64,883,315) - -
(xv) Net decrease/(increase) in other assetsOpening balance for the year 32 16,779,119 21,703,415 2,084,532 1,425,398
Non cash related adjustments 16,349,277 - - -
Closing balance for the year 32 (27,604,320) (16,779,119) (748,575) (2,084,532)
5,524,076 4,924,296 1,335,957 (659,134)
(xvi) Net increase in trading liabilitiesClosing balance for the year 22(b) 21,616,660 6,255,933 - -
Opening balance for the year 22(b) (6,255,933) - - -
15,360,727 6,255,933 - -
(xvii) Net (decrease)/increase in deposits from banks
Closing balance for the year 33 6,355,389 24,798,296 - -
Opening balance for the year 33 (24,798,296) (5,461,038) - -
(18,442,907) 19,337,258 - -
(xviii) Net increase/(decrease) in deposits from customers
Closing balance for the year 34 689,860,640 657,609,807 - -
Opening balance for the year 34 (657,609,807) (700,216,706) - -
32,250,833 (42,606,899) - -
(xix) Net (decrease)/increase in on-lending facilities
Closing balance for the year 36 42,534,316 42,199,380 - -
Amortised cost on financial liabilities adjustments (1,742,554) (594,476) - -
Opening balance for the year 36 (42,199,380) (33,846,116) - -
(1,407,618) 7,758,788 - -
FCMB Group Plc Annual Report and Accounts 2017 213
Introduction Operating Review
Corporate Governance
Financial Statements
Shareholder Information
Other National Disclosures
Branches and Account Opening Information

51 Reclassification Note on Provisions for the Prior Year
Provisions amount was reclassified from the Other liabilities in the prior year based on the significance of the amount for the current year.
GROUP COMPANY
2017N’000
2016N’000
2017N’000
2016N’000
Other liabilities 68,680,682 72,752,043 1,932,293 1,221,621
Provisions (5,222,471) (2,343,010) (303,630) (416,864)
63,458,211 70,409,033 1,628,663 804,757
GROUP COMPANY
Note2017
N’0002016
N’0002017
N’0002016
N’000
(xx) Net decrease in derivative liabilities held for risk management
Closing balance for the year 23 - 770,201 - -
Fair value gain on financial liabilities adjustments - (526,053) - -
Opening balance for the year 23 (770,201) (1,317,271) - -
(770,201) (1,073,123) - -
(xxi) Net increase in debt securities issuedOpening balance for the year 37 54,481,989 49,309,394 - -
Additions during the year - 5,104,000 - -
Accrued coupon interest for the year 670,019 966,566 - -
Coupon interest paid during the year (772,112) (1,219,710) - -
Amortised cost on financial liabilities adjustments 311,624 323,739 - -
Closing balance for the year 37 54,691,520 54,481,989 - -
(xxii) Dividend receivedDividend accrued within the year 13 567,166 448,538 793,045 2,252,195
Dividend received within the year (567,166) (448,538) (228,417) (2,252,195)
Dividend receivable as at end of year - - 564,628 -
Notes to the Consolidated and Separate Financial Statementsfor the year ended 31 December 2017 continued
FCMB Group Plc Annual Report and Accounts 2017214
Introduction Operating Review
Corporate Governance
Financial Statements
Shareholder Information
Other National Disclosures
Branches and Account Opening Information
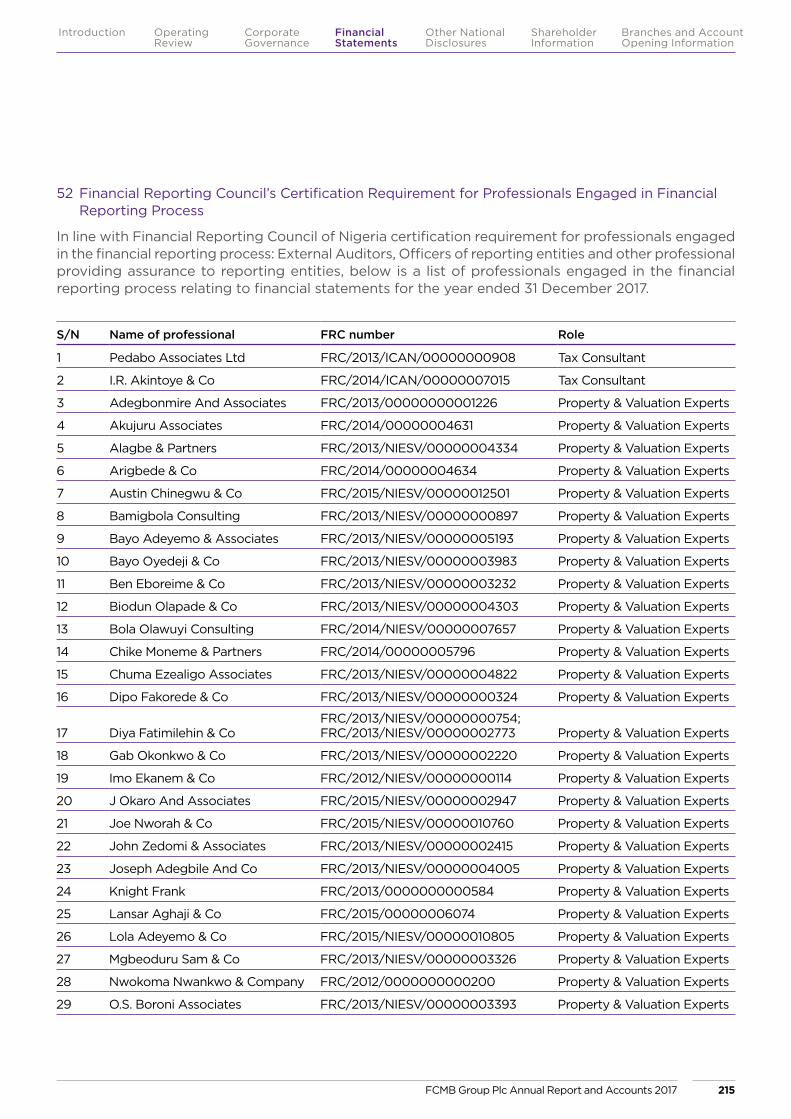
52 Financial Reporting Council’s Certification Requirement for Professionals Engaged in Financial Reporting Process
In line with Financial Reporting Council of Nigeria certification requirement for professionals engaged in the financial reporting process: External Auditors, Officers of reporting entities and other professional providing assurance to reporting entities, below is a list of professionals engaged in the financial reporting process relating to financial statements for the year ended 31 December 2017.
S/N Name of professional FRC number Role
1 Pedabo Associates Ltd FRC/2013/ICAN/00000000908 Tax Consultant
2 I.R. Akintoye & Co FRC/2014/ICAN/00000007015 Tax Consultant
3 Adegbonmire And Associates FRC/2013/00000000001226 Property & Valuation Experts
4 Akujuru Associates FRC/2014/00000004631 Property & Valuation Experts
5 Alagbe & Partners FRC/2013/NIESV/00000004334 Property & Valuation Experts
6 Arigbede & Co FRC/2014/00000004634 Property & Valuation Experts
7 Austin Chinegwu & Co FRC/2015/NIESV/00000012501 Property & Valuation Experts
8 Bamigbola Consulting FRC/2013/NIESV/00000000897 Property & Valuation Experts
9 Bayo Adeyemo & Associates FRC/2013/NIESV/00000005193 Property & Valuation Experts
10 Bayo Oyedeji & Co FRC/2013/NIESV/00000003983 Property & Valuation Experts
11 Ben Eboreime & Co FRC/2013/NIESV/00000003232 Property & Valuation Experts
12 Biodun Olapade & Co FRC/2013/NIESV/00000004303 Property & Valuation Experts
13 Bola Olawuyi Consulting FRC/2014/NIESV/00000007657 Property & Valuation Experts
14 Chike Moneme & Partners FRC/2014/00000005796 Property & Valuation Experts
15 Chuma Ezealigo Associates FRC/2013/NIESV/00000004822 Property & Valuation Experts
16 Dipo Fakorede & Co FRC/2013/NIESV/00000000324 Property & Valuation Experts
17 Diya Fatimilehin & CoFRC/2013/NIESV/00000000754; FRC/2013/NIESV/00000002773 Property & Valuation Experts
18 Gab Okonkwo & Co FRC/2013/NIESV/00000002220 Property & Valuation Experts
19 Imo Ekanem & Co FRC/2012/NIESV/00000000114 Property & Valuation Experts
20 J Okaro And Associates FRC/2015/NIESV/00000002947 Property & Valuation Experts
21 Joe Nworah & Co FRC/2015/NIESV/00000010760 Property & Valuation Experts
22 John Zedomi & Associates FRC/2013/NIESV/00000002415 Property & Valuation Experts
23 Joseph Adegbile And Co FRC/2013/NIESV/00000004005 Property & Valuation Experts
24 Knight Frank FRC/2013/0000000000584 Property & Valuation Experts
25 Lansar Aghaji & Co FRC/2015/00000006074 Property & Valuation Experts
26 Lola Adeyemo & Co FRC/2015/NIESV/00000010805 Property & Valuation Experts
27 Mgbeoduru Sam & Co FRC/2013/NIESV/00000003326 Property & Valuation Experts
28 Nwokoma Nwankwo & Company FRC/2012/0000000000200 Property & Valuation Experts
29 O.S. Boroni Associates FRC/2013/NIESV/00000003393 Property & Valuation Experts
FCMB Group Plc Annual Report and Accounts 2017 215
Introduction Operating Review
Corporate Governance
Financial Statements
Shareholder Information
Other National Disclosures
Branches and Account Opening Information
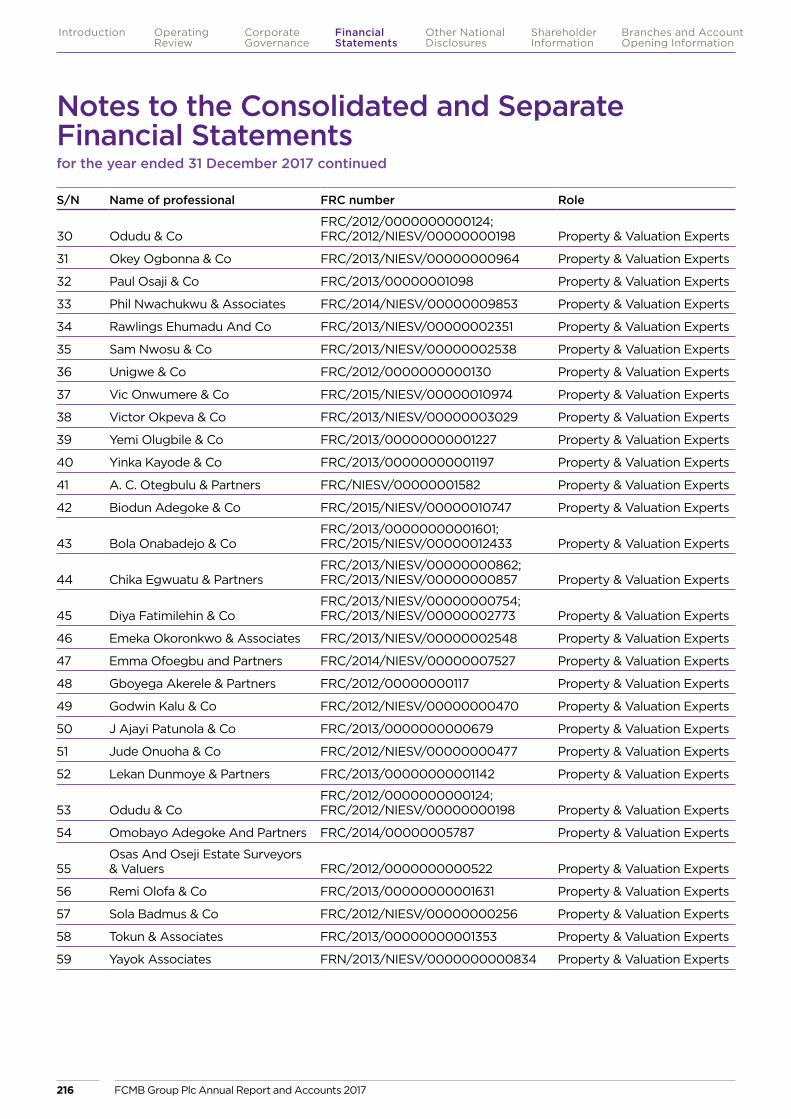
S/N Name of professional FRC number Role
30 Odudu & CoFRC/2012/0000000000124; FRC/2012/NIESV/00000000198 Property & Valuation Experts
31 Okey Ogbonna & Co FRC/2013/NIESV/00000000964 Property & Valuation Experts
32 Paul Osaji & Co FRC/2013/00000001098 Property & Valuation Experts
33 Phil Nwachukwu & Associates FRC/2014/NIESV/00000009853 Property & Valuation Experts
34 Rawlings Ehumadu And Co FRC/2013/NIESV/00000002351 Property & Valuation Experts
35 Sam Nwosu & Co FRC/2013/NIESV/00000002538 Property & Valuation Experts
36 Unigwe & Co FRC/2012/0000000000130 Property & Valuation Experts
37 Vic Onwumere & Co FRC/2015/NIESV/00000010974 Property & Valuation Experts
38 Victor Okpeva & Co FRC/2013/NIESV/00000003029 Property & Valuation Experts
39 Yemi Olugbile & Co FRC/2013/00000000001227 Property & Valuation Experts
40 Yinka Kayode & Co FRC/2013/00000000001197 Property & Valuation Experts
41 A. C. Otegbulu & Partners FRC/NIESV/00000001582 Property & Valuation Experts
42 Biodun Adegoke & Co FRC/2015/NIESV/00000010747 Property & Valuation Experts
43 Bola Onabadejo & CoFRC/2013/00000000001601; FRC/2015/NIESV/00000012433 Property & Valuation Experts
44 Chika Egwuatu & PartnersFRC/2013/NIESV/00000000862; FRC/2013/NIESV/00000000857 Property & Valuation Experts
45 Diya Fatimilehin & CoFRC/2013/NIESV/00000000754; FRC/2013/NIESV/00000002773 Property & Valuation Experts
46 Emeka Okoronkwo & Associates FRC/2013/NIESV/00000002548 Property & Valuation Experts
47 Emma Ofoegbu and Partners FRC/2014/NIESV/00000007527 Property & Valuation Experts
48 Gboyega Akerele & Partners FRC/2012/00000000117 Property & Valuation Experts
49 Godwin Kalu & Co FRC/2012/NIESV/00000000470 Property & Valuation Experts
50 J Ajayi Patunola & Co FRC/2013/0000000000679 Property & Valuation Experts
51 Jude Onuoha & Co FRC/2012/NIESV/00000000477 Property & Valuation Experts
52 Lekan Dunmoye & Partners FRC/2013/00000000001142 Property & Valuation Experts
53 Odudu & CoFRC/2012/0000000000124; FRC/2012/NIESV/00000000198 Property & Valuation Experts
54 Omobayo Adegoke And Partners FRC/2014/00000005787 Property & Valuation Experts
55 Osas And Oseji Estate Surveyors & Valuers FRC/2012/0000000000522 Property & Valuation Experts
56 Remi Olofa & Co FRC/2013/00000000001631 Property & Valuation Experts
57 Sola Badmus & Co FRC/2012/NIESV/00000000256 Property & Valuation Experts
58 Tokun & Associates FRC/2013/00000000001353 Property & Valuation Experts
59 Yayok Associates FRN/2013/NIESV/0000000000834 Property & Valuation Experts
Notes to the Consolidated and Separate Financial Statementsfor the year ended 31 December 2017 continued
FCMB Group Plc Annual Report and Accounts 2017216
Introduction Operating Review
Corporate Governance
Financial Statements
Shareholder Information
Other National Disclosures
Branches and Account Opening Information
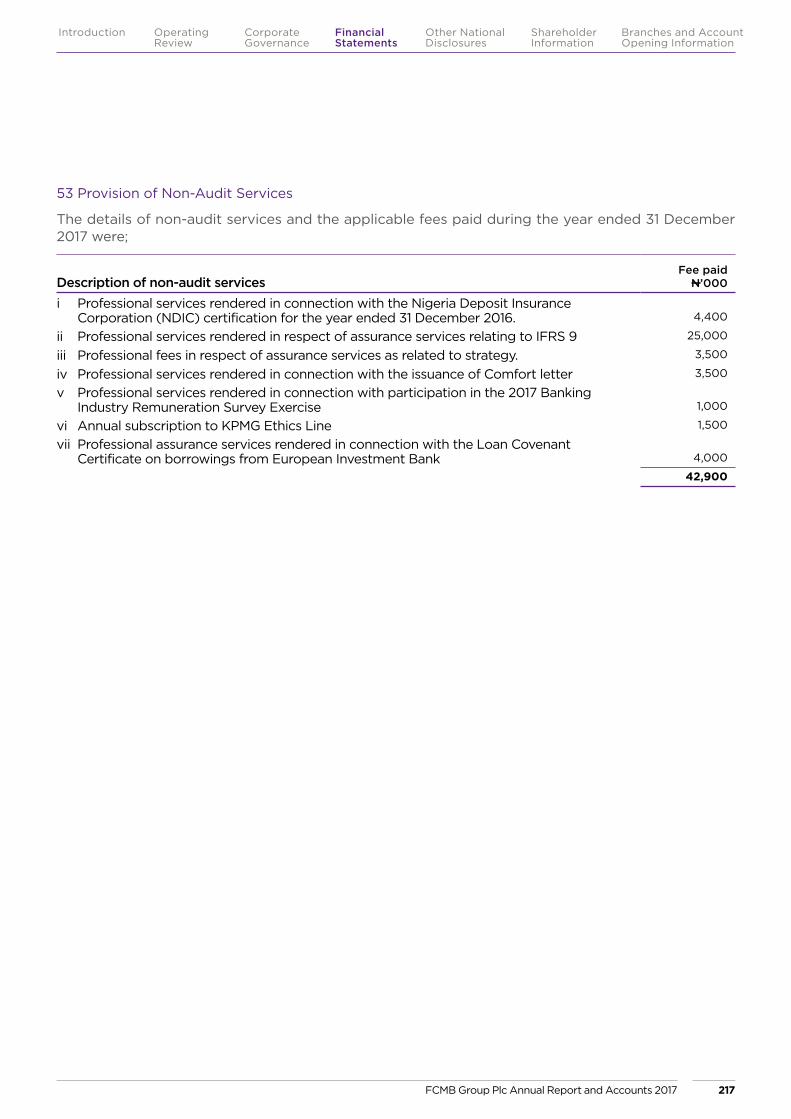
Description of non-audit servicesFee paid
N’000
i Professional services rendered in connection with the Nigeria Deposit Insurance Corporation (NDIC) certification for the year ended 31 December 2016. 4,400
ii Professional services rendered in respect of assurance services relating to IFRS 9 25,000
iii Professional fees in respect of assurance services as related to strategy. 3,500
iv Professional services rendered in connection with the issuance of Comfort letter 3,500
v Professional services rendered in connection with participation in the 2017 Banking Industry Remuneration Survey Exercise 1,000
vi Annual subscription to KPMG Ethics Line 1,500
vii Professional assurance services rendered in connection with the Loan Covenant Certificate on borrowings from European Investment Bank 4,000
42,900
53 Provision of Non-Audit Services
The details of non-audit services and the applicable fees paid during the year ended 31 December 2017 were;
FCMB Group Plc Annual Report and Accounts 2017 217
Introduction Operating Review
Corporate Governance
Financial Statements
Shareholder Information
Other National Disclosures
Branches and Account Opening Information
OtherNationalDisclosures
FCMB Group Plc Annual Report and Accounts 2017218
Introduction Operating Review
Corporate Governance
Financial Statements
Shareholder Information
Other National Disclosures
Branches and Account Opening Information
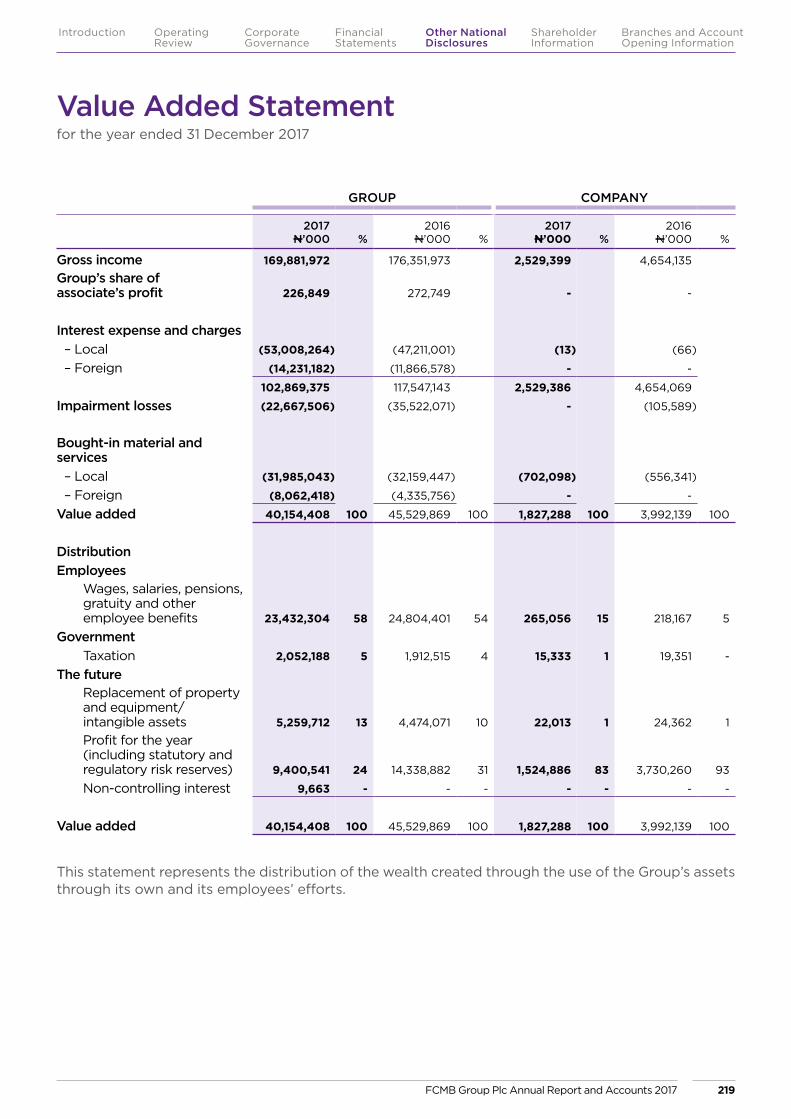
GROUP COMPANY
2017 N’000 %
2016 N’000 %
2017 N’000 %
2016 N’000 %
Gross income 169,881,972 176,351,973 2,529,399 4,654,135
Group’s share of associate’s profit 226,849 272,749 - -
Interest expense and charges– Local (53,008,264) (47,211,001) (13) (66)
– Foreign (14,231,182) (11,866,578) - -
102,869,375 117,547,143 2,529,386 4,654,069
Impairment losses (22,667,506) (35,522,071) - (105,589)
Bought-in material and services– Local (31,985,043) (32,159,447) (702,098) (556,341)
– Foreign (8,062,418) (4,335,756) - -
Value added 40,154,408 100 45,529,869 100 1,827,288 100 3,992,139 100
DistributionEmployees Wages, salaries, pensions,
gratuity and other employee benefits 23,432,304 58 24,804,401 54 265,056 15 218,167 5
Government Taxation 2,052,188 5 1,912,515 4 15,333 1 19,351 -
The future Replacement of property
and equipment/intangible assets 5,259,712 13 4,474,071 10 22,013 1 24,362 1
Profit for the year (including statutory and regulatory risk reserves) 9,400,541 24 14,338,882 31 1,524,886 83 3,730,260 93
Non-controlling interest 9,663 - - - - - - -
Value added 40,154,408 100 45,529,869 100 1,827,288 100 3,992,139 100
This statement represents the distribution of the wealth created through the use of the Group’s assets through its own and its employees’ efforts.
Value Added Statementfor the year ended 31 December 2017
FCMB Group Plc Annual Report and Accounts 2017 219
Introduction Operating Review
Corporate Governance
Financial Statements
Shareholder Information
Other National Disclosures
Branches and Account Opening Information
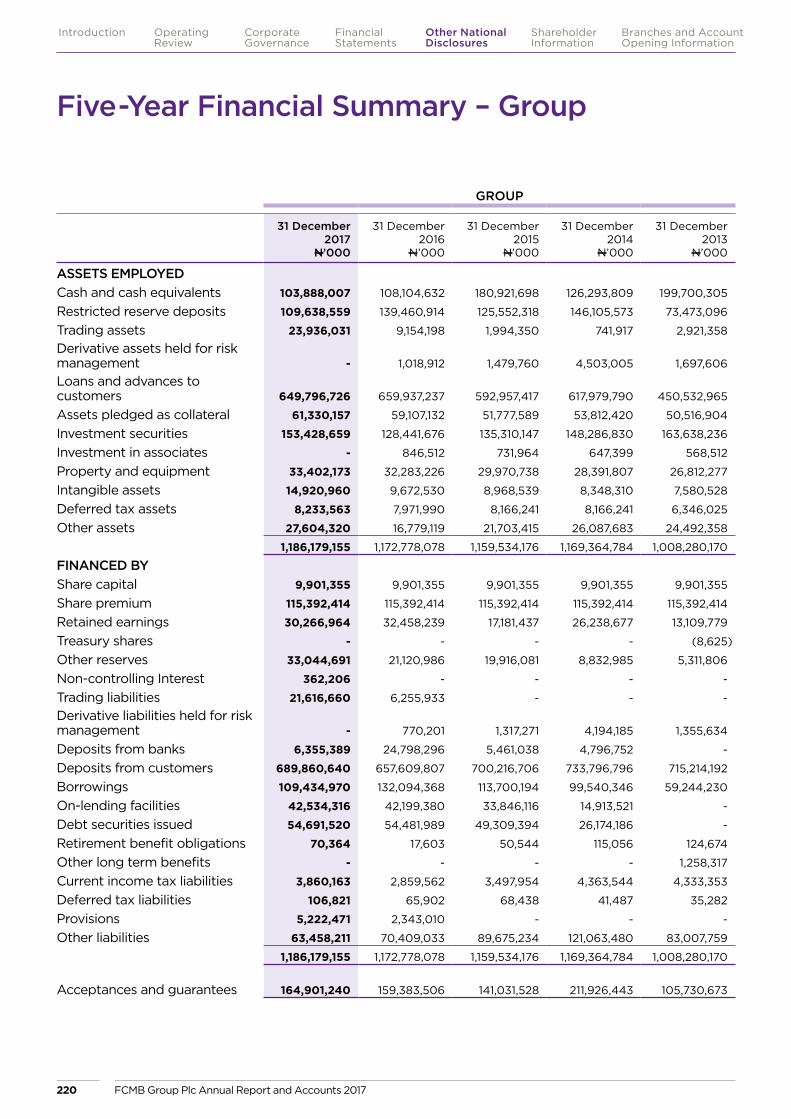
Five-Year Financial Summary – Group
GROUP
31 December 2017
N’000
31 December 2016
N’000
31 December 2015
N’000
31 December 2014
N’000
31 December 2013
N’000
ASSETS EMPLOYED Cash and cash equivalents 103,888,007 108,104,632 180,921,698 126,293,809 199,700,305
Restricted reserve deposits 109,638,559 139,460,914 125,552,318 146,105,573 73,473,096
Trading assets 23,936,031 9,154,198 1,994,350 741,917 2,921,358
Derivative assets held for risk management - 1,018,912 1,479,760 4,503,005 1,697,606
Loans and advances to customers 649,796,726 659,937,237 592,957,417 617,979,790 450,532,965
Assets pledged as collateral 61,330,157 59,107,132 51,777,589 53,812,420 50,516,904
Investment securities 153,428,659 128,441,676 135,310,147 148,286,830 163,638,236
Investment in associates - 846,512 731,964 647,399 568,512
Property and equipment 33,402,173 32,283,226 29,970,738 28,391,807 26,812,277
Intangible assets 14,920,960 9,672,530 8,968,539 8,348,310 7,580,528
Deferred tax assets 8,233,563 7,971,990 8,166,241 8,166,241 6,346,025
Other assets 27,604,320 16,779,119 21,703,415 26,087,683 24,492,358
1,186,179,155 1,172,778,078 1,159,534,176 1,169,364,784 1,008,280,170
FINANCED BY Share capital 9,901,355 9,901,355 9,901,355 9,901,355 9,901,355
Share premium 115,392,414 115,392,414 115,392,414 115,392,414 115,392,414
Retained earnings 30,266,964 32,458,239 17,181,437 26,238,677 13,109,779
Treasury shares - - - - (8,625)
Other reserves 33,044,691 21,120,986 19,916,081 8,832,985 5,311,806
Non-controlling Interest 362,206 - - - -
Trading liabilities 21,616,660 6,255,933 - - -
Derivative liabilities held for risk management - 770,201 1,317,271 4,194,185 1,355,634
Deposits from banks 6,355,389 24,798,296 5,461,038 4,796,752 -
Deposits from customers 689,860,640 657,609,807 700,216,706 733,796,796 715,214,192
Borrowings 109,434,970 132,094,368 113,700,194 99,540,346 59,244,230
On-lending facilities 42,534,316 42,199,380 33,846,116 14,913,521 -
Debt securities issued 54,691,520 54,481,989 49,309,394 26,174,186 -
Retirement benefit obligations 70,364 17,603 50,544 115,056 124,674
Other long term benefits - - - - 1,258,317
Current income tax liabilities 3,860,163 2,859,562 3,497,954 4,363,544 4,333,353
Deferred tax liabilities 106,821 65,902 68,438 41,487 35,282
Provisions 5,222,471 2,343,010 - - -
Other liabilities 63,458,211 70,409,033 89,675,234 121,063,480 83,007,759
1,186,179,155 1,172,778,078 1,159,534,176 1,169,364,784 1,008,280,170
Acceptances and guarantees 164,901,240 159,383,506 141,031,528 211,926,443 105,730,673
FCMB Group Plc Annual Report and Accounts 2017220
Introduction Operating Review
Corporate Governance
Financial Statements
Shareholder Information
Other National Disclosures
Branches and Account Opening Information

GROUP
31 December 2017
N’000
31 December 2016
N’000
31 December 2015
N’000
31 December 2014
N’000
31 December 2013
N’000
PROFIT AND LOSS ACCOUNTGross earnings 169,881,972 176,351,973 152,507,947 148,637,409 130,995,439
Profit before tax 11,462,392 16,251,397 7,768,664 23,874,783 18,116,143
Tax (2,052,188) (1,912,515) (3,007,998) (1,809,636) (2,183,244)
Profit after tax 9,410,204 14,338,882 4,760,666 22,065,147 15,932,899
Transfer to reserves 9,410,204 14,338,882 4,760,666 22,133,257 16,001,155
Earnings per share – basic and diluted (Naira) 0.48 0.72 0.24 1.12 0.81
FCMB Group Plc Annual Report and Accounts 2017 221
Introduction Operating Review
Corporate Governance
Financial Statements
Shareholder Information
Other National Disclosures
Branches and Account Opening Information
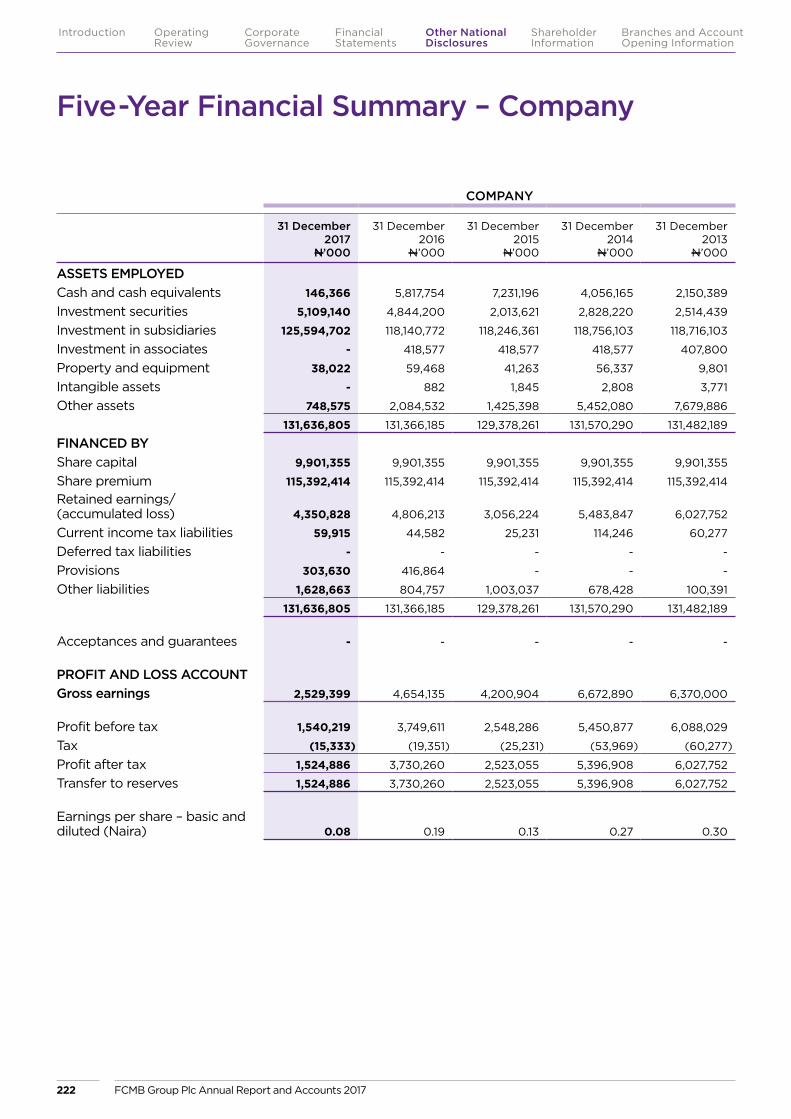
Five-Year Financial Summary – Company
COMPANY
31 December 2017
N’000
31 December 2016
N’000
31 December 2015
N’000
31 December 2014
N’000
31 December 2013
N’000
ASSETS EMPLOYED Cash and cash equivalents 146,366 5,817,754 7,231,196 4,056,165 2,150,389
Investment securities 5,109,140 4,844,200 2,013,621 2,828,220 2,514,439
Investment in subsidiaries 125,594,702 118,140,772 118,246,361 118,756,103 118,716,103
Investment in associates - 418,577 418,577 418,577 407,800
Property and equipment 38,022 59,468 41,263 56,337 9,801
Intangible assets - 882 1,845 2,808 3,771
Other assets 748,575 2,084,532 1,425,398 5,452,080 7,679,886
131,636,805 131,366,185 129,378,261 131,570,290 131,482,189
FINANCED BY Share capital 9,901,355 9,901,355 9,901,355 9,901,355 9,901,355
Share premium 115,392,414 115,392,414 115,392,414 115,392,414 115,392,414
Retained earnings/(accumulated loss) 4,350,828 4,806,213 3,056,224 5,483,847 6,027,752
Current income tax liabilities 59,915 44,582 25,231 114,246 60,277
Deferred tax liabilities - - - - -
Provisions 303,630 416,864 - - -
Other liabilities 1,628,663 804,757 1,003,037 678,428 100,391
131,636,805 131,366,185 129,378,261 131,570,290 131,482,189
Acceptances and guarantees - - - - -
PROFIT AND LOSS ACCOUNTGross earnings 2,529,399 4,654,135 4,200,904 6,672,890 6,370,000
Profit before tax 1,540,219 3,749,611 2,548,286 5,450,877 6,088,029
Tax (15,333) (19,351) (25,231) (53,969) (60,277)
Profit after tax 1,524,886 3,730,260 2,523,055 5,396,908 6,027,752
Transfer to reserves 1,524,886 3,730,260 2,523,055 5,396,908 6,027,752
Earnings per share – basic and diluted (Naira) 0.08 0.19 0.13 0.27 0.30
FCMB Group Plc Annual Report and Accounts 2017222
Introduction Operating Review
Corporate Governance
Financial Statements
Shareholder Information
Other National Disclosures
Branches and Account Opening Information

ShareholderInformation
FCMB Group Plc Annual Report and Accounts 2017 223
Introduction Operating Review
Corporate Governance
Financial Statements
Shareholder Information
Other National Disclosures
Branches and Account Opening Information
Notice is hereby given that the 5th Annual General Meeting of FCMB Group Plc (FCMB) will be held at the Shell Hall, MUSON Centre, Onikan, Lagos on Friday 27 April 2018 at 11.00 am to transact the following:
Ordinary Business
1. To receive and consider the Report of the Directors and the Audited Financial Statements for the year ended 31 December 2017, the Auditor’s Report thereon and the Audit Committee Report.
2. To declare a dividend.
3. To approve the appointment of Directors.
4. To re-elect Directors that are retiring.
5. To approve the remuneration of Directors.
6. To authorise the Directors to fix the remuneration of the Auditors.
7. To elect members of the Audit Committee.
Dated this 5th day of April 2018
By Order of the Board
Mrs Funmi Adedibu Company Secretary FRC/2014/NBA/00000005887
Notice of Annual General Meeting
NOTES:
Proxies
Only a member (shareholder) of the Company entitled to attend and vote at the Annual General Meeting is allowed to appoint a proxy in his/her stead. All valid instruments of proxy should be completed, stamped and deposited at the office of the Company’s Registrars: CardinalStone Registrars Limited, 358 Herbert Macaulay Way, Yaba, Lagos, not later than 48 hours before the time fixed for the meeting.
Closure of Register
The Register of Members will be closed from 13 April 2018 to 19 April 2018 (both days inclusive).
Dividend
If the dividend recommended by the Directors is approved by members at the Annual General Meeting, the dividend warrants will be posted on 30 April 2018 to members so entitled whose names appear in the register of members at the close of business on 12 April 2018.
Statutory Audit Committee
In accordance with Section 359 (5) of the Companies and Allied Matters Act Cap C20, Laws of the Federation of Nigeria 2004, any shareholder may nominate a shareholder for appointment to the Audit Committee. Such nomination should be in writing and reach the Company Secretary not less than 21 days before the Annual General Meeting.
Rights of Securities Holders to Ask Questions
Securities holders have a right to ask questions not only at the meeting, but also in writing prior to the meeting. Any such questions must be submitted to the Company on or before 20 April 2018.
FCMB Group Plc Annual Report and Accounts 2017224
Introduction Operating Review
Corporate Governance
Financial Statements
Shareholder Information
Other National Disclosures
Branches and Account Opening Information
# FCMB Group Plc Annual Report and Accounts 2017 225
Introduction Operating Review
Corporate Governance
Financial Statements
Shareholder Information
Other National Disclosures
Branches and Account Opening Information
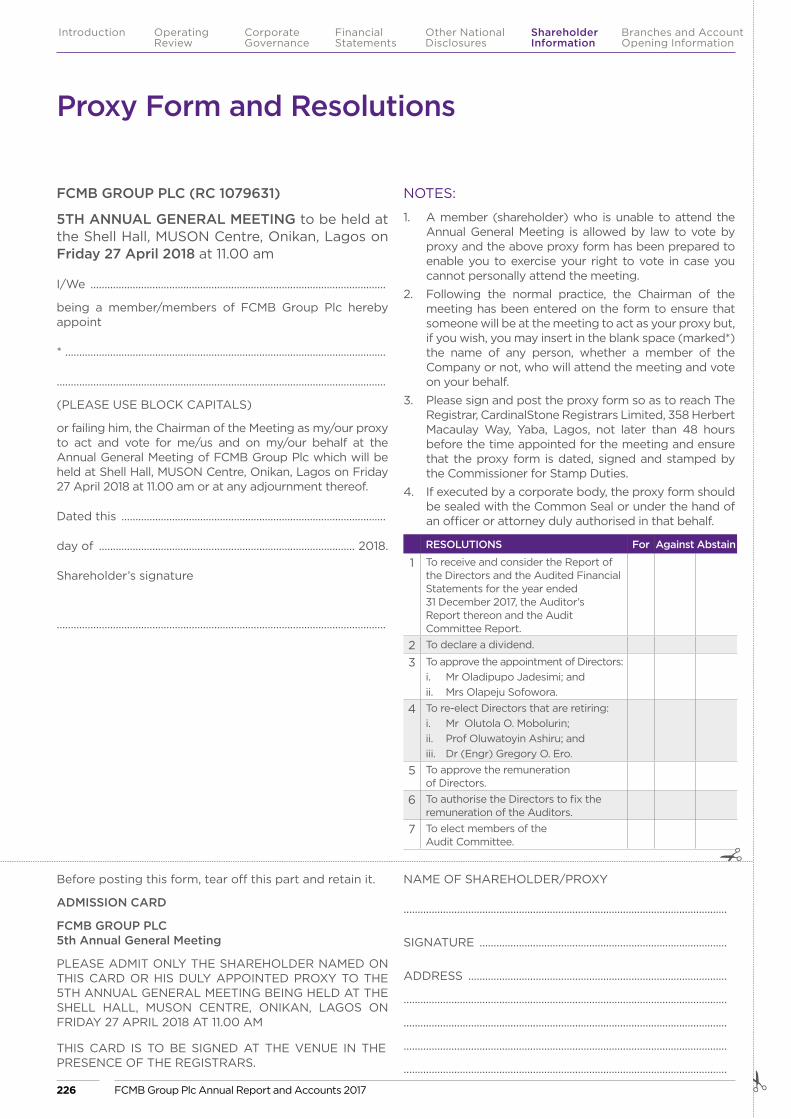
Proxy Form and Resolutions
FCMB GROUP PLC (RC 1079631)
5TH ANNUAL GENERAL MEETING to be held at the Shell Hall, MUSON Centre, Onikan, Lagos on Friday 27 April 2018 at 11.00 am
I/We .........................................................................................................
being a member/members of FCMB Group Plc hereby appoint
* ..................................................................................................................
.....................................................................................................................
(PLEASE USE BLOCK CAPITALS)
or failing him, the Chairman of the Meeting as my/our proxy to act and vote for me/us and on my/our behalf at the Annual General Meeting of FCMB Group Plc which will be held at Shell Hall, MUSON Centre, Onikan, Lagos on Friday 27 April 2018 at 11.00 am or at any adjournment thereof.
Dated this ..............................................................................................
day of ........................................................................................... 2018.
Shareholder’s signature
.....................................................................................................................
NOTES:
1. A member (shareholder) who is unable to attend the Annual General Meeting is allowed by law to vote by proxy and the above proxy form has been prepared to enable you to exercise your right to vote in case you cannot personally attend the meeting.
2. Following the normal practice, the Chairman of the meeting has been entered on the form to ensure that someone will be at the meeting to act as your proxy but, if you wish, you may insert in the blank space (marked*) the name of any person, whether a member of the Company or not, who will attend the meeting and vote on your behalf.
3. Please sign and post the proxy form so as to reach The Registrar, CardinalStone Registrars Limited, 358 Herbert Macaulay Way, Yaba, Lagos, not later than 48 hours before the time appointed for the meeting and ensure that the proxy form is dated, signed and stamped by the Commissioner for Stamp Duties.
4. If executed by a corporate body, the proxy form should be sealed with the Common Seal or under the hand of an officer or attorney duly authorised in that behalf.
RESOLUTIONS For Against Abstain
1 To receive and consider the Report of the Directors and the Audited Financial Statements for the year ended 31 December 2017, the Auditor’s Report thereon and the Audit Committee Report.
2 To declare a dividend.
3 To approve the appointment of Directors:i. Mr Oladipupo Jadesimi; andii. Mrs Olapeju Sofowora.
4 To re-elect Directors that are retiring:i. Mr Olutola O. Mobolurin;ii. Prof Oluwatoyin Ashiru; andiii. Dr (Engr) Gregory O. Ero.
5 To approve the remuneration of Directors.
6 To authorise the Directors to fix the remuneration of the Auditors.
7 To elect members of the Audit Committee. #
Before posting this form, tear off this part and retain it.
ADMISSION CARD
FCMB GROUP PLC 5th Annual General Meeting
PLEASE ADMIT ONLY THE SHAREHOLDER NAMED ON THIS CARD OR HIS DULY APPOINTED PROXY TO THE 5TH ANNUAL GENERAL MEETING BEING HELD AT THE SHELL HALL, MUSON CENTRE, ONIKAN, LAGOS ON FRIDAY 27 APRIL 2018 AT 11.00 AM
NAME OF SHAREHOLDER/PROXY
...................................................................................................................
SIGNATURE ........................................................................................
ADDRESS ............................................................................................
...................................................................................................................
...................................................................................................................
...................................................................................................................
...................................................................................................................
THIS CARD IS TO BE SIGNED AT THE VENUE IN THE PRESENCE OF THE REGISTRARS.
#FCMB Group Plc Annual Report and Accounts 2017226
Introduction Operating Review
Corporate Governance
Financial Statements
Shareholder Information
Other National Disclosures
Branches and Account Opening Information

# FCMB Group Plc Annual Report and Accounts 2017 227
Introduction Operating Review
Corporate Governance
Financial Statements
Shareholder Information
Other National Disclosures
Branches and Account Opening Information
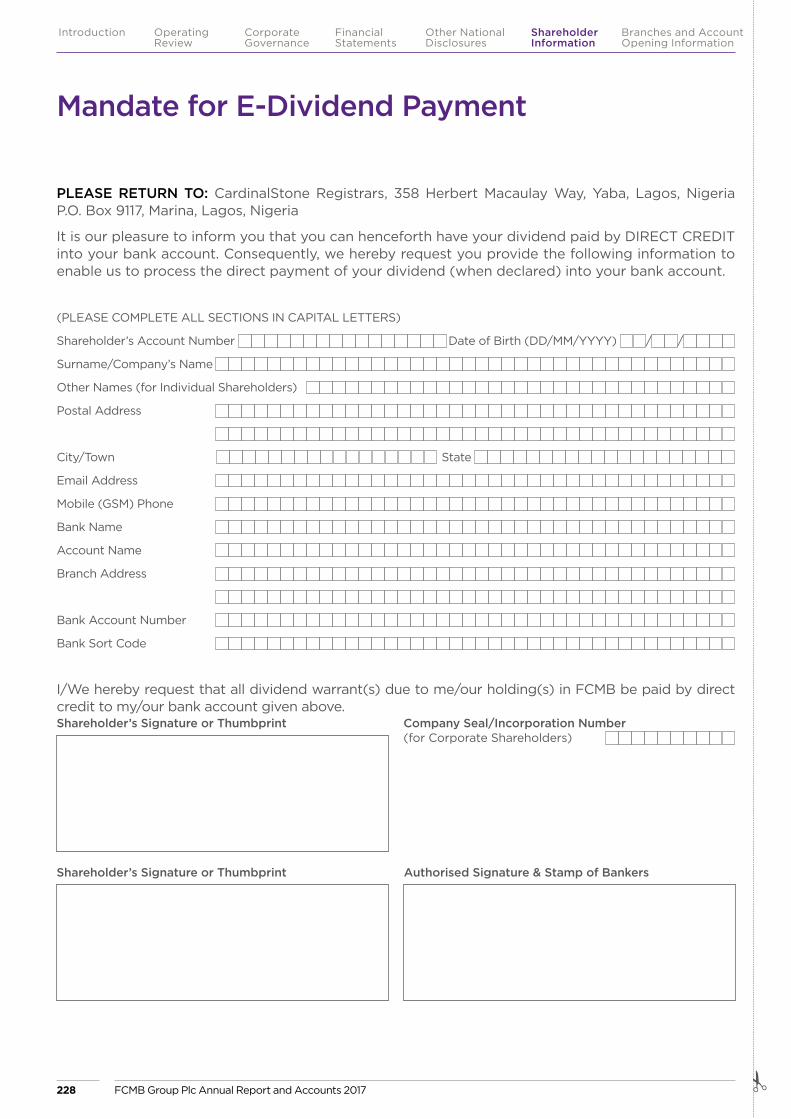
Mandate for E-Dividend Payment
PLEASE RETURN TO: CardinalStone Registrars, 358 Herbert Macaulay Way, Yaba, Lagos, Nigeria P.O. Box 9117, Marina, Lagos, Nigeria
It is our pleasure to inform you that you can henceforth have your dividend paid by DIRECT CREDIT into your bank account. Consequently, we hereby request you provide the following information to enable us to process the direct payment of your dividend (when declared) into your bank account.
(PLEASE COMPLETE ALL SECTIONS IN CAPITAL LETTERS)
Shareholder’s Account Number Date of Birth (DD/MM/YYYY) / /
Surname/Company’s Name
Other Names (for Individual Shareholders)
Postal Address
City/Town State
Email Address
Mobile (GSM) Phone
Bank Name
Account Name
Branch Address
Bank Account Number
Bank Sort Code
I/We hereby request that all dividend warrant(s) due to me/our holding(s) in FCMB be paid by direct credit to my/our bank account given above.Shareholder’s Signature or Thumbprint Company Seal/Incorporation Number
(for Corporate Shareholders)
Shareholder’s Signature or Thumbprint Authorised Signature & Stamp of Bankers
#FCMB Group Plc Annual Report and Accounts 2017228
Introduction Operating Review
Corporate Governance
Financial Statements
Shareholder Information
Other National Disclosures
Branches and Account Opening Information

# FCMB Group Plc Annual Report and Accounts 2017 229
Introduction Operating Review
Corporate Governance
Financial Statements
Shareholder Information
Other National Disclosures
Branches and Account Opening Information
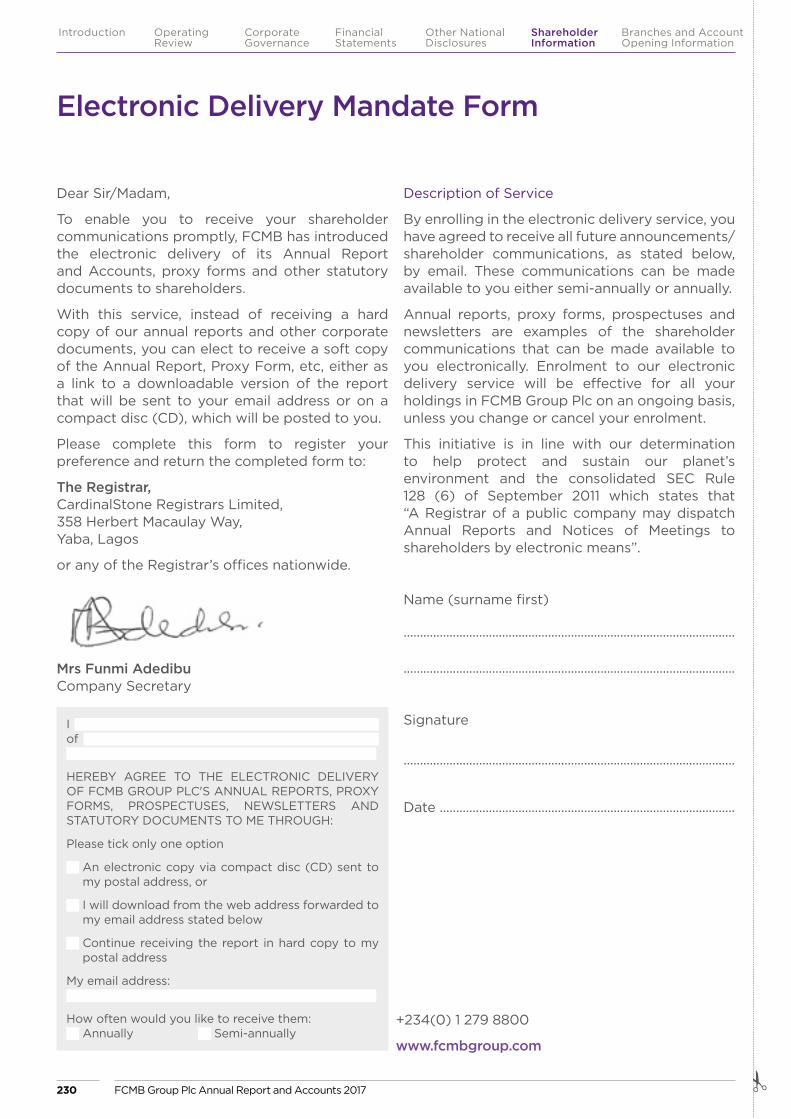
Electronic Delivery Mandate Form
Dear Sir/Madam,
To enable you to receive your shareholder communications promptly, FCMB has introduced the electronic delivery of its Annual Report and Accounts, proxy forms and other statutory documents to shareholders.
With this service, instead of receiving a hard copy of our annual reports and other corporate documents, you can elect to receive a soft copy of the Annual Report, Proxy Form, etc, either as a link to a downloadable version of the report that will be sent to your email address or on a compact disc (CD), which will be posted to you.
Please complete this form to register your preference and return the completed form to:
The Registrar, CardinalStone Registrars Limited, 358 Herbert Macaulay Way, Yaba, Lagos
or any of the Registrar’s offices nationwide.
Mrs Funmi Adedibu Company Secretary
Description of Service
By enrolling in the electronic delivery service, you have agreed to receive all future announcements/shareholder communications, as stated below, by email. These communications can be made available to you either semi-annually or annually.
Annual reports, proxy forms, prospectuses and newsletters are examples of the shareholder communications that can be made available to you electronically. Enrolment to our electronic delivery service will be effective for all your holdings in FCMB Group Plc on an ongoing basis, unless you change or cancel your enrolment.
This initiative is in line with our determination to help protect and sustain our planet’s environment and the consolidated SEC Rule 128 (6) of September 2011 which states that “A Registrar of a public company may dispatch Annual Reports and Notices of Meetings to shareholders by electronic means”.
Name (surname first)
.....................................................................................................
.....................................................................................................
Signature
.....................................................................................................
Date ..........................................................................................
I of
HEREBY AGREE TO THE ELECTRONIC DELIVERY OF FCMB GROUP PLC'S ANNUAL REPORTS, PROXY FORMS, PROSPECTUSES, NEWSLETTERS AND STATUTORY DOCUMENTS TO ME THROUGH:
Please tick only one option
An electronic copy via compact disc (CD) sent to my postal address, or
I will download from the web address forwarded to my email address stated below
Continue receiving the report in hard copy to my postal address
My email address:
How often would you like to receive them: Annually Semi-annually
+234(0) 1 279 8800
www.fcmbgroup.com
#FCMB Group Plc Annual Report and Accounts 2017230
Introduction Operating Review
Corporate Governance
Financial Statements
Shareholder Information
Other National Disclosures
Branches and Account Opening Information
Branches &Account OpeningInformation
FCMB Group Plc Annual Report and Accounts 2017 231
Introduction Operating Review
Corporate Governance
Financial Statements
Shareholder Information
Other National Disclosures
Branches and Account Opening Information
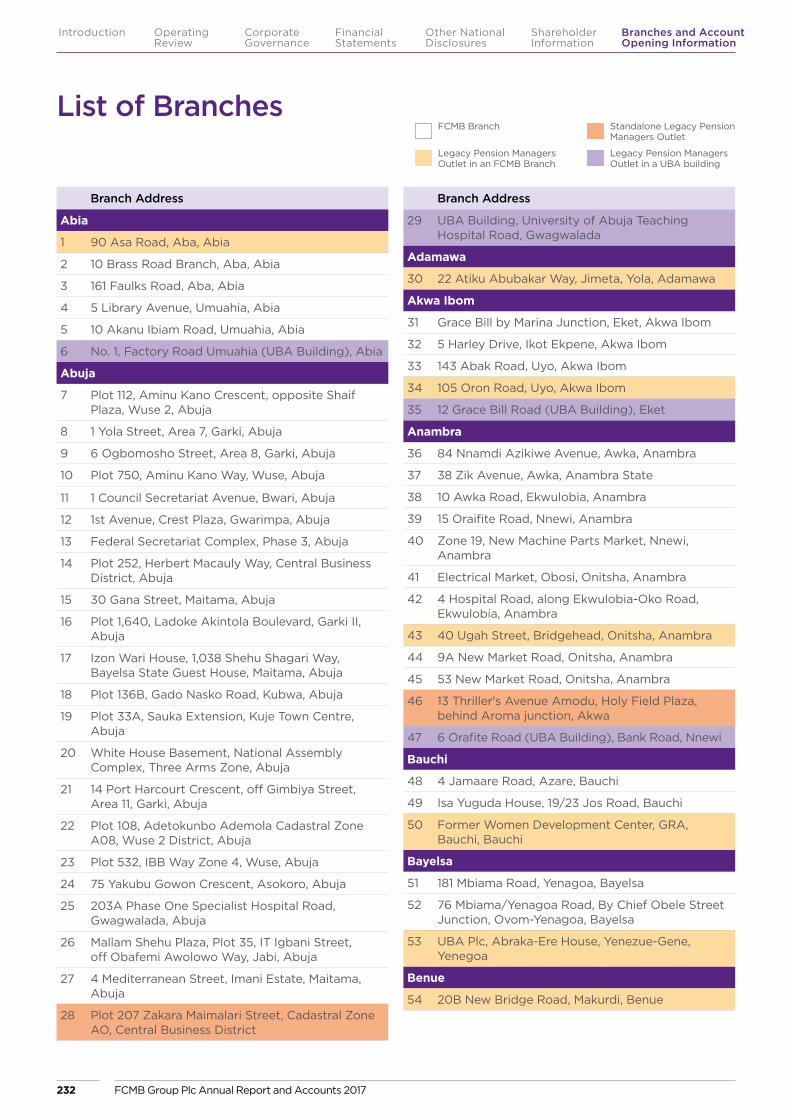
Branch Address
Abia
1 90 Asa Road, Aba, Abia
2 10 Brass Road Branch, Aba, Abia
3 161 Faulks Road, Aba, Abia
4 5 Library Avenue, Umuahia, Abia
5 10 Akanu Ibiam Road, Umuahia, Abia
6 No. 1, Factory Road Umuahia (UBA Building), Abia
Abuja
7 Plot 112, Aminu Kano Crescent, opposite Shaif Plaza, Wuse 2, Abuja
8 1 Yola Street, Area 7, Garki, Abuja
9 6 Ogbomosho Street, Area 8, Garki, Abuja
10 Plot 750, Aminu Kano Way, Wuse, Abuja
11 1 Council Secretariat Avenue, Bwari, Abuja
12 1st Avenue, Crest Plaza, Gwarimpa, Abuja
13 Federal Secretariat Complex, Phase 3, Abuja
14 Plot 252, Herbert Macauly Way, Central Business District, Abuja
15 30 Gana Street, Maitama, Abuja
16 Plot 1,640, Ladoke Akintola Boulevard, Garki II, Abuja
17 Izon Wari House, 1,038 Shehu Shagari Way, Bayelsa State Guest House, Maitama, Abuja
18 Plot 136B, Gado Nasko Road, Kubwa, Abuja
19 Plot 33A, Sauka Extension, Kuje Town Centre, Abuja
20 White House Basement, National Assembly Complex, Three Arms Zone, Abuja
21 14 Port Harcourt Crescent, off Gimbiya Street, Area 11, Garki, Abuja
22 Plot 108, Adetokunbo Ademola Cadastral Zone A08, Wuse 2 District, Abuja
23 Plot 532, IBB Way Zone 4, Wuse, Abuja
24 75 Yakubu Gowon Crescent, Asokoro, Abuja
25 203A Phase One Specialist Hospital Road, Gwagwalada, Abuja
26 Mallam Shehu Plaza, Plot 35, IT Igbani Street, off Obafemi Awolowo Way, Jabi, Abuja
27 4 Mediterranean Street, Imani Estate, Maitama, Abuja
28 Plot 207 Zakara Maimalari Street, Cadastral Zone AO, Central Business District
List of Branches
Branch Address
29 UBA Building, University of Abuja Teaching Hospital Road, Gwagwalada
Adamawa
30 22 Atiku Abubakar Way, Jimeta, Yola, Adamawa
Akwa Ibom
31 Grace Bill by Marina Junction, Eket, Akwa Ibom
32 5 Harley Drive, Ikot Ekpene, Akwa Ibom
33 143 Abak Road, Uyo, Akwa Ibom
34 105 Oron Road, Uyo, Akwa Ibom
35 12 Grace Bill Road (UBA Building), Eket
Anambra
36 84 Nnamdi Azikiwe Avenue, Awka, Anambra
37 38 Zik Avenue, Awka, Anambra State
38 10 Awka Road, Ekwulobia, Anambra
39 15 Oraifite Road, Nnewi, Anambra
40 Zone 19, New Machine Parts Market, Nnewi, Anambra
41 Electrical Market, Obosi, Onitsha, Anambra
42 4 Hospital Road, along Ekwulobia-Oko Road, Ekwulobia, Anambra
43 40 Ugah Street, Bridgehead, Onitsha, Anambra
44 9A New Market Road, Onitsha, Anambra
45 53 New Market Road, Onitsha, Anambra
46 13 Thriller's Avenue Amodu, Holy Field Plaza, behind Aroma junction, Akwa
47 6 Orafite Road (UBA Building), Bank Road, Nnewi
Bauchi
48 4 Jamaare Road, Azare, Bauchi
49 Isa Yuguda House, 19/23 Jos Road, Bauchi
50 Former Women Development Center, GRA, Bauchi, Bauchi
Bayelsa
51 181 Mbiama Road, Yenagoa, Bayelsa
52 76 Mbiama/Yenagoa Road, By Chief Obele Street Junction, Ovom-Yenagoa, Bayelsa
53 UBA Plc, Abraka-Ere House, Yenezue-Gene, Yenegoa
Benue
54 20B New Bridge Road, Makurdi, Benue
FCMB Group Plc Annual Report and Accounts 2017232
Introduction Operating Review
Corporate Governance
Financial Statements
Shareholder Information
Other National Disclosures
Branches and Account Opening Information
FCMB Branch
Legacy Pension Managers Outlet in an FCMB Branch
Standalone Legacy Pension Managers Outlet
Legacy Pension Managers Outlet in a UBA building
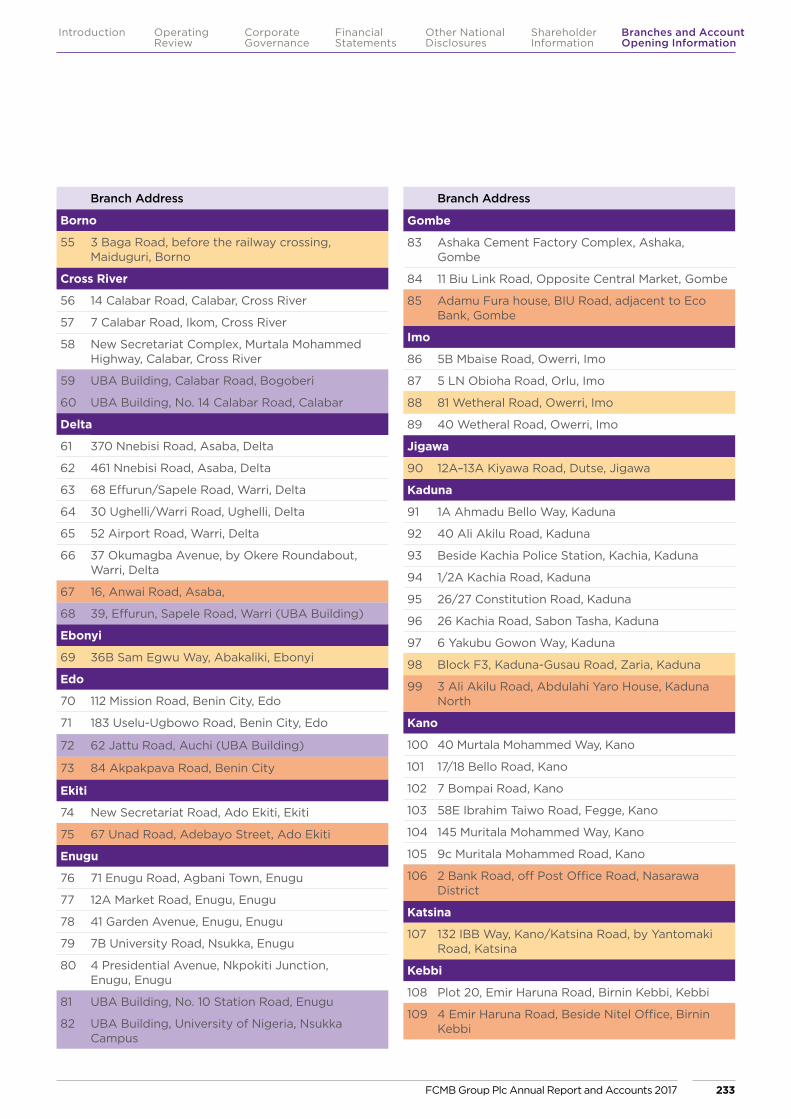
Branch Address
Borno
55 3 Baga Road, before the railway crossing, Maiduguri, Borno
Cross River
56 14 Calabar Road, Calabar, Cross River
57 7 Calabar Road, Ikom, Cross River
58 New Secretariat Complex, Murtala Mohammed Highway, Calabar, Cross River
59 UBA Building, Calabar Road, Bogoberi
60 UBA Building, No. 14 Calabar Road, Calabar
Delta
61 370 Nnebisi Road, Asaba, Delta
62 461 Nnebisi Road, Asaba, Delta
63 68 Effurun/Sapele Road, Warri, Delta
64 30 Ughelli/Warri Road, Ughelli, Delta
65 52 Airport Road, Warri, Delta
66 37 Okumagba Avenue, by Okere Roundabout, Warri, Delta
67 16, Anwai Road, Asaba,
68 39, Effurun, Sapele Road, Warri (UBA Building)
Ebonyi
69 36B Sam Egwu Way, Abakaliki, Ebonyi
Edo
70 112 Mission Road, Benin City, Edo
71 183 Uselu-Ugbowo Road, Benin City, Edo
72 62 Jattu Road, Auchi (UBA Building)
73 84 Akpakpava Road, Benin City
Ekiti
74 New Secretariat Road, Ado Ekiti, Ekiti
75 67 Unad Road, Adebayo Street, Ado Ekiti
Enugu
76 71 Enugu Road, Agbani Town, Enugu
77 12A Market Road, Enugu, Enugu
78 41 Garden Avenue, Enugu, Enugu
79 7B University Road, Nsukka, Enugu
80 4 Presidential Avenue, Nkpokiti Junction, Enugu, Enugu
81 UBA Building, No. 10 Station Road, Enugu
82 UBA Building, University of Nigeria, Nsukka Campus
Branch Address
Gombe
83 Ashaka Cement Factory Complex, Ashaka, Gombe
84 11 Biu Link Road, Opposite Central Market, Gombe
85 Adamu Fura house, BIU Road, adjacent to Eco Bank, Gombe
Imo
86 5B Mbaise Road, Owerri, Imo
87 5 LN Obioha Road, Orlu, Imo
88 81 Wetheral Road, Owerri, Imo
89 40 Wetheral Road, Owerri, Imo
Jigawa
90 12A–13A Kiyawa Road, Dutse, Jigawa
Kaduna
91 1A Ahmadu Bello Way, Kaduna
92 40 Ali Akilu Road, Kaduna
93 Beside Kachia Police Station, Kachia, Kaduna
94 1/2A Kachia Road, Kaduna
95 26/27 Constitution Road, Kaduna
96 26 Kachia Road, Sabon Tasha, Kaduna
97 6 Yakubu Gowon Way, Kaduna
98 Block F3, Kaduna-Gusau Road, Zaria, Kaduna
99 3 Ali Akilu Road, Abdulahi Yaro House, Kaduna North
Kano
100 40 Murtala Mohammed Way, Kano
101 17/18 Bello Road, Kano
102 7 Bompai Road, Kano
103 58E Ibrahim Taiwo Road, Fegge, Kano
104 145 Muritala Mohammed Way, Kano
105 9c Muritala Mohammed Road, Kano
106 2 Bank Road, off Post Office Road, Nasarawa District
Katsina
107 132 IBB Way, Kano/Katsina Road, by Yantomaki Road, Katsina
Kebbi
108 Plot 20, Emir Haruna Road, Birnin Kebbi, Kebbi
109 4 Emir Haruna Road, Beside Nitel Office, Birnin Kebbi
FCMB Group Plc Annual Report and Accounts 2017 233
Introduction Operating Review
Corporate Governance
Financial Statements
Shareholder Information
Other National Disclosures
Branches and Account Opening Information

Branch Address
Kogi
110 Along Idah-Ajaokuta Road, opposite General Post Office, Anyigba, Kogi
111 16 Aliyu Obaje Road, Okene/Kabba Road, opposite Stella Obasanjo Library, Lokoja, Kogi
112 Suit 5 Grand Quest Plaza, Lokoja
Kwara
113 120 Abdulazeez Atta Road, Surulere, Ilorin, Kwara
114 79B Ibrahim Taiwo Road, Ilorin, Kwara
115 33 Murtala Mohammed Way, Ilorin, Kwara
Lagos
116 33 Adeniran Ogunsanya Street, Surulere, Lagos
117 38 Adeola Hopewell Street, Victoria Island, Lagos
118 11B Adeola Odeku Street, Victoria Island, Lagos
119 Plot 719A, Adetokunbo Ademola Street, Victoria Island, Lagos
120 Old Abeokuta Express Road, Oko-Oba, Agege, Lagos
121 23/25 Murtala Mohammed International Airport Road, Ikeja, Lagos
122 KM 23, Berger Bus Stop, Lekki-Epe Expressway, Ajah, Lagos
123 Primateck Plaza, Shasha Roundabout, Akowonjo, Lagos
124 Obosi Plaza, A-line, Alaba International Market, Alaba, Lagos
125 S Line, Old Garage, Alaba Electrical Section, Alaba International Market, Alaba, Lagos
126 36 Allen Avenue, Ikeja, Lagos
127 Plot 123, Amuwo Odofin Road, Festac Link Bridge, Amuwo-Odofin, Lagos
128 28 Creek Road, Apapa, Lagos
129 16 Warehouse Road, Apapa, Lagos
130 Olusegun Obasanjo Hall, Aspamda, Trade Fair Complex, Badagry Expressway, Lagos
131 68 Awolowo Road, Ikoyi, Lagos
132 Banuso House, 88/89 Broad Street, Lagos
133 1 Davies Street, UNTL Building off Marina Street, Lagos Island, Lagos
134 Plot 1,572, 4th Avenue, Festac Town, Lagos
135 42 Diya Street, Ifako Gbagada, Lagos
136 Primrose Tower, 17A Tinubu Street, Lagos
Branch Address
137 Leventis Building, 2–4 Iddo Road, Iddo, Lagos
138 218 Egbeda-Idimu Road, Idimu, Lagos
139 Daddy Doherty House, 34 Idumagbo Avenue, Lagos
140 22 Idoluwo Street, Idumota, Lagos
141 48 Isaac John Street, Ikeja G.R.A., Lagos
142 MMA Zulu Terminal, Domestic Airport, Ikeja, Lagos
143 7 Lagos Road, Ikorodu, Lagos
144 25B Ilupeju Bypass, off Coker Junction, Ilupeju, Lagos
145 Shop 529–531, Iponri Shopping Complex, Iponri, Surulere, Lagos
146 2 Joseph Street, off Marina Street, Lagos Island, Lagos
147 545/547 Ketu, Ikorodu Road, Lagos
148 13 Alfred Rewane Road, Ikoyi, Lagos
149 122/124 Ladipo Street, beside AP Filling Station, Ladipo, Mushin, Lagos
150 Plot B, Block E12E, Admiralty Way, Lekki, Lagos
151 Km 18, Lekki-Epe Expressway, before Chevron Roundabout, Lekki, Lagos
152 63/64 Igbokushu Village, opposite Jakande Estate, Lekki, Lagos
153 12 Macarthy Street, Onikan, Lagos
154 44 Marina Street, Lagos Island, Lagos
155 91 Ladipo Street, Matori, Lagos
156 18/20 Mobolaji Bank Anthony Way, Ikeja, Lagos
157 M1 Point Motorways Complex, Ikeja, Lagos
158 253 Agege Motor Road, Mushin, Lagos
159 29 Oba Akran Avenue, Ikeja, Lagos
160 23 Ogba Ijaiye Road, opposite WAEC Office, Ogba, Lagos
161 Plot 111 Ogudu GRA, Ojota Road, Ogudu, Lagos
162 148A Olojo Drive, Ojo, Lagos
163 11 Ijaiye Street, Oke Arin, Lagos
164 117 Okota Road, Okota, Isolo, Lagos
165 178 Ikorodu Road, Onipanu, Lagos
166 The Hive Mall, Plot 16, T.F. Kuboye Road, off New Market Road, Oniru
167 80 Kudirat Abiola Way, Oregun, Ikeja, Lagos
List of Branches Continued
FCMB Branch
Legacy Pension Managers Outlet in an FCMB Branch
Standalone Legacy Pension Managers Outlet
Legacy Pension Managers Outlet in a UBA building
FCMB Group Plc Annual Report and Accounts 2017234
Introduction Operating Review
Corporate Governance
Financial Statements
Shareholder Information
Other National Disclosures
Branches and Account Opening Information

Branch Address
168 Block 11, Suite 3–8, Agric, Market, Odun Ade Bus Stop, Orile Coker, Lagos
169 12 Oroyinyin Street, Idumota, Lagos Island, Lagos
170 33 Osolo Way, Ajao Estate, Lagos
171 Slok House, 10 Randle Road, Apapa, Lagos
172 Founders Place, 2 Sanusi Fafunwa Street, Victoria Island, Lagos
173 Above Plaza, BBA Trade Fair Complex, Lagos
174 Eleganza Plaza, 1 Wharf Road, Apapa, Lagos
175 43 Ojuelegba Road, Surulere, Lagos
176 757 Lagos-Abeokuta Expressway, Salolo Alagbole, Lagos
177 9 Wharf Road, Apapa (UBA Building)
178 24 Oba-Akran Avenue, Ikeja (UBA Building)
179 90 Awolowo Road, Ikoyi
Nasarawa
180 43 Sani Abacha Way (Jos Road), Lafia, Nasarawa
181 75 Abdu Zanga Way, Tsohon Tasha, Keffi, Nasarawa
Niger
182 3 Paiko Road, opposite CBN, Minna, Niger
183 18 Suleiman Barau Road, Suleja, Niger
184 83 Broadcasting Road, Minna
Ogun
185 21 Lalubu Street, Oke-Ilewo Abeokuta, Ogun
186 1 Ilaro Street, Agbara Industrial Estate, Agbara, Ogun
187 Permanent Site, Olabisi Onabanjo University, Ago-Iwoye, Ogun
188 54 Ojodu-Akute Road, Alagbole Bus Stop, Akute, Ogun
189 168 Folagbade Street, Ijebu-Ode, Ogun
190 52 Ejirin Road, Impepe, Ijebu-Ode, Ogun
191 57 Idi-Iroko Road, Sango Ota, Ogun
192 Km 48, Lagos-Ibadan Expressway, Redeem Camp, Ogun
193 141 Akarigbo Street, Sagamu, Ogun
194 Idiroko Road, Otta (UBA Building)
Ondo
195 5 Bishop Fagun Road, Alagbaka, Akure, Ondo
196 1 Olukayode House, Oshinle, Akure, Ondo
Branch Address
197 Plot 1E, 5B GRA Igbokoda, Ilaje, Ondo
198 1 Brigadier Ademulekun Road, Ondo Town, Ondo
199 5 Bishop Fagbo,Ado-Owo, Alagbaka, Akure
Osun
200 F16 Ereguru Street, Ilesha, Osun
201 Km 3, Gbongan/Ibadan Road, Osogbo, Osun
202 B11 Treasure Plaza, Beside Wema Bank, Igbona Market, Osogbo
Oyo
203 57 Agbeni Market Road, Agbeni, Ibadan, Oyo
204 30 Oyo Road, opposite UI Post Office, Ibadan, Oyo
205 Plot 3, University of Ibadan/Secretariat Road, Bodija Extension, Bodija, Ibadan
206 10 Moshood Abiola Way, Challenge, Ibadan, Oyo
207 23/25 Lebanon Street, Dugbe, Ibadan, Oyo
208 55 Iwo Road, Ibadan, Oyo
209 1C Sabo Garage, Ojoo/Ibadan Express Road, Ojoo, Ibadan, Oyo
210 University College Hospital, opposite Total Filling Station, Ibadan, Oyo
Plateau
211 4 Beach Road, opposite Plateau State Board of Internal Revenue Office, Jos, Plateau
212 British American Tobacco Junction, Bukuru Bypass, Jos, Plateau
213 7 Murtala Mohammed Way, Jos, Plateau
214 47 Murtala Mohammed Way, opposite Jamb Office, Jos
Rivers
215 9 Port Harcourt-Aba Expressway, Port Harcourt, Rivers
216 46A Abuloma Road, Port Harcourt, Rivers
217 81 Aggrey Road, Port Harcourt, Rivers
218 7B Azikwe Road, Port Harcourt, Rivers
219 26 Zaakpon/Poly Road, Bori, Port Harcourt, Rivers
220 85 Aba Road, by Garrison Junction, Port Harcourt, Rivers
221 19 Ikwerre Road, Mile 1, Diobu, Port Harcourt, Rivers
222 457 Ikwerre Road, Port Harcourt, Rivers
FCMB Group Plc Annual Report and Accounts 2017 235
Introduction Operating Review
Corporate Governance
Financial Statements
Shareholder Information
Other National Disclosures
Branches and Account Opening Information
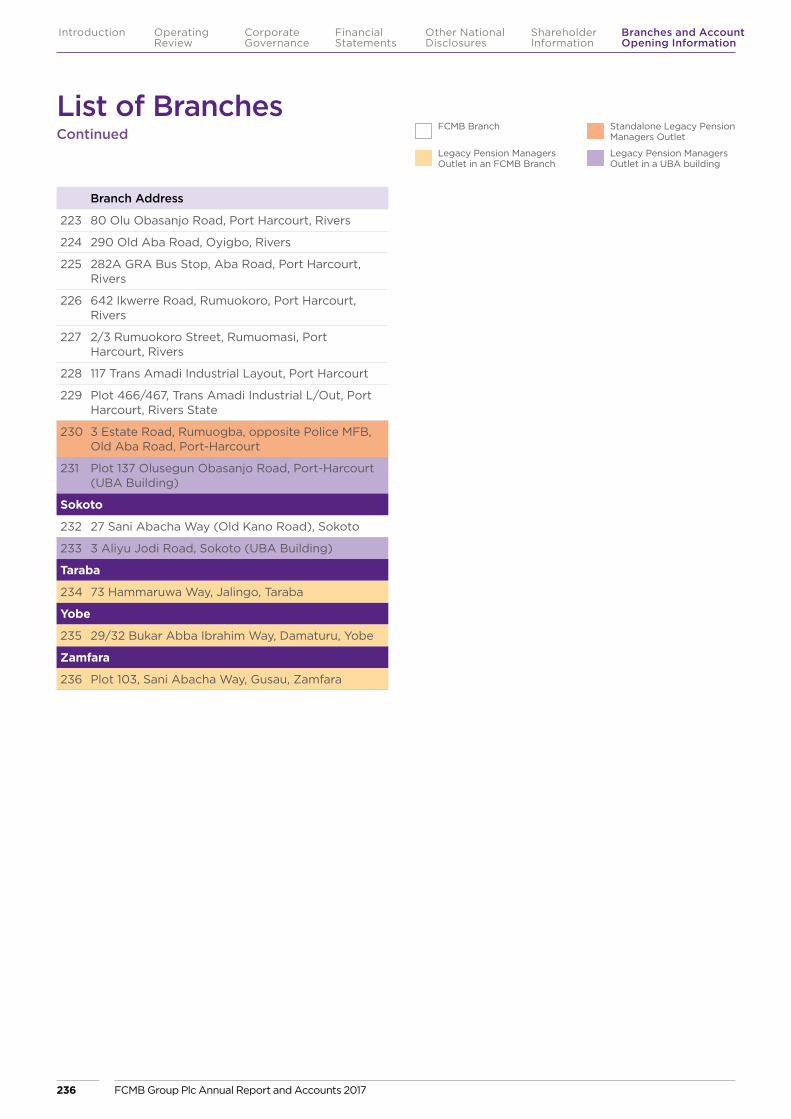
Branch Address
223 80 Olu Obasanjo Road, Port Harcourt, Rivers
224 290 Old Aba Road, Oyigbo, Rivers
225 282A GRA Bus Stop, Aba Road, Port Harcourt, Rivers
226 642 Ikwerre Road, Rumuokoro, Port Harcourt, Rivers
227 2/3 Rumuokoro Street, Rumuomasi, Port Harcourt, Rivers
228 117 Trans Amadi Industrial Layout, Port Harcourt
229 Plot 466/467, Trans Amadi Industrial L/Out, Port Harcourt, Rivers State
230 3 Estate Road, Rumuogba, opposite Police MFB, Old Aba Road, Port-Harcourt
231 Plot 137 Olusegun Obasanjo Road, Port-Harcourt (UBA Building)
Sokoto
232 27 Sani Abacha Way (Old Kano Road), Sokoto
233 3 Aliyu Jodi Road, Sokoto (UBA Building)
Taraba
234 73 Hammaruwa Way, Jalingo, Taraba
Yobe
235 29/32 Bukar Abba Ibrahim Way, Damaturu, Yobe
Zamfara
236 Plot 103, Sani Abacha Way, Gusau, Zamfara
List of Branches Continued
FCMB Branch
Legacy Pension Managers Outlet in an FCMB Branch
Standalone Legacy Pension Managers Outlet
Legacy Pension Managers Outlet in a UBA building
FCMB Group Plc Annual Report and Accounts 2017236
Introduction Operating Review
Corporate Governance
Financial Statements
Shareholder Information
Other National Disclosures
Branches and Account Opening Information
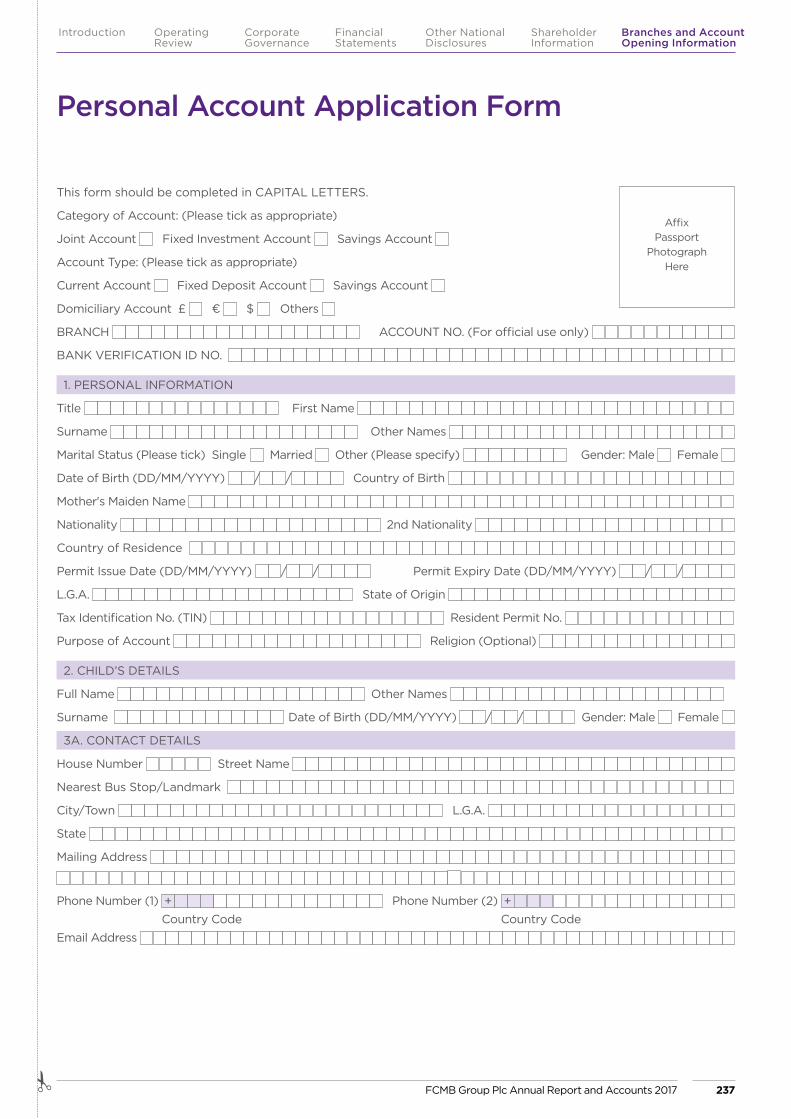
Personal Account Application Form
This form should be completed in CAPITAL LETTERS.
Category of Account: (Please tick as appropriate)
Joint Account Fixed Investment Account Savings Account
Account Type: (Please tick as appropriate)
Current Account Fixed Deposit Account Savings Account
Domiciliary Account £ € $ Others
BRANCH ACCOUNT NO. (For official use only)
BANK VERIFICATION ID NO.
1. PERSONAL INFORMATION
Title First Name
Surname Other Names
Marital Status (Please tick) Single Married Other (Please specify) Gender: Male Female
Date of Birth (DD/MM/YYYY) / / Country of Birth
Mother's Maiden Name
Nationality 2nd Nationality
Country of Residence
Permit Issue Date (DD/MM/YYYY) / / Permit Expiry Date (DD/MM/YYYY) / /
L.G.A. State of Origin
Tax Identification No. (TIN) Resident Permit No.
Purpose of Account Religion (Optional)
2. CHILD’S DETAILS
Full Name Other Names
Surname Date of Birth (DD/MM/YYYY) / / Gender: Male Female
3A. CONTACT DETAILS
House Number Street Name
Nearest Bus Stop/Landmark
City/Town L.G.A.
State
Mailing Address
Phone Number (1) + Phone Number (2) + Country Code Country CodeEmail Address
Affix Passport
Photograph Here
# FCMB Group Plc Annual Report and Accounts 2017 237
Introduction Operating Review
Corporate Governance
Financial Statements
Shareholder Information
Other National Disclosures
Branches and Account Opening Information

3B. FOREIGN ADDRESS (IF ANY)
House Number Street Name
City/Town Postcode
State Country
Type of Visa Phone Number + Country Code Country Code 4. VALID MEANS OF IDENTIFICATION
National ID Card National Driver's Licence International Passport INEC Voters Card
Others (Please specify)
ID No. ID Issue Date (DD/MM/YYYY) / /
ID Expiry Date (DD/MM/YYYY) / /
Country of Issuance
5. ACCOUNT SERVICE(S) REQUIRED (Please tick applicable option below)
Card Preferences: Verve Card MasterCard Visa Card Others (Please specify)
Electronic Banking Preferences: FCMBOnline FCMBMobile ATM POS
Other Electronic Channels (Fees may apply) (Specify)
Transaction Alert Preferences: Email Alert (Free) SMS Alert (Fee applies)
Statement Preferences: Email Collection at Branch
Statement Frequency: Monthly Quarterly Bi-Annually Annually
Cheque Book Requisition: (Fee applies) Open Cheque Crossed Cheque 25 Leaves 50 Leaves 100 Leaves
Cheque Confirmation: Would you like to pre-confirm your cheques? Yes No
Cheque Confirmation Threshold: If yes, please specify the threshold
6. EMPLOYMENT DETAILS
Employed Self-Employed Unemployed Retired Student Other (Please specify)
Date of Employment (If employed) (DD/MM/YYYY) / /
Annual Salary/Expected Annual Income: (a) Less than N50,000 (b) N51,000 – N250,000
(c) N251,000 – N500,000 (d) N501,000 – Less than N1 million (e) N1 million – Less than N5 million
(f) N5 million – Less than N10 million (g) N10 million – Less than N20 million (h) Above N20 million
Employer's Name
House Number Street Name
Nearest Bus Stop/Landmark
City/Town L.G.A.
State
Type of Business/Occupation
Office Phone No. 1 + Office Phone No. 2 + Country Code Country Code
Personal Account Application Form Continued
#FCMB Group Plc Annual Report and Accounts 2017238
Introduction Operating Review
Corporate Governance
Financial Statements
Shareholder Information
Other National Disclosures
Branches and Account Opening Information
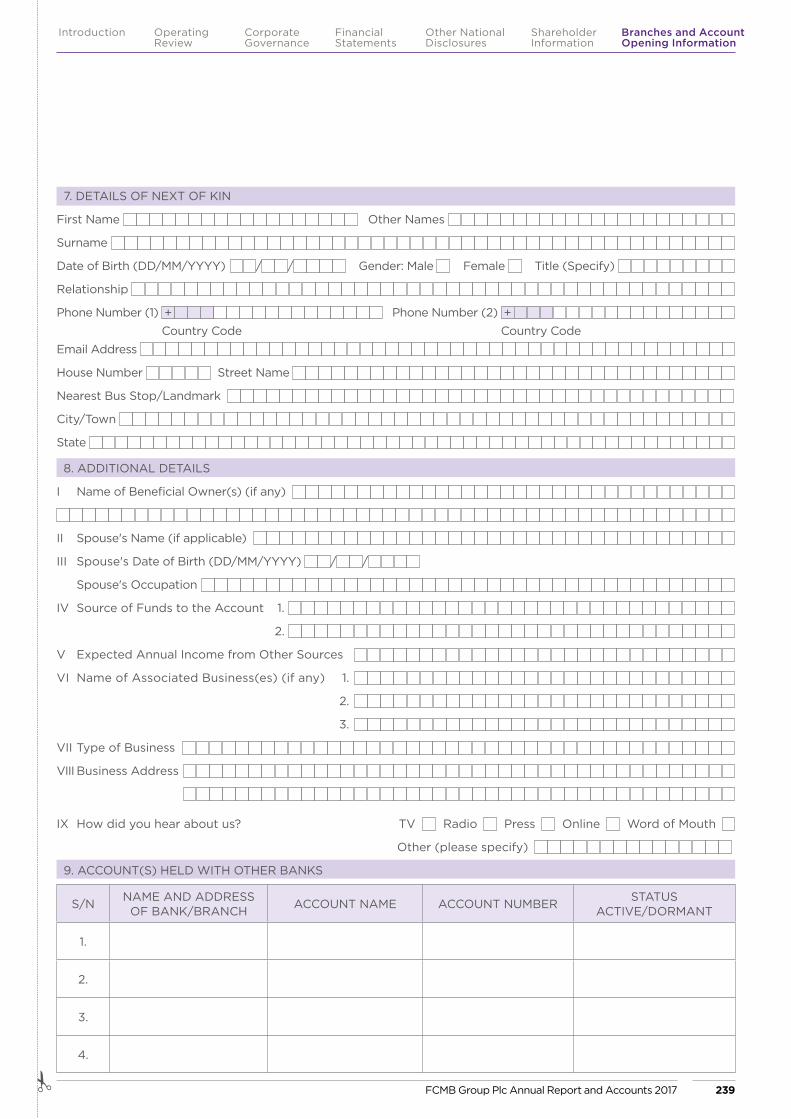
7. DETAILS OF NEXT OF KIN
First Name Other Names
Surname
Date of Birth (DD/MM/YYYY) / / Gender: Male Female Title (Specify)
Relationship
Phone Number (1) + Phone Number (2) + Country Code Country CodeEmail Address
House Number Street Name
Nearest Bus Stop/Landmark
City/Town
State
8. ADDITIONAL DETAILS
I Name of Beneficial Owner(s) (if any)
II Spouse's Name (if applicable)
III Spouse's Date of Birth (DD/MM/YYYY) / /
Spouse's Occupation
IV Source of Funds to the Account 1.
2.
V Expected Annual Income from Other Sources
VI Name of Associated Business(es) (if any) 1.
2.
3.
VII Type of Business
VIII Business Address
IX How did you hear about us? TV Radio Press Online Word of Mouth
Other (please specify)
9. ACCOUNT(S) HELD WITH OTHER BANKS
S/N NAME AND ADDRESS OF BANK/BRANCH ACCOUNT NAME ACCOUNT NUMBER STATUS
ACTIVE/DORMANT
1.
2.
3.
4.
# FCMB Group Plc Annual Report and Accounts 2017 239
Introduction Operating Review
Corporate Governance
Financial Statements
Shareholder Information
Other National Disclosures
Branches and Account Opening Information

Personal Account Application Form Continued
#
10. TERMS AND CONDITIONS
I/We hereby certify that the information given on this form is correct and that I/We have read, understood and agree with the Account opening terms and conditions governing the selected account(s)
11. DECLARATION:
I hereby apply for the opening of account(s) with First City Monument Bank Limited. I understand that the information given herein and the documents supplied are the basis for opening such account(s) and I therefore warrant that such information is correct.
I further undertake to indemnify the bank of any loss suffered as a result of any false information or error in the information provided to the Bank.
12. JURAT (this should be adopted where the applicant is not literate or is blind and the form is read to him/her by a third party)
I agree to abide by the content of the agreement and acknowledge that it has been truly and audibly read over and explained to me by an interpreter.
Date / /
Name of Interpreter
Address of Interpreter
Phone Number
Language of Interpretation
Principal Account Holder’s Signature
Joint Account Holder’s Signature
JOINT ACCOUNT HOLDER (PLEASE COMPLETE ALL SECTIONS IN CAPITAL LETTERS)
Name(s) ���������������������������������������
Contact Address ���������������������������������
�����������������������������������������������
Mobile ������������������ Date of Birth �����������
Email Address �����������������������������������
Gender: Male Female
1. Name ���������������������������������� Signature �����������������������Date �����������������
1. Name ���������������������������������� Signature �����������������������Date �����������������
Mandate/Special Instructions(Minimum Confirmation Amount/Signature Mandate)
Please Affix your Passport
Photograph Here
Joint Account Holder
Mark of Customer/Thumbprint
Magistrate/Commissioner for Oaths
FCMB Group Plc Annual Report and Accounts 2017240
Introduction Operating Review
Corporate Governance
Financial Statements
Shareholder Information
Other National Disclosures
Branches and Account Opening Information


FCMB Group PlcFirst City Plaza, 44 Marina, Lagos, Nigeria
Tel: +234 (0) 1 279 8800 www.fcmbgroupplc.com
Printed by: S & B City Printers Limited, Ayoola House,
244 Murtala Mohammed Way, Yaba, Lagos, Nigeria
Tel: +234 (0) 1 773 2480
Mobile: +234 (0) 802 941 8755
Enquiries: [email protected]
www.sandbcityprinters.com