fcp (mutual fund) under french law hsbc select flexible ... · annual report for the year ended...
TRANSCRIPT

FCP (mutual fund) under French law HSBC SELECT FLEXIBLE Annual report for the year ended 31 December 2018 UCITS DO NOT HAVE A GUARANTEED RETURN AND PREVIOUS PERFORMANCE DOES NOT GUARANTEE FUTURE RETURNS.
FCP HSBC SELECT FLEXIBLE
Annual report for the year ended 31/12/2018 2
Contents
Pages
Information regarding investments and management 3
Activity report 6
Regulatory information 17
Statutory auditor’s certification 19
Annual Financial Statements 23
Balance Sheet – Assets 24
Balance Sheet - Liabilities & Equity 25
Off-balance sheet commitments 26
Income statements 28
Appendices 29
Accounting rules and methods 30
Change in net assets 34
Additional information 35
Results for the last five fiscal years 45
Inventory 46
Information concerning investments and management (continued) 49
FCP HSBC SELECT FLEXIBLE
Annual report for the year ended 31/12/2018 3
Information concerning investments and management
Management company
HSBC Global Asset Management (France)
Depositary and Custodian
CACEIS Bank
Appointed accounting manager
CACEIS Fund Administration
Statutory Auditor
Ernst & Young Audit

Key Investor Information This document provides key information about this UCITS to investors. It is not a marketing document. The information that it contains is provided to you in accordance with a legal obligation in order to allow you to understand what an investment in this fund involves and what risks are associated with it. It is recommended that you read it in order to make an informed investment decision.
HSBC SELECT FLEXIBLE
A unit: ISIN code: FR0007036926
Management Company: HSBC Global Asset Management (France)
Objectives and investment policy
Description of the objectives and investment policy:
The objective of the mutual fund is to offer flexible management on equity and interest rate markets over a minimum investment period of 5 years. For information purposes, the equity market exposure is between 20% and 80% of assets, and interest rate market exposure is between 0% and 80% of assets. The Fund invests in developed markets with a euro bias as well as in emerging markets for the purpose of diversification.
The investment strategy is discretionary and is based on a portfolio management process organised around three pillars: a medium/long-term strategic asset allocation
depending on the manager’s level of conviction (asset classes, geographical areas, sectors),
a tactical allocation resulting from the short-term convictions of the manager, who will strive to take advantage of any market opportunities,
a selection of undertakings for collective investment (UCI) and managers likely, according to us, to generate performance over time.
Key features of the UCITS: Up to 100% of the mutual fund’s assets are invested in
units or shares of French or European UCI, managed primarily by the HSBC Group, with the following allocation limits: Equity UCI: between a minimum of 20% and 80% of
the mutual fund’s assets, invested in all sectors, all geographical areas, and all capitalisations.
Fixed-income product UCI: up to 80% of the mutual fund’s assets, without any predefined minimum, divided between government securities and corporate securities, European or international, rated investment grade or high yield (riskier securities due to their low rating) or deemed
The Management Company does not exclusively or mechanically use ratings provided by credit rating agencies and favours its own credit risk analysis to assess the credit quality of the assets and in the selection of securities to purchase or sell.
The mutual fund may also invest up to 20% of its assets in diversified and/or flexible UCI as part of “absolute return” strategies.
The mutual fund may also use French or European index-based UCI or trackers (French or European UCITS funds or AIFs).
Up to 75% of the mutual fund’s assets may bear a currency risk.
The mutual fund may borrow cash up to 10% for cash flow imbalance reasons.
The mutual fund may invest in financial contracts, on regulated, organised, or OTC markets (swaps, futures, options, or exchange forwards) for the purposes of hedging of and/or exposure to equity risk, interest rate risk, and/or currency risk.
The distributable amounts of the A unit are fully accumulated.
Recommended minimum investment period: 5 years. Subscription and redemption requests are accepted at
any time until 12:00 p.m. and executed daily on the basis of the next net asset value (i.e. at an unknown price). Settlements relating to subscription requests are carried out on the second business day following the date of establishment of the net asset value. Settlements relating to redemption requests are carried out on the third business day following the date of establishment of the net asset value.
Risk and return profile
Lower risk, Higher risk,
Potentially lower return Potentially higher return
1 2 3 4 5 6 7
Historical data, such as data used to calculate the composite indicator, may not be a reliable indication of the future risk profile of the UCITS.
The category of risk associated with this UCITS is not guaranteed and may change over time.
The lowest category does not mean that the product is “risk-free”.
The Fund is classified in category 4. This classification corresponds to a variable combination of exposure to equity and bond markets.
The following risks, not taken into account in the indicator, may also have an impact on the net asset value of the UCITS:
- Credit risk: risk that the financial situation of the issuer of a bond or a debt instrument will deteriorate, the extreme risk being the risk of default of the issuer.
- Risk associated with financial contracts: the use of financial futures may lead to replicating, increasing, or reducing an exposure to markets, indices, assets, etc. The Fund’s net asset value may thus, in some cases, change in a way different from that of the underlying markets to which the Fund is exposed.

Fees “Fees and commissions charged are used to cover the operating costs of the UCITS, including the costs of marketing and distributing units. These fees reduce the potential growth of investments.”
One-off fees deducted before or after investment
Entry fees 2.00%
Exit fees None
The indicated percentage is the maximum that may be deducted from your capital before it is invested. Investors may obtain the actual amount of entry and exit fees from their adviser or distributor.
Fees deducted by the UCITS over a year
Ongoing fees 1.48%
Fees deducted by the UCITS under certain circumstances
Performance commission None
Ongoing fees are based on the preceding accounting period, which closed in December 2017, and may vary from one period to the next.
For more information on fees, please refer to the “fees” section of the prospectus of this UCITS available at: http://www.assetmanagement.hsbc.com/fr
Ongoing fees do not include performance commissions and intermediation fees except in case of entry and/or exit fees paid by the UCITS when it buys or sells units of another collective management vehicle.
Past performance
calculated in euros. Performance figures are calculated with net
coupons reinvested for fees except any entry and exit fees.
The UCITS was created on 7 January 2009. The A unit was created on 7 January 2009. Starting on 25 September 2014, the benchmark
was eliminated.
The arrow above corresponds to the period during which the benchmark was different. Prior performance was achieved under circumstances that are no longer present.
Helpful information Depositary: CACEIS Bank The UCITS’s information documents (prospectus/annual report/half-yearly document) are available in French free of charge
upon request sent to HSBC Global Asset Management’s client services by email: [email protected]
The net asset value can be obtained from the Management Company. Taxation: Accumulation unit The information documents of the other unit classes (prospectus/annual report/half-yearly document) are available in
French free of charge upon request sent to the Management Company’s client services by email: [email protected].:
HSBC Select Flexible - A unit (ISIN code: FR0011883347) HSBC Select Flexible - R unit (ISIN code: FR0013269875) HSBC Select Flexible - B unit (ISIN code: FR0013313996) HSBC Select Flexible - IT unit (ISIN code: FR0013234911)
The tax laws in the UCITS’s country of residence could have an impact on investors. HSBC Global Asset Management (France) can only be held responsible on the basis of statements contained in this
document that are misleading, inaccurate, or inconsistent with the corresponding sections of the UCITS prospectus. This fund is not open to residents of the United States of America/”US Persons” (the definition can be found in the
prospectus). Details of the management company’s updated remuneration policy are available on its website at
www.assetmanagement.hsbc.com/fr or, at no cost, by requesting a copy in writing from the Management Company. These details contain the method used to calculate the remuneration and benefits granted to certain employees, the bodies responsible for allocating remuneration, and the composition of the remuneration committee.
This UCITS is approved in France and regulated by the French financial markets authority (AMF). HSBC Global Asset Management (France) is approved in France and regulated by the AMF. The key investor information provided here is accurate and up to date as of 17 April 2018.
Select Flexible – A unit
FCP HSBC SELECT FLEXIBLE
Annual report for the year ended 31/12/2018 6
Activity report
Macroeconomic overview
The fourth quarter of 2018 was marked by multiple sources of concern due to trade and budgetary tensions but also the continuation of monetary normalisation. After the growth cycles in China, Europe, and Japan slowed down, doubts focused on the dynamics of the US economy. On the US fiscal front, the mid-term elections gave the Democrats a majority in the House of Representatives, reducing the likelihood of a major fiscal agreement to support activity (particularly through infrastructure). The impetus of tax reform that allowed GDP to accelerate to 3% in 2018 faded in 2019. On the monetary front, the US Federal Reserve (Fed) noted a less favourable environment, while raising its key interest rates in December as expected (+25bps to 2.25%-2.50%). Its median forecasts predict that GDP will slow down to 2.3% in 2019, then 2% in 2020 and 1.8% in 2021, against the backdrop of tighter financial conditions (2 key interest rate hikes expected in 2019, then 1 increase in 2020). Inflationary pressures (year-on-year inflation of 2.2% in November) are likely to intensify in a context of full employment (record-low unemployment rate of 3.7%) and wage increases (+3.2% year on year in November, above the average of 2.8% since 2000). On the trade front, the prospect of a bilateral agreement with China remained very uncertain, even though a negotiation stage was open until 1 March 2019. Political uncertainties in Europe weighed on confidence and activity indices: tariff risks in the European automotive sector still have not been ruled out, and Brexit negotiations have become more complicated, reducing the visibility of the future of relations between the United Kingdom and the European Union. In addition, unexpected events proved to be detrimental this quarter: in Germany, the introduction of emissions tests in the automotive sector created bottlenecks upstream of production and sales, while the yellow vests demonstrations in France against a new carbon tax severely disrupted activity. Lastly, the Italian economy worsened in the wake of tighter financial conditions caused by tense budget negotiations with Brussels. At the last minute, the government adjusted its deficit path (2.04% of GDP versus 2.4% initially), thus avoiding being placed in an excessive deficit procedure. In total, eurozone GDP growth estimates declined significantly to 1.9% in 2018 and 1.6% in 2019 (after 2.5% in 2017). With regard to emerging economies, financial conditions remained tight after a summer of capital outflows due to political uncertainties (Turkey, Mexico, Brazil, South Africa). The plunge in oil prices in the fourth quarter provided some relief for importing countries (Turkey, India, and China) while adversely affecting producers (Russia and Mexico). Lastly, in China, tighter regulation to reduce private debt weighed on shadow credit activity, resulting in sharp declines in equity markets and negative wealth effects that dampened domestic demand. However, the series of emergency measures (tax incentives, targeted credit easing) could successfully control the slowdown in GDP growth, still estimated at 6.3% in 2019, after 6.6% in 2018 and 6.9% in 2017.
There were no major economic or monetary shocks in the third quarter of 2018, at least in developed countries. Even so, political and trade issues were probably the main source of uncertainty for economic players over the summer. For example, most global industrial activity indicators tended to fall back in this climate of tensions created by the US administration, particularly towards China.
FCP HSBC SELECT FLEXIBLE
Annual report for the year ended 31/12/2018 7
Emerging countries saw a sharp decline in their activity indices with Europe in the wake. Countries highly exposed to the dynamics of world trade, such as Sweden and Korea, were the most affected by a significant slowdown in their exports. The rise of populism also reared its ugly head with economic players, with an Italian government that visibly decided to test the tolerance of bond markets and the European Commission by proposing an expansionary 2019 budget, reducing the retirement age and increasing social benefits. Not surprisingly, Italy seemed to suffer from this climate, with the most deteriorated activity indicators in the eurozone and financial conditions that could tighten for businesses. At the same time, many emerging economies are suffering from tighter global liquidity and fears of populist tendencies. That was the case in Turkey and South Africa, where their currencies fell against the dollar or the euro, indicating a loss of investor confidence in the institutions of these countries, which is expected to lead to inflationary recessions. Paradoxically, the health of the US economy continued to be dynamic. On the employment front, net job creation is still as dynamic, the unemployment rate remains below 4%, and wages are rising, but without presenting any alarming underlying pressures for now. Business profitability remains strong, and productive investment continues to be dynamic. Public investment also appears to be picking up again and supporting the construction sector. Lastly, the national savings rate, revised by the national accountants, recovered significantly over the last two years, notably through the sharp improvement in the profitability and financial situation of small businesses and the self-employed. At this stage, the US economy remains the strongest driver of global growth.
Spring 2018 began on a slightly less solid economic tone, especially in the eurozone. Activity indicators worsened significantly, particularly in German industry, due to less favourable expectations on the part of industrialists, probably in connection with protectionist rhetoric by the US administration. At this point, most analysts tended to favour an air gap in the hope that these expectations would not materialise in the order books still considered to be very strong. US economic figures showed greater resilience. The unemployment rate set new record lows below 3.8% during the quarter. Domestic demand remained on a growth trend, probably close to 3% at the end of the second quarter, driven by continued dynamic domestic consumption and investment. Business confidence indicators, especially among leaders of and medium-sized enterprises (SMEs), remained consistently high at the end of the quarter. While inflation and wages still seem contained, there is some evidence that wage pressures continued to rise in the spring, particularly in certain segments of the labour market (skilled technicians, construction or industrial sectors, engineers working in hi-tech, etc.). Against this backdrop, the US Federal Reserve confirmed its desire to continue its plan to raise interest rates. As a result, emerging countries, dependent on financing in dollars of their external debt, appear to be beginning to suffer from this monetary tightening, with some countries, such as Turkey or Argentina, with the most vulnerable fundamentals likely to be very close to relying on international monetary institutions to meet their current financing needs. Even China received support from its central bank, stepping up interventions in June to reduce interbank tensions and likely contributing to aggressive currency depreciation. As such, while the United States remained the driving force for the world, the Asia and Europe regions seemed to begin to experience a slight downturn in activity at the beginning of the summer, probably confirming that the cyclical peak of global growth was reached at the beginning of 2018.
The beginning of 2018 did not mark any major macroeconomic shifts. Most cyclical indicators continued to suggest synchronised global growth, with the United States and Europe, and to a lesser extent the emerging world, as the predominant drivers of global activity.
FCP HSBC SELECT FLEXIBLE
Annual report for the year ended 31/12/2018 8
In the US, job creation was strong and positive and accompanied the drop in the unemployment rate to 4.0%. The level of private sector employment exceeded its peak in 2007. The US economy is in full employment for skilled workers, and tensions are emerging in structurally scarce sectors (technology, professional services, construction, engineering, etc.). In this context, the announcement of a corporate tax reduction plan was cautiously welcomed by experts, fearing that such a tax stimulus would be more inflationary than generating real growth. In the first quarter, wage increases remained moderate across the Atlantic, and underlying inflation remained under control. Against this backdrop, the Federal Reserve, now headed by a new chairman, Jerome Powell, seems to be holding steady at three to four short rate hikes in 2018. In the European manufacturing sector, especially in Germany, the strain is more intense. Capacity utilisation rates in industry are well above their long-term average now, and strikes demanding wage increases of more than 6% are beginning to appear in German industry or in European services. In the first quarter of 2018, while the real effective exchange rate of the euro appreciated significantly, effectively the equivalent of monetary tightening (equivalent to a short rate hike of 100 basis points), the ECB did not seem prepare to take as proactive a step as the US Federal Reserve (Fed) towards normalising its monetary policy.
Financial overview
2018 was marked by a plunge in financial assets, with the exception of sovereign debt markets in Japan and in the eurozone (Germany, Spain, Portugal, France). This turbulence served as a reminder of the narrow path to monetary normalisation in an overall difficult environment in terms of fiscal policy. Continued normalisation of the Fed’s balance sheet (with four key interest rate hikes of 25bps in 2018 and reductions in securities reinvestment) led to tighter liquidity conditions with implied equity volatility (VIX) rising to 2011 levels. The rise in interest rates led by the United States hampered the search for yield that had characterised financial markets since 2015. Ten-year US government bond yields surged to 3.23% in November (the highest since 2011), driven by real yields and a rebound in term premiums, resulting in a reduced appetite for risky assets. During December, a temporary reversal of the US yield curve triggered strong fluctuations in equity markets, particularly in the United States, followed by a downward reversal of the yield on 10-year US government bonds (to 2.68% at the end of December, i.e. +28bps over one year). At the end of December, cheap purchases allowed the US stock exchange to lose less (MSCI US -4.5% year-on-year) compared with declines in equity indices (MSCI TR local currencies) in Japan (-15% year on year), the eurozone (-12% year on year) and the United Kingdom (-9% year on year). On the emerging markets side (MSCI TR local currency indices), Asian stock exchanges (Asia Ex-Japan) underperformed (-15% year on year) those of other regions, mainly due to Chinese equities (-19% year on year). In the credit markets in the US and Europe, corporate bond spreads increased, both in the investment grade (IG)1 and in the low credit quality segments (high yield - HY), returning to their levels 2016 levels. Political uncertainties in the European HY segment were particularly negative for financial companies. “Commodity” currencies (Russian rouble, Colombian peso) were negatively affected with drops of -17% and -8% respectively (year on year) in the wake of plunging oil prices (WTI -25% year on year) and copper (-18% year on year).
1 Investment Grade refers to private debt bonds with good credit quality and low default risk. This generally corresponds to bonds with a rating of BBB or higher.
FCP HSBC SELECT FLEXIBLE
Annual report for the year ended 31/12/2018 9
The currencies of importing countries (Chinese renminbi, Indian rupee) limited their declines (-5% and -8% year on year, respectively). Lastly, despite a partial recovery in the fourth quarter, the Turkish lira ended down significantly (-28% year on year) due to political tensions. Ultimately, a few safe havens emerged as slightly lucrative over the year (yen +3% year on year and US dollar +4% year on year). Eurozone government bonds (with the exception of Italy) benefited from doubts about the possibility of a true tightening cycle, despite the cessation of the stock purchase programme at the end of December.
By summer 2018, the markets as a whole did not experience any major episodes of risk aversion. Nevertheless, emerging currencies suffered in a very unique way. Most emerging currencies (Brazil, South Africa, China, Russia, and India) experienced sharp declines against the dollar, with Turkey seeing the most dramatic drop (-27%). The Chinese renminbi depreciated significantly (-5.5%) against USD over the quarter, seemingly offsetting the introduction of unilateral tariffs by the US administration. Most industrial, agricultural, or precious metals commodities accompanied this downward trend, while oil prices paradoxically soared over this period (+8.4% for Brent barrel) amid constraints on global production (bottlenecks in the United States) and geopolitical tensions (Iran-Saudi Arabia). Against this backdrop, equity markets were relatively resilient, with the Japanese market performing very strongly in local currency (+10%), followed by emerging equities and US equities. The Italian and English markets remained completely excluded from this recovery dynamic, with declines of -0.5% and -4%, probably explained by domestic causes (fiscal uncertainties in Italy and the threat of a “hard Brexit” in the United Kingdom). In the bond universe, creeping global inflation and fears of tighter monetary policies in Europe fuelled an overall rise in real interest rates, weighing on long-duration bond assets. Lastly, Italian bondholders will have been severely penalised by the instability created by the new coalition government. At the end of the quarter, the yield spread between Italian 10-year bonds and German bonds stood at 290 basis points (bps), compared with 115bps before the election. Against this backdrop, the corporate credit market performed rather well, notably through the high-yield bond segment benefiting from a relative compression of spreads2, with the US market outperforming the Eurozone market very significantly.
Spring 2018 began with a bring period on the markets. After the major risk aversion shock in February, investor confidence recovered in April, particularly in equity markets. Easing of tensions on the geopolitical front with the prospect of a meeting between North Korea and the United States probably contributed to this renewed optimism. Unfortunately, this episode was short-lived. It is difficult to isolate the factors that contributed the most to the deterioration of the climate of confidence from mid-May onwards, particularly in European and emerging equity markets. They may include concerns related to the appointment of an Italian government by an incongruous coalition with a rather contradictory agenda hostile to the European Union in certain aspects, new attacks by the US administration seeking to further increase tariffs on exports unilaterally, mainly German and Chinese, or the political tensions within the German majority over the management of migrants. In this environment of renewed major political and geopolitical uncertainties, the credit and equity markets erased the small gains that had been made since the beginning of the year and the end of the second quarter.
2 Credit spread refers to the difference between the issuance rate of a private debt bond and the issuance rate of a government bond
with the same duration properties.

FCP HSBC SELECT FLEXIBLE
Annual report for the year ended 31/12/2018 10
The divergences in government debt markets did not fade, with US 10-year yields still above 2.8% and German government bond yields dropping to below 0.5% in June amid concerns about eurozone governance. Logically, EUR/USD started to weaken at the end of the winter, falling from 1.26 to 1.16 USD. Generally speaking, the dollar further appreciated against most currencies, in some way allowing the United States to export its domestic inflation. The depreciation of the Chinese currency against the dollar by almost 6.5% since the beginning of April was the most spectacular illustration of this.
In the early days of 2018, risky asset markets continued their euphoric momentum. Nevertheless, the end of January marked a crucial turning point. Implicit volatility surged in the first days of February, accompanied by a sharp correction, causing very violent adjustments, especially in option markets. For example, the VIX index rose from 11.40 on 26 January to 50 during the session on 6 February. Many short positions in volatility products (betting on a continual maintenance or decline in implied volatility) were faced with a phase of abrupt liquidation, thereby destabilising equity markets in particular. Fear of a more aggressive monetary tightening, reflecting an acceleration of bond yields amid inflationary fears, was probably the catalyst for this episode of stress. Apart from this correction with highly endogenous mechanisms, the US administration’s bid for new neo-protectionist measures, initially against Europeans and then China, was also likely to fuel concerns in the first quarter. This explains, in particular, the very disappointing overall performance of equity markets over this period in local currency: S&P 500: -3.5%, Euro-Stoxx 50: -4.6%, Nikkei: -6.5%. Notably, there was no “safe haven” behaviour on the part of sovereign bond markets, suggesting that inflation expectations were still upward for the time being. The deterioration in liquidity and credit conditions in the US interbank markets, although rationalised by technical factors, was also likely to fuel uncertainty. In this context, credit markets also suffered, particularly in the Investment Grade category, especially in the United States. Paradoxically, the high-yield credit bond market held up rather well, suggesting a moderate contagion of equity market pessimism to other asset classes at the end of the quarter.
Data: Bloomberg sources
Management policy
Exposure
The level of equity investment in the portfolios was generally high in a favourable economic environment and low-yield on debt products. Falling equity markets were therefore detrimental, particularly during the last quarter. Exposure to equity markets ranged from 53.3% to 61.0%, or 57.7% on average.
Equity allocation
The impact of the trade war on European exporting companies and political uncertainties, foremost among which is Brexit, led us to curb our positions on European equities. The average weighting was 47% on average, with a high of 54% at the beginning of the year and a low of 40% at the beginning of December.

FCP HSBC SELECT FLEXIBLE
Annual report for the year ended 31/12/2018 11
On the other hand, the additional growth brought about by the Trump administration’s tax measures and the repatriation of capital prompted by the tax exemption of profits of US companies abroad were supporting factors for US assets. We increased our positions in North American equities from 20% in early February to 39% at the end of November. The average weighting was therefore 31% over the year. This position was largely beneficial to the Fund due to the outperformance of the US.
The trade war, its impact on Chinese growth, and politically motivated trade sanctions against Russia and Turkey as well as others were a source of volatility in emerging markets. Our positioning was very active: broad exposure to emerging equities in the first quarter (high of 20% at the end of March), and then a sharp reduction to 10% at the end of May and 7% in the autumn. These allocation changes were beneficial to the Fund, which avoided part of the summer market correction. Valuations returned to low levels: the MSCI Emerging Markets 12-month price-to-earnings ratio reached 10 times in early October for a 25% discount from the beginning of the year and lower than the level reached during the 2015 yuan crisis. The discount even reached 30% on the same indicator applied to MSCI China, which led us to further strengthen our positions, especially in Asia and China. Our year-end positions were 14% of the equity portion in emerging equities, which made it possible to benefit from the best relative performance of emerging markets at the end of the year.
Overall, our allocation choices contributed positively to the Fund’s performance.
Selection of equity vehicles
In Europe, our vehicles were diversified throughout the year. Starting in February, we disposed of the value securities that we preferred at the beginning of the year in favour of defensive stocks, which are more immune to a slowdown in world trade. We further strengthened defensive stocks in the middle of the year and October through the sale of small caps, which allowed us to lessen the decline at the end of the year. However, the sharp underperformance of value stocks and value small-cap funds during the summer weighed on performance.
In the US, we favoured defensive stocks, given the higher valuation of this market. Our low exposure to growth stocks, particularly Nasdaq, was a shortfall over the year. Following the decline in February caused by the first signs of inflation in the United States, we established a position in small caps, which we held until autumn, which contributed positively to performance. They were sold in favour of pharmaceutical stocks, which achieved a good fourth quarter.
Our choices in emerging markets brought little value at the beginning of the year (weakness of Brazil, sanction in Russia). We gradually reallocated to a more defensive investment and then increased our positions in Asia in the last quarter via China but also India.
Among diversification funds, the Fund invested in gold-mining companies, which performed particularly well during the stock market decline at the end of the year.

FCP HSBC SELECT FLEXIBLE
Annual report for the year ended 31/12/2018 12
Selection of vehicles on other asset classes
Apart from equities, we sought investments with an attractive return. Our position in government bonds remained low (4.8% on average) in a context of low interest rates. We tactically exposed the portfolio to German and US debt in futures at times of high volatility. As credit margins narrowed, we lowered our corporate credit positions, particularly from the end of August, on the highest-rated credit classes to reallocate to short-term high-yield credit on a global fund. The partial exit from better-quality credit was favourable, but high-yield credit was impacted in November by the strong rise in risk premiums. Our diversification into convertible bonds was also detrimental to performance.
Our positions in emerging-market bonds did not perform well due to the sharp drop in emerging-market currencies during the summer. Diversification in the HSBC GIF Multi Asset Style Factor absolute return fund was positive, with the fund delivering a 2.1% return over the year. The contribution of currency management was positive over the year. The yen has served as a safe haven for us starting in February. We also benefited from the appreciation of the dollar from February to August before partially reducing our positions (from 20% to 12%).
Performance
At the close of the fiscal year, the Fund posted performance of -9.20% for the AC unit and -8.65% for the HC unit. Given that the BC and RC units were subscribed during the year, no performances were posted for these units. The IT unit is inactive.
Past performance is not an indicator of the Fund’s future performance.
Information on environmental, social, and governance quality (ESG) criteria
In accordance with Article L533-22-1 of the French monetary and financial code, the information on criteria related to meeting the social, environmental, and governance quality (ESG criteria) objectives in the investment policy is available on the management company’s website at www.assetmanagement.hsbc.fr/fr.
Developments in the Fund during the fiscal year or in the future
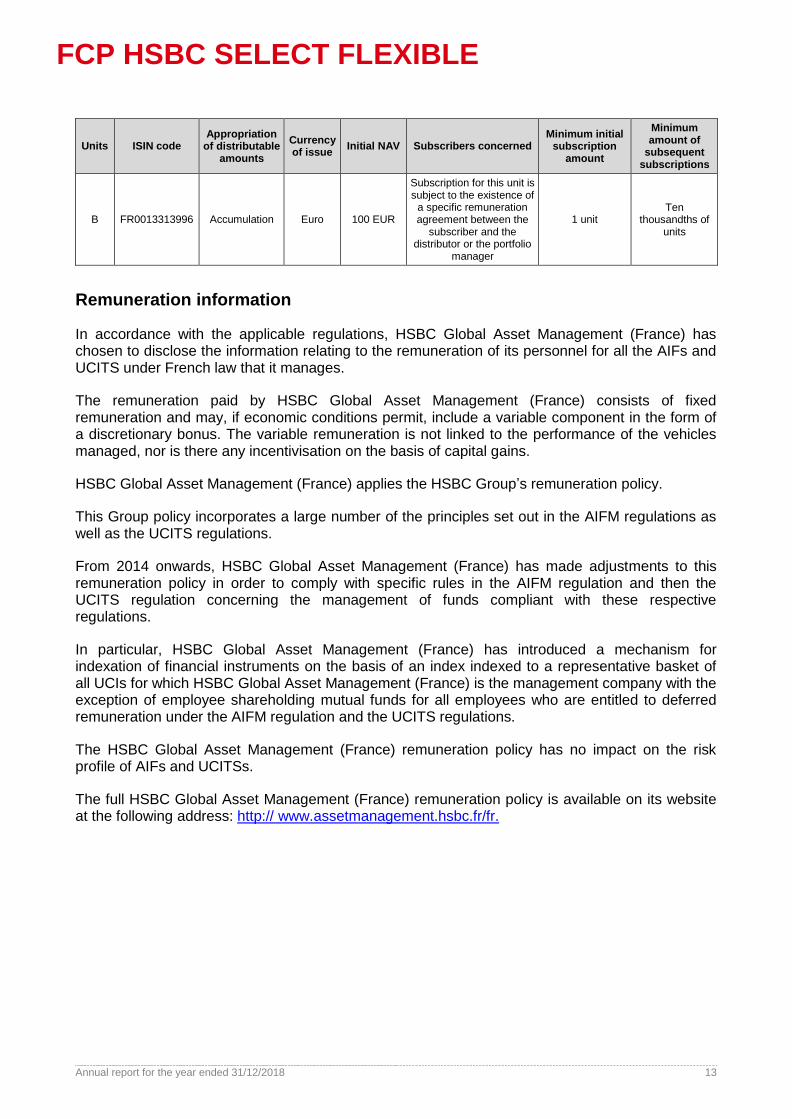
9 February 2018 – Creation of the B unit
We wish to inform you of the creation of the B unit (net of retrocessions) in the Fund. Its subscription is subject to the existence of a specific remuneration agreement between the subscriber and the distributor or the portfolio manager.
FCP HSBC SELECT FLEXIBLE
Annual report for the year ended 31/12/2018 13
Units ISIN code Appropriation
of distributable amounts
Currency of issue
Initial NAV Subscribers concerned Minimum initial
subscription amount
Minimum amount of
subsequent subscriptions
B FR0013313996 Accumulation Euro 100 EUR
Subscription for this unit is subject to the existence of
a specific remuneration agreement between the
subscriber and the distributor or the portfolio
manager
1 unit Ten
thousandths of units
Remuneration information
In accordance with the applicable regulations, HSBC Global Asset Management (France) has chosen to disclose the information relating to the remuneration of its personnel for all the AIFs and UCITS under French law that it manages.
The remuneration paid by HSBC Global Asset Management (France) consists of fixed remuneration and may, if economic conditions permit, include a variable component in the form of a discretionary bonus. The variable remuneration is not linked to the performance of the vehicles managed, nor is there any incentivisation on the basis of capital gains.
HSBC Global Asset Management (France) applies the HSBC Group’s remuneration policy.
This Group policy incorporates a large number of the principles set out in the AIFM regulations as well as the UCITS regulations.
From 2014 onwards, HSBC Global Asset Management (France) has made adjustments to this remuneration policy in order to comply with specific rules in the AIFM regulation and then the UCITS regulation concerning the management of funds compliant with these respective regulations.
In particular, HSBC Global Asset Management (France) has introduced a mechanism for indexation of financial instruments on the basis of an index indexed to a representative basket of all UCIs for which HSBC Global Asset Management (France) is the management company with the exception of employee shareholding mutual funds for all employees who are entitled to deferred remuneration under the AIFM regulation and the UCITS regulations.
The HSBC Global Asset Management (France) remuneration policy has no impact on the risk profile of AIFs and UCITSs.
The full HSBC Global Asset Management (France) remuneration policy is available on its website at the following address: http:// www.assetmanagement.hsbc.fr/fr.
FCP HSBC SELECT FLEXIBLE
Annual report for the year ended 31/12/2018 14
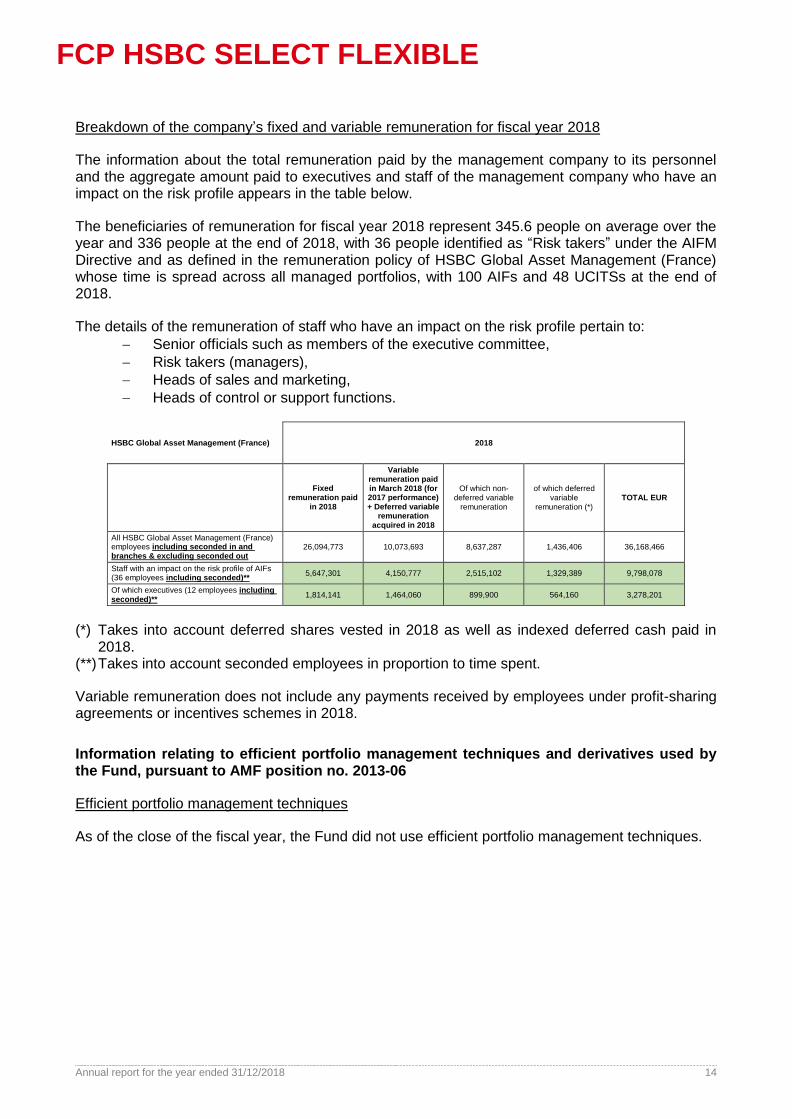
Breakdown of the company’s fixed and variable remuneration for fiscal year 2018
The information about the total remuneration paid by the management company to its personnel and the aggregate amount paid to executives and staff of the management company who have an impact on the risk profile appears in the table below.
The beneficiaries of remuneration for fiscal year 2018 represent 345.6 people on average over the year and 336 people at the end of 2018, with 36 people identified as “Risk takers” under the AIFM Directive and as defined in the remuneration policy of HSBC Global Asset Management (France) whose time is spread across all managed portfolios, with 100 AIFs and 48 UCITSs at the end of 2018.
The details of the remuneration of staff who have an impact on the risk profile pertain to:
Senior officials such as members of the executive committee,
Risk takers (managers),
Heads of sales and marketing,
Heads of control or support functions.
HSBC Global Asset Management (France) 2018
Fixed remuneration paid
in 2018
Variable remuneration paid in March 2018 (for 2017 performance) + Deferred variable
remuneration acquired in 2018
Of which non-deferred variable
remuneration
of which deferred variable
remuneration (*) TOTAL EUR
All HSBC Global Asset Management (France) employees including seconded in and branches & excluding seconded out
26,094,773 10,073,693 8,637,287 1,436,406 36,168,466
Staff with an impact on the risk profile of AIFs (36 employees including seconded)**
5,647,301 4,150,777 2,515,102 1,329,389 9,798,078
Of which executives (12 employees including seconded)**
1,814,141 1,464,060 899,900 564,160 3,278,201
(*) Takes into account deferred shares vested in 2018 as well as indexed deferred cash paid in 2018.
(**) Takes into account seconded employees in proportion to time spent.
Variable remuneration does not include any payments received by employees under profit-sharing agreements or incentives schemes in 2018.
Information relating to efficient portfolio management techniques and derivatives used by the Fund, pursuant to AMF position no. 2013-06
Efficient portfolio management techniques
As of the close of the fiscal year, the Fund did not use efficient portfolio management techniques.
FCP HSBC SELECT FLEXIBLE
Annual report for the year ended 31/12/2018 15
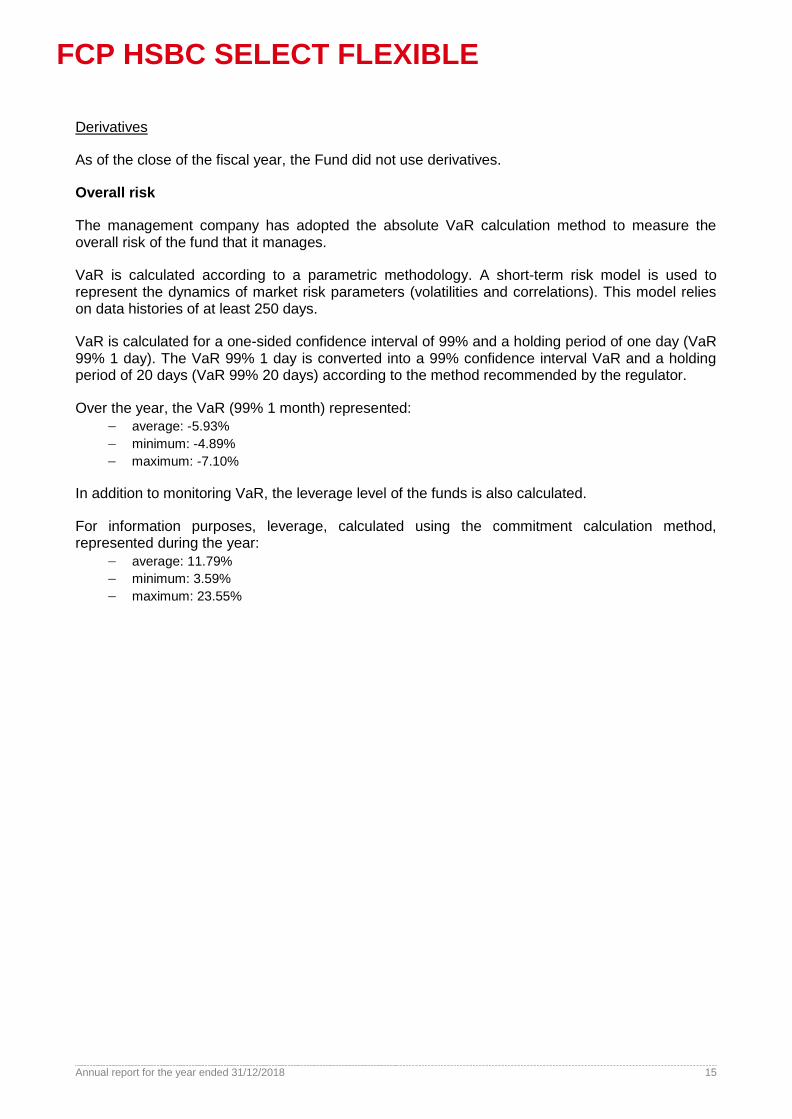
Derivatives
As of the close of the fiscal year, the Fund did not use derivatives.
Overall risk
The management company has adopted the absolute VaR calculation method to measure the overall risk of the fund that it manages.
VaR is calculated according to a parametric methodology. A short-term risk model is used to represent the dynamics of market risk parameters (volatilities and correlations). This model relies on data histories of at least 250 days.
VaR is calculated for a one-sided confidence interval of 99% and a holding period of one day (VaR 99% 1 day). The VaR 99% 1 day is converted into a 99% confidence interval VaR and a holding period of 20 days (VaR 99% 20 days) according to the method recommended by the regulator.
Over the year, the VaR (99% 1 month) represented:
average: -5.93%
minimum: -4.89%
maximum: -7.10%
In addition to monitoring VaR, the leverage level of the funds is also calculated.
For information purposes, leverage, calculated using the commitment calculation method, represented during the year:
average: 11.79%
minimum: 3.59%
maximum: 23.55%

FCP HSBC SELECT FLEXIBLE
Annual report for the year ended 31/12/2018 16
Main movements in the portfolio during the period
Securities Movements (“Accounting currency”)
Acquisitions Disposals
HSBC S AND P 500 ETF 28,000,680.13 14,587,188.68
ISHARES EDGE MSCI EUROPE MIN VOL 16,487,053.40 23,165,817.04
DB X-TRACKERS EURO STOXX 50 28,203,526.86 9,231,353.70
HSBC GIF-EURO CONVERT BD-ZC 16,491,723.80 17,934,196.05
ISHARES EDGE S P 500 MIN VOL 14,552,870.84 18,325,033.63
HSBC EUROLAND EQUITY Z CAP. 13,727,557.10 18,794,410.64
EUROLAND GROWTH ZC 10,110,444.80 19,724,912.07
HSBC EURO GVT BOND FUND ZC 11,634,739.63 13,550,234.58
HSBC EUROLAND EQ.SMALLER Z C. 7,651,878.65 17,087,470.41
HSBC MSCI JAPAN 7,027,972.00 17,669,627.38
Transparency of securities financing transactions and the reuse of financial instruments – SFTR regulation – in the accounting currency of the Fund (EUR)
The Fund did not perform any transactions covered by the SFTR regulation during the fiscal year.
FCP HSBC SELECT FLEXIBLE
Annual report for the year ended 31/12/2018 17
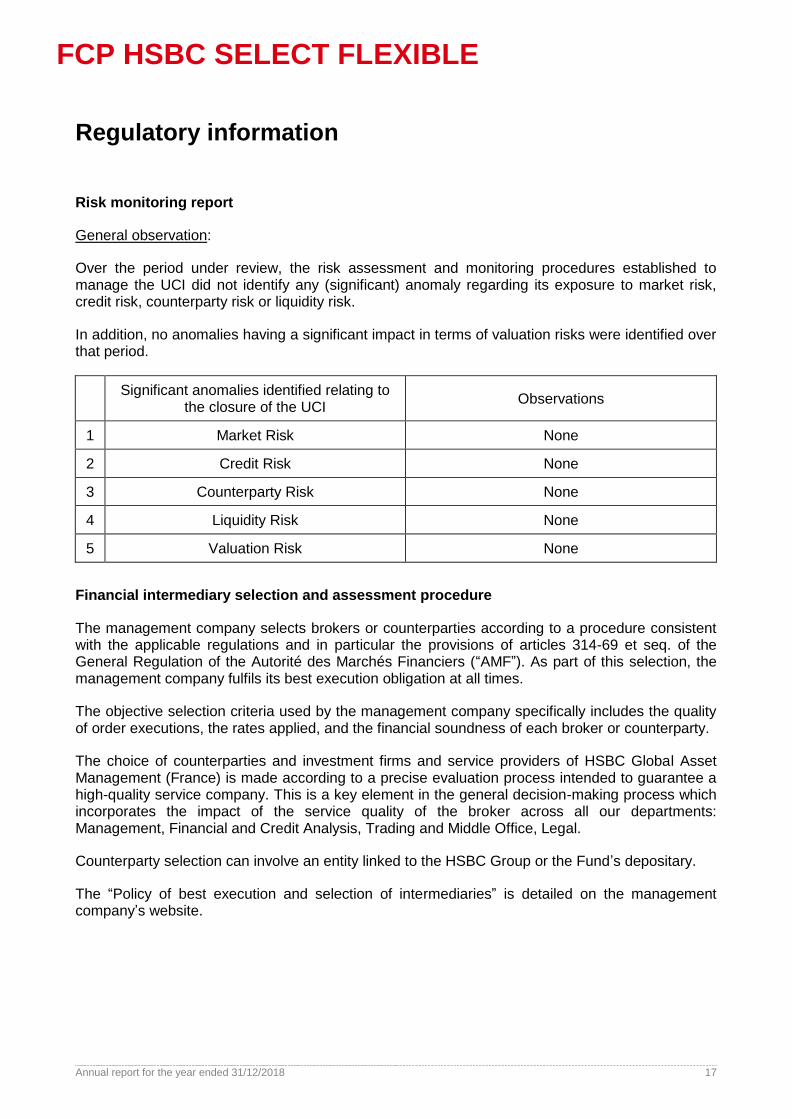
Regulatory information
Risk monitoring report
General observation:
Over the period under review, the risk assessment and monitoring procedures established to manage the UCI did not identify any (significant) anomaly regarding its exposure to market risk, credit risk, counterparty risk or liquidity risk.
In addition, no anomalies having a significant impact in terms of valuation risks were identified over that period.
Significant anomalies identified relating to
the closure of the UCI Observations
1 Market Risk None
2 Credit Risk None
3 Counterparty Risk None
4 Liquidity Risk None
5 Valuation Risk None
Financial intermediary selection and assessment procedure
The management company selects brokers or counterparties according to a procedure consistent with the applicable regulations and in particular the provisions of articles 314-69 et seq. of the General Regulation of the Autorité des Marchés Financiers (“AMF”). As part of this selection, the management company fulfils its best execution obligation at all times.
The objective selection criteria used by the management company specifically includes the quality of order executions, the rates applied, and the financial soundness of each broker or counterparty.
The choice of counterparties and investment firms and service providers of HSBC Global Asset Management (France) is made according to a precise evaluation process intended to guarantee a high-quality service company. This is a key element in the general decision-making process which incorporates the impact of the service quality of the broker across all our departments: Management, Financial and Credit Analysis, Trading and Middle Office, Legal.
Counterparty selection can involve an entity linked to the HSBC Group or the Fund’s depositary.
The “Policy of best execution and selection of intermediaries” is detailed on the management company’s website.

FCP HSBC SELECT FLEXIBLE
Annual report for the year ended 31/12/2018 18
Report on brokerage fees
In accordance with article 314-82 of the General Regulations of the AMF, and if the terms of this article are met, the report on intermediation fees for the previous fiscal year is available on the management company’s website: https://www.assetmanagement.hsbc.fr/fr.
Exercise of voting rights
The management company’s voting policy, as well as the report on the conditions in which the voting rights were exercised, may be consulted on the website: https://www.assetmanagement.hsbc.fr/fr.
Use of financial instruments managed by the management company or a related company
The table of financial instruments managed by the management company or a related company can be found in the notes to the Fund’s annual financial statements.
Conflict of interest policy
Because of its global reach and the wide range of financial services offered, HSBC Group, or its affiliated companies (referred to below as HSBC), is likely to have interests that differ from time to time from those of its clients, or that conflict with its duties with respect to its clients. There may be conflicts between the interests of HSBC, its affiliated companies, or its employees on the one hand, and the interests of its clients on the other, or even conflicts between the clients themselves.
HSBC has defined procedures which aim to identify and manage such conflicts, notably organisational and administrative arrangements intended to protect clients’ interests. This policy is based on a simple principle: persons taking part in various activities posing a conflict of interest are required to execute these activities independently of each other.
Where applicable, HSBC implements measures to restrict the transmission of information to certain employees in order to protect clients’ interests and to prevent any undue access to information concerning clients.
HSBC may also act on its own account and have a client as counterparty or even “match” the orders of its clients. Procedures are in place to protect clients’ interests in this scenario.
In some cases, HSBC’s procedures and controls may not be sufficient to ensure that a potential conflict will not damage a client’s interests. In these circumstances, HSBC informs the client of the potential conflict of interest in order to obtain the client’s express consent to continue the activity. In any event, HSBC may refuse to intervene in circumstances where there would ultimately be a residual risk of damaging a client’s interests.

FCP HSBC SELECT FLEXIBLE
Annual report for the year ended 31/12/2018 19
Statutory auditor’s certification on the annual financial statements
A simplified joint-stock company (SAS) with variable capital 438 476 913 Trade & Companies Register of Nanterre
Auditing Firm
Registered office: 1-2, place des Saisons - 92400 Courbevoie - Paris - La Défense 1
Ernst & Young et Autres Tour First TSA 14444 92037 Paris-La Défense cedex
Tel.: +33 (0) 1 46 93 60 00 www.ey.com/fr
HSBC Select Flexible
Fiscal year ended 31 December 2018
Statutory auditor’s report on the annual financial statements
To the Unitholders of the HSBC Select Flexible fund,
Opinion
In accordance with the assignment entrusted to us by the management company, we audited the annual financial statements of the HSBC Select Flexible undertaking for collective investment, established in the form of a mutual fund, for the fiscal year ended on 31 December 2018, as attached to this report.
We certify that, in accordance with French accounting rules and principles, the annual financial statements are consistent and accurate and present a true and fair view of the results of the operations for the past accounting period and of the Fund’s financial situation and assets and liabilities at the end of said period.
Basis of the opinion
Audit reference standard
We conducted our audit in accordance with professional standards applicable in France. We believe that the evidence that we have collected is sufficient and appropriate to base our opinion.
Our responsibilities according to these standards are described in the section “Statutory auditor’s responsibilities for the audit of the annual financial statements” of this report.
Independence
We conducted our audit in accordance with the rules of independence applicable to us, over the period from 1 January 2018 to the issue date of our report. In particular, we did not provide any services prohibited by the professional code of ethics for statutory auditors.

HSBC Select Flexible Fiscal year ended 31 December 2018
2
Basis for our assessments
Pursuant to the provisions of Articles L. 823-9 and R. 823-7 of the French commercial code concerning the basis for our assessments, we hereby inform you that, in our professional judgment, the most significant assessments that we conducted pertained to the appropriateness of the accounting principles applied, in particular as regards the financial instruments in the portfolio and the overall presentation of the financial statements, in view of the accounting system applicable to open-ended undertakings for collective investments.
These assessments contributed to the audit of the annual financial statements, taken as a whole, and to the formation of our opinion expressed above. We do not express an opinion on items in these annual financial statements viewed in isolation.
Specific verifications
We also performed the specific verifications required by the applicable laws and regulations in accordance with the professional standards required by law and regulation.
We have no comments to make as to the fairness and consistency with the annual financial statements of the information given in the management report prepared by the management company.
Management company’s responsibilities for the annual financial statements
The management company is responsible for preparing annual financial statements presenting a true and fair view in accordance with French accounting rules and principles and implementing the internal controls that it deems necessary for the preparation of annual financial statements free of any material misstatements, whether due to fraud or error.
In connection with the preparation of the annual financial statements, the management company is responsible for assessing the Fund’s ability to continue its operations, providing information on matters relating to the continued operations, where this is relevant, and preparing financial statements on a going-concern basis, unless the management company intends to wind up the Fund or discontinue its operations.
The annual financial statements were approved by the management company.
Statutory auditor’s responsibilities for the audit of the annual financial statements
It is our responsibility to prepare a report on the annual financial statements. Our goal is to obtain reasonable assurance that the annual financial statements taken as a whole do not contain any material misstatements. Reasonable assurance is a high level of assurance but is not a guarantee that an audit performed in accordance with the professional auditing standards will always detect any material misstatement. Misstatements may arise as a result of fraud or error and must be regarded as being material if it can reasonably be expected that they, individually or in the aggregate, will affect the financial decisions made by users of the financial statements on the basis of the financial statements.
As specified by Article L. 823-10-1 of the French commercial code, our role of certifying the financial statements is not to guarantee the viability or the quality of the management of your Fund.

HSBC Select Flexible Fiscal year ended 31 December 2018
3
As part of an audit performed in accordance with the professional auditing standards applicable in France, the statutory auditor uses professional judgement throughout this audit. In addition:
the statutory auditor identifies and assesses the risks that the annual financial statements contain material misstatements, whether due to fraud or error, and defines and implements audit procedures for such risks and collects evidence considered sufficient and appropriate to serve as the basis of its opinion. The risk of not detecting a material misstatement due to fraud is higher than the risk of not detecting a material misstatement due to error, as fraud may involve conspiracy, forgery, deliberate omission, misrepresentation, or non-observance of internal controls;
the statutory auditor obtains an understanding of the internal controls of relevance to the audit in order to design audit procedures that are appropriate in the circumstances, but not to express an opinion on the effectiveness of the internal controls;
the statutory auditor assesses the appropriateness of the accounting methods used and the reasonableness of the accounting estimates made by the management company, as well as the information concerning them provided in the annual financial statements;
the statutory auditor assesses whether the accounting convention of going concern applied by the management company is appropriate and, according to the collective evidence, whether there is any material uncertainty related to events or circumstances likely to call into question the UCI’s ability to continue its operation. This assessment is based on the evidence collected up to the date of its report. However, subsequent circumstances or events could jeopardise the continuity of operations. If a material uncertainty is found, the statutory auditor must draw the attention of the readers of its report to the information provided in the annual financial statements about this uncertainty or, if such information is not provided or is not relevant, must express a qualified certification or a refusal to certify;
the statutory auditor assesses the overall presentation of the annual financial statements and whether they reflect the underlying transactions and events so as to give a true and fair view.
Paris-La Défense, 11 March 2019
The Statutory Auditor ERNST & YOUNG et Autres
Youssef Boujanoui

FCP HSBC SELECT FLEXIBLE
Annual report for the year ended 31/12/2018 23
Annual Financial Statements
FCP HSBC SELECT FLEXIBLE
Annual report for the year ended 31/12/2018 24
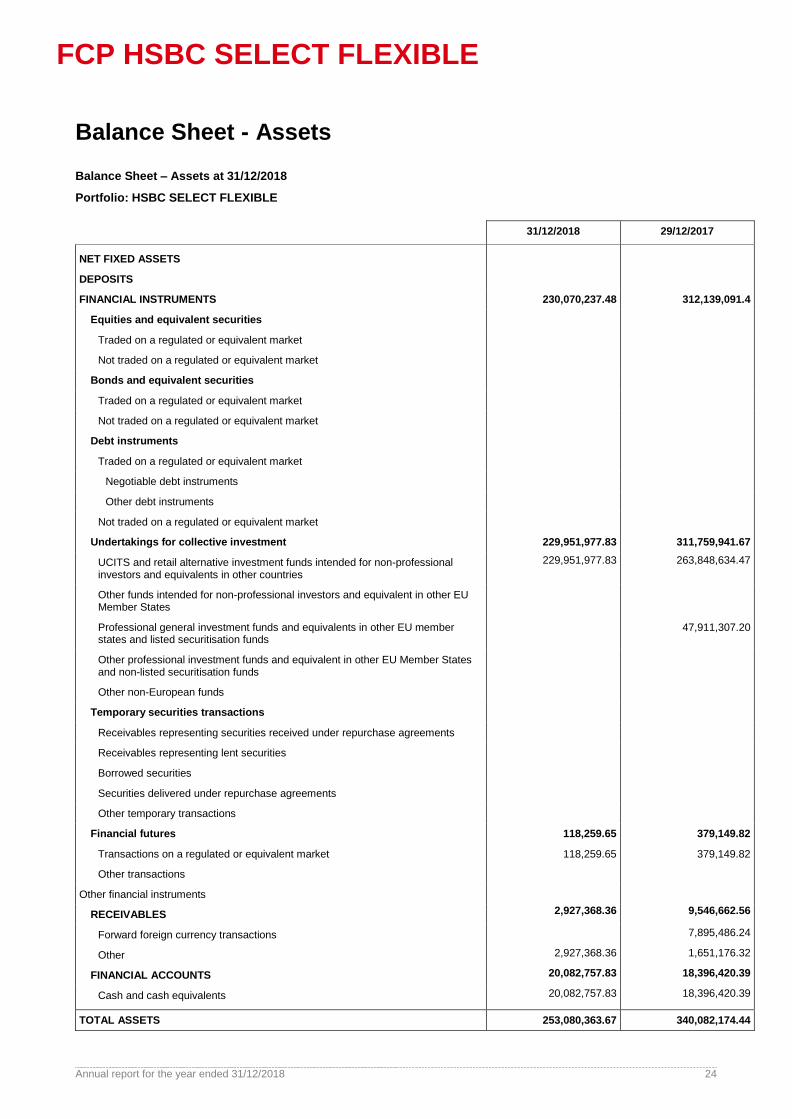
Balance Sheet - Assets
Balance Sheet – Assets at 31/12/2018
Portfolio: HSBC SELECT FLEXIBLE
31/12/2018 29/12/2017
NET FIXED ASSETS
DEPOSITS
FINANCIAL INSTRUMENTS 230,070,237.48 312,139,091.4
Equities and equivalent securities
Traded on a regulated or equivalent market
Not traded on a regulated or equivalent market
Bonds and equivalent securities
Traded on a regulated or equivalent market
Not traded on a regulated or equivalent market
Debt instruments
Traded on a regulated or equivalent market
Negotiable debt instruments
Other debt instruments
Not traded on a regulated or equivalent market
Undertakings for collective investment 229,951,977.83 311,759,941.67
UCITS and retail alternative investment funds intended for non-professional investors and equivalents in other countries
229,951,977.83 263,848,634.47
Other funds intended for non-professional investors and equivalent in other EU Member States
Professional general investment funds and equivalents in other EU member states and listed securitisation funds
47,911,307.20
Other professional investment funds and equivalent in other EU Member States and non-listed securitisation funds
Other non-European funds
Temporary securities transactions
Receivables representing securities received under repurchase agreements
Receivables representing lent securities
Borrowed securities
Securities delivered under repurchase agreements
Other temporary transactions
Financial futures 118,259.65 379,149.82
Transactions on a regulated or equivalent market 118,259.65 379,149.82
Other transactions
Other financial instruments
RECEIVABLES 2,927,368.36 9,546,662.56
Forward foreign currency transactions 7,895,486.24
Other 2,927,368.36 1,651,176.32
FINANCIAL ACCOUNTS 20,082,757.83 18,396,420.39
Cash and cash equivalents 20,082,757.83 18,396,420.39
TOTAL ASSETS 253,080,363.67 340,082,174.44

FCP HSBC SELECT FLEXIBLE
Annual report for the year ended 31/12/2018 25
Balance Sheet - Liabilities & Equity
Balance Sheet – Liabilities & Equity at 31/12/2018
Portfolio: HSBC SELECT FLEXIBLE
31/12/2018 29/12/2017
SHAREHOLDERS’ EQUITY
Capital 236,021,874.52 304,894,257.36
Prior undistributed net capital gains and losses (a)
Retained earnings (a)
Net capital gains and losses for the fiscal year (a, b) -2,518,710.91 18,218,909.12
Earnings for the fiscal year (a, b) -1,982,671.13 -1,001,562.40
TOTAL SHAREHOLDERS’ EQUITY* 231,520,492.48 322,111,604.08
Amount representing net assets
FINANCIAL INSTRUMENTS 152,831.89 248,649.74
Disposals involving financial instruments
Temporary securities transactions
Debts representing securities delivered under repurchase agreements
Debts representing borrowed securities
Other temporary transactions
Financial futures 152,831.89 248,649.74
Transactions on a regulated or equivalent market 152,831.89 248,649.74
Other transactions
DEBTS 4,030,501.24 12,016,136.36
Forward foreign currency transactions 7,757,898.44
Other 4,030,501.24 4,258,237.92
FINANCIAL ACCOUNTS 17,376,538.06 5,705,784.26
Current bank facilities 17,376,538.06 5,705,784.26
Loans
TOTAL LIABILITIES 253,080,363.67 340,082,174.44
(a) Including accruals (b) Less interim payments for the fiscal year
FCP HSBC SELECT FLEXIBLE
Annual report for the year ended 31/12/2018 26
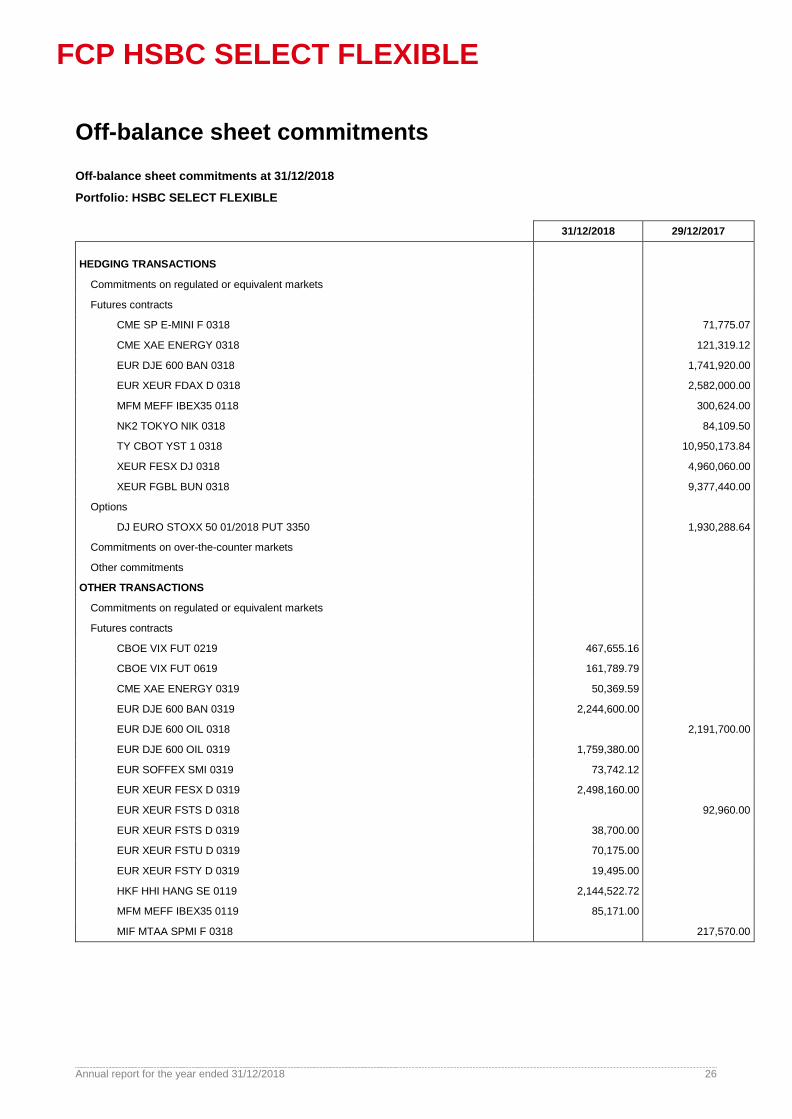
Off-balance sheet commitments
Off-balance sheet commitments at 31/12/2018
Portfolio: HSBC SELECT FLEXIBLE
31/12/2018 29/12/2017
HEDGING TRANSACTIONS
Commitments on regulated or equivalent markets
Futures contracts
CME SP E-MINI F 0318 71,775.07
CME XAE ENERGY 0318 121,319.12
EUR DJE 600 BAN 0318 1,741,920.00
EUR XEUR FDAX D 0318 2,582,000.00
MFM MEFF IBEX35 0118 300,624.00
NK2 TOKYO NIK 0318 84,109.50
TY CBOT YST 1 0318 10,950,173.84
XEUR FESX DJ 0318 4,960,060.00
XEUR FGBL BUN 0318 9,377,440.00
Options
DJ EURO STOXX 50 01/2018 PUT 3350 1,930,288.64
Commitments on over-the-counter markets
Other commitments
OTHER TRANSACTIONS
Commitments on regulated or equivalent markets
Futures contracts
CBOE VIX FUT 0219 467,655.16
CBOE VIX FUT 0619 161,789.79
CME XAE ENERGY 0319 50,369.59
EUR DJE 600 BAN 0319 2,244,600.00
EUR DJE 600 OIL 0318 2,191,700.00
EUR DJE 600 OIL 0319 1,759,380.00
EUR SOFFEX SMI 0319 73,742.12
EUR XEUR FESX D 0319 2,498,160.00
EUR XEUR FSTS D 0318 92,960.00
EUR XEUR FSTS D 0319 38,700.00
EUR XEUR FSTU D 0319 70,175.00
EUR XEUR FSTY D 0319 19,495.00
HKF HHI HANG SE 0119 2,144,522.72
MFM MEFF IBEX35 0119 85,171.00
MIF MTAA SPMI F 0318 217,570.00

FCP HSBC SELECT FLEXIBLE
Annual report for the year ended 31/12/2018 27
Off-balance sheet commitments
Off-balance sheet commitments at 31/12/2018
Portfolio: HSBC SELECT FLEXIBLE
31/12/2018 29/12/2017
MIF MTAA SPMI F 0319 182,060.00
NK2 TOKYO NIK 0319 79,472.53
NQ USA NASDAQ 0318 2,988,757.50
NQ USA NASDAQ 0319 2,105,266.15
NYS NYL MSCI EM 0318 3,246,498.17
NYS NYL MSCI EM 0319 3,044,639.81
SP E-MINI HEA 0319 75,808.07
SP 500 MINI 0318 4,457,028.65
SP 500 MINI 0319 1,314,893.06
TY CBOT YST 1 0319 4,482,925.47
XATH ASEFTSE 0119 7,995.00
XEUR FDAX DAX 0319 792,112.50
XEUR FGBL BUN 0319 4,579,120.00
XPAR FCE CAC 0119 2,458,820.00
Z UKX - LOND 0318 172,094.86
Z UKX - LOND 0319 148,381.71
Options
DJ EURO STOXX 50 01/2018 PUT 3500 7,756,848.18
DJ EURO STOXX 50 01/2019 PUT 2900 1,056,245.59
Commitments on over-the-counter markets
Other commitments
FCP HSBC SELECT FLEXIBLE
Annual report for the year ended 31/12/2018 28
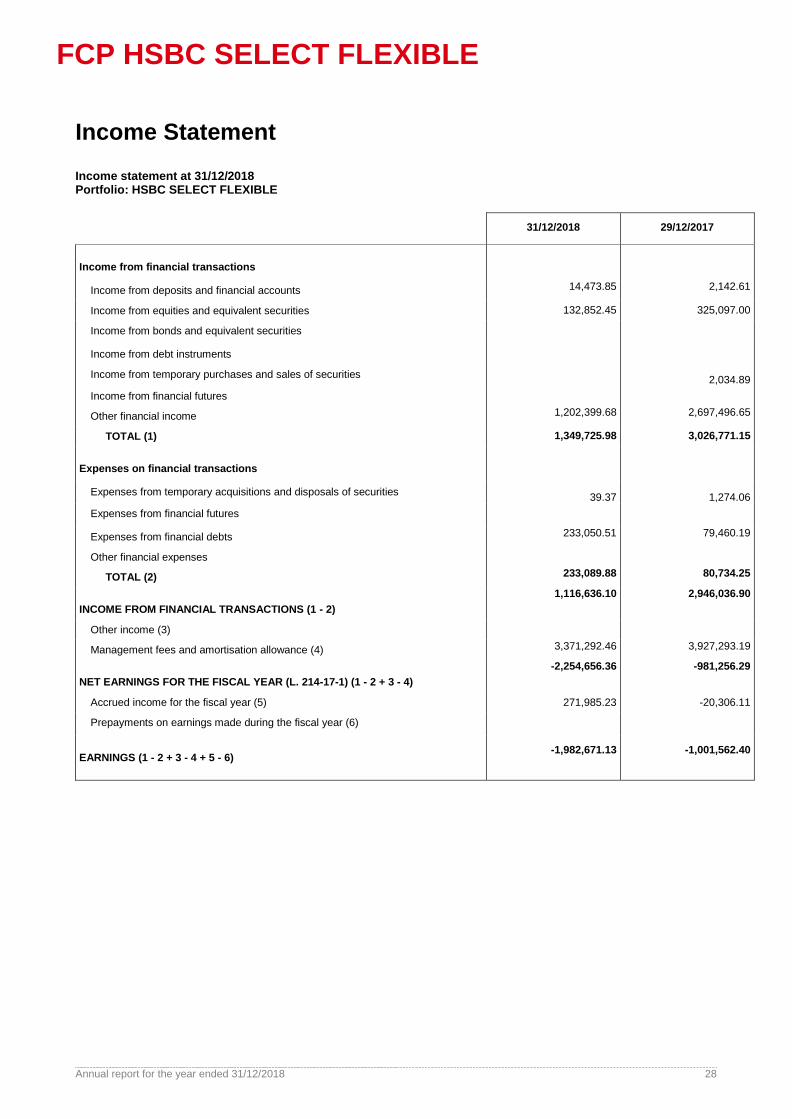
Income Statement
Income statement at 31/12/2018 Portfolio: HSBC SELECT FLEXIBLE
31/12/2018 29/12/2017
Income from financial transactions
Income from deposits and financial accounts 14,473.85 2,142.61
Income from equities and equivalent securities 132,852.45 325,097.00
Income from bonds and equivalent securities
Income from debt instruments
Income from temporary purchases and sales of securities 2,034.89
Income from financial futures
Other financial income 1,202,399.68 2,697,496.65
TOTAL (1) 1,349,725.98 3,026,771.15
Expenses on financial transactions
Expenses from temporary acquisitions and disposals of securities 39.37 1,274.06
Expenses from financial futures
Expenses from financial debts 233,050.51 79,460.19
Other financial expenses
TOTAL (2) 233,089.88 80,734.25
INCOME FROM FINANCIAL TRANSACTIONS (1 - 2)
1,116,636.10 2,946,036.90
Other income (3)
Management fees and amortisation allowance (4) 3,371,292.46 3,927,293.19
NET EARNINGS FOR THE FISCAL YEAR (L. 214-17-1) (1 - 2 + 3 - 4)
-2,254,656.36 -981,256.29
Accrued income for the fiscal year (5) 271,985.23 -20,306.11
Prepayments on earnings made during the fiscal year (6)
EARNINGS (1 - 2 + 3 - 4 + 5 - 6) -1,982,671.13 -1,001,562.40

FCP HSBC SELECT FLEXIBLE
Annual report for the year ended 31/12/2018 29
Appendices
FCP HSBC SELECT FLEXIBLE
Annual report for the year ended 31/12/2018 30
Notes to the Annual Financial Statements
ACCOUNTING RULES AND METHODS
The annual financial statements are presented in the form prescribed by ANC regulation 2014-01, as amended.
General accounting principles are applied:
true and fair view, comparability, going concern;
accuracy, reliability;
prudence;
consistency of accounting methods from one period to the next.
The accrued interest method is used to recognise revenue from fixed income securities.
Securities bought and sold are recognised excluding costs. The euro is the reference currency for the portfolio’s accounting. The duration of the fiscal year is 12 months.
Asset valuation rules
Financial instruments are recognised according to the historical cost method and are included on the balance sheet at their current value, which is determined by the last known market value or, if no market exists, by any external means or through the use of financial models. Differences between the current values used when calculating the net asset value and the historical costs of the securities upon their entry into the portfolio are recorded in “Valuation differentials” accounts. Securities that are not in the portfolio’s currency are recognised in accordance with the principle set forth below then converted into the portfolio’s currency according to the exchange rates in effect on the day of the valuation.
Deposits:
Deposits with a residual maturity of 3 months or less are valued according to the straight-line method.
Equities, bonds, and other securities traded on a regulated or equivalent market:
For the calculation of the net asset value, equities and other securities traded on a regulated or equivalent market are valued on the basis of the day’s last market price.
Bonds and equivalent securities are valued at the closing price supplied by various financial services providers. Interest accrued on bonds and equivalent securities is calculated up to the net asset value date.
FCP HSBC SELECT FLEXIBLE
Annual report for the year ended 31/12/2018 31
Equities, bonds, and other securities not traded on a regulated or equivalent market:
Securities not traded on a regulated market are valued under the responsibility of the management company using methods based on the asset value and the yield, taking into consideration the prices used in recent significant transactions.
Negotiable debt instruments:
Negotiable debt instruments and equivalent securities that are not the subject of significant transactions are valued on an actuarial basis according to a reference rate defined below, plus, where applicable, a differential representative of the issuer’s intrinsic characteristics: Negotiable debt instruments with a maturity less than or equal to 1 year: Interbank rate offered in euros (Euribor); negotiable debt instruments maturing in more than 1 year: Rate of normalised annual interest Treasury bonds (BTAN) or fungible Treasury bonds (OAT) with equivalent maturity for the longest durations.
Negotiable debt instruments with a residual maturity of 3 months or less may be valued according to the straight-line method.
Treasury bonds are valued at the market rate communicated daily by Banque de France.
UCIs held:
UCI units or shares are valued at the last known net asset value.
Temporary securities transactions:
Securities received under repurchase agreements are recorded in assets in “receivables representing securities received under repurchase agreements” for the amount provided for in the contract plus accrued interest receivable.
Securities delivered under repurchase agreements are recorded in the long portfolio for their current value. Debt representing securities delivered under repurchase agreements is recorded in the short portfolio at the value set in the contract plus accrued interest payable.
Lent securities are valued at their current value and are recorded in assets under the heading of “Receivables representing lent securities” at the current value plus accrued interest receivable.
Borrowed securities are recorded in assets in “borrowed securities” for the amount specified in the contract and in liabilities in “debts representing borrowed securities” for the amount specified in the contract plus accrued interest payable.
Financial futures:
Financial futures traded on a regulated or equivalent market:
Financial futures traded on regulated markets are valued at the day’s settlement price.

FCP HSBC SELECT FLEXIBLE
Annual report for the year ended 31/12/2018 32
Financial futures not traded on a regulated or equivalent market:
Swaps:
Interest rate and/or currency swaps are valued at their market value based on the price calculated by discounting future interest flows at the market interest and/or exchange rates. This price is adjusted to take into account the issuer’s creditworthiness risk.
Index swaps are valued on an actuarial basis according to a reference rate provided by the counterparty.
Other swaps are valued at their market value or at a value estimated according to the methods established by the management company.
Off-balance sheet commitments:
Futures contracts appear in off-balance sheet commitments for their market value at the price used in the portfolio. Options are converted into the underlying equivalent. Commitments on swaps are shown at their nominal value or, in the absence of a nominal value, for an equivalent amount.
Management fees
Management fees are calculated at each valuation on the basis of the net assets. These fees are charged to the income statement of the Fund. Management fees are paid in full to the management company, which is responsible for all UCI operating costs. Management fees do not include transaction fees.
A unit: The maximum rate applied on the basis of net assets is 1.20% including taxes for internal charges and 0.30% including taxes for external charges.
B unit: The maximum rate applied on the basis of net assets is 0.60% including taxes for internal charges and 0.30% including taxes for external charges.
H unit: The maximum rate applied on the basis of net assets is 0.60% including taxes for internal charges and 0.30% including taxes for external charges.
R unit: The maximum rate applied on the basis of net assets is 0.30% including taxes for internal charges and 0.30% including taxes for external charges.
IT units: The maximum rate applied on the basis of net assets is 0.60% including taxes for internal charges and 0.40% including taxes for external charges.
Retrocession of management fees to be collected is taken into account at each net asset value. The funded amount is equal to the share of retrocession earned over the period in question.

FCP HSBC SELECT FLEXIBLE
Annual report for the year ended 31/12/2018 33
Appropriation of distributable amounts
Definition of distributable amounts:
Distributable amounts consist of the following:
Earnings:
Net earnings for the fiscal year are equal to the amount of interest, arrears, premiums and bonuses, dividends, directors’ fees, and any other income related to the securities comprising the portfolio, plus the income from any amounts temporarily available, less management fees and borrowing costs. Net earnings are increased by retained earnings and increased or reduced by the balance of accrued income.
Capital gains and losses:
Capital gains realised, net of costs, less capital losses realised, net of costs, recognised during the fiscal year, plus net capital gains of the same type recognised in previous fiscal years that were not distributed or accumulated, plus or minus the balance of accrued capital gains.
Methods for appropriating distributable amounts:
Distributable amounts A, B, H, IT, and R units
Appropriation of net earnings Accumulation
Appropriation of realised net capital gains or losses Accumulation

FCP HSBC SELECT FLEXIBLE
Annual report for the year ended 31/12/2018 34
Change in Net Assets
Change in net assets at 31/12/2018 Portfolio: HSBC SELECT FLEXIBLE
31/12/2018 29/12/2017
NET ASSETS AT THE START OF THE FISCAL YEAR
Subscriptions (including subscription fees earned by the Fund) 322,111,604.08 308,849,625.86
Redemptions (after deducting redemption fees earned by the Fund) 21,819,243.38 63,218,261.62
Capital gains realised on deposits and financial instruments -87,761,911.52 -57,261,988.51
Capital losses realised on deposits and financial instruments 12,904,514.42 30,933,314.26
Capital gains realised on financial futures -9,768,429.51 -3,277,236.99
Capital losses realised on financial futures 12,921,000.86 12,642,121.18
Transaction fees -17,251,067.13 -12,545,166.05
Foreign exchange gains/losses -341,699.06 -423,568.81
Changes in the valuation differential of deposits and financial instruments 427,512.21 -11,338,044.83
Valuation differential period N -21,116,670.97 -7,718,336.82
Valuation differential period N-1 -16,416,971.13 4,699,699.84
Changes in the valuation differential of financial futures -4,699,699.84 -12,418,036.66
Valuation differential period N -168,947.92 13,879.46
Valuation differential period N-1 -54,491.50 114,456.42
Distribution from previous period on net gains and losses -114,456.42 -100,576.96
Distribution from previous period on earnings
Net earnings for period, before accruals -2,254,656.36 -981,256.29
Prepayment(s) made during period on net gains and losses
Prepayment(s) made during period on earnings
Other items
NET ASSETS AT THE END OF THE FISCAL YEAR 231,520,492.48 322,111,604.08
FCP HSBC SELECT FLEXIBLE
Annual report for the year ended 31/12/2018 35
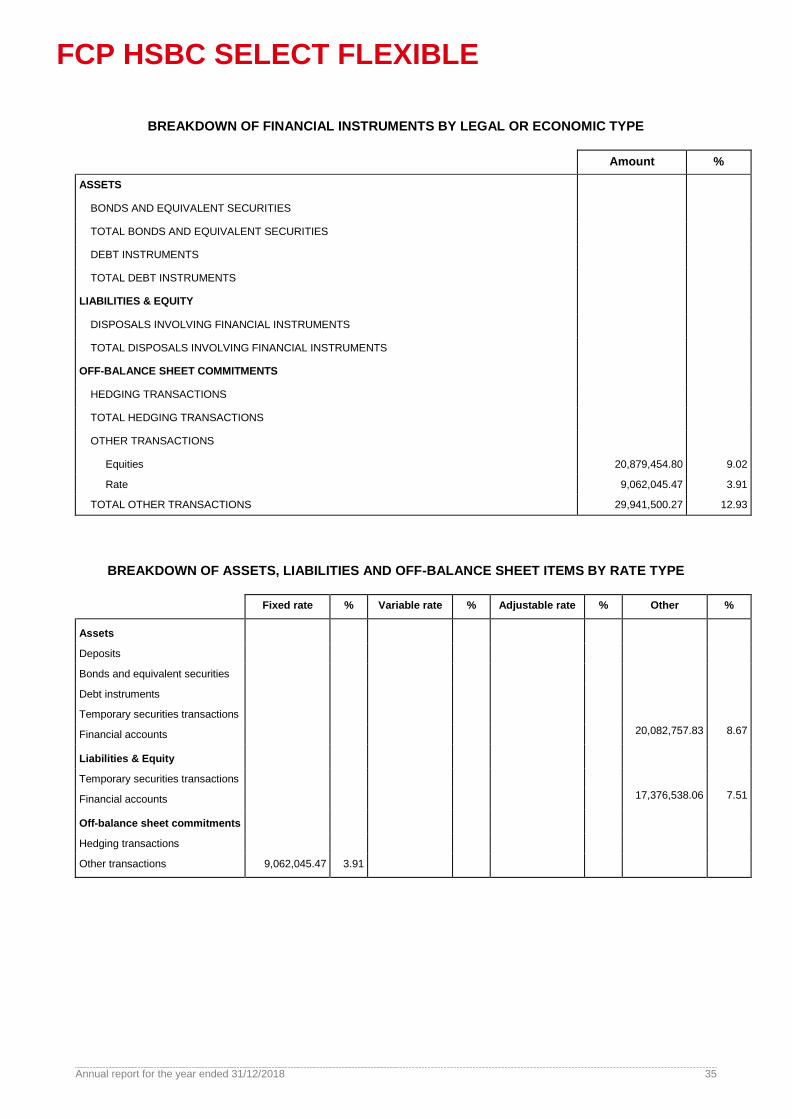
BREAKDOWN OF FINANCIAL INSTRUMENTS BY LEGAL OR ECONOMIC TYPE
Amount %
ASSETS
BONDS AND EQUIVALENT SECURITIES
TOTAL BONDS AND EQUIVALENT SECURITIES
DEBT INSTRUMENTS
TOTAL DEBT INSTRUMENTS
LIABILITIES & EQUITY
DISPOSALS INVOLVING FINANCIAL INSTRUMENTS
TOTAL DISPOSALS INVOLVING FINANCIAL INSTRUMENTS
OFF-BALANCE SHEET COMMITMENTS
HEDGING TRANSACTIONS
TOTAL HEDGING TRANSACTIONS
OTHER TRANSACTIONS
Equities 20,879,454.80 9.02
Rate 9,062,045.47 3.91
TOTAL OTHER TRANSACTIONS 29,941,500.27 12.93
BREAKDOWN OF ASSETS, LIABILITIES AND OFF-BALANCE SHEET ITEMS BY RATE TYPE
Fixed rate % Variable rate % Adjustable rate % Other %
Assets
Deposits
Bonds and equivalent securities
Debt instruments
Temporary securities transactions
Financial accounts 20,082,757.83 8.67
Liabilities & Equity
Temporary securities transactions
Financial accounts 17,376,538.06 7.51
Off-balance sheet commitments
Hedging transactions
Other transactions 9,062,045.47 3.91

FCP HSBC SELECT FLEXIBLE
Annual report for the year ended 31/12/2018 36
BREAKDOWN OF ASSETS, LIABILITIES AND OFF-BALANCE SHEET ITEMS BY RESIDUAL MATURITY
< 3 months % ]3 months - 1 year]
% ]1 - 3 years]
% ]3 - 5 years] % > 5 years %
Assets
Deposits
Bonds and equivalent securities
Debt instruments
Temporary securities transactions
Financial accounts 20,082,757.83 8.67
Liabilities & Equity
Temporary securities transactions
Financial accounts 17,376,538.06 7.51
Off-balance sheet commitments
Hedging transactions
Other transactions 9,062,045.47 3.91
Forward-rate positions are presented according to the maturity of the underlying assets.
BREAKDOWN OF ASSETS, LIABILITIES AND OFF-BALANCE SHEET COMMITMENTS BY LISTING CURRENCY OR VALUATION CURRENCY (Excluding euro)
Currency 1
USD
% Currency 2
GBP
% Currency 3
JPY
% Currency N OTHER(S)
%
Assets
Deposits
Equities and equivalent securities
Bonds and equivalent securities
Debt instruments
UCIs 72,631,948.52 31.37 6,028,112.64 2.60 703,366.35 0.30
Temporary securities transactions
Receivables 439,707.74 0.19 6,818.56 0.00 4,385.24 0.00 176,181.18 0.08
Financial accounts 889,556.49 0.38 3,963,376.54 1.71 3,777,741.45 1.63 112,273.87 0.05
Liabilities & Equity
Disposals involving financial instruments
Temporary securities transactions
Payables 1,806,998.21 0.78
Financial accounts 16,846,709.03 7.28 529,829.03 0.23
Off-balance sheet commitments
Hedging transactions
Other transactions 11,703,347.10 5.05 148,381.71 0.06 79,472.53 0.03 2,218,264.84 0.96

FCP HSBC SELECT FLEXIBLE
Annual report for the year ended 31/12/2018 37
RECEIVABLES AND PAYABLES: BREAKDOWN BY TYPE
Debit/credit type 31/12/2018
Receivables Deferred settlement sales 1,720,991.70
Subscriptions receivable 702.99
Cash security deposits 1,192,520.38
Coupons and dividends in cash 10,829.64
Total receivables
Other receivables 2,323.65
2,927,368.36
Payables Deferred settlement purchases - 3,073,213.21
Redemptions payable - 702,074.36
Management fees - 255,213.67
Total payables - 4,030,501.24
NUMBER OF SECURITIES ISSUED OR REDEEMED
Units Amount
R unit
Units subscribed during the fiscal year 20.2790 19,983.85
Units redeemed during the fiscal year -2.7000 -2,653.72
Net balance of subscriptions/redemptions 17.5790 17,330.13
A unit
Units subscribed during the fiscal year 143,193.2634 12,269,285.50
Units redeemed during the fiscal year -949,615.2933 -80,517,096.79
Net balance of subscriptions/redemptions -806,422.0299 -68,247,811.29
H unit
Units subscribed during the fiscal year 50.3362 5,294,372.54
Units redeemed during the fiscal year -55.9917 -5,978,503.36
Net balance of subscriptions/redemptions -5.6555 -684,130.82
B unit
Units subscribed during the fiscal year 42,356.0149 4,235,601.49
Units redeemed during the fiscal year -12,995.2453 -1,263,657.65
Net balance of subscriptions/redemptions 29,360.7696 2,971,943.84
FCP HSBC SELECT FLEXIBLE
Annual report for the year ended 31/12/2018 38
SUBSCRIPTION AND/OR REDEMPTION FEES
Amount
A unit
Redemption commissions earned
Subscription commissions earned
Total commissions earned
R unit
Redemption commissions earned
Subscription commissions earned
Total commissions earned
A unit
Redemption commissions earned
Subscription commissions earned
Total commissions earned
B unit
Redemption commissions earned
Subscription commissions earned
Total commissions earned

FCP HSBC SELECT FLEXIBLE
Annual report for the year ended 31/12/2018 39
MANAGEMENT FEES
31/12/2018
A unit
Guarantee commissions
Fixed management fees 3,183,166.87
Percentage of fixed management fees 1.26
Variable management fees
Retrocession of management fees
R unit
Guarantee commissions
Fixed management fees 20.18
Percentage of fixed management fees 0.29
Variable management fees
Retrocession of management fees
H unit
Guarantee commissions
Fixed management fees 172,602.68
Percentage of fixed management fees 0.66
Variable management fees
Retrocession of management fees
B unit
Guarantee commissions
Fixed management fees 15,502.73
Percentage of fixed management fees 0.65
Variable management fees
Retrocession of management fees
COMMITMENTS RECEIVED AND GIVEN
Guarantees received by the Fund
None.
Other commitments received and/or given
None.
FCP HSBC SELECT FLEXIBLE
Annual report for the year ended 31/12/2018 40
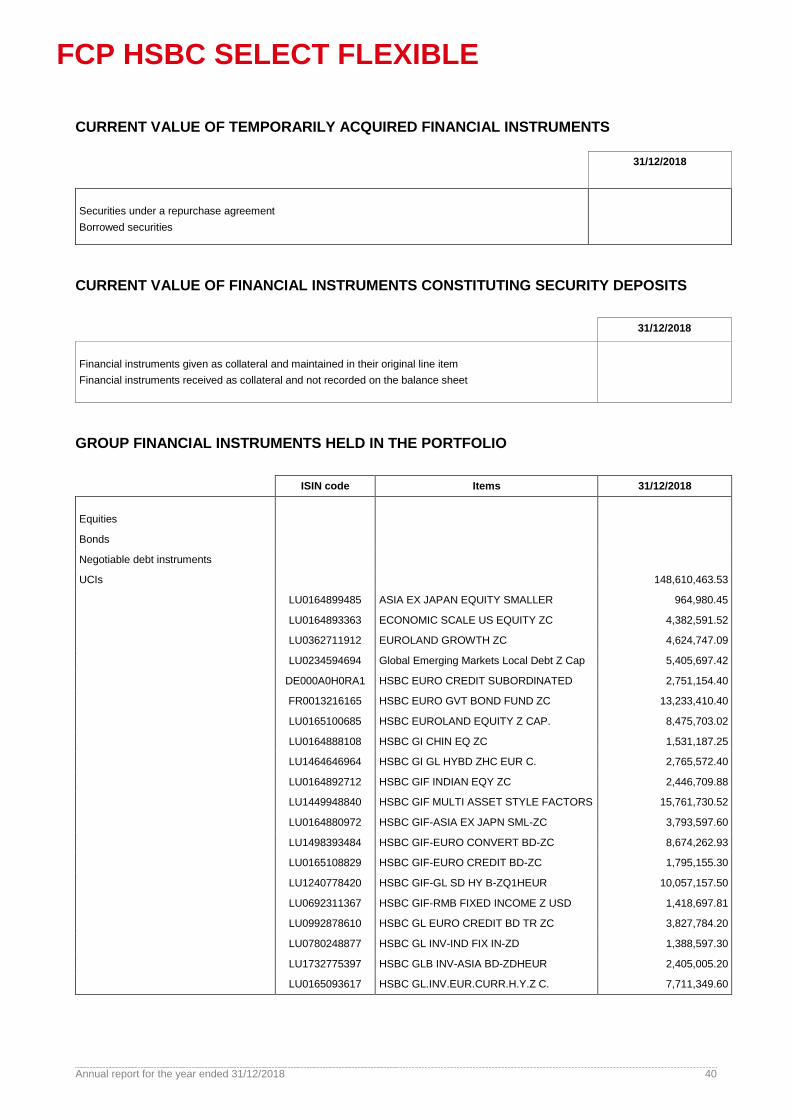
CURRENT VALUE OF TEMPORARILY ACQUIRED FINANCIAL INSTRUMENTS
31/12/2018
Securities under a repurchase agreement
Borrowed securities
CURRENT VALUE OF FINANCIAL INSTRUMENTS CONSTITUTING SECURITY DEPOSITS
31/12/2018
Financial instruments given as collateral and maintained in their original line item
Financial instruments received as collateral and not recorded on the balance sheet
GROUP FINANCIAL INSTRUMENTS HELD IN THE PORTFOLIO
ISIN code Items 31/12/2018
Equities
Bonds
Negotiable debt instruments
UCIs 148,610,463.53
LU0164899485 ASIA EX JAPAN EQUITY SMALLER 964,980.45
LU0164893363 ECONOMIC SCALE US EQUITY ZC 4,382,591.52
LU0362711912 EUROLAND GROWTH ZC 4,624,747.09
LU0234594694 Global Emerging Markets Local Debt Z Cap 5,405,697.42
DE000A0H0RA1 HSBC EURO CREDIT SUBORDINATED 2,751,154.40
FR0013216165 HSBC EURO GVT BOND FUND ZC 13,233,410.40
LU0165100685 HSBC EUROLAND EQUITY Z CAP. 8,475,703.02
LU0164888108 HSBC GI CHIN EQ ZC 1,531,187.25
LU1464646964 HSBC GI GL HYBD ZHC EUR C. 2,765,572.40
LU0164892712 HSBC GIF INDIAN EQY ZC 2,446,709.88
LU1449948840 HSBC GIF MULTI ASSET STYLE FACTORS 15,761,730.52
LU0164880972 HSBC GIF-ASIA EX JAPN SML-ZC 3,793,597.60
LU1498393484 HSBC GIF-EURO CONVERT BD-ZC 8,674,262.93
LU0165108829 HSBC GIF-EURO CREDIT BD-ZC 1,795,155.30
LU1240778420 HSBC GIF-GL SD HY B-ZQ1HEUR 10,057,157.50
LU0692311367 HSBC GIF-RMB FIXED INCOME Z USD 1,418,697.81
LU0992878610 HSBC GL EURO CREDIT BD TR ZC 3,827,784.20
LU0780248877 HSBC GL INV-IND FIX IN-ZD 1,388,597.30
LU1732775397 HSBC GLB INV-ASIA BD-ZDHEUR 2,405,005.20
LU0165093617 HSBC GL.INV.EUR.CURR.H.Y.Z C. 7,711,349.60

FCP HSBC SELECT FLEXIBLE
Annual report for the year ended 31/12/2018 41
GROUP FINANCIAL INSTRUMENTS HELD IN THE PORTFOLIO
ISIN code Items 31/12/2018
LU1464645487 HSBC GLOB GL EM ZHC EUR C. 2,012,717.00
LU1808496456 HSBC GLOBAL EMERG MKTS LOCAL 4,975,747.20
LU1464647699 HSBC GLOBAL INVEST FUNDS GLOBAL 2,476,798.05
LU0197775884 HSBC Global Investment Funds - Asia Pacific 2,005,978.62
FR0000971277 HSBC MONEY ZC 5,524,014.00
IE00B5VX7566 HSBC MSCI JAPAN 2,685,311.50
FR0013215696 HSBC OBLIG INFLATION EURO ZC 2,939,490.71
IE00B5KQNG97 HSBC S AND P 500 ETF 20,889,656.61
LU0329931686 Russia Equity Z Cap 1,685,658.05
Financial futures

FCP HSBC SELECT FLEXIBLE
Annual report for the year ended 31/12/2018 42
STATEMENT OF APPROPRIATION OF THE SHARE OF DISTRIBUTABLE AMOUNTS RELATED TO EARNINGS
31/12/2018 29/12/2017
Amounts remaining to be appropriated
Retained earnings
Earnings -1,982,671.13 -1,001,562.40
Total -1,982,671.13 -1,001,562.40
31/12/2018 29/12/2017
R unit
Appropriation
Distribution
Retained earnings for the period
Accumulation 22.08
Total 22.08
31/12/2018 29/12/2017
A unit
Appropriation
Distribution
Retained earnings for the period
Accumulation -1,915,176.26 -1,062,706.48
Total -1,915,176.26 -1,062,706.48
31/12/2018 29/12/2017
B unit
Appropriation
Distribution
Retained earnings for the period
Accumulation -62,020.45 61,144.08
Total -62,020.45 61,144.08
31/12/2018 29/12/2017
B unit
Appropriation
Distribution
Retained earnings for the period
Accumulation -5,496.50
Total -5,496.50

FCP HSBC SELECT FLEXIBLE
Annual report for the year ended 31/12/2018 43
STATEMENT OF APPROPRIATION OF THE SHARE OF DISTRIBUTABLE AMOUNTS RELATED TO NET CAPITAL GAINS AND LOSSES
31/12/2018 29/12/2017
Amounts remaining to be appropriated
Past net gains and losses not distributed
Net gains and losses for the period -2,518,710.91 18,218,909.12
Prepayments made on net gains and losses for the period
Total -2,518,710.91 18,218,909.12
31/12/2018 29/12/2017
A unit
Appropriation
Distribution
Net gains and losses not distributed
Accumulation -2,253,755.52 16,805,553.64
Total -2,253,755.52 16,805,553.64
31/12/2018 29/12/2017
R unit
Appropriation
Distribution
Net gains and losses not distributed
Accumulation -105.45
Total -105.45
31/12/2018 29/12/2017
H unit
Appropriation
Distribution
Net gains and losses not distributed
Accumulation -243,703.49 1,413,355.48
Total -243,703.49 1,413,355.48

FCP HSBC SELECT FLEXIBLE
Annual report for the year ended 31/12/2018 44
31/12/2018 29/12/2017
B unit
Appropriation
Distribution
Net gains and losses not distributed
Accumulation -21,146.45
Total -21,146.45

FCP HSBC SELECT FLEXIBLE
Annual report for the year ended 31/12/2018 45
EARNINGS AND OTHER CHARACTERISTIC FEATURES OF THE ENTITY DURING THE LAST FIVE FISCAL YEARS
31/12/2014 31/12/2015 30/12/2016 29/12/2017 31/12/2018
Total net assets in EUR 130,206,907.58 294,709,748.22 308,849,625.86 322,111,604.08 231,520,492.48
HSBC SELECT FLEXIBLE A
Net assets in EUR 130,206,907.58 284,608,234.43 284,171,518.58 297,034,867.12 206,448,203.02
Number of securities 1,633,976.7000 3,504,696.4800 3,365,129.0178 3,438,261.2296 2,631,839.1997
Net asset value per unit in EUR 79.68 81.20 84.44 86.39 78.44
Unit accumulation on net gains and losses in EUR
7.68 1.87 -0.17 4.88 -0.85
Unit accumulation in EUR on earnings
-0.71 -0.78 -0.67 -0.30 -0.72
HSBC SELECT FLEXIBLE R
Net assets in EUR 16,083.03
Number of securities 17.5790
Net asset value per unit in EUR 914.90
Unit accumulation on net gains and losses in EUR
-5.99
Unit accumulation in EUR on earnings
1.25
HSBC SELECT FLEXIBLE H
Net assets in EUR 10,101,513.79 24,678,107.28 25,076,736.96 22,351,543.47
Number of securities 101.1000 236.1000 233.1000 227.4445
Net asset value per unit in EUR 99,916.06 104,523.96 107,579.30 98,272.51
Unit accumulation on net gains and losses in EUR
-2,363.88 -204.95 6,063.30 -1,071.48
Unit accumulation in EUR
on earnings
-217.64 -242.17 262.30 -272.68
HSBC SELECT FLEXIBLE B
Net assets in EUR 2,704,662.96
Number of securities 29,360.7696
Net asset value per unit in EUR 92.11
Unit accumulation on net gains and losses in EUR
-0.72
Unit accumulation in EUR on earnings
-0.18
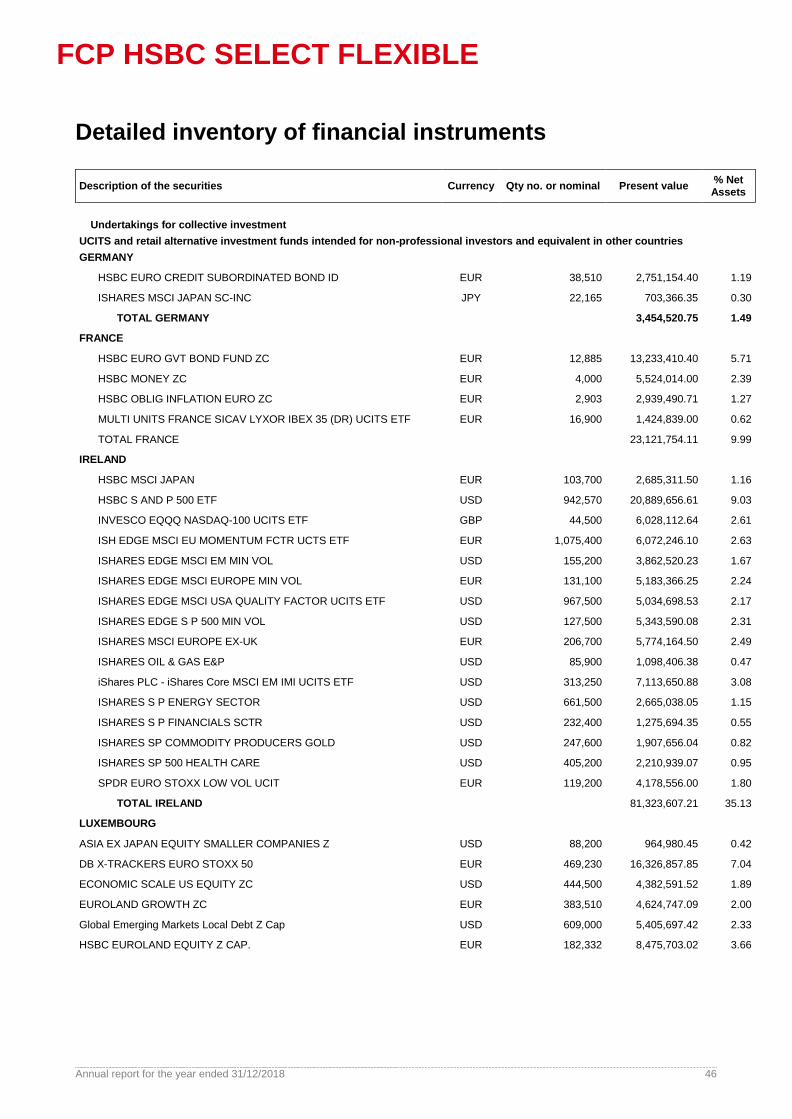
FCP HSBC SELECT FLEXIBLE
Annual report for the year ended 31/12/2018 46
Detailed inventory of financial instruments
Description of the securities Currency Qty no. or nominal Present value % Net Assets
Undertakings for collective investment
UCITS and retail alternative investment funds intended for non-professional investors and equivalent in other countries
GERMANY
HSBC EURO CREDIT SUBORDINATED BOND ID EUR 38,510 2,751,154.40 1.19
ISHARES MSCI JAPAN SC-INC JPY 22,165 703,366.35 0.30
TOTAL GERMANY 3,454,520.75 1.49
FRANCE
HSBC EURO GVT BOND FUND ZC EUR 12,885 13,233,410.40 5.71
HSBC MONEY ZC EUR 4,000 5,524,014.00 2.39
HSBC OBLIG INFLATION EURO ZC EUR 2,903 2,939,490.71 1.27
MULTI UNITS FRANCE SICAV LYXOR IBEX 35 (DR) UCITS ETF EUR 16,900 1,424,839.00 0.62
TOTAL FRANCE 23,121,754.11 9.99
IRELAND
HSBC MSCI JAPAN EUR 103,700 2,685,311.50 1.16
HSBC S AND P 500 ETF USD 942,570 20,889,656.61 9.03
INVESCO EQQQ NASDAQ-100 UCITS ETF GBP 44,500 6,028,112.64 2.61
ISH EDGE MSCI EU MOMENTUM FCTR UCTS ETF EUR 1,075,400 6,072,246.10 2.63
ISHARES EDGE MSCI EM MIN VOL USD 155,200 3,862,520.23 1.67
ISHARES EDGE MSCI EUROPE MIN VOL EUR 131,100 5,183,366.25 2.24
ISHARES EDGE MSCI USA QUALITY FACTOR UCITS ETF USD 967,500 5,034,698.53 2.17
ISHARES EDGE S P 500 MIN VOL USD 127,500 5,343,590.08 2.31
ISHARES MSCI EUROPE EX-UK EUR 206,700 5,774,164.50 2.49
ISHARES OIL & GAS E&P USD 85,900 1,098,406.38 0.47
iShares PLC - iShares Core MSCI EM IMI UCITS ETF USD 313,250 7,113,650.88 3.08
ISHARES S P ENERGY SECTOR USD 661,500 2,665,038.05 1.15
ISHARES S P FINANCIALS SCTR USD 232,400 1,275,694.35 0.55
ISHARES SP COMMODITY PRODUCERS GOLD USD 247,600 1,907,656.04 0.82
ISHARES SP 500 HEALTH CARE USD 405,200 2,210,939.07 0.95
SPDR EURO STOXX LOW VOL UCIT EUR 119,200 4,178,556.00 1.80
TOTAL IRELAND 81,323,607.21 35.13
LUXEMBOURG
ASIA EX JAPAN EQUITY SMALLER COMPANIES Z USD 88,200 964,980.45 0.42
DB X-TRACKERS EURO STOXX 50 EUR 469,230 16,326,857.85 7.04
ECONOMIC SCALE US EQUITY ZC USD 444,500 4,382,591.52 1.89
EUROLAND GROWTH ZC EUR 383,510 4,624,747.09 2.00
Global Emerging Markets Local Debt Z Cap USD 609,000 5,405,697.42 2.33
HSBC EUROLAND EQUITY Z CAP. EUR 182,332 8,475,703.02 3.66
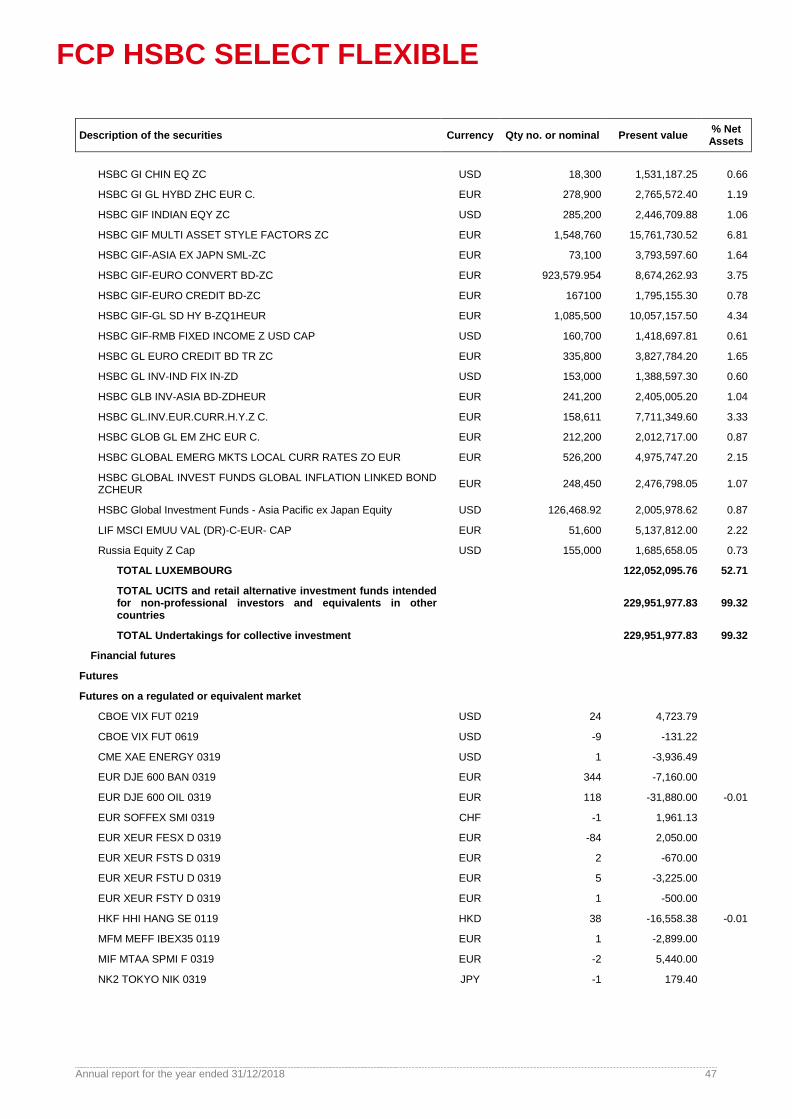
FCP HSBC SELECT FLEXIBLE
Annual report for the year ended 31/12/2018 47
Description of the securities Currency Qty no. or nominal Present value % Net Assets
HSBC GI CHIN EQ ZC USD 18,300 1,531,187.25 0.66
HSBC GI GL HYBD ZHC EUR C. EUR 278,900 2,765,572.40 1.19
HSBC GIF INDIAN EQY ZC USD 285,200 2,446,709.88 1.06
HSBC GIF MULTI ASSET STYLE FACTORS ZC EUR 1,548,760 15,761,730.52 6.81
HSBC GIF-ASIA EX JAPN SML-ZC EUR 73,100 3,793,597.60 1.64
HSBC GIF-EURO CONVERT BD-ZC EUR 923,579.954 8,674,262.93 3.75
HSBC GIF-EURO CREDIT BD-ZC EUR 167100 1,795,155.30 0.78
HSBC GIF-GL SD HY B-ZQ1HEUR EUR 1,085,500 10,057,157.50 4.34
HSBC GIF-RMB FIXED INCOME Z USD CAP USD 160,700 1,418,697.81 0.61
HSBC GL EURO CREDIT BD TR ZC EUR 335,800 3,827,784.20 1.65
HSBC GL INV-IND FIX IN-ZD USD 153,000 1,388,597.30 0.60
HSBC GLB INV-ASIA BD-ZDHEUR EUR 241,200 2,405,005.20 1.04
HSBC GL.INV.EUR.CURR.H.Y.Z C. EUR 158,611 7,711,349.60 3.33
HSBC GLOB GL EM ZHC EUR C. EUR 212,200 2,012,717.00 0.87
HSBC GLOBAL EMERG MKTS LOCAL CURR RATES ZO EUR EUR 526,200 4,975,747.20 2.15
HSBC GLOBAL INVEST FUNDS GLOBAL INFLATION LINKED BOND ZCHEUR
EUR 248,450 2,476,798.05 1.07
HSBC Global Investment Funds - Asia Pacific ex Japan Equity USD 126,468.92 2,005,978.62 0.87
LIF MSCI EMUU VAL (DR)-C-EUR- CAP EUR 51,600 5,137,812.00 2.22
Russia Equity Z Cap USD 155,000 1,685,658.05 0.73
TOTAL LUXEMBOURG 122,052,095.76 52.71
TOTAL UCITS and retail alternative investment funds intended for non-professional investors and equivalents in other countries
229,951,977.83 99.32
TOTAL Undertakings for collective investment 229,951,977.83 99.32
Financial futures
Futures
Futures on a regulated or equivalent market
CBOE VIX FUT 0219 USD 24 4,723.79
CBOE VIX FUT 0619 USD -9 -131.22
CME XAE ENERGY 0319 USD 1 -3,936.49
EUR DJE 600 BAN 0319 EUR 344 -7,160.00
EUR DJE 600 OIL 0319 EUR 118 -31,880.00 -0.01
EUR SOFFEX SMI 0319 CHF -1 1,961.13
EUR XEUR FESX D 0319 EUR -84 2,050.00
EUR XEUR FSTS D 0319 EUR 2 -670.00
EUR XEUR FSTU D 0319 EUR 5 -3,225.00
EUR XEUR FSTY D 0319 EUR 1 -500.00
HKF HHI HANG SE 0119 HKD 38 -16,558.38 -0.01
MFM MEFF IBEX35 0119 EUR 1 -2,899.00
MIF MTAA SPMI F 0319 EUR -2 5,440.00
NK2 TOKYO NIK 0319 JPY -1 179.40

FCP HSBC SELECT FLEXIBLE
Annual report for the year ended 31/12/2018 48
Description of the securities Currency Qty no. or
nominal Present value
% Net assets
NQ USA NASDAQ 0319 USD 19 -6,622.05
NYS NYL MSCI EM 0319 USD 72 -15,037.40 -0.01
SP E-MINI HEA 0319 USD 1 -2,221.93
SP 500 MINI 0319 USD 12 1,154.70
TY CBOT YST 1 0319 USD 42 38,121.10 0.02
XATH ASEFTSE 0119 EUR 10 -1,560.00
XEUR FDAX DAX 0319 EUR -3 -2,660.71
XEUR FGBL BUN 0319 EUR 28 -2,900.00
XPAR FCE CAC 0119 EUR 52 4,170.00
Z UKX - LOND 0319 GBP 2 -2,161.44
TOTAL Futures on a regulated market -42,323.50 -0.01
TOTAL Futures -42,323.50 -0.01
Conditional commitments
Conditional commitments on a regulated or equivalent market
DJ EURO STOXX 50 01/2019 PUT 2900 EUR -117 -38,493.00 -0.02
TOTAL Conditional commitments on a regulated market -38,493.00 -0.02
TOTAL Conditional commitments -38,493.00 -0.02
TOTAL Financial futures -80,816.50 -0.03
Margin call
Margin calls C.A.Indo in Hong Kong $ HKD 148,200 16,558.38 0.01
Margin calls C.A.Indo in £ sterling GBP 1,940 2,161.44
Margin calls C.A.Indo in US$ USD -13,803.24 -12,074.74 -0.01
C.A.Indo margin calls in CHF CHF -2,210 -1,961.13
Margin calls C.A.Indo in euros EUR 41,739.71 41,739.71 0.02
C.A.Indo margin calls in yen JPY -22,500 -179.40
TOTAL Margin call 46,244.26 0.02
Receivables 2,927,368.36 1.26
Payables -4,030,501.24 -1.74
Financial accounts 2,706,219.77 1.17
Net assets 231,520,492.48 100.00
HSBC SELECT FLEXIBLE R EUR 17.5790 914.90
HSBC SELECT FLEXIBLE A EUR 2,631,839.1997 78.44
HSBC SELECT FLEXIBLE H EUR 227.4445 98,272.51
HSBC SELECT FLEXIBLE B EUR 29,360.7696 92.11
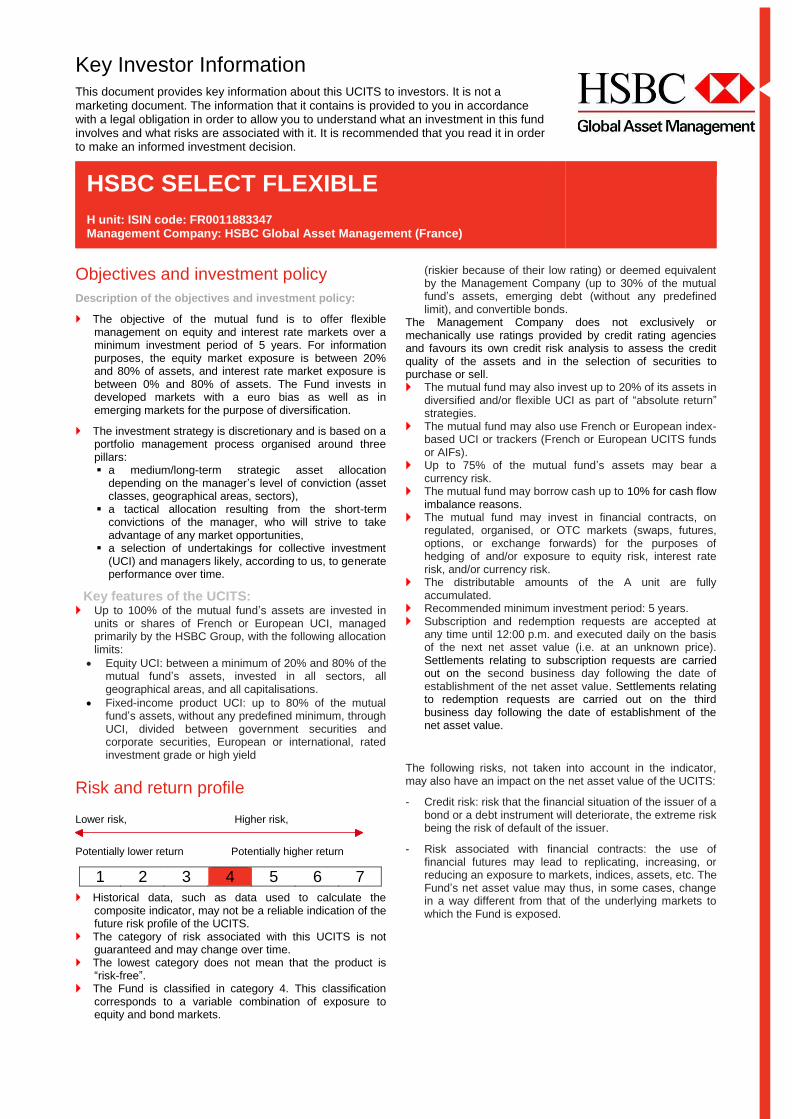
Key Investor Information This document provides key information about this UCITS to investors. It is not a marketing document. The information that it contains is provided to you in accordance with a legal obligation in order to allow you to understand what an investment in this fund involves and what risks are associated with it. It is recommended that you read it in order to make an informed investment decision.
HSBC SELECT FLEXIBLE
H unit: ISIN code: FR0011883347 Management Company: HSBC Global Asset Management (France)
Objectives and investment policy
Description of the objectives and investment policy:
The objective of the mutual fund is to offer flexible management on equity and interest rate markets over a minimum investment period of 5 years. For information purposes, the equity market exposure is between 20% and 80% of assets, and interest rate market exposure is between 0% and 80% of assets. The Fund invests in developed markets with a euro bias as well as in emerging markets for the purpose of diversification.
The investment strategy is discretionary and is based on a portfolio management process organised around three pillars: a medium/long-term strategic asset allocation
depending on the manager’s level of conviction (asset classes, geographical areas, sectors),
a tactical allocation resulting from the short-term convictions of the manager, who will strive to take advantage of any market opportunities,
a selection of undertakings for collective investment (UCI) and managers likely, according to us, to generate performance over time.
Key features of the UCITS: Up to 100% of the mutual fund’s assets are invested in
units or shares of French or European UCI, managed primarily by the HSBC Group, with the following allocation limits:
Equity UCI: between a minimum of 20% and 80% of the mutual fund’s assets, invested in all sectors, all geographical areas, and all capitalisations.
Fixed-income product UCI: up to 80% of the mutual fund’s assets, without any predefined minimum, through UCI, divided between government securities and corporate securities, European or international, rated investment grade or high yield
(riskier because of their low rating) or deemed equivalent by the Management Company (up to 30% of the mutual fund’s assets, emerging debt (without any predefined limit), and convertible bonds.
The Management Company does not exclusively or mechanically use ratings provided by credit rating agencies and favours its own credit risk analysis to assess the credit quality of the assets and in the selection of securities to purchase or sell. The mutual fund may also invest up to 20% of its assets in
diversified and/or flexible UCI as part of “absolute return” strategies.
The mutual fund may also use French or European index-based UCI or trackers (French or European UCITS funds or AIFs).
Up to 75% of the mutual fund’s assets may bear a currency risk.
The mutual fund may borrow cash up to 10% for cash flow imbalance reasons.
The mutual fund may invest in financial contracts, on regulated, organised, or OTC markets (swaps, futures, options, or exchange forwards) for the purposes of hedging of and/or exposure to equity risk, interest rate risk, and/or currency risk.
The distributable amounts of the A unit are fully accumulated.
Recommended minimum investment period: 5 years. Subscription and redemption requests are accepted at
any time until 12:00 p.m. and executed daily on the basis of the next net asset value (i.e. at an unknown price). Settlements relating to subscription requests are carried out on the second business day following the date of establishment of the net asset value. Settlements relating to redemption requests are carried out on the third business day following the date of establishment of the net asset value.
Risk and return profile
Lower risk, Higher risk,
Potentially lower return
Potentially higher return
1 2 3 4 5 6 7
Historical data, such as data used to calculate the composite indicator, may not be a reliable indication of the future risk profile of the UCITS.
The category of risk associated with this UCITS is not guaranteed and may change over time.
The lowest category does not mean that the product is “risk-free”.
The Fund is classified in category 4. This classification corresponds to a variable combination of exposure to equity and bond markets.
The following risks, not taken into account in the indicator, may also have an impact on the net asset value of the UCITS:
- Credit risk: risk that the financial situation of the issuer of a bond or a debt instrument will deteriorate, the extreme risk being the risk of default of the issuer.
- Risk associated with financial contracts: the use of financial futures may lead to replicating, increasing, or reducing an exposure to markets, indices, assets, etc. The Fund’s net asset value may thus, in some cases, change in a way different from that of the underlying markets to which the Fund is exposed.
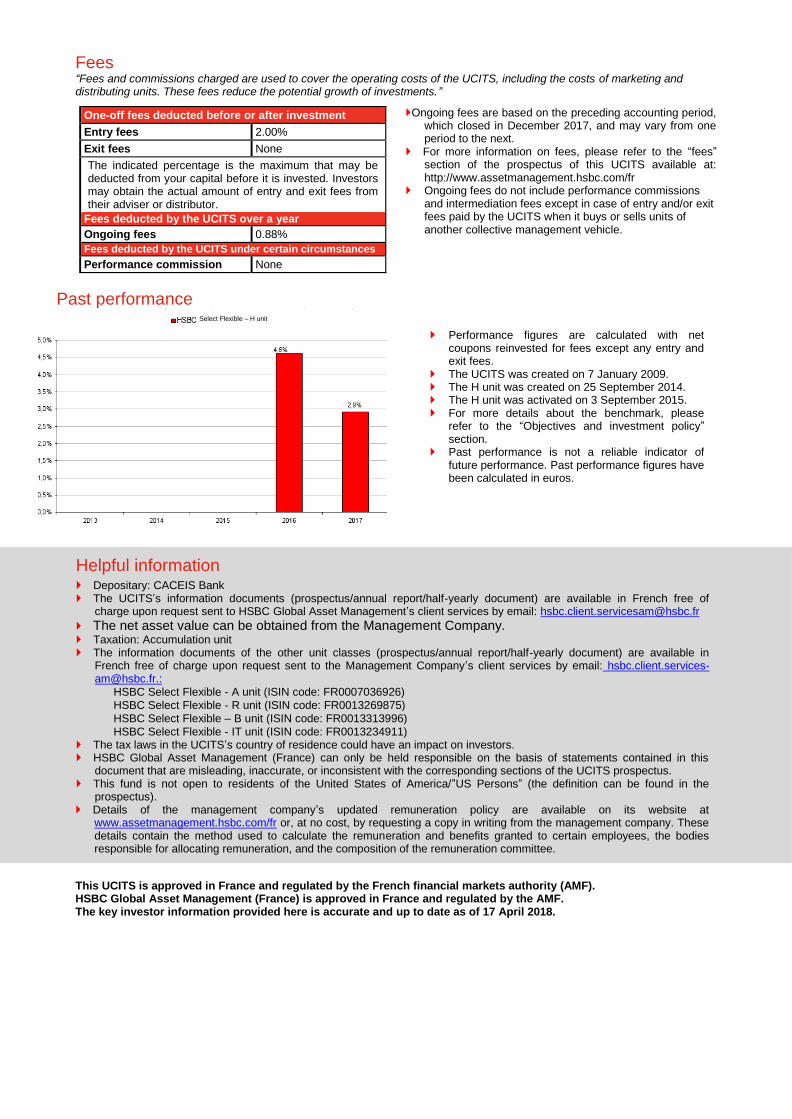
Fees “Fees and commissions charged are used to cover the operating costs of the UCITS, including the costs of marketing and distributing units. These fees reduce the potential growth of investments.”
One-off fees deducted before or after investment
Entry fees 2.00%
Exit fees None
The indicated percentage is the maximum that may be deducted from your capital before it is invested. Investors may obtain the actual amount of entry and exit fees from their adviser or distributor.
Fees deducted by the UCITS over a year
Ongoing fees 0.88%
Fees deducted by the UCITS under certain circumstances
Performance commission None
Ongoing fees are based on the preceding accounting period, which closed in December 2017, and may vary from one period to the next.
For more information on fees, please refer to the “fees” section of the prospectus of this UCITS available at: http://www.assetmanagement.hsbc.com/fr
Ongoing fees do not include performance commissions and intermediation fees except in case of entry and/or exit fees paid by the UCITS when it buys or sells units of another collective management vehicle.
Past performance
Performance figures are calculated with net coupons reinvested for fees except any entry and exit fees.
The UCITS was created on 7 January 2009. The H unit was created on 25 September 2014. The H unit was activated on 3 September 2015. For more details about the benchmark, please
refer to the “Objectives and investment policy” section.
Past performance is not a reliable indicator of future performance. Past performance figures have been calculated in euros.
Helpful information Depositary: CACEIS Bank The UCITS’s information documents (prospectus/annual report/half-yearly document) are available in French free of
charge upon request sent to HSBC Global Asset Management’s client services by email: [email protected]
The net asset value can be obtained from the Management Company. Taxation: Accumulation unit The information documents of the other unit classes (prospectus/annual report/half-yearly document) are available in
French free of charge upon request sent to the Management Company’s client services by email: [email protected].:
HSBC Select Flexible - A unit (ISIN code: FR0007036926) HSBC Select Flexible - R unit (ISIN code: FR0013269875) HSBC Select Flexible – B unit (ISIN code: FR0013313996) HSBC Select Flexible - IT unit (ISIN code: FR0013234911)
The tax laws in the UCITS’s country of residence could have an impact on investors. HSBC Global Asset Management (France) can only be held responsible on the basis of statements contained in this
document that are misleading, inaccurate, or inconsistent with the corresponding sections of the UCITS prospectus. This fund is not open to residents of the United States of America/”US Persons” (the definition can be found in the
prospectus). Details of the management company’s updated remuneration policy are available on its website at
www.assetmanagement.hsbc.com/fr or, at no cost, by requesting a copy in writing from the management company. These details contain the method used to calculate the remuneration and benefits granted to certain employees, the bodies responsible for allocating remuneration, and the composition of the remuneration committee.
This UCITS is approved in France and regulated by the French financial markets authority (AMF). HSBC Global Asset Management (France) is approved in France and regulated by the AMF. The key investor information provided here is accurate and up to date as of 17 April 2018.
Select Flexible – H unit
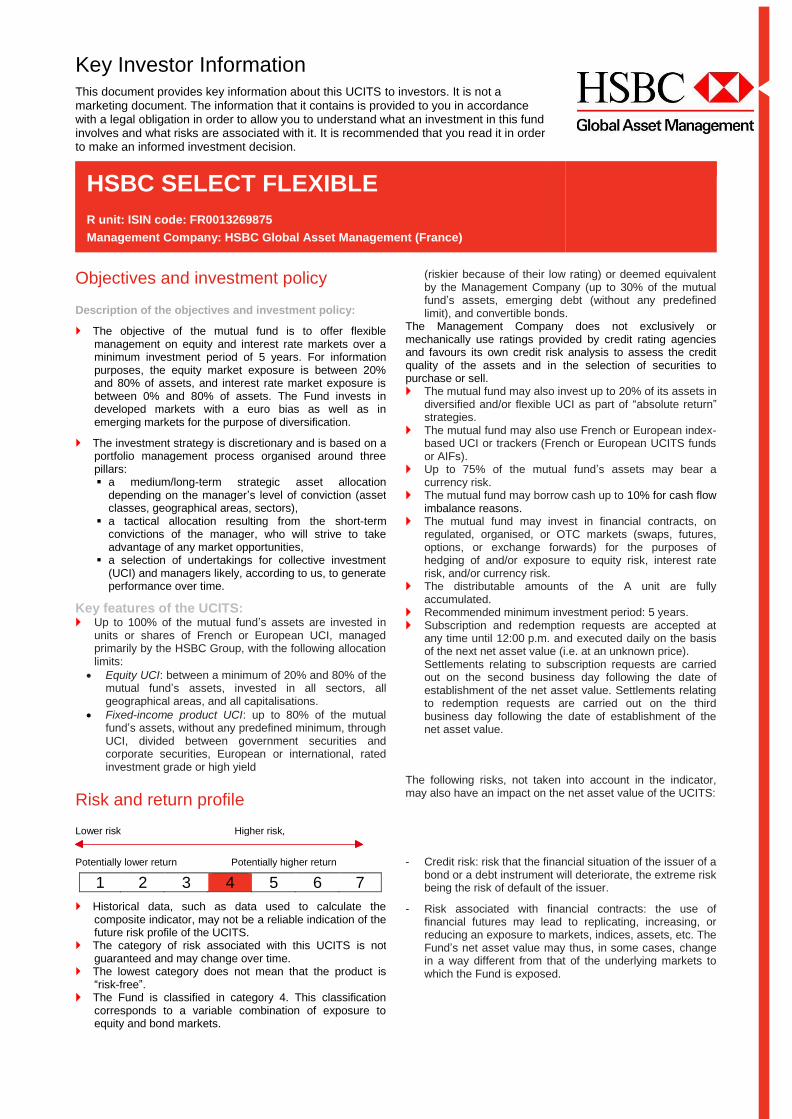
Key Investor Information This document provides key information about this UCITS to investors. It is not a marketing document. The information that it contains is provided to you in accordance with a legal obligation in order to allow you to understand what an investment in this fund involves and what risks are associated with it. It is recommended that you read it in order to make an informed investment decision.
HSBC SELECT FLEXIBLE
R unit: ISIN code: FR0013269875
Management Company: HSBC Global Asset Management (France)
Objectives and investment policy
Description of the objectives and investment policy:
The objective of the mutual fund is to offer flexible management on equity and interest rate markets over a minimum investment period of 5 years. For information purposes, the equity market exposure is between 20% and 80% of assets, and interest rate market exposure is between 0% and 80% of assets. The Fund invests in developed markets with a euro bias as well as in emerging markets for the purpose of diversification.
The investment strategy is discretionary and is based on a portfolio management process organised around three pillars: a medium/long-term strategic asset allocation
depending on the manager’s level of conviction (asset classes, geographical areas, sectors),
a tactical allocation resulting from the short-term convictions of the manager, who will strive to take advantage of any market opportunities,
a selection of undertakings for collective investment (UCI) and managers likely, according to us, to generate performance over time.
Key features of the UCITS: Up to 100% of the mutual fund’s assets are invested in
units or shares of French or European UCI, managed primarily by the HSBC Group, with the following allocation limits:
Equity UCI: between a minimum of 20% and 80% of the mutual fund’s assets, invested in all sectors, all geographical areas, and all capitalisations.
Fixed-income product UCI: up to 80% of the mutual fund’s assets, without any predefined minimum, through UCI, divided between government securities and corporate securities, European or international, rated investment grade or high yield
(riskier because of their low rating) or deemed equivalent by the Management Company (up to 30% of the mutual fund’s assets, emerging debt (without any predefined limit), and convertible bonds.
The Management Company does not exclusively or mechanically use ratings provided by credit rating agencies and favours its own credit risk analysis to assess the credit quality of the assets and in the selection of securities to purchase or sell. The mutual fund may also invest up to 20% of its assets in
diversified and/or flexible UCI as part of “absolute return” strategies.
The mutual fund may also use French or European index-based UCI or trackers (French or European UCITS funds or AIFs).
Up to 75% of the mutual fund’s assets may bear a currency risk.
The mutual fund may borrow cash up to 10% for cash flow imbalance reasons.
The mutual fund may invest in financial contracts, on regulated, organised, or OTC markets (swaps, futures, options, or exchange forwards) for the purposes of hedging of and/or exposure to equity risk, interest rate risk, and/or currency risk.
The distributable amounts of the A unit are fully accumulated.
Recommended minimum investment period: 5 years. Subscription and redemption requests are accepted at
any time until 12:00 p.m. and executed daily on the basis of the next net asset value (i.e. at an unknown price). Settlements relating to subscription requests are carried out on the second business day following the date of establishment of the net asset value. Settlements relating to redemption requests are carried out on the third business day following the date of establishment of the net asset value.
Risk and return profile
Lower risk Higher risk,
Potentially lower return Potentially higher return
1 2 3 4 5 6 7
Historical data, such as data used to calculate the composite indicator, may not be a reliable indication of the future risk profile of the UCITS.
The category of risk associated with this UCITS is not guaranteed and may change over time.
The lowest category does not mean that the product is “risk-free”.
The Fund is classified in category 4. This classification corresponds to a variable combination of exposure to equity and bond markets.
The following risks, not taken into account in the indicator, may also have an impact on the net asset value of the UCITS:
- Credit risk: risk that the financial situation of the issuer of a bond or a debt instrument will deteriorate, the extreme risk being the risk of default of the issuer.
- Risk associated with financial contracts: the use of financial futures may lead to replicating, increasing, or reducing an exposure to markets, indices, assets, etc. The Fund’s net asset value may thus, in some cases, change in a way different from that of the underlying markets to which the Fund is exposed.

Fees “Fees and commissions charged are used to cover the operating costs of the UCITS, including the costs of marketing and distributing units. These fees reduce the potential growth of investments.”
One-off fees deducted before or after investment
Entry fees 6% maximum (*)
Exit fees None
The indicated percentage is the maximum that may be deducted from your capital before it is invested. Investors may obtain the actual amount of entry and exit fees from their adviser or distributor.
Fees deducted by the UCITS over a year
Ongoing fees 0.61%
Fees deducted by the UCITS under certain circumstances
Performance commission None
Ongoing fees are based on an estimate of the maximum that will be deducted. This percentage may vary from one year to the next.
For more information on fees, please refer to the “fees” section of the prospectus of this UCITS available at: http://www.assetmanagement.hsbc.com/fr
Ongoing fees do not include performance commissions and intermediation fees except in case of entry and/or exit fees paid by the UCITS when it buys or sells units of another collective management vehicle.
(*) with the exception of UCIs and HSBC Global Asset Management (France) mandates
Past performance
Too little data is available to provide investors with useful indications on past performance.
Performance figures are calculated with net
coupons reinvested for fees except any entry and exit fees.
The UCITS was created on 7 January 2009. The R unit was created on 1 August 2017. For more details about the benchmark, please
refer to the “Objectives and investment policy” section.
Past performance is not a reliable indicator of future performance. Past performance figures have been calculated in euros.
Helpful information Depositary: CACEIS Bank The UCITS’s information documents (prospectus/annual report/half-yearly document) are available in French free of
charge upon request sent to HSBC Global Asset Management’s client services by email: [email protected]
The net asset value can be obtained from the Management Company. Taxation: Accumulation unit The information documents for other unit classes (prospectus / annual report / half-yearly document) are available in
French free of charge upon request sent to the Management Company’s client services by email: [email protected]
HSBC Select Flexible - A unit (ISIN code: FR0007036926)
HSBC Select Flexible - A unit (ISIN code: FR0011883347) HSBC Select Flexible – B unit (ISIN code: FR0013313996) HSBC Select Flexible - IT unit (ISIN code: FR0013234911)
The tax laws in the UCITS’s country of residence could have an impact on investors. HSBC Global Asset Management (France) can only be held responsible on the basis of statements contained in this
document that are misleading, inaccurate, or inconsistent with the corresponding sections of the UCITS prospectus. This fund is not open to residents of the United States of America/”US Persons” (the definition can be found in the
prospectus). Details of the management company’s updated remuneration policy are available on its website at
www.assetmanagement.hsbc.com/fr or, at no cost, by requesting a copy in writing from the Management Company. These details contain the method used to calculate the remuneration and benefits granted to certain employees, the bodies responsible for allocating remuneration, and the composition of the remuneration committee.
This UCITS is approved in France and regulated by the French financial markets authority (AMF). HSBC Global Asset Management (France) is approved in France and regulated by the AMF. The key investor information provided here is accurate and up to date as of 9 February 2018.

Key Investor Information This document provides key information about this UCITS to investors. It is not a marketing document. The information that it contains is provided to you in accordance with a legal obligation in order to allow you to understand what an investment in this fund involves and what risks are associated with it. It is recommended that you read it in order to make an informed investment decision.
HSBC SELECT FLEXIBLE
B unit: ISIN code: FR0013313996
Management Company: HSBC Global Asset Management (France)
Objectives and investment policy
Description of the objectives and investment policy:
The objective of the mutual fund is to offer flexible management on equity and interest rate markets over a minimum investment period of 5 years. For information purposes, the equity market exposure is between 20% and 80% of assets, and interest rate market exposure is between 0% and 80% of assets. The Fund invests in developed markets with a euro bias as well as in emerging markets for the purpose of diversification.
The investment strategy is discretionary and is based on a portfolio management process organised around three pillars: a medium/long-term strategic asset allocation
depending on the manager’s level of conviction (asset classes, geographical areas, sectors),
a tactical allocation resulting from the short-term convictions of the manager, who will strive to take advantage of any market opportunities,
a selection of undertakings for collective investment (UCI) and managers likely, according to us, to generate performance over time.
Key features of the UCITS: Up to 100% of the mutual fund’s assets are invested in
units or shares of French or European UCI, managed primarily by the HSBC Group, with the following allocation limits:
Equity UCI: between a minimum of 20% and 80% of the mutual fund’s assets, invested in all sectors, all geographical areas, and all capitalisations.
Fixed-income product UCI: up to 80% of the mutual fund’s assets, without any predefined minimum, through UCI, divided between government securities and corporate securities, European or international, rated investment grade or high yield
(riskier because of their low rating) or deemed equivalent by the Management Company, emerging debt (without any predefined limit), and convertible bonds.
The Management Company does not exclusively or mechanically use ratings provided by credit rating agencies and favours its own credit risk analysis to assess the credit quality of the assets and in the selection of securities to purchase or sell. The mutual fund may also invest up to 20% of its assets in
diversified and/or flexible UCI as part of “absolute return” strategies.
The mutual fund may also use French or European index-based UCI or trackers (French or European UCITS funds or AIFs).
Up to 75% of the mutual fund’s assets may bear a currency risk.
The mutual fund may borrow cash up to 10% for cash flow imbalance reasons.
The mutual fund may invest in financial contracts, on regulated, organised, or OTC markets (swaps, futures, options, or exchange forwards) for the purposes of hedging of and/or exposure to equity risk, interest rate risk, and/or currency risk.
The distributable amounts of the A unit are fully accumulated.
Recommended minimum investment period: 5 years. Subscription and redemption requests are accepted at
any time until 12:00 p.m. and executed daily on the basis of the next net asset value (i.e. at an unknown price). Settlements relating to subscription requests are carried out on the second business day following the date of establishment of the net asset value. Settlements relating to redemption requests are carried out on the third business day following the date of establishment of the net asset value.
Risk and return profile
Lower risk Higher risk,
Potentially lower return Potentially higher return
1 2 3 4 5 6 7
Historical data, such as data used to calculate the composite indicator, may not be a reliable indication of the future risk profile of the UCITS.
The category of risk associated with this UCITS is not guaranteed and may change over time.
The lowest category does not mean that the investment is “risk-free”.
The Fund is classified in category 4. This classification corresponds to a variable combination of exposure to equity and bond markets.
The following risks, not taken into account in the indicator, may also have an impact on the net asset value of the UCITS:
- Credit risk: risk that the financial situation of the issuer of a bond or a debt instrument will deteriorate, the extreme risk being the risk of default of the issuer.
- Risk associated with financial contracts: the use of financial futures may lead to replicating, increasing, or reducing an exposure to markets, indices, assets, etc. The Fund’s net asset value may thus, in some cases, change in a way different from that of the underlying markets to which the Fund is exposed.

Fees “Fees and commissions charged are used to cover the operating costs of the UCITS, including the costs of marketing and distributing units. These fees reduce the potential growth of investments.”
One-off fees deducted before or after investment
Entry fees 2% maximum
Exit fees None
The indicated percentage is the maximum that may be deducted from your capital before it is invested. Investors may obtain the actual amount of entry and exit fees from their adviser or distributor.
Fees deducted by the UCITS over a year
Ongoing fees 0.90%
Fees deducted by the UCITS under certain circumstances
Performance commission None
Ongoing fees are based on an estimate of the maximum that will be deducted. This percentage may vary from one year to the next.
For more information on fees, please refer to the “fees” section of the prospectus of this UCITS available at: http://www.assetmanagement.hsbc.com/fr
Ongoing fees do not include performance commissions and intermediation fees except in case of entry and/or exit fees paid by the UCITS when it buys or sells units of another collective management vehicle.
Past performance
Too little data is available to provide investors with useful indications on past performance.
Performance figures are calculated with net coupons reinvested for fees except any entry and exit fees.
The UCITS was created on 7 January 2009. The B unit was created on 9 February 2018. For more details about the benchmark, please
refer to the “Objectives and investment policy” section.
Past performance is not a reliable indicator of future performance. Past performance figures have been calculated in euros.
Helpful information Depositary: CACEIS Bank The UCITS’s information documents (prospectus/annual report/half-yearly document) are available in French free of
charge upon request sent to HSBC Global Asset Management’s client services by email: [email protected]
The net asset value can be obtained from the Management Company. Taxation: Accumulation unit The information documents for other unit classes (prospectus / annual report / half-yearly document) are available in
French free of charge upon request sent to the Management Company’s client services by email: [email protected]
HSBC Select Flexible - A unit (ISIN code: FR0007036926) HSBC Select Flexible - A unit (ISIN code: FR0011883347) HSBC Select Flexible - R unit (ISIN code: FR0013269875) HSBC Select Flexible - IT unit (ISIN code: FR0013234911)
The tax laws in the UCITS’s country of residence could have an impact on investors. HSBC Global Asset Management (France) can only be held responsible on the basis of statements contained in this
document that are misleading, inaccurate, or inconsistent with the corresponding sections of the UCITS prospectus. This fund is not open to residents of the United States of America/”US Persons” (the definition can be found in the
prospectus). Details of the management company’s updated remuneration policy are available on its website at
www.assetmanagement.hsbc.com/fr or, at no cost, by requesting a copy in writing from the Management Company. These details contain the method used to calculate the remuneration and benefits granted to certain employees, the bodies responsible for allocating remuneration, and the composition of the remuneration committee.
This UCITS is approved in France and regulated by the French financial markets authority (AMF). HSBC Global Asset Management (France) is approved in France and regulated by the AMF. The key investor information provided here is accurate and up to date as of 9 February 2018.
Key Investor Information This document provides key information about this UCITS to investors. It is not a marketing document. The information that it contains is provided to you in accordance with a legal obligation in order to allow you to understand what an investment in this fund involves and what risks are associated with it. It is recommended that you read it in order to make an informed investment decision.
HSBC SELECT FLEXIBLE
IT unit: ISIN code: FR0013234911
Management Company: HSBC Global Asset Management (France)
Objectives and investment policy
Description of the objectives and investment policy:
The objective of the mutual fund is to offer flexible management on equity and interest rate markets over a minimum investment period of 5 years. For information purposes, the equity market exposure is between 20% and 80% of assets, and interest rate market exposure is between 0% and 80% of assets. The Fund invests in developed markets with a euro bias as well as in emerging markets for the purpose of diversification.
The investment strategy is discretionary and is based on a portfolio management process organised around three pillars: a medium/long-term strategic asset allocation
depending on the manager’s level of conviction (asset classes, geographical areas, sectors),
a tactical allocation resulting from the short-term convictions of the manager, who will strive to take advantage of any market opportunities,
a selection of undertakings for collective investment (UCI) and managers likely, according to us, to generate performance over time.
Key features of the UCITS: Up to 100% of the mutual fund’s assets are invested in
units or shares of French or European UCI, managed primarily by the HSBC Group, with the following allocation limits:
Equity UCI: between a minimum of 20% and 80% of the mutual fund’s assets, invested in all sectors, all geographical areas, and all capitalisations.
Fixed-income product UCI: up to 80% of the mutual fund’s assets, without any predefined minimum, through UCI, divided between government securities and corporate securities, European or international, rated investment grade or high yield
(riskier because of their low rating) or deemed equivalent by the Management Company (up to 30% of the mutual fund’s assets, emerging debt (without any predefined limit), and convertible bonds.
The Management Company does not exclusively or mechanically use ratings provided by credit rating agencies and favours its own credit risk analysis to assess the credit quality of the assets and in the selection of securities to purchase or sell. The mutual fund may also invest up to 20% of its assets in
diversified and/or flexible UCI as part of “absolute return” strategies.
The mutual fund may also use French or European index-based UCI or trackers (French or European UCITS funds or AIFs).
Up to 75% of the mutual fund’s assets may bear a currency risk.
The mutual fund may borrow cash up to 10% for cash flow imbalance reasons.
The mutual fund may invest in financial contracts, on regulated, organised, or OTC markets (swaps, futures, options, or exchange forwards) for the purposes of hedging of and/or exposure to equity risk, interest rate risk, and/or currency risk.
The distributable amounts of the A unit are fully accumulated.
Recommended minimum investment period: 5 years. Subscriptions and redemptions are pooled each day by
11:00 a.m. (Paris time) at the latest. They will be executed daily on the basis of the next net asset value calculated using the closing prices on the date of pooling of the requests.
Settlements relating to subscription and redemption requests are carried out on the third business day following the centralisation date.
Risk and return profile
Lower risk Higher risk,
Potentially lower return Potentially higher return
1 2 3 4 5 6 7
Historical data, such as data used to calculate the composite indicator, may not be a reliable indication of the future risk profile of the UCITS.
The category of risk associated with this UCITS is not guaranteed and may change over time.
The lowest category does not mean that the product is “risk-free”.
The Fund is classified in category 4. This classification corresponds to a variable combination of exposure to equity and bond markets.
The following risks, not taken into account in the indicator, may also have an impact on the net asset value of the UCITS:
- Credit risk: risk that the financial situation of the issuer of a bond or a debt instrument will deteriorate, the extreme risk being the risk of default of the issuer.
- Risk associated with financial contracts: the use of financial futures may lead to replicating, increasing, or reducing an exposure to markets, indices, assets, etc. The Fund’s net asset value may thus, in some cases, change in a way different from that of the underlying markets to which the Fund is exposed.
Fees “Fees and commissions charged are used to cover the operating costs of the UCITS, including the costs of marketing and distributing units. These fees reduce the potential growth of investments.”
One-off fees deducted before or after investment
Entry fees None
Exit fees None
The indicated percentage is the maximum that may be deducted from your capital before it is invested. Investors may obtain the actual amount of entry and exit fees from their adviser or distributor.
Fees deducted by the UCITS over a year
Ongoing fees 0.92%
Fees deducted by the UCITS under certain circumstances
Performance commission None
Ongoing fees are based on an estimate of the maximum that will be deducted. This percentage may vary from one year to the next.
For more information on fees, please refer to the “fees” section of the prospectus of this UCITS available at: http://www.assetmanagement.hsbc.com/fr
Ongoing fees do not include performance commissions and intermediation fees except in case of entry and/or exit fees paid by the UCITS when it buys or sells units of another collective management vehicle.
Past performance
Too little data is available to provide investors with useful indications on past performance.
Performance figures are calculated with net coupons
reinvested for fees except any entry and exit fees. The UCITS was created on 7 January 2009. The IT unit was created on 10 February 2017. For more details about the benchmark, please refer to
the “Objectives and investment policy” section. Past performance is not a reliable indicator of future
performance. Past performance figures have been calculated in euros.
Helpful information Depositary: CACEIS Bank The UCITS’s information documents (prospectus/annual report/half-yearly document) are available in French free of
charge upon request sent to HSBC Global Asset Management’s client services by email: [email protected] The net asset value can be obtained from the Management Company. Taxation: Accumulation unit The information documents for other unit classes (prospectus / annual report / half-yearly document) are available in
French free of charge upon request sent to the Management Company’s client services by email: [email protected]
HSBC Select Flexible - A unit (ISIN code: FR0007036926)
HSBC Select Flexible - R unit (ISIN code: FR0013269875) HSBC Select Flexible – B unit (ISIN code: FR0013313996) HSBC Select Flexible - A unit (ISIN code: FR0011883347)
The tax laws in the UCITS’s country of residence could have an impact on investors. HSBC Global Asset Management (France) can only be held responsible on the basis of statements contained in this
document that are misleading, inaccurate, or inconsistent with the corresponding sections of the UCITS prospectus. This fund is not open to residents of the United States of America/”US Persons” (the definition can be found in the
prospectus). Details of the management company’s updated remuneration policy are available on its website at
www.assetmanagement.hsbc.com/fr or, at no cost, by requesting a copy in writing from the Management Company. These details contain the method used to calculate the remuneration and benefits granted to certain employees, the bodies responsible for allocating remuneration, and the composition of the remuneration committee.
This UCITS is approved in France and regulated by the French financial markets authority (AMF). HSBC Global Asset Management (France) is approved in France and regulated by the AMF. The key investor information provided here is accurate and up to date as of 9 February 2018.