fda cytology update g... · 9/1/2010 · 1 fda cytology update. september 1, 2010. marina...
TRANSCRIPT

1
FDA Cytology Update
September 1, 2010
Marina Kondratovich, Ph.D.,Associate Director for Clinical Studies,
OIVD, CDRH, FDA
CLIAC Meeting

2
The Clinical Laboratory Improvement Act of 1988 (CLIA 88) provides that
“individual workload limits must be established by the technical supervisor and based on individual capabilities/performance” and
maximum workload limit for manual screening is 100 slides in no less than an 8-hour day

3
FDA approved two semi-automated screening devices: Hologic’s ThinPrep Imaging System (TIS) for ThinPrep Pap slides and Becton Dickinson Focal Point Guided Screening System (BD) for SurePath Pap slides.
For a Pap slide, TIS imaging algorithm identifies Field of View (FOV) (field of diagnostic interest). Cytotechnologist (CT) reviews the FOV.
-If no abnormality is identified during FOV review andthere are no specimen adequacy limitations, then slide is Negative.
-If abnormal cells or specimen adequacy limitations are identified during FOV review, the CT performs a Full Manual Review (FMR).

4
Each device has its own maximum workload limit (200 slides for TIS and 170 slides for BD) that was determined during the course of clinical studies for evaluation of diagnostic accuracy and workload limits.
It was brought to FDA attention that the current product labeling regarding workload for these two devices has been difficult to interpret resulting in variability and lack of standardization in counting methods.
5
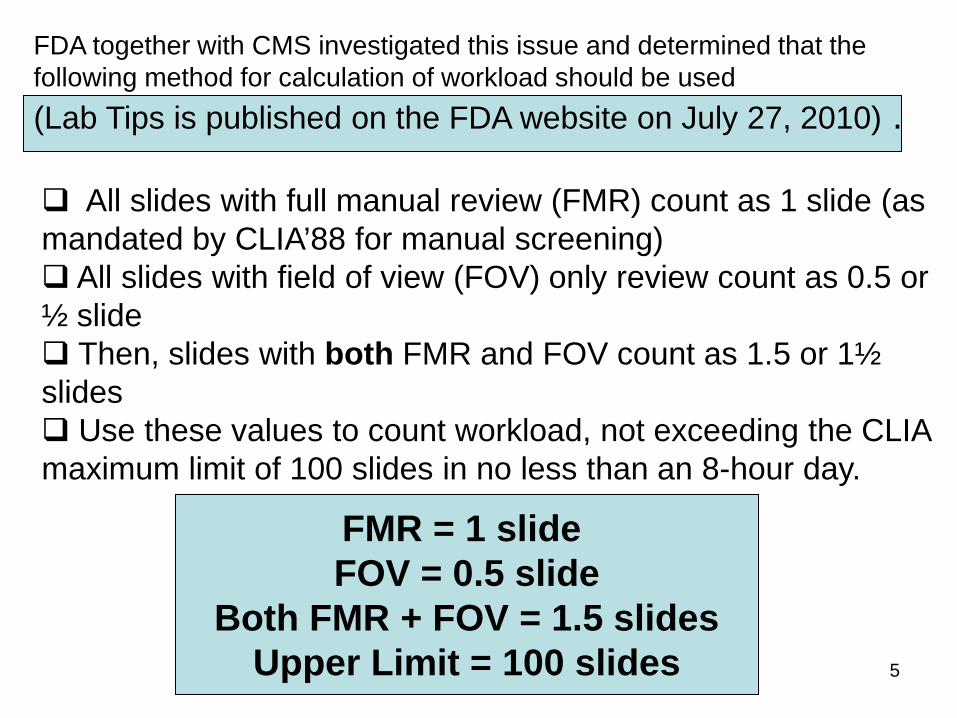
FDA together with CMS investigated this issue and determined that the following method for calculation of workload should be used (Lab Tips is published on the FDA website on July 27, 2010) .
All slides with full manual review (FMR) count as 1 slide (as mandated by CLIA’88 for manual screening) All slides with field of view (FOV) only review count as 0.5 or ½ slide Then, slides with both FMR and FOV count as 1.5 or 1½ slides Use these values to count workload, not exceeding the CLIA maximum limit of 100 slides in no less than an 8-hour day.
FMR = 1 slide FOV = 0.5 slide
Both FMR + FOV = 1.5 slidesUpper Limit = 100 slides

6
Why there were difficulties in interpretation of labeling;
Why approach with counting of slides with weights of 0.5 and 1.5 is safe.

7
Basic Characteristics of Clinical Pivotal Study:
4 cytology laboratories in the US (two CTs at each site)
Accuracy of “Manual” screening was compared to accuracy of screening with TIS;
TIS
Design of Pivotal Clinical Study

8
9,544 slides were reviewed manually Then wash-out period (at least 8 weeks) Then 9,544 slides were reviewed with TIS by the same CT and pathologists
ManualAbnormal Negative
TIS Abnormal 513 254 767Negative 227 8,550 8,777
740 8,804 9,544

9
ManualAbnormal Negative
TIS Abnormal 513 254 767Negative 227 8,550 8,777
740 8,804 9,544
513 slides (abn-abn)254 slides (neg-abn)227 slides (abn-neg)5% of 8,550 (neg-neg)=428 slides
3 Independent Pathologists
(majority rule)
Adjudicated result = “Gold” StandardDiagnostic accuracies of “Manual” and “TIS” were estimated and compared

10
For Manual arm and for TIS arm:
Each day number of slides and number of hours were recorded; a slide was counted as oneslide regardless whether FOV only or in addition FMR
Data for days with number of hours < 4 were deleted from calculations of workload data;
If CT showed a decrease in accuracy, the CT data should be deleted from calculation of the workload data.

11
In the TIS arm of the study, 22% of slides in average were reviewed manually after FOV review
Prevalence of ASC-US+ (by Gold standard)=7.3%Prevalence of LSIL =2.4%;Prevalence of HSIL=1.5%
In the study, • CT reviews only FOV (it does NOT allow to do even a quick check outside of FOVs);• if FOV does not have abnormal findings, CT is NOT allowed to do a full review.
OTHERWISE estimation of TIS accuracy will be BIASED (overestimated).
12
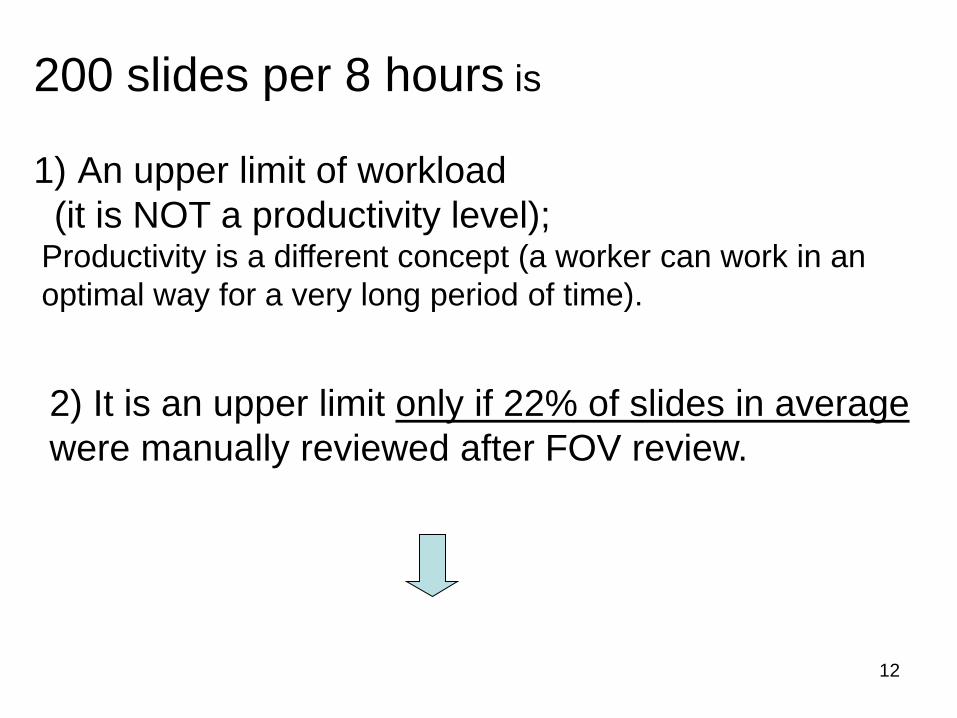
200 slides per 8 hours is
1) An upper limit of workload (it is NOT a productivity level);
Productivity is a different concept (a worker can work in an optimal way for a very long period of time).
2) It is an upper limit only if 22% of slides in averagewere manually reviewed after FOV review.

13
Percent of slides with FMR depends on Prevalence of abnormal slides; Prevalence of UNSAT Lab Policy for full review of slides
(as high risk slides); Skills of CT, Other

14
The upper workload limit can be easily calculated if the percent of slides which require full review is higher than 22%.

15
There is an upper limit of 100 slides for manual review during 8 hours; it means that 100 slides with manual review require at least 480 minutes (60 min * 8 hours). So, each slide with only manual review requires 4.8 min (480/100=4.8).
In the study, 22% of slides in average required manual review. It means that 44 slides in average among 200 slides required manual review.
211.2 minutes (4.8 *44) were spent for these slides.
For 200 FOV, CT has 268.8 minutes (480-211.2)
16
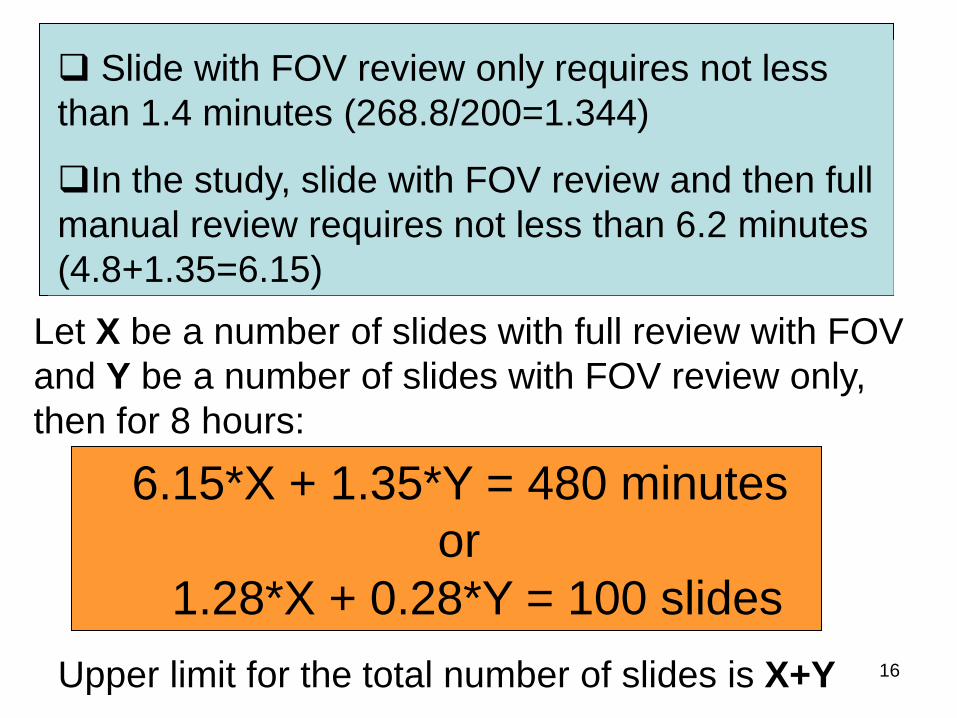
Slide with FOV review only requires not less than 1.4 minutes (268.8/200=1.344)
In the study, slide with FOV review and then full manual review requires not less than 6.2 minutes (4.8+1.35=6.15)
Let X be a number of slides with full review with FOV and Y be a number of slides with FOV review only, then for 8 hours:
Upper limit for the total number of slides is X+Y
6.15*X + 1.35*Y = 480 minutesor
1.28*X + 0.28*Y = 100 slides

17
Example:X=60 - number of slides with manual review with FOV;
60*6.15 +1.35*Y = 480 => Y=82Y=82 – number of slides with FOV review only.
Total number of slides 142 (=60+82)Upper limit of the total number of slides =
142 (not 200)
Normal flow of slides: • Total number=142; • Among them, 42.3% (60/142) are slides with manual review with FOV (not 22%).

18
BD FocalPoint GS Imaging System
Similar study design
Differences Prevalence of ASC-US+ was 14.8% In the study, 31% of slides in average required manual review.Upper limit of workload is 170 slides per 8 hours
19
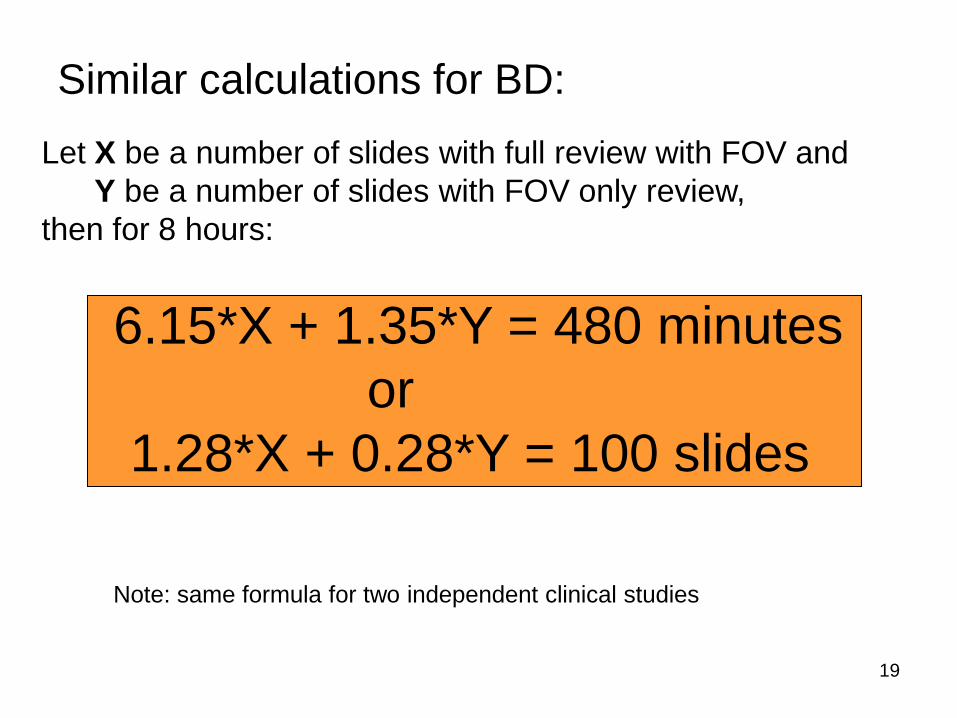
6.15*X + 1.35*Y = 480 minutesor
1.28*X + 0.28*Y = 100 slides
Let X be a number of slides with full review with FOV and Y be a number of slides with FOV only review,
then for 8 hours:
Similar calculations for BD:
Note: same formula for two independent clinical studies

20
Lab X Workload Recording SOP Lab X Workload Recording SOP counts a TIS slide once, whether FOV review only was or the slide was screened manually after FOV review.
Let X be a number of slides with manual review with FOV and Y be a number of slides with FOV review only, then for 8 hours:
X + Y ≤ 200 and X ≤ 100This formula is correct ONLY if the percent of manual review slides with FOV is less than 22% (as in the clinical study).It is WRONG to use this formula for percents larger than 22%.
21
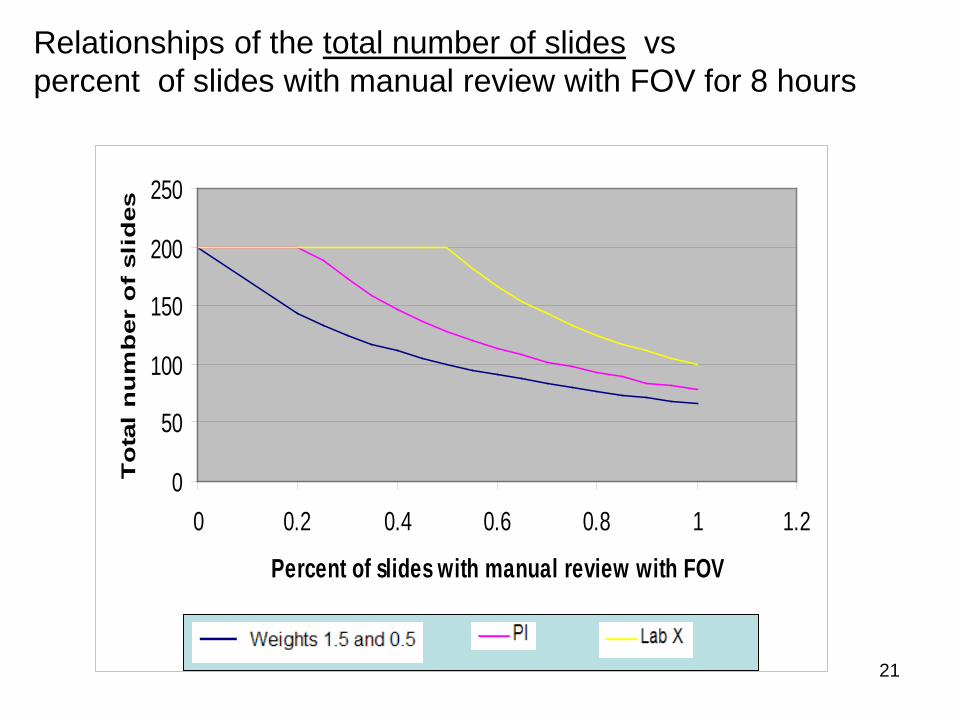
Relationships of the total number of slides vspercent of slides with manual review with FOV for 8 hours
0
50
100
150
200
250
0 0.2 0.4 0.6 0.8 1 1.2
Percent of slides with manual review with FOV
To
tal
nu
mb
er
of
sli
des
Alternative PI Lab X

22
Relationships of the total number of slides vspercent of slides with manual review with FOV for 8 hours
Percent of slides which
require manual review with
FOV in average
Upper limit for total number of slides based onClinical Study
Upper limit for total number
of slideswith weights 0.5 and 1.5
Upper limit for total
number of slidesLab X
20% 200 142 20025% 188 133 20030% 172 125 20040% 147 111 20050% 128 100 20060% 113 90 16670% 102 83 14280% 92 76 12590% 84 71 111100% 78 66 100

23
Diagnostic Accuracy
24
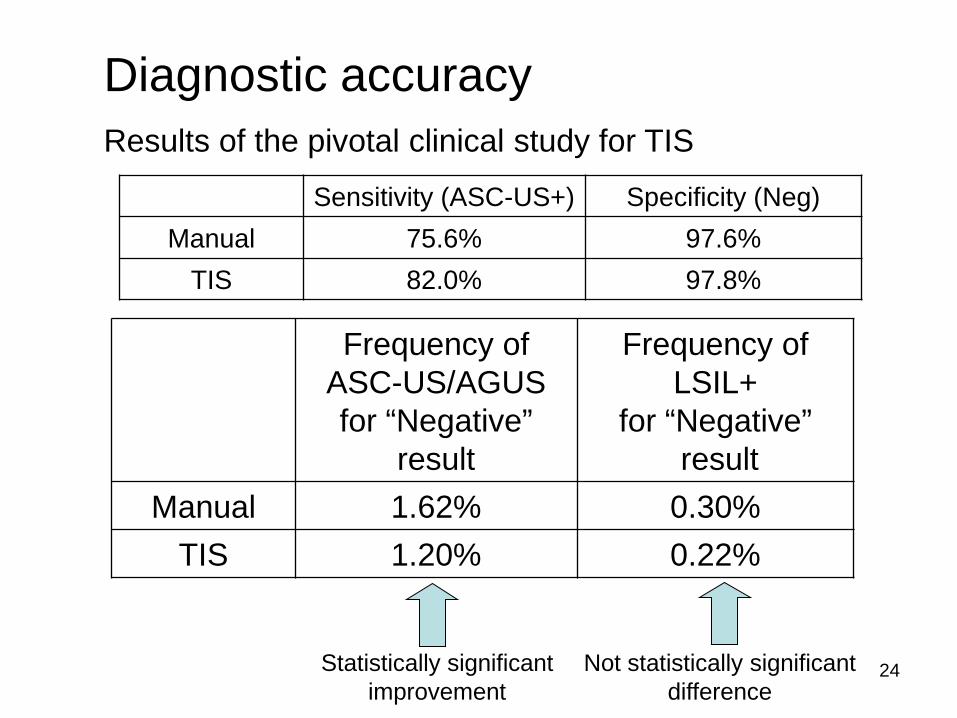
Frequency of ASC-US/AGUS for “Negative”
result
Frequency of LSIL+
for “Negative”result
Manual 1.62% 0.30%TIS 1.20% 0.22%
Diagnostic accuracyResults of the pivotal clinical study for TIS
Statistically significantimprovement
Not statistically significantdifference
Sensitivity (ASC-US+) Specificity (Neg)Manual 75.6% 97.6%
TIS 82.0% 97.8%

25
Discrepancies among QC slides
Source of data: CMS
Data for 2009, January-December
abnormal QC15% 85%

26
TIS Manual Total
Total number of slides
454,819 378,904 833,723
Total number of QC slides
72,925 51,748 124,673
Percent of QC slides
16.03% 13.66% 14.95%
Number of ASC-US/ AGUS
Discrepancy
356 320 676
Number of LSIL+
Discrepancy
96 77 173
Description of QC Data
27
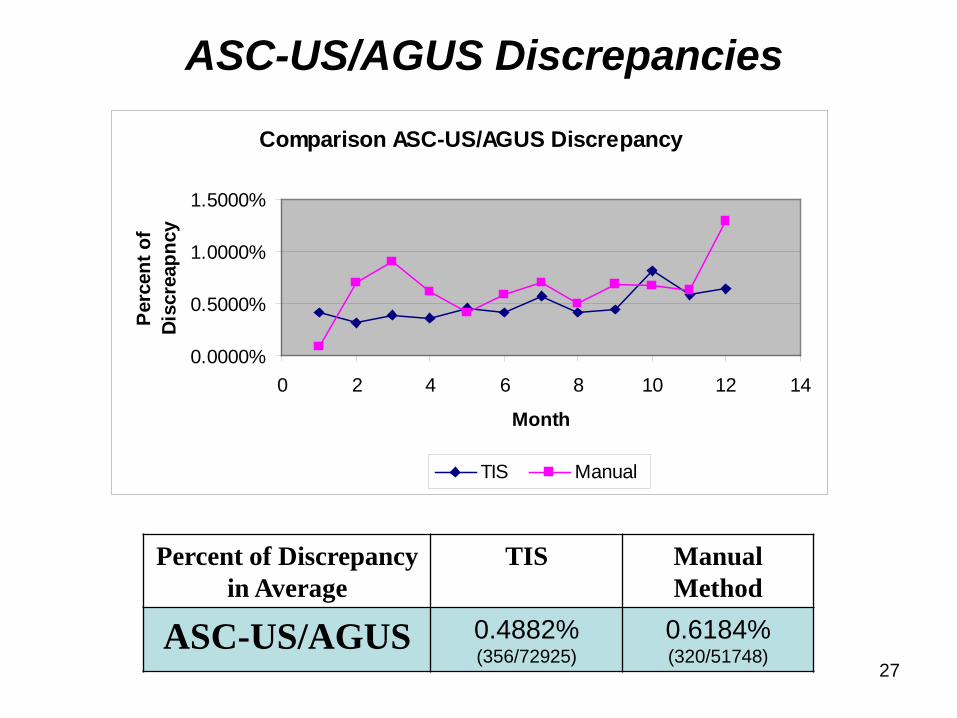
Comparison ASC-US/AGUS Discrepancy
0.0000%
0.5000%
1.0000%
1.5000%
0 2 4 6 8 10 12 14
Month
Perc
ent o
f Di
scre
apnc
y
TIS Manual
Percent of Discrepancy in Average
TIS Manual Method
ASC-US/AGUS 0.4882%(356/72925)
0.6184%(320/51748)
ASC-US/AGUS Discrepancies

28
TIS was better than Manual method in average TIS was better than Manual method for
9 out of 12 months
Manual: 0.618% (320/51,748)TIS: 0.488% (356/72,925)
Difference: 0.130%95% CI: 0.047% to 0.216%
Statistically significant
ASC-US/AGUS Discrepancies

29
Percent of Discrepancy in Average
TIS Manual Method
LSIL+ 0.1316%(96/72925)
0.1488%(77/51748)
Comparison LSIL+ Discrepancy
0.0000%0.0500%0.1000%0.1500%0.2000%0.2500%0.3000%
0 2 4 6 8 10 12 14
Month
Perc
ent o
f Di
scre
apnc
y
TIS Manual
LSIL+ Discrepancies

30
It was observed that TIS was better than Manual method in average but this difference can be explained by chance alone (not stat. sign.) It was observed that TIS was better than Manual method for 7 out of 12 months
Manual: 0.149% (77/51,748)TIS: 0.132% (96/72,925)
Difference: 0.017%95% CI: -0.024% to 0.061%
Not statistically significant
LSIL+ Discrepancies

31
Performance of TIS (missed by FOV vs missed by CT)
0.0000%
0.0500%
0.1000%
0.1500%
0.2000%
0 2 4 6 8 10 12 14
Month
Perc
ent o
f Di
scre
panc
ies
Missed by FOV Missed by CT
Percent of Discrepancy in Average
TIS Manual
LSIL+
0.1316%(96/72925)
0.1488%(77/51748)
Missed by FOV Missed by CT0.0617%
(45/72925)0.0699%
(51/72925)46.9% 53.1%
TIS:LSIL+
Discrepancies – More
Detailed Presentation
32
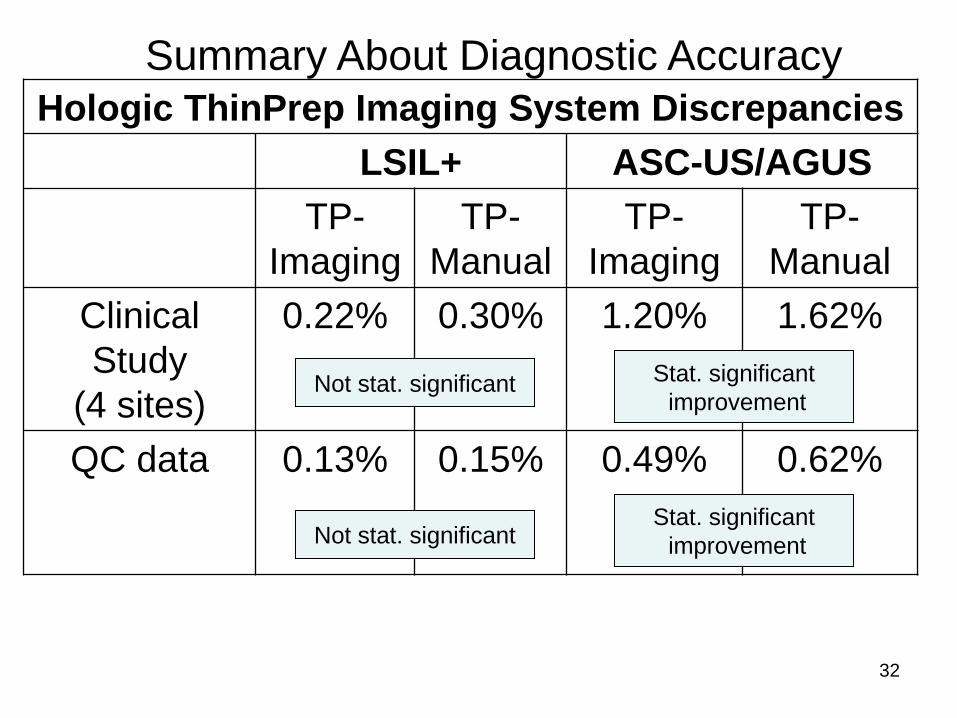
Hologic ThinPrep Imaging System DiscrepanciesLSIL+ ASC-US/AGUS
TP-Imaging
TP-Manual
TP-Imaging
TP-Manual
Clinical Study
(4 sites)
0.22% 0.30% 1.20% 1.62%
QC data 0.13% 0.15% 0.49% 0.62%
Not stat. significant
Not stat. significant
Stat. significantimprovement
Stat. significantimprovement
Summary About Diagnostic Accuracy

33
Summary Upper limit of 200 provided in the PI is estimated
based on the clinical study with 22% of manualreview with FOV in average (170 slides with 31%);
Laboratories have different percents of manual review (because of different prevalence, lab policy, CT skills and so on); therefore, the upper limit of 200 cannot be applied directly to laboratories.
Recommended counting approach for the twoFDA-approved devices with weights of0.5 for FOV only review slide and 1.5 for slide for FOV+FMR slideis a safe approach;

34
Summary
Upper limit of workload is NOT productivity/norm;productivity for each individual should be established by technical supervisor;
Additional post-market data did not demonstrate a different performance compared to the clinical study performance;
FDA will work on labeling changes with Hologic and BD.

35
Counting Approach for two FDA approved devices: All slides with full manual review (FMR) count as 1 slide (as mandated by CLIA’88 for manual screening) All slides with field of view (FOV) only review count as 0.5 or ½ slide Then, slides with both FMR and FOV count as 1.5 or 1½ slides Use these values to count workload, not exceeding the CLIA maximum limit of 100 slides in no less than an 8-hour day.
FMR = 1 slide FOV = 0.5 slide
Both FMR + FOV = 1.5 slidesUpper Limit = 100 slides
X - number slides with FMR+FOV,Y - number slides with FOVZ - number slides with FMR
1.5 X + 0.5 Y + Z ≤ 100

36
Thank you!
Questions?