fdi inflows in india and china since 2003: a...
TRANSCRIPT

Journal of Education & Social Policy ISSN 2375-0782 (Print) 2375-0790 (Online) Vol. 1, No. 2; December 2014
10
FDI Inflows in India and China since 2003: A Comparative Analysis
Javaid Ahmad Dar
Maninder Singh
Assistant Professor of Economics Lovely Professional University
Jalandhar, Punjab India, Lecturer of Economics
Lovely Professional University Jalandhar, Punjab India
Abstract
The importance of foreign direct investment for the overall economic development, especially for the developing world, has increased significantly in the last two decades. All the countries, including India and China, are making efforts to attract greater inflows of FDI. This paper seeks to analyze the impact of FDI inflows on economic growth of India and China and to highlight the determinants of FDI in these two countries. This study is exploratory in nature and the secondary data collected from World Bank Report and United Nations Conference on Trade and Development (UNCTAD) has been studied by using Multiple Regression and Correlation coefficients. The results of the study reveal that FDI is a significant factor influencing the level of economic growth in India and China, but China’s FDI inflow is highly positively correlated with GDP growth than India. The output also shows us1 that major determinants of FDI inflows are Inflation, foreign exchange reserves, financial position, total trade and exchange rate but these major determinants are more influential in china than in India. China is performing far better than India in terms of FDI attraction.
Keywords: Financial position, FDI, Economic growth, Autarky, Interdependence
1. Introduction
FDI has been recognized as an important driver for economic growth and development. A rapid development during the last two decades is the continuous growth of FDI in the global economic landscape. This unprecedented growth of global FDI in 1990 around the world makes FDI an important component of development strategy in both developed and developing nations and required policies are designed in order to stimulate inward flows (Dunning,2002). The home countries want to take the advantage of the vast markets opened by industrial growth. The hosts countries want to acquire technological, managerial skills accelerate domestic Savings, foreign exchange and overall economic growth.
India and China are the two major economies that have adopted market oriented economic policies designed to attract FDI inflows. India and China, these economies are now getting increasingly integrated with the global economy as they open up their markets to international trade and investment inflows. They are growing very fast due to foreign direct investment. Both the countries have been enjoying high positive average gross domestic product growth rate over the last two decades although China substantially exceeds India. The paper intents to find out the role of increased FDI in the economic growth of India and China.
China and India adopted an ultra-import substitution strategy in the form of autarky or self-reliance from early 1950s to late 1970s and to early 1990s in the case of China and India, respectively. Under this strategy, trade was restricted and heavy reliance on import substitution and exports were merely carried out to pay for imports (Rajan, 2005).
1 The authors (Javaid Ahmad Dar and Maninder Singh) are assistant professor and lecturer of economics respectively, at Lovely Professional University Jalandhar, India.

Published by Center for Promoting Ideas, USA www.jespnet.com Copyright © The Author(s)
11
India took similar path of liberalization since 1991(more than ten years after China's open door policy), by slowly liberalizing the restrictions and allowing FDI through automatic route barring a few strategic industries of security concern 2.
There are very few analytical studies on the inter-state or inter-province differences in foreign direct investment inflows (Yingqi et al., 2004). Several studies analyze inter-country differences in foreign direct investment emphasizing location advantages (Wei et al., 2000). These studies have identified various location advantages such as size of the market, income and its growth rate, membership of a regional union, labor and skill content of the population, infrastructure facilities like transport, electricity, and port facilities, other variable which is representing good governance such as legal dispute settlement the rule of law and spending on social sector to enhance the skills of the population. Our study aims to examine the factors which are making India and China the best FDI destinations in the developing world and the reasons of China performing better than India in terms of FDI attraction.
2. Review of Literature
Increased global interdependence is one of the most important features of our current geopolitical movement. The world is witnessing an unprecedented level of interdependence and economic and financial integration in developed as well as developing countries, Sweeny (2010). The role of FDI in the growth process is very important for all the developing countries including India. For FDI to be a noteworthy provider to economic growth, India would do better by focusing on improving infrastructure, human resources, developing local entrepreneurship, creating a stable macroeconomic framework and conditions favourable for productive investments to augment the process of development, Ray (2012). Large market size, high GDP growth and low wages are the major determinants of the foreign direct investment decision. Profitable companies chose to invest into India and China because of labour availability and flexible regulations, Zelaya et al., (2014). China is receiving more FDI compared to India, the main reasons being China opened its door to FDI in 1979 and liberalized its trade. China adopted proactive approaches like providing low labour costs, potential foreign market, favourable investment incentives which plays important role for inviting FDI. China is in far better position in infrastructure, economic activities and China has favourable business environment as compare to India. However India compete China in better legal and political system. The main findings of the foreign direct investments have positive impact on economic growth of Indian and Chinese economies. FDI positively influences GDP growth rate of these countries that lead to increase in their per capita income, Iqbal et al.,(2013),
2.1The Scenario of China
Ever since China reformed its economy, it has understood the immense importance of FDI and urged for foreign capital participation in the economy. After the reform, China has received remarkable amount of FDI .It has become the second largest recipient of FDI just behind the US and definitely the largest among the developing countries (Liu et al., 2000). The FDI in China becomes most popular since 1979 and it has received $306 billion in between the next 20 years (China statistics, 2000). That is attributed to few major incidences in that span of 20 years including the establishment of Special Economic Zones (SEZs). The government of China established four SEZs in Guangdong and Fujian provinces and offered special incentive policies for FDI in these SEZs. That make the movement of FDI in the country towards upward direction and the trend has not been changed yet (Singh, 1996). Overall, economic reform process in China has opened the door to many policies, which accelerated the trade that in turn motivated foreign investors to have business plants in China. Zhang et al., (2002),argues that establishment of new enterprises such as new foreign funded and joint venture companies has been the main mode of absorbing FDI into China.
2. Two decades ago, in the early 90’s, India faced foreign exchange crisis. At that time India’s major concerns were the problem in balance of payments and poor foreign exchange reserves. During the crisis, Dr. Manmohan Singh, the Finance Minister of India at that time, came up with a solution to reform the Indian economy. He liberalized the economy by ending the license raj and gave rise to the phenomena of foreign investments in India. Thus, opening the gates for foreign players to come and invest in India. FDI in India is freely allowed in all sectors, including the services sector, except some beyond a ceiling. FDI for virtually all items or activities could be brought in through the automatic route under the power vested with the Reserve Bank of India and for the remaining items and activities through Government approvals.

Journal of Education & Social Policy ISSN 2375-0782 (Print) 2375-0790 (Online) Vol. 1, No. 2; December 2014
12
2.2 The Scenario of India
India is considered as one of the most suitable places for foreign investors despite problem areas like bureaucratic hassle. India has great investment opportunity promoting the country as the place to invest. Nevertheless, India is not able to attract FDI in same pace as of China because china comparative advantages of technological advancement and flexibility in the policy, Ahya et al., (1999). The investors cannot ignore India anymore, as the country has the potentiality to become third largest economy of the world within short span of time. It is also the second largest among emerging nations.
Recently the Government of India has liberalized their policies in certain sectors, like Increase in the FDI limits in different sectors and made the approval system far easier and accessible. Unlike the historical tradition, today for investing in India government approval do not require in the special cases of investing in various important sectors like energy, transportation, telecommunications etc. (Nagaraj et al., 2003). FDI inflows as well as outflow have many advantaged over host countries and investors because the host countries will be benefited with overall economic growth and investors can make huge profit. Many studies have shown positive link between higher GDP and FDI inflows. There are many contribution of FDI like debt servicing stimulate export markets and produce foreign exchange revenue. Foreign direct investment is increasingly being recognized as an important factor in the economic development of countries.3
3. Research Objectives
The research is to find out the flow, patterns and directions of FDI and its impact on Economic Growth in India and China. It is to examine which country is in better position for attracting more FDI and enhancing their economic growth. It is also to examine which country’s economy is performing well as compared to other in terms of FDI and Economic Growth. 3 Kamath et al., (1994), FDI contributes to many economic and social factors like Gross capital formation, Gross Domestic Product, exchange rate and balance of payment. FDI plays a major role in developing countries like India. They act as a long term source of capital as well as a source of advanced and developed technologies. The investors also bring along best global practices of management. As large amount of capital comes in through these investments more and more industries are set up. This helps in increasing employment. FDI also helps in promoting international trade. This investment is a non-debt, non-volatile investment and returns received on these are generally spent on the host country itself thus helping in the development of the country.

Published by Center for Promoting Ideas, USA www.jespnet.com Copyright © The Author(s)
13
Hence the basic objectives of conducting this research are
1. To study the Impact of FDI on Economic growth of India and China. 2. To highlight the determinants of Foreign Direct Investment in India and China.
4. Research Methodology
Since a sound methodology is always the most prioritized concern of every research, proper and adequate importance has been given for preparing the methodology and afterwards it has been decided that a qualitative and descriptive research methods are appropriate for this study. The entire research has been carried out and directed towards achieving the above-mentioned research objectives. The research questions consisted of evaluating the impact of FDI on economic growth and determinants of FDI inflows in China and India. In order to answer the research questions efficiently, thorough review of the existing literature has been done and descriptive data has been gathered which is essentially relevant for this study.
Secondary data4 of World Bank, IMF, UNCTAD investments reports and other financial institutions are used to achieve the objectives of this paper. The data set has been collected from the databank of World Bank and has been matched up against the data available on the site of UNCTAD (United Nations Conference on Trade and Development). These two data sources have been chosen because they are the most reliable sources of data and are used by almost every researcher.
4.1. Model Building
To achieve the research objectives two models, economic growth model and foreign direct investment model were framed and fitted. The first model, economic growth model, depicts the contribution of foreign direct investment to economic growth in India and China. The second model, foreign direct investment model, shows the factors contributing the foreign direct investment in India and China. The two model equations are expressed below:
1) FDIG= f (GDPG) 2) FDI = f [RD GDP, TTGDP, FN. Position, EXR, FOREX GDP, Inflation]. FDI=β0+β1RD GDP+β2TTGDP+β3FN.Position+β4EXE+β5FOREX GDP+β6Inflation
Where,
GDP = Gross Domestic Product FDI = Foreign Direct Investment TT GDP= Total Trade as percentage of GDP. Inflation = Inflation rate calculated as percentage change in Consumer Price Index (CPI percent). FOREX GDP = Foreign Exchange Reserves as percentage of GDP. FN. Position = Financial Position = Ratio of external debts to exports RD GDP = Research and development expenditure as percentage of GDP EXR = Exchange rate FDIG = Foreign Direct Investment Growth. GDPG = level of Economic Growth.
Karl Pearson Correlation Coefficient5 is used to show the impact of FDI flows on economic growth in India and China for the first model. It helps to show the relationship between FDI inflows and GDP growth. For the second model multiple regression6 has been used for finding out the major determinants of Foreign direct investment in these two Countries. 4 Secondary data are edited primary sources, second-hand version. It is simply the analysis of pre-existing data in a different way or to answer a different question than originally intended. Secondary data analysis utilizes the data that was collected by someone else in order to further a study of interest (Sachdeva, 2009, Business research methodology). 5 A correlation coefficient is a statistical measure of the degree to which, changes to the value of one variable predict change to the value of another. In positively correlated variables, the value increases or decreases simultaneously in negatively correlated variables, the value of one increases and other decreases. The coefficients of correlation are expressed as values between +1 and -1. Correlation coefficient of +1 indicates a perfect positive correlation. A change in the value of one variable will predict a change in the same direction in the second variable. Correlation coefficient of -1 indicates a perfect negative correlation. A change in the value of one variable predicts a change in the opposite direction in the second variable. When there is no correlation, the coefficient will be zero (Guajarati, 2002). 6 Multiple regressions (the term was first used by Pearson, 1908) are to learn more about the relationship between several independent or predictor variables and a dependent or criterion variable. To make multiple regression clear let us take an example that how much a person enjoy his/her job and which factor influences the most. There are many variables, which effect the job satisfaction like salary of the person, experience, working environment, sex, age and reputation of the organization. If the collected data on all of these variables, perhaps by

Journal of Education & Social Policy ISSN 2375-0782 (Print) 2375-0790 (Online) Vol. 1, No. 2; December 2014
14
4.2. Hypothesis
The research objectives are translated into the hypothesis, which are then, tested using statistical analysis:
For Model 1
Ho: There is no significant impact of FDI on economic growth of India and China. H1: There is significant impact of FDI on economic growth of India and China.
For Model 2
Ho: There is no significant difference in GDP growth, Inflation rate, exchange rate, FOREX reserve and financial position with respect to FDI inflows. H1: There is significant difference in GDP growth, Inflation rate, exchange rate, FOREX reserve and financial position with respect to FDI inflows.
4.3 Data Analysis
Model 1: FDIG = f [GDPG]
Table 1: Karl Pearson Correlation between GDP growth and FDI inflows for India
Here in this research we have used Karl Pearson correlation coefficient to explain the relationship between gross domestic product growth with foreign direct investment inflows in India and China, we have also used scatter plot diagram to make it more clear about the relationship. Since Pearson’s r-value of 0.726 was positive, we can conclude that when the amount of GDP growth increases (our first variable), the participant FDI inflows (our second variable) also increases. With data for ten years, we could find out that GDP growth of India is positively correlated to FDI inflows in India. Hence the Increase in FDI inflows has positive impact on Indian economy. The Sig. (2-Tailed) value in the table above is 0.017. This value is less than .05. Because of this, we can conclude that there is a statistically significant correlation between amount GDP growth in India and FDI inflows in India7.
surveying a few hundred members of the public, the findings will be to see how many and which of these variables gave rise to the most accurate prediction of job satisfaction. The finding may for the job satisfaction of the individual, may be that some variable may be strongly influencing and some will not be influencing the job satisfaction. The variable like Salary and working environment will be strong factors contributing to job satisfaction than others because the coefficient for salary and working environment will be much higher than other variables. When using multiple regressions in psychology, many researchers use the term “independent variables” to identify those variables that they think will influence some other “dependent variable”. The term “predictor variables” for those variables that may be useful in predicting the scores on another variable that we call as “criterion variable”. As pointed out before, human behavior is inherently noisy and therefore it is not possible to produce very accurate predictions, but multiple regressions allow us to identify a set of predictor variables, which together provide a useful estimate of a participant’s likely score on a criterion variable. In linear multiple regression, the model specification is that the dependent variable, yi is a linear combination of the parameters (but need not be linear in the independent variables). For example, in linear multiple regression for modeling data points there is p independent variable and p parameters, β0,β1....... βp: (Gujarati, 2002) 7 If the Sig (2-Tailed) value is less than or equal to .05 then there is a statistically significant correlations between the two variables at 5% level of significance. That means, increases or decreases in one variable do significantly relate to increases or decreases in your second variable.
FDI India GDP India FDI India Pearson Correlation 1 .726*
Sig. (2-tailed) .017 N 10 10
GDP India Pearson Correlation .726* 1 Sig. (2-tailed) .017 N 10 10
* Correlation is significant at the 0.05 level (2-tailed).
Published by Center for Promoting Ideas, USA www.jespnet.com Copyright © The Author(s)
15
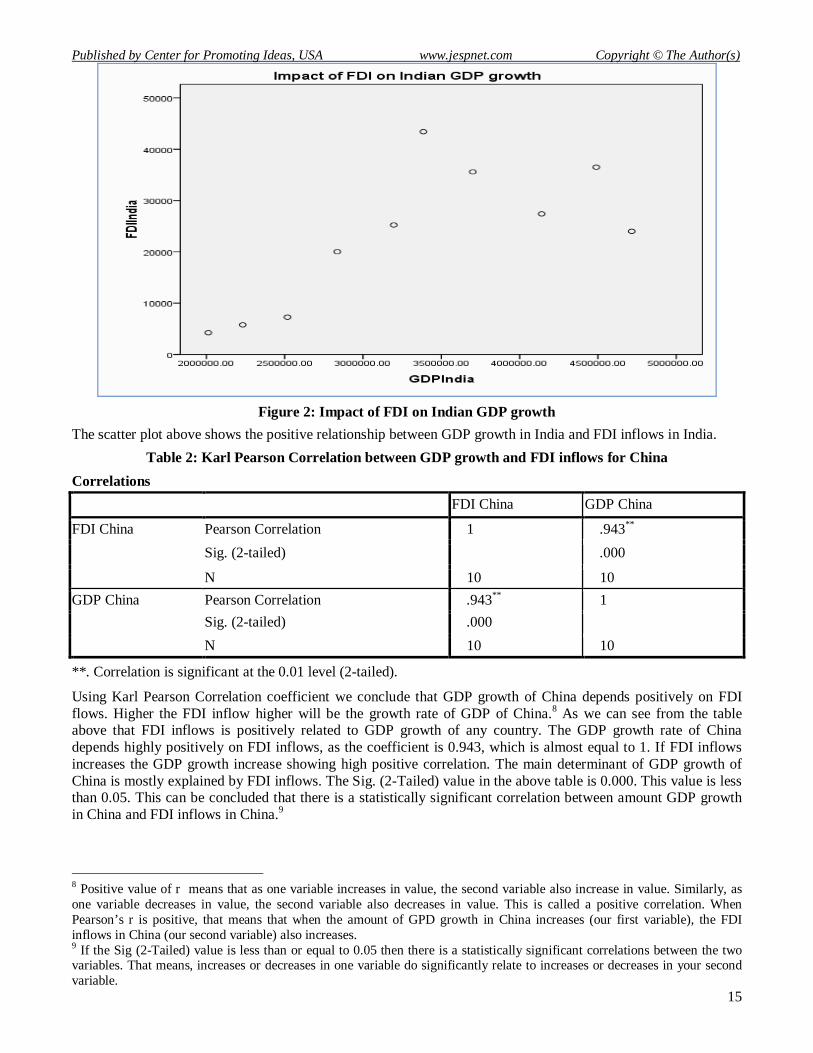
Figure 2: Impact of FDI on Indian GDP growth
The scatter plot above shows the positive relationship between GDP growth in India and FDI inflows in India.
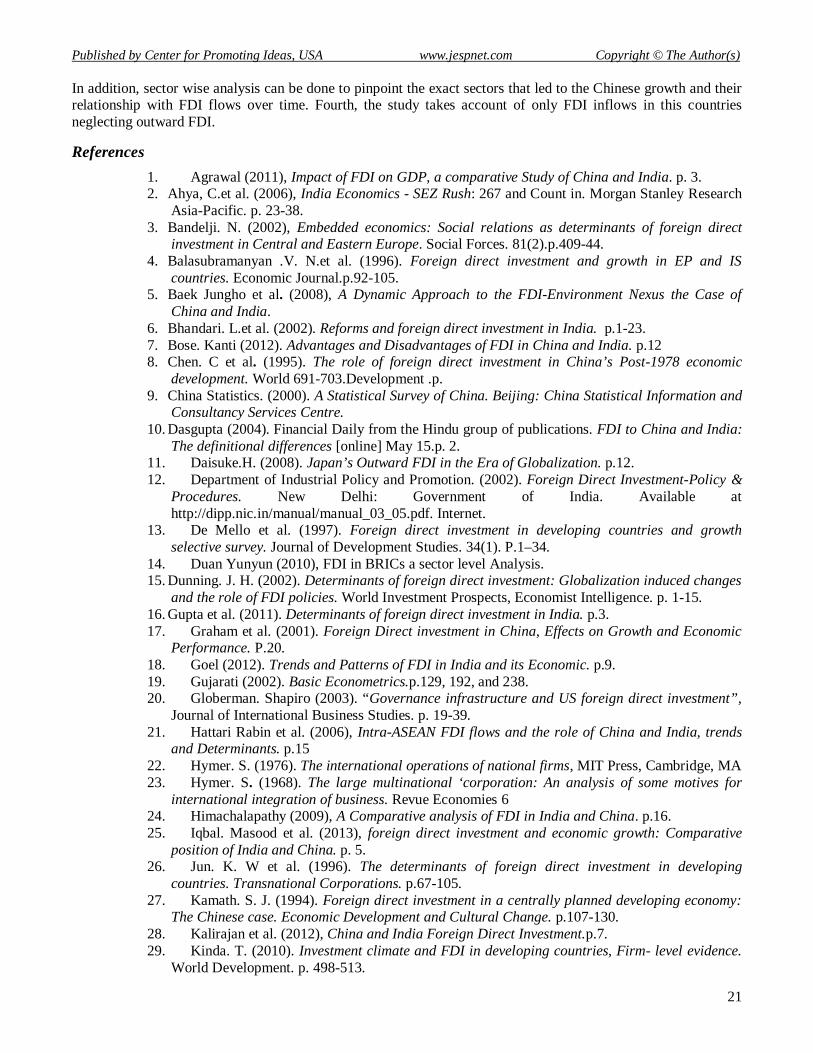
Table 2: Karl Pearson Correlation between GDP growth and FDI inflows for China
Correlations FDI China GDP China FDI China Pearson Correlation 1 .943**
Sig. (2-tailed) .000 N 10 10
GDP China Pearson Correlation .943** 1 Sig. (2-tailed) .000 N 10 10
**. Correlation is significant at the 0.01 level (2-tailed).
Using Karl Pearson Correlation coefficient we conclude that GDP growth of China depends positively on FDI flows. Higher the FDI inflow higher will be the growth rate of GDP of China.8 As we can see from the table above that FDI inflows is positively related to GDP growth of any country. The GDP growth rate of China depends highly positively on FDI inflows, as the coefficient is 0.943, which is almost equal to 1. If FDI inflows increases the GDP growth increase showing high positive correlation. The main determinant of GDP growth of China is mostly explained by FDI inflows. The Sig. (2-Tailed) value in the above table is 0.000. This value is less than 0.05. This can be concluded that there is a statistically significant correlation between amount GDP growth in China and FDI inflows in China.9
8 Positive value of r means that as one variable increases in value, the second variable also increase in value. Similarly, as one variable decreases in value, the second variable also decreases in value. This is called a positive correlation. When Pearson’s r is positive, that means that when the amount of GPD growth in China increases (our first variable), the FDI inflows in China (our second variable) also increases. 9 If the Sig (2-Tailed) value is less than or equal to 0.05 then there is a statistically significant correlations between the two variables. That means, increases or decreases in one variable do significantly relate to increases or decreases in your second variable.

Journal of Education & Social Policy ISSN 2375-0782 (Print) 2375-0790 (Online) Vol. 1, No. 2; December 2014
16
Figure 3: Impact of FDI on Chinese GDP growth
The scatter plot above shows us the strong correlation between GDP growth in China and FDI inflows.
Now the comparison between India and China concerning FDI inflow and GDP growth, the Karl Pearson correlation coefficient for china is much higher than for India, which clearly shows us that China attracts higher FDI than India. The FDI has higher impact on GDP growth of China than India.
Table 3: Comparisons of FDI and GDP growth in India and China
r India China Correlation coefficient 0.726 0.943
The Karl Pearson correlation coefficient of India shows the relationship between GDP growth and FDI inflows. The coefficient of China is much higher than India, which shows China’s FDI inflows, is highly positively collated with GDP growth than India. When we compare P-value with α-value (0.05), the p-value (0. 017 and 0.00) .The P-value for India (0.017) and for China (0.00) which is lesser than 0.05, therefore the null hypothesis is rejected as there is significant impact on GDP growth due to FDI inflow. Therefore, we conclude stating that the FDI inflow determines positively the GDP growth of the country.

Published by Center for Promoting Ideas, USA www.jespnet.com Copyright © The Author(s)
17
Figure 4: Comparison of FDI Inflows and GDP growth Rate
The graph clearly states that GDP growth of India depends positively on foreign direct investment. The FDI Inflow was US $ 4234 million increases continuously and in 2012, the FDI an inflow was US $ 23,996.the increase in FDI contributes to rise in GDP of India. There was not much impact on FDI inflows in India due to global recession as there is continuous increase in FDI flows.
Figure 5: Comparison of FDI inflows and GDP growth of China
The line graph above is to explain the relationship between GDP growth and FDI inflows. We can see from the above graph that GDP continuously grows with the increase in FDI inflows. The FDI inflow of China in the year 2003 was US $ 56,198 and increases to US $ 253474.9443.
Model 2: The second model called as foreign direct investment model, which is used to explain the major determinant of FDI inflows. We take only six major variables, which affect the FDI inflows in the two giant nations. To find out the impact of this variable on FDI inflows will be explained with the help of multiple regressions, where FDI inflows will be dependent variable and others (RD GDP, TTGDP, FN. Position, EXR, FOREX GDP, inflation) independent. We will see the impact of each variable with FDI .
FDI = f [RD GDP, TTGDP, FN. Position, EXR, FOREX GDP, Inflation].

Journal of Education & Social Policy ISSN 2375-0782 (Print) 2375-0790 (Online) Vol. 1, No. 2; December 2014
18
Table 4: India’s FDI Inflow and various Economic Indicators in between 2003 to 2012
Year FDI Inflows
GDP at PPP Total trade FOREX Exchange rate
Financial position
National expenditure on R$D
Inflation
2003 4234.34 2012451.32 22384.21 128763.54 46.58 89.02 1512243.87 3.21 2004 5771.29 2232364.12 28234.22 131631.14 45.32 102.02 1651949.45 3.77 2005 7269.40 2517884.10 27276.33 137824.83 44.1 78.40 1863234.23 4.25 2006 20029.11 2835713.55 31769.96 178049.78 45.31 82.52 2098428.03 6.15 2007 25227.74 3196284.69 38703.71 276578.10 41.35 84.99 2365250.67 6.37 2008 43406.27 3385519.06 74360.04 257422.72 43.51 74.43 2505284.11 8.35 2009 35581.37 3700871.26 67410.01 284682.88 48.41 98.26 2738644.73 10.88 2010 27396.88 4140702.10 91023.66 300480.14 45.73 83.79 3064119.55 11.99 2011 36498.65 4489298.02 106686.78 298739.48 46.67 75.46 3322080.53 8.86 2012 23995.68 4715640.32 136063.39 300425.51 53.44 85.41 3489573.84 9.31
Source: World Bank report, World Bank indicators.
Table 5: China’s FDI Inflows and various Economic Indicators in between 2003 to 2012
Year FDI Inflows
GDP at PPP Total trade FOREX Exchange rate
Financial position
National expenditure on R$D
Inflation
2003 56198.21 3778152.41 7632403.62 512364.21 8.28 62.45 4478915.02 3.21 2004 62108.04 4669851.85 1080755.68 622948.55 8.28 86.99 5743917.77 3.88 2005 104108.69 5364250.89 124626.79 831409.62 8.19 36.48 6598028.60 1.82 2006 124082.03 6231357.48 208918.92 1080755.68 7.97 32.95 7664569.70 1.46 2007 156249.33 7305066.02 308036.02 1546364.66 7.61 29.61 8985231.20 4.75 2008 171534.65 8162755 348832.53 1966037.43 6.95 25.33 10040188.65 5.86 2009 131057.05 8982336.12 220130.40 2452899.05 6.83 35.38 11048273.44 0.7 2010 243703.43 10036535.19 223023.87 2913711.65 6.77 33.97 12344938.29 3.31 2011 280072.21 11185373.66 181903.73 3254674.12 6.46 35.67 13758009.6 5.41 2012 253474.94 12268638.11 231844.87 3387512.97 6.31 34.79 15090424.88 2.65
Source: World Bank report, World Bank indicators.
Table 6: The Output of SPSS for Multiple regressions
Variable Co-efficient Standard error p-value India China India China India China constant 39360.712 1084000 105554.54 586579.100 0.003 0.001 Total trade .192 .042 0.458 .111 .012 .008 FOREX .274 .228 0.261 .080 0.03 0.007 Exchange rate 991.593 745.04
3446.259 71409.368 0002 0.006
FP 634.342 .098 740.098 1733.733 -0.02 -0.003 National exe on R and D
-.039 -.014 .045 .018 0.0012 0.01
Inflation 1883.646 1403.36 3065.546 5300.675 0.0032 0.003
Note: Significant at 0.05 levels
Variable India China R2 .800 .983 Adjusted R2 .201 .933 D-W Statistic 3.28 3.56 F-ratio 1.34 19.55
The output of SPSS for multiple regressions shows the result as FDI India=39360.7-0.039RD+0.19TT+634.3FP+991.5ER+0.274FRX +1883.6Inflation. FDIChina=1084000-0.014RD+0.042TT+0.098FP+745.04ER+.228FRX+1403.3Inflation

Published by Center for Promoting Ideas, USA www.jespnet.com Copyright © The Author(s)
19
The output of SPSS shows that without the major determinants (RD GDP, TTGDP, FN. Position, EXR, FOREX GDP, Inflation) of FDI there will be 39360.71 million of FDI inflows in India and 1084000 million in China. It means the determinant likes Exchange rate, inflation, FOREX and others does not impact much in China than India.Every1 unit change in total trade in India leads to 0.92 unit change in FDI in flows of India and 0.042 unit in China. Every 1-unit change in FOREX leads to 0.274 unit change in FDI inflow of India and 0.228 units in China. Every 1-unit change in exchange rate leads to 991.593 unit change in FDI inflows of India and 745.04 units in China. Inflation has also have direct impact on FDI inflows of the economy,1 unit change in Inflation leads to 1883.646 unit change in FDI flows of India and 1403.36 unit in China. National expenditure on research and development has shown negative sign, which means every 1-unit change in national expenditure on Research and development leads to decrease in FDI flow in India by 0.039 units and 0.041 units in China. R-Square10 is the proportion of variance in the dependent variable (FDI inflows of India and china) which can be explained by the independent variables (RD GDP, TTGDP, FN. Position, EXR, FOREX GDP, and Inflation).
The p-value for all the variable are less than α value (0.05) we reject the null hypothesis and accept the alternative hypothesis, which means all the variable are the major determinant of FDI inflows in India and China. The variables are effecting significantly to FDI inflows.
Figure 6: Effect of Major Determinants of FDI Inflows
Figure 6: Effect of Major Determinants of FDI Inflows
The Scatter plot matrix11 shows that the determinant like GDP, Inflation Financial position, Expenditure on research and development and exchange rate determines the foreign direct investment heavily. The conclusion from the scatter plot is that GDP, Financial position, inflation, expenditure on research and development and Inflation are the major determinates of FDI inflows in India and China.
The second Model, Foreign Direct Investment Model found that all variables are statistically significant. The results of Foreign Direct Investment Model shows that RD GDP (reserve GDP), TTGDP, FN. Position, EXR (exchange rate), FOREX GDP, Inflation are the major determinants of FDI inflows in India and China. 10 R-Square, also known as the Coefficient of determination is a commonly used statistic to evaluate model fit. R-square is 1 minus the ratio of residual variability (Guajarati, 2002). When the variability of the residual values around the regression line relative to the overall variability is small, the predictions from the regression equation are good. This is an overall measure of the strength of association and does not reflect the extent to which any particular independent variable is associated with the dependent variable. Adjusted R-square - the addition of extraneous predictors to the model. Adjusted R-squared is computed using the formula 1 - ((1 – R-Square) ((N - 1) /( N - k - 1)) where k is the number of predictors,(Guarajati,2002). Standard Error of the Estimate - is also referred as the root mean squared error. It is the standard deviation of the error term and the square root of the Mean Square for the Residuals. T statistics and their associated 2-tailed p-values used in testing whether a given coefficient is significantly different from zero, using an alpha value of 0.05. 11 Another useful technique for screening the data is a scatter plot matrix. While this is probably more relevant as a diagnostic tool searching for non-linearity’s and outliers in the data, but it can also be a useful data screening tool, possibly revealing information in the joint distributions of the variables that would not be apparent from examining univariate distributions.

Journal of Education & Social Policy ISSN 2375-0782 (Print) 2375-0790 (Online) Vol. 1, No. 2; December 2014
20
The Multiple regression results of above shows that TTGDP, FN. Position, EXR (exchange rate), FOREX GDP, Inflation and TTGDP are the positive factors for FDI inflows in India and China whereas RD GDP acts as negative force in attracting FDI flows in two country. The result shows that RD GDP and EXR (exchange rate) does not show the predicted signs, RD GDP shows negative sign and exchange rate shows unexpected positive sign instead of negative sign .In the foreign direct investment model portrays their respective signs except exchange rate and research and development GDP. The main reason behind the deviation is due to the currency of China and India in international market and low expenditure on Research and development activities in these countries. Positive sign with exchange rate could be attributed to the appreciation of currency in international market, which helped the foreign firms to acquire the firm specific assets at cheap rates and gain higher profits. Research and Development shows negative sign, which indicate low FDI inflows in R and D sectors.
5. Conclusion and Recommendations
Global economies are suffering with financial crisis and economic hurdles. However, the two giant economies (India and China) are growing very fast despite so many economic crises still stands as a global investment destination. It is observed from the results of above analysis that TTGDP, FOREX, Exchange rate, FN Position, RDGDP, inflation are the main determinants of FDI inflows in India and China. These macroeconomic variables have a profound impact on the inflows of FDI in India and China. The results of foreign Direct Investment Model reveal that TTGDP, FOREX, and Financial Position variables exhibit a positive relationship with FDI while RDGDP and Exchange Rate variables exhibit a negative relationship with FDI inflows. Hence, TTGDP, FOREX, and Position variables are the pull factors for FDI inflows to the country and RDGDP and Exchange rate are deterrent forces for FDI inflows into the country. Thus, it is concluded that the above analysis is successful in identifying those variables, which are important in attracting FDI inflows to the country. The study also reveals that FDI is a significant factor influencing the level of economic growth in India. The results of Economic Growth Model and Foreign Direct Investment Model show that FDI plays a crucial role in enhancing the level of economic growth in the country. It helps in increasing the trade in the international market. The major determinants explained above are more influential in china than in India as the R_ square is much higher in China than in India.
This study examines the status of inward Foreign Direct Investment flow into India and China. Ever since Macro Economic structural changes initiated in 1991 in India and 1978 in China, the impact of ongoing process of Liberalization, Privatization and Globalization and its implications in attracting inward FDI into these countries has become focal point of this study, at a time When Economy of India and China experience a slowdown in the backdrop of global financial crisis and Economic recession. Globalization process and its implication on inward FDI can be evaluated in terms of Economic Indicators such as GDP, GDP growth rate, exchange rate, inflation, financial position (ratio of export and external debt) and total trade. The main aim of this paper is to find out the impact of FDI inflows to GDP growth of these respective countries and to find the major factors contributing to FDI inflows. The paper consist of two models, economic growth model is to show the impact of FDI inflows to GDP growth of India and China. It is explained with Karl Pearson’s Correlation Coefficient. Second Model, Foreign investment model is to show the major determinants of FDI inflows in these two Countries. Foreign direct model is explained with multiple regressions. Using SPSS software the output of first model shows that GDP growth of China is influenced more by FDI inflows than India. The output of second model shows us that major determinant of FDI inflows are Inflation, foreign exchange reserves, financial position, Total trade and exchange rate.
Though the research has been able to accomplish significant results, there are some issues that need to be addressed in future research and are limitations of this study. First of all, it is very difficult to obtain entire data on China and India on different parameter. India and China have grown at different time periods and India faces a lag of thirteen years, comparing different time dimensions can be misleading as their might be macroeconomic global factors such as Asian Crisis, recession in Japan and Gulf war that might have influence on the flows into these countries differently. In addition, this study does not statistically test all the factors that determine foreign direct investment in emerging markets because it is very difficult to include the entire variable due to unavailability of data, although most of the relevant determinants have been included. Third, this study only discusses China and India and does not include other emerging markets such as Brazil and Russia (BRIC countries). A study of FDI determinants for BRIC economies over last twenty-five years can add to the findings of this study.
Published by Center for Promoting Ideas, USA www.jespnet.com Copyright © The Author(s)
21
In addition, sector wise analysis can be done to pinpoint the exact sectors that led to the Chinese growth and their relationship with FDI flows over time. Fourth, the study takes account of only FDI inflows in this countries neglecting outward FDI. References
1. Agrawal (2011), Impact of FDI on GDP, a comparative Study of China and India. p. 3. 2. Ahya, C.et al. (2006), India Economics - SEZ Rush: 267 and Count in. Morgan Stanley Research
Asia-Pacific. p. 23-38. 3. Bandelji. N. (2002), Embedded economics: Social relations as determinants of foreign direct
investment in Central and Eastern Europe. Social Forces. 81(2).p.409-44. 4. Balasubramanyan .V. N.et al. (1996). Foreign direct investment and growth in EP and IS
countries. Economic Journal.p.92-105. 5. Baek Jungho et al. (2008), A Dynamic Approach to the FDI-Environment Nexus the Case of
China and India. 6. Bhandari. L.et al. (2002). Reforms and foreign direct investment in India. p.1-23. 7. Bose. Kanti (2012). Advantages and Disadvantages of FDI in China and India. p.12 8. Chen. C et al. (1995). The role of foreign direct investment in China’s Post-1978 economic
development. World 691-703.Development .p. 9. China Statistics. (2000). A Statistical Survey of China. Beijing: China Statistical Information and
Consultancy Services Centre. 10. Dasgupta (2004). Financial Daily from the Hindu group of publications. FDI to China and India:
The definitional differences [online] May 15.p. 2. 11. Daisuke.H. (2008). Japan’s Outward FDI in the Era of Globalization. p.12. 12. Department of Industrial Policy and Promotion. (2002). Foreign Direct Investment-Policy &
Procedures. New Delhi: Government of India. Available at http://dipp.nic.in/manual/manual_03_05.pdf. Internet.
13. De Mello et al. (1997). Foreign direct investment in developing countries and growth selective survey. Journal of Development Studies. 34(1). P.1–34.
14. Duan Yunyun (2010), FDI in BRICs a sector level Analysis. 15. Dunning. J. H. (2002). Determinants of foreign direct investment: Globalization induced changes
and the role of FDI policies. World Investment Prospects, Economist Intelligence. p. 1-15. 16. Gupta et al. (2011). Determinants of foreign direct investment in India. p.3. 17. Graham et al. (2001). Foreign Direct investment in China, Effects on Growth and Economic
Performance. P.20. 18. Goel (2012). Trends and Patterns of FDI in India and its Economic. p.9. 19. Gujarati (2002). Basic Econometrics.p.129, 192, and 238. 20. Globerman. Shapiro (2003). “Governance infrastructure and US foreign direct investment”,
Journal of International Business Studies. p. 19-39. 21. Hattari Rabin et al. (2006), Intra-ASEAN FDI flows and the role of China and India, trends
and Determinants. p.15 22. Hymer. S. (1976). The international operations of national firms, MIT Press, Cambridge, MA 23. Hymer. S. (1968). The large multinational ‘corporation: An analysis of some motives for
international integration of business. Revue Economies 6 24. Himachalapathy (2009), A Comparative analysis of FDI in India and China. p.16. 25. Iqbal. Masood et al. (2013), foreign direct investment and economic growth: Comparative
position of India and China. p. 5. 26. Jun. K. W et al. (1996). The determinants of foreign direct investment in developing
countries. Transnational Corporations. p.67-105. 27. Kamath. S. J. (1994). Foreign direct investment in a centrally planned developing economy:
The Chinese case. Economic Development and Cultural Change. p.107-130. 28. Kalirajan et al. (2012), China and India Foreign Direct Investment.p.7. 29. Kinda. T. (2010). Investment climate and FDI in developing countries, Firm- level evidence.
World Development. p. 498-513.

Journal of Education & Social Policy ISSN 2375-0782 (Print) 2375-0790 (Online) Vol. 1, No. 2; December 2014
22
30. Lifeng Peng (2005), A comparison of china and India in FDI tax laws.p.12- 18. 31. Maitra (2003), Asian times [online]. Why India's economy lags behind China’s. p. 2. 32. Maheshwari Suneel (2010), FDI accounting in India and China.p.8. 33. Mottaleb.K.A et al. (2010), Determinants of Foreign Direct Investment in Developing
Countries: A Comparative Analysis, Margin - The Journal of Applied Economic Research.p.236-258.
34. Poncet (2008). Inward and Outward FDI in china. p.12. 35. Rajan, R. S. (2005). FDI, trade and the internationalization of production in the Asia- Pacific
Region. Asia-Pacific Trade and Investment Review. p.3-26. 36. Ray (2012), Impact of Foreign Direct Investment on Economic Growth in India: A Co
integration Analysis. p. 3. 37. Sachdeva (2009), Business research methodology. 38. Sinha. Kent.et al. (2007), Comparative Analysis of FDI in India and China.p.13. 39. Siddharthan (2004), Regional difference in FDI Inflows: China-India Comparisons. p.17. 40. Shina (2008). A Comparative analysis of FDI in India and China: Can laggard learn from
Leader? .p.22. 41. Sweeney (2008). Foreign Direct Investment in India and China: The Creation of a balanced
regime in a globalized Economy. p. 28. 42. Tang.H. (2011). FDI Policies in China and India: Evidence from Firm Surveys. p.8-15. 43. Tolentino (2007).The determinants of the outward foreign direct investment of China and
India: Whither the home country? .p. 18. 44. UNCTAD (2011). World Investment Report 2011: Transnational Corporations and the
Internationalization of R&D. New York: United Nations. 45. UNCTAD (2012). World investment report 2012: Transnational corporations and export
competitiveness. New York: United Nations. 46. Wei. W. (2005). China and India: Any Difference in their FDI Performances .p.719-736. 47. Wei. Yingqi Annie (2004). Foreign direct investment in China.p.27. 48. Wal-Mart. (2010), www.wal-martchina.com/english/index.htm 49. World Bank. (2005), Global Economic Prospects and the Developing Countries 2002.
Washington, DC: The World Bank. 50. Yao. Shujie et al. (2001), Regional growth in China under economic reform. The Journal of
Development Studies. p.167-186. 51. Zhang. K. H. (2002), What attracts foreign multinational corporations to China?
Contemporary. 52. Zelaya Mauricio (2014). Foreign direct investment decisions into china and India. 53. Sweeny Mathew (2010). Foreign Direct Investment In India And China: The creation Of A
Balanced Regime In A Globalized Economy.