fear factor metrics: pr metrics communicators fear most
TRANSCRIPT
FEAR FACTOR METRICS: A LOOK AT THE METRICS COMMUNICATORS FEAR THE MOST
Sandra Fathi President Affect @sandrafathi
web: affect.com blog: techaffect.com email: [email protected]
PR News Measurement Conference Chicago, November 18, 2015
Slides: www.slideshare.net/sfathi

ABOUT ME
• Sandra Fathi • President, Affect • Public RelaKons, Social Media,
MarkeKng
• Board Council of PR Firms • PRSA Past PosiKons:
– Tri-‐State Chair – NY Chapter President – Technology SecKon Chair
• Board PRSA-‐NY
2 @sandrafathi
Technology Healthcare
Professional Services:
SAMPLE PAST & PRESENT CLIENTS
@sandrafathi
MEASUREMENT & METRICS
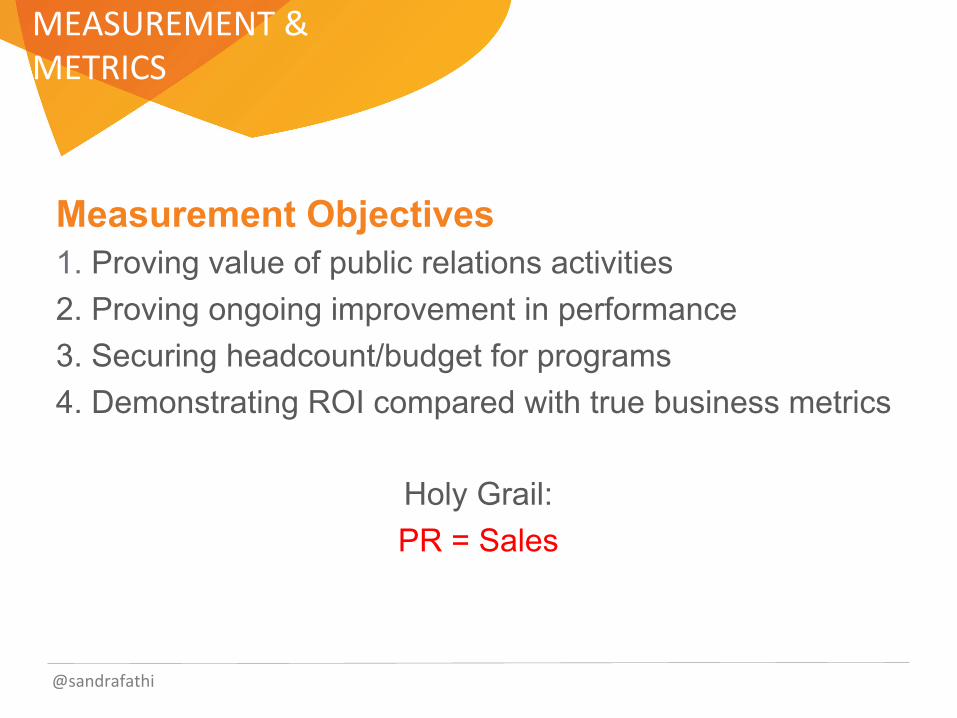
Measurement Objectives 1. Proving value of public relations activities 2. Proving ongoing improvement in performance 3. Securing headcount/budget for programs 4. Demonstrating ROI compared with true business metrics
Holy Grail: PR = Sales
@sandrafathi
5
PR MEASUREMENT
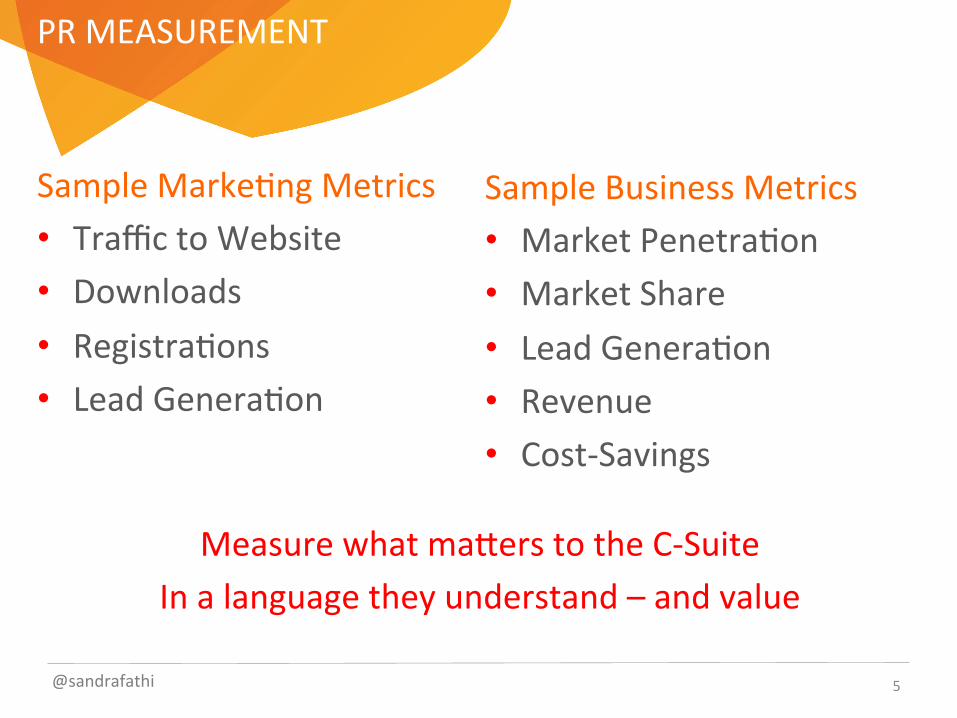
Sample Business Metrics • Market PenetraKon • Market Share • Lead GeneraKon • Revenue • Cost-‐Savings
Sample MarkeKng Metrics • Traffic to Website • Downloads • RegistraKons • Lead GeneraKon
Measure what maYers to the C-‐Suite In a language they understand – and value
@sandrafathi
MEASUREMENT & METRICS
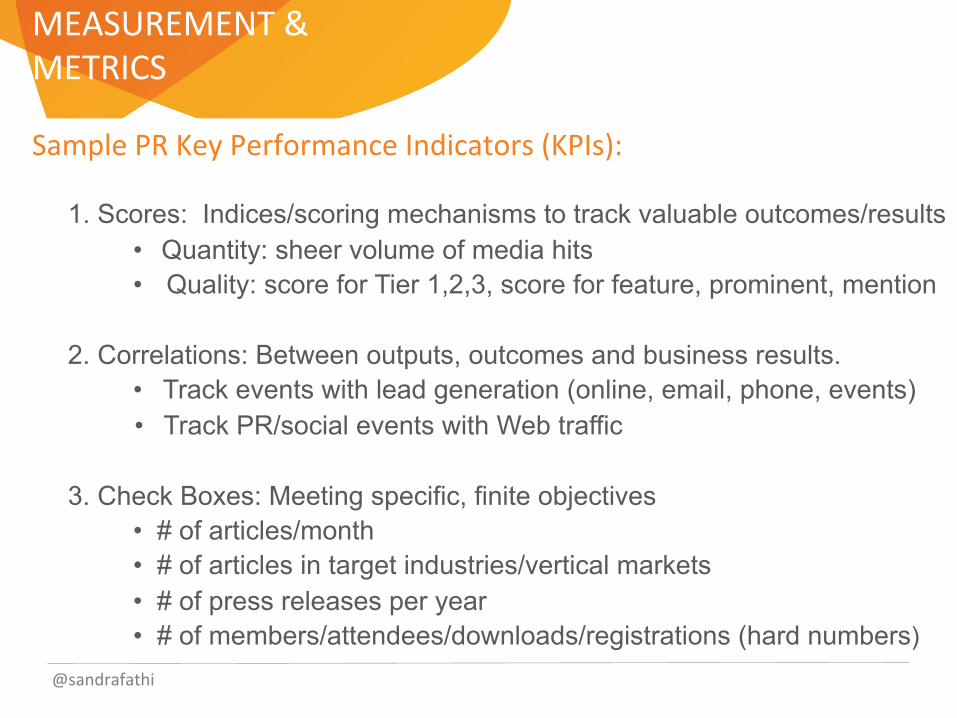
Sample PR Key Performance Indicators (KPIs): 1. Scores: Indices/scoring mechanisms to track valuable outcomes/results
• Quantity: sheer volume of media hits • Quality: score for Tier 1,2,3, score for feature, prominent, mention
2. Correlations: Between outputs, outcomes and business results. • Track events with lead generation (online, email, phone, events) • Track PR/social events with Web traffic
3. Check Boxes: Meeting specific, finite objectives
• # of articles/month • # of articles in target industries/vertical markets • # of press releases per year • # of members/attendees/downloads/registrations (hard numbers)
@sandrafathi
PR MEASUREMENT
Three Concepts for Discussions:
• Share of Voice • CompeKKve Benchmarking • CorrelaKons
@sandrafathi 7

PART I: SHARE OF VOICE
DEFINITION
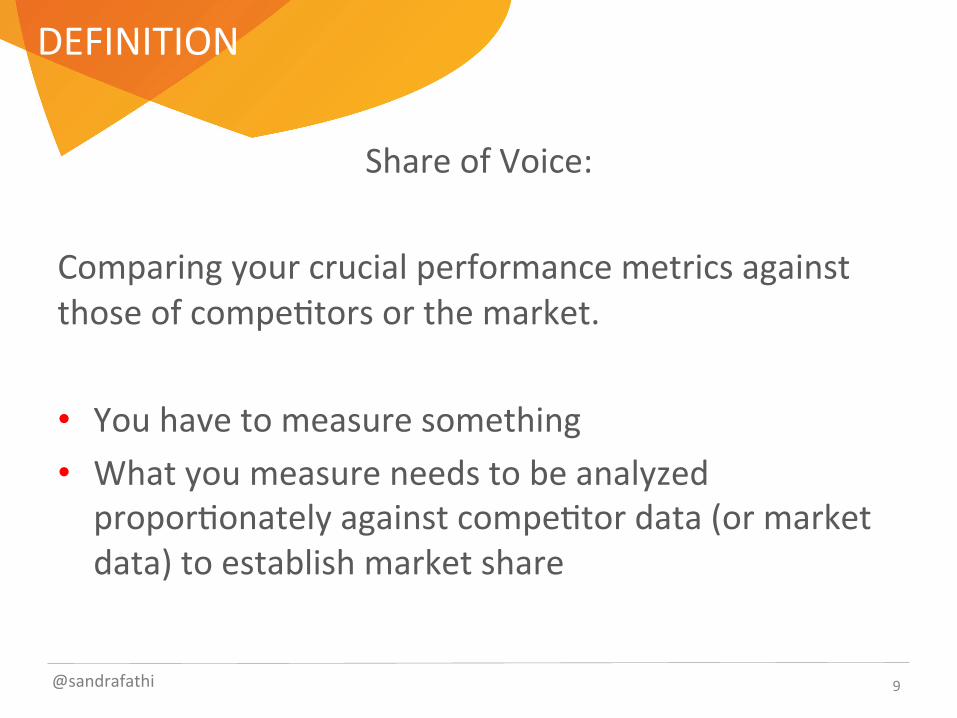
Share of Voice:
Comparing your crucial performance metrics against those of compeKtors or the market. • You have to measure something • What you measure needs to be analyzed proporKonately against compeKtor data (or market data) to establish market share
@sandrafathi 9
THE FORMULA
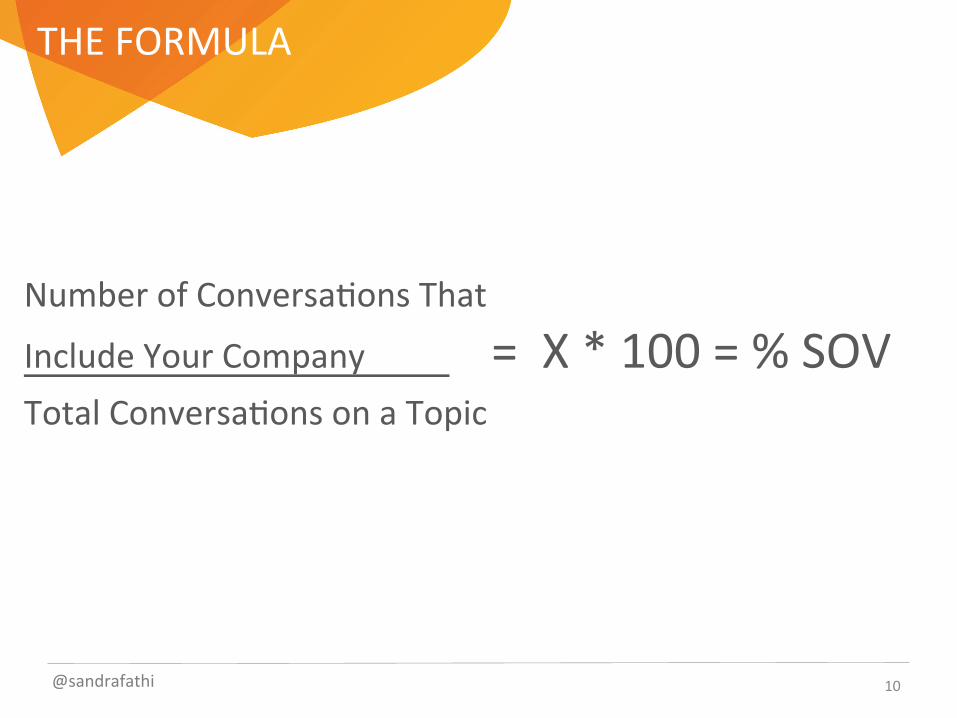
Number of ConversaKons That
Include Your Company = X * 100 = % SOV Total ConversaKons on a Topic
@sandrafathi 10
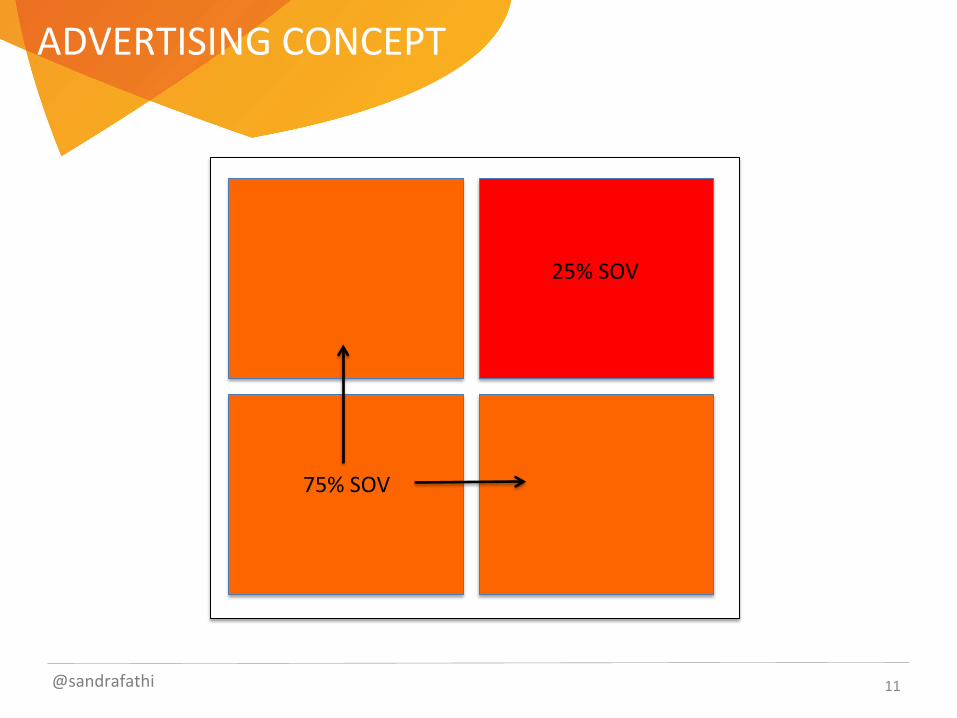
ADVERTISING CONCEPT
25% SOV
75% SOV
@sandrafathi 11
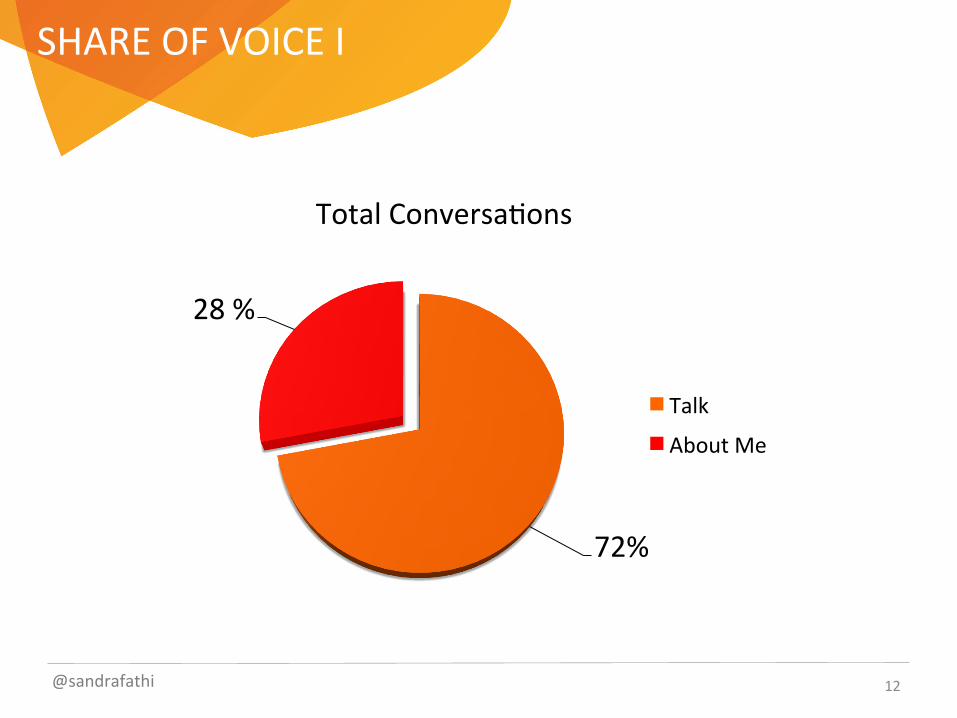
SHARE OF VOICE I
72%
28 %
Total ConversaKons
Talk
About Me
@sandrafathi 12
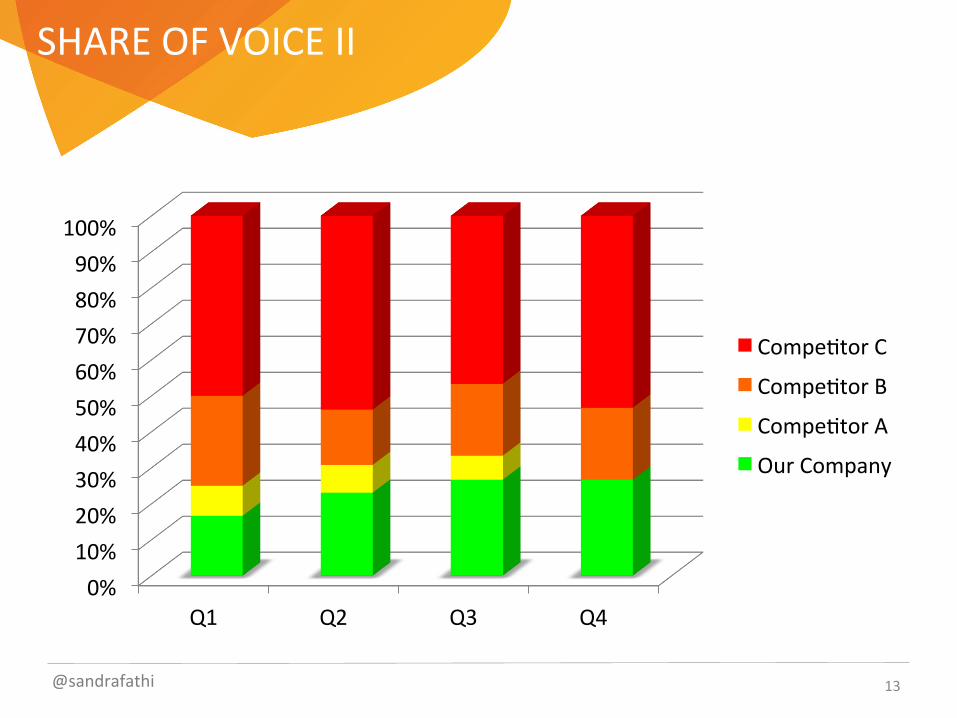
SHARE OF VOICE II
0% 10% 20% 30% 40% 50% 60% 70% 80% 90%
100%
Q1 Q2 Q3 Q4
CompeKtor C
CompeKtor B
CompeKtor A
Our Company
@sandrafathi 13
KEEP IN MIND
• Share of voice should be defined for a period of Kme (finite start and end).
• Share of voice is omen most useful when limited to a single planorm or medium. For example, business press coverage or TwiYer.
• Share of voice can be overwhelming if trying to look at too large a segment or industry. Try choosing SOV among top compeKtors or in key interest areas.
@sandrafathi 14
SOV: SOCIAL MEDIA ANALYTICS PLATFORMS
@sandrafathi 15
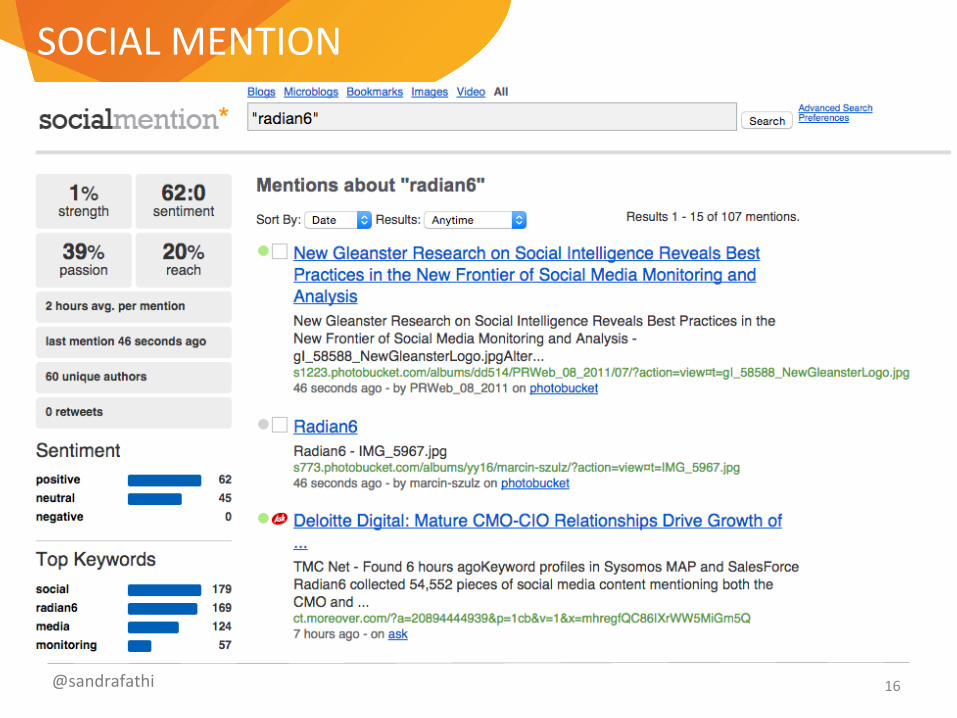
SOCIAL MENTION
@sandrafathi 16
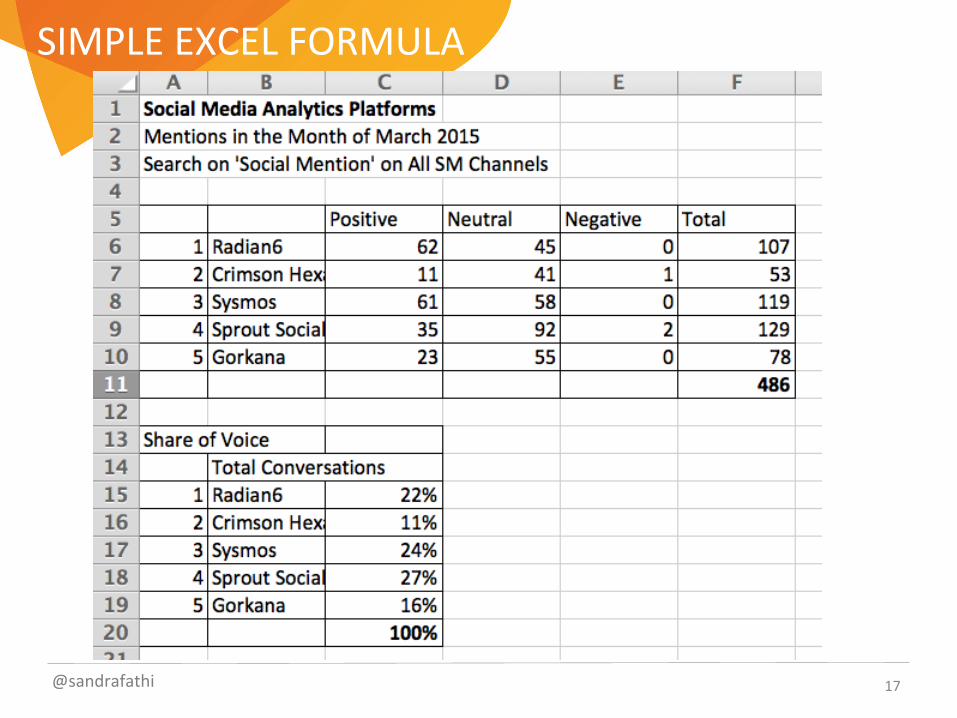
SIMPLE EXCEL FORMULA
@sandrafathi 17
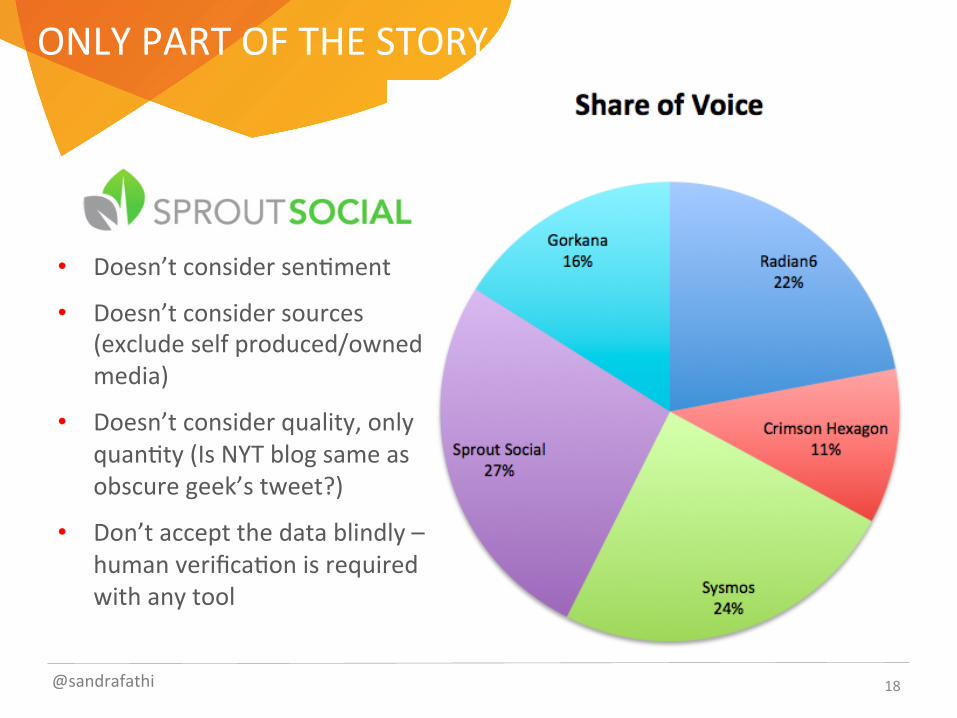
ONLY PART OF THE STORY
• Doesn’t consider senKment
• Doesn’t consider sources (exclude self produced/owned media)
• Doesn’t consider quality, only quanKty (Is NYT blog same as obscure geek’s tweet?)
• Don’t accept the data blindly – human verificaKon is required with any tool
@sandrafathi 18
OTHER APPLICATIONS & CONSIDERATIONS
ConsideraKons: • Apply senKment or tonal filters (posiKve/negaKve) • Apply qualitaKve measures (by Ker or by type)
ApplicaKons: • Industry trends/hot topics (i.e. SOV on cloud security) • Specific products or services • Broken down by geographic or demographic parameters
(i.e. SOV in 18-‐25 market)
@sandrafathi 19

PART II: COMPETITIVE BENCHMARKING
DEFINITION
CompeKKve Benchmarking:
The conKnuous pracKce of comparing a company’s pracKces and performance metrics against the most successful compeKtors in the industry. • You measure processes and results • You must idenKfy a ‘benchmark’ or indicator that will be
a unit of measure to compare • The desired outcome is to understand which processes
lead to greater success (best pracKces) in order to improve your company’s performance
@sandrafathi 21
COMPETITIVE BENCHMARKING
• IdenKfy my compeKKve set for comparison • Choose my units of measure: press coverage • Set parameters: top 20 business and trade • Define a Kme period: 6 months • Choose a tool (news monitoring service) or begin manual research
@sandrafathi 22
EXAMPLE: RADWARE
ObjecKve: • Build & Maintain Radware’s PosiKon as a Thought Leader on Security
• Maximize Radware’s Overall Public RelaKons Results Strategy: • Compare and Contrast Radware’s Press Release Output with Top 3 Security CompeKtors
• Analyze Results • Apply Best PracKces and Lessons Learned to Radware to Improve Overall Performance
@sandrafathi 23
EXAMPLE: RADWARE
Network Security CompeKtors
@sandrafathi 24
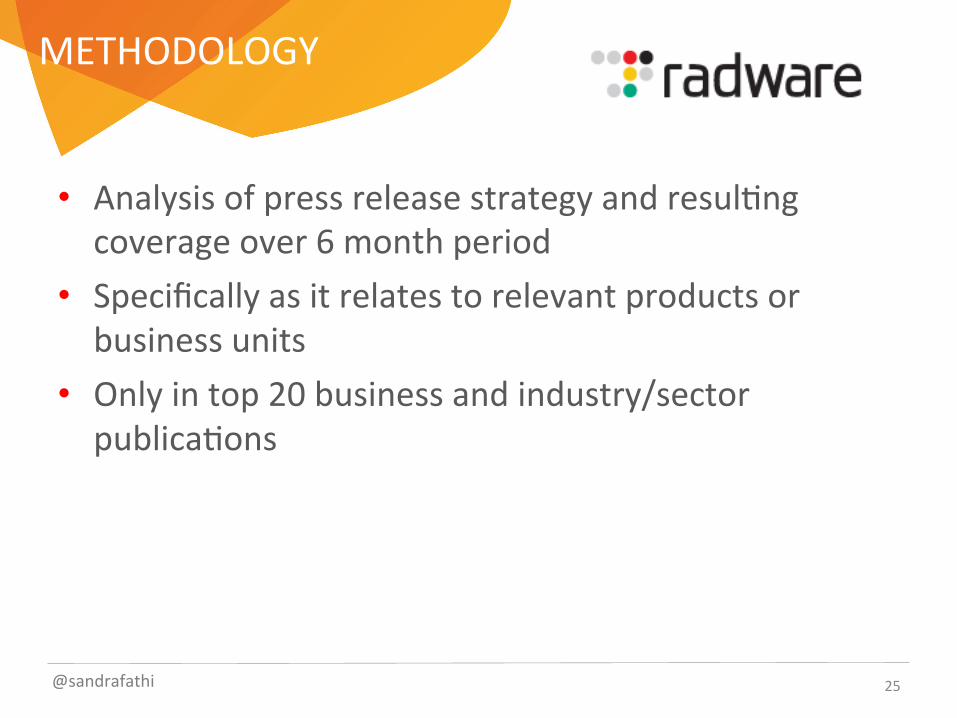
• Analysis of press release strategy and resulKng coverage over 6 month period
• Specifically as it relates to relevant products or business units
• Only in top 20 business and industry/sector publicaKons
METHODOLOGY
@sandrafathi 25
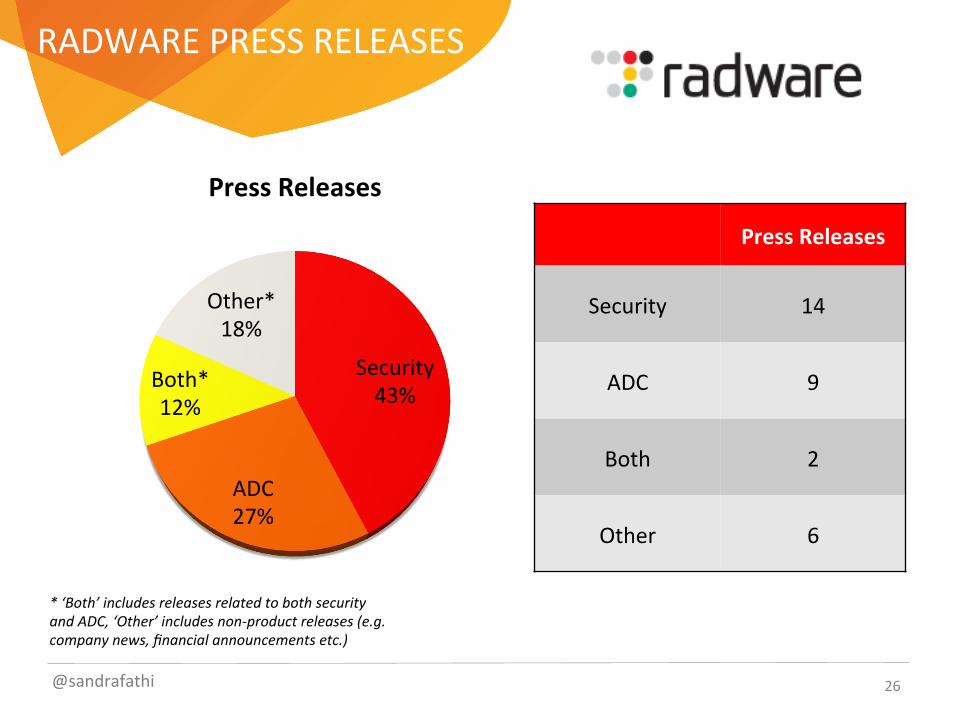
RADWARE PRESS RELEASES
Security 43%
ADC 27%
Both* 12%
Other* 18%
Press Releases
* ‘Both’ includes releases related to both security and ADC, ‘Other’ includes non-‐product releases (e.g. company news, financial announcements etc.)
Press Releases
Security 14
ADC 9
Both 2
Other 6
@sandrafathi 26
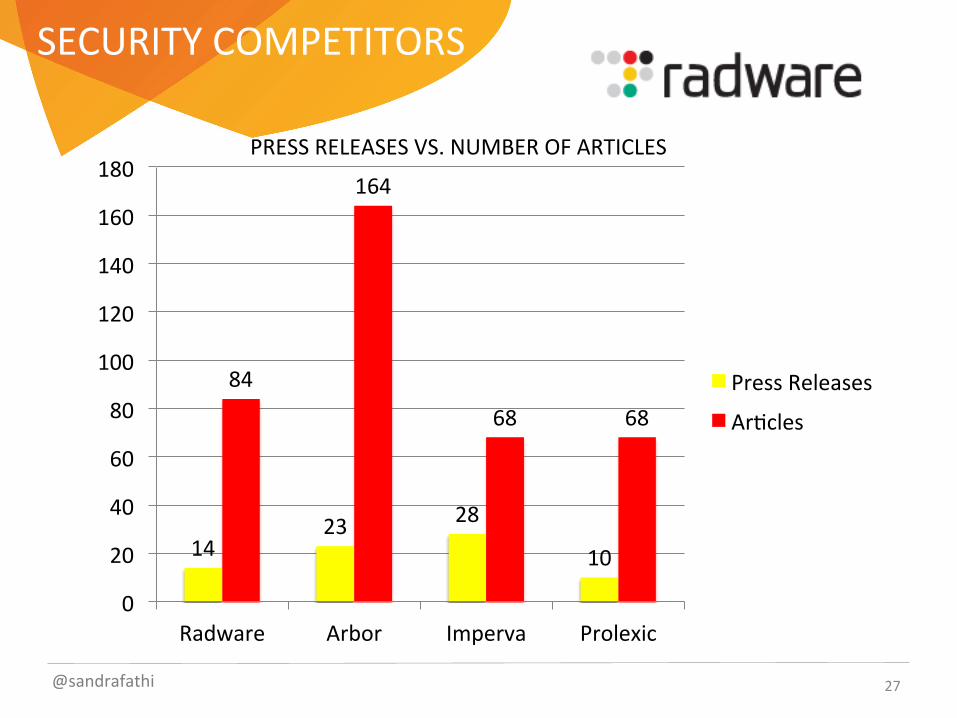
SECURITY COMPETITORS
14 23 28
10
84
164
68 68
0
20
40
60
80
100
120
140
160
180
Radware Arbor Imperva Prolexic
Press Releases
ArKcles
PRESS RELEASES VS. NUMBER OF ARTICLES
@sandrafathi 27
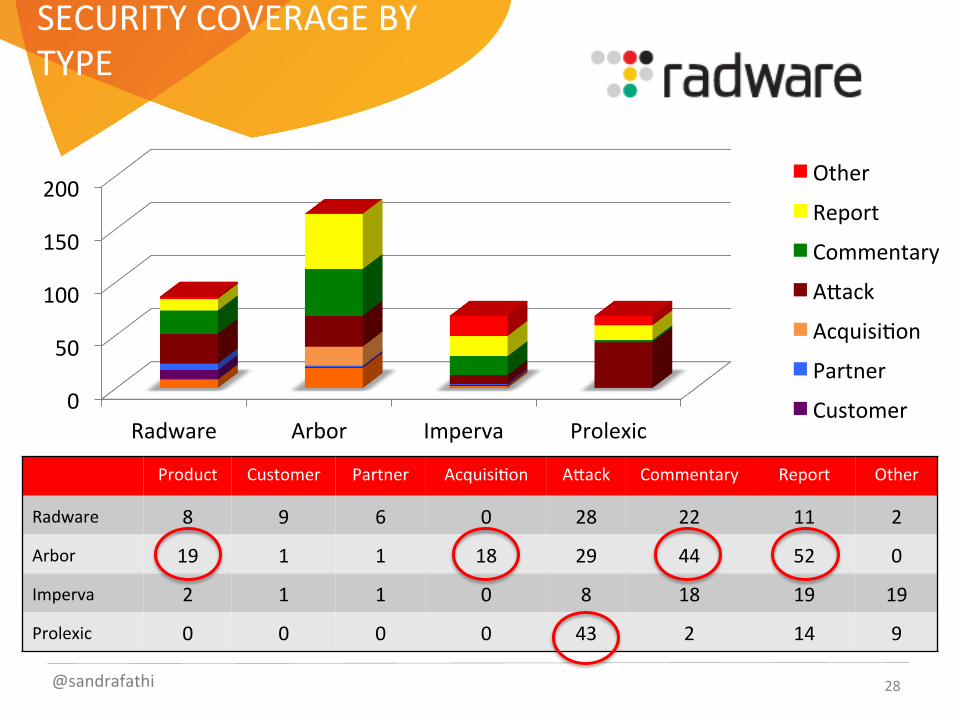
SECURITY COVERAGE BY TYPE
0
50
100
150
200
Radware Arbor Imperva Prolexic
Other
Report
Commentary
AYack
AcquisiKon
Partner
Customer
Product Customer Partner AcquisiKon AYack Commentary Report Other
Radware 8 9 6 0 28 22 11 2
Arbor 19 1 1 18 29 44 52 0
Imperva 2 1 1 0 8 18 19 19
Prolexic 0 0 0 0 43 2 14 9
@sandrafathi 28
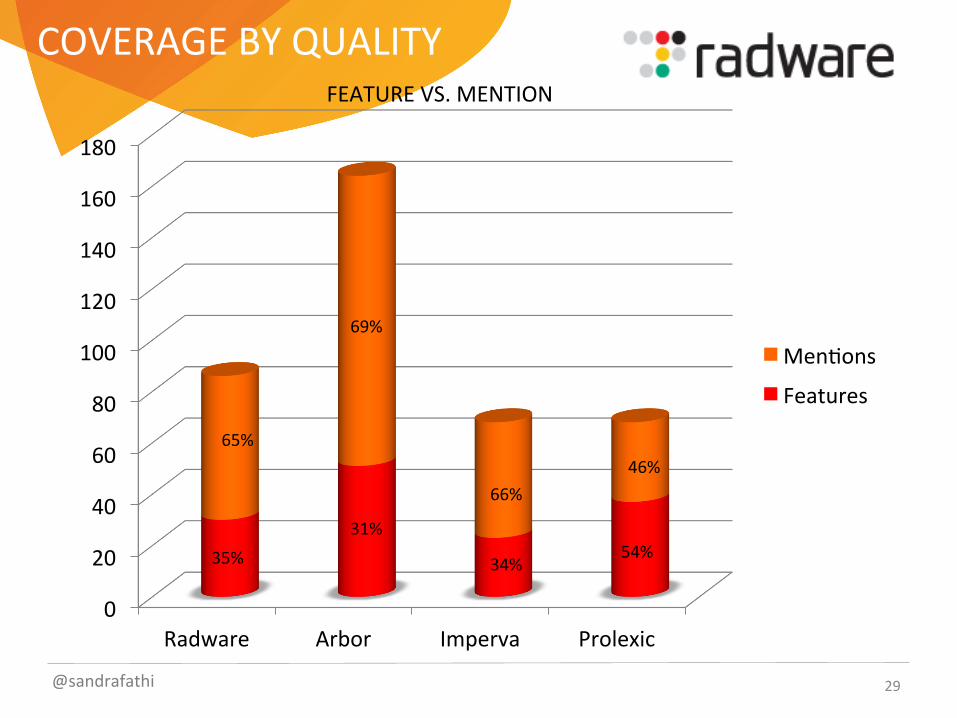
COVERAGE BY QUALITY
0
20
40
60
80
100
120
140
160
180
Radware Arbor Imperva Prolexic
MenKons
Features
35%
65%
31%
69%
34%
66%
54%
46%
FEATURE VS. MENTION
@sandrafathi 29
SECURITY CONCLUSIONS
• Radware is #2 in overall SOV but the quality is not as strong (more menKons vs. features)
• Leading customer and partner conversaKons (ValidaKon)
• Good job at Story Hijacking (responding to security hacks) but room for improvement (ValidaKon)
• CompeKtors winning at report coverage and commentary (Opportunity!)
@sandrafathi 30
CONSIDERATIONS
• Good for understanding what worked but not necessarily ‘how’ it worked
• Costs for research may outweigh benefits of insights • Once you’ve idenKfied the ‘best pracKces’ you may or may not be able to replicate them
• Consider non-‐compeKtor companies to benchmark • Do you want to ‘emulate’ or ‘innovate’?
@sandrafathi 31

PART III: CORRELATIONS
DEFINITION
CorrelaKon:
A mutual relaKonship, or interdependence, between two or more things. • In the absence of being able to prove ‘causality’ you may
be able to demonstrate a ‘correlaKon’ to demonstrate the impact of a PR or markeKng program
• A correlaKon is posiKve when the values of both variables increase together
• A correlaKon is negaKve when the value of one variable increases while the value of the other variable decreases
@sandrafathi 33
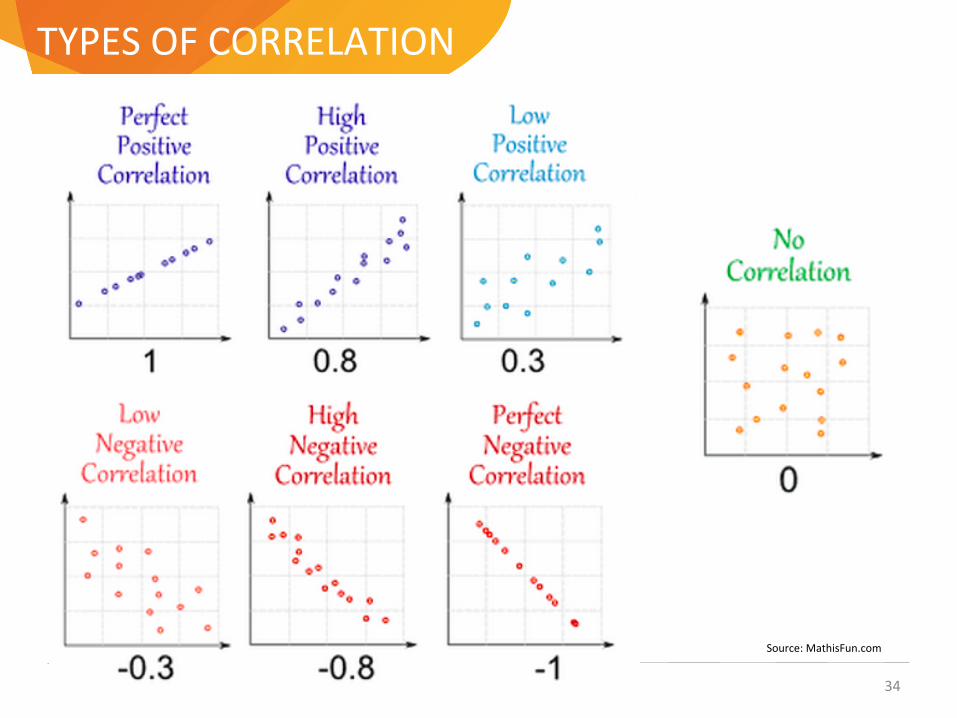
TYPES OF CORRELATION
Source: MathisFun.com
34
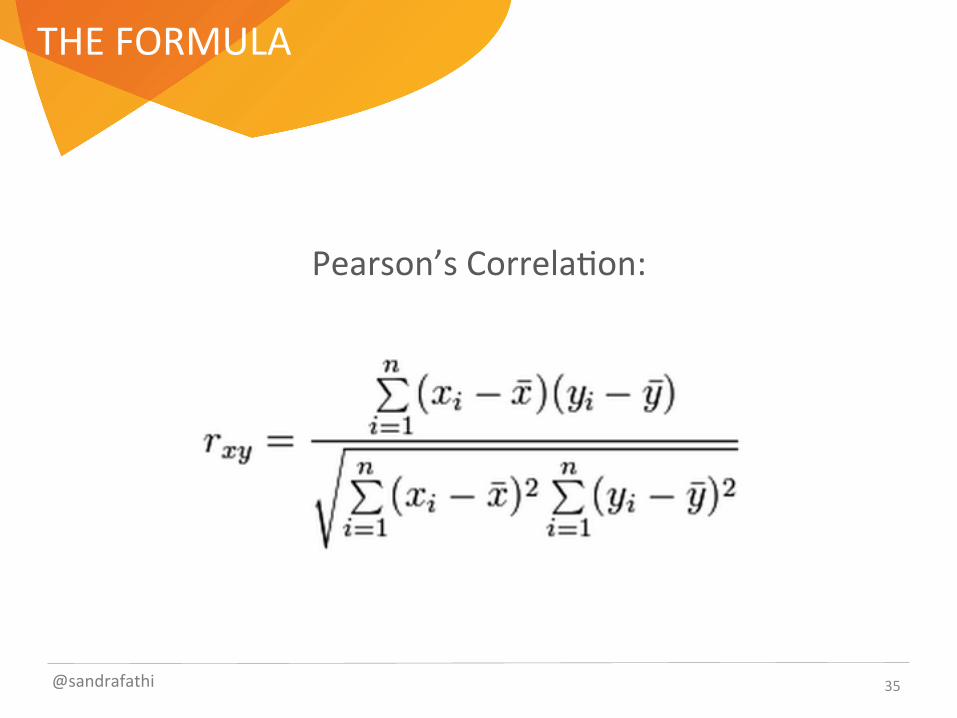
THE FORMULA
35
Pearson’s CorrelaKon:
@sandrafathi
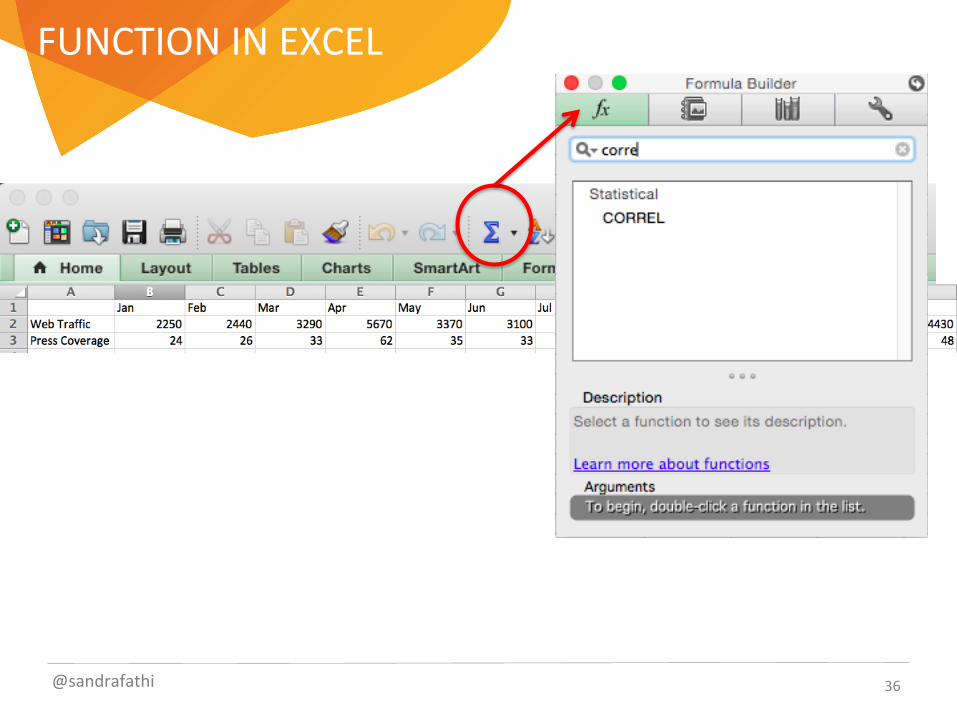
FUNCTION IN EXCEL
36 @sandrafathi
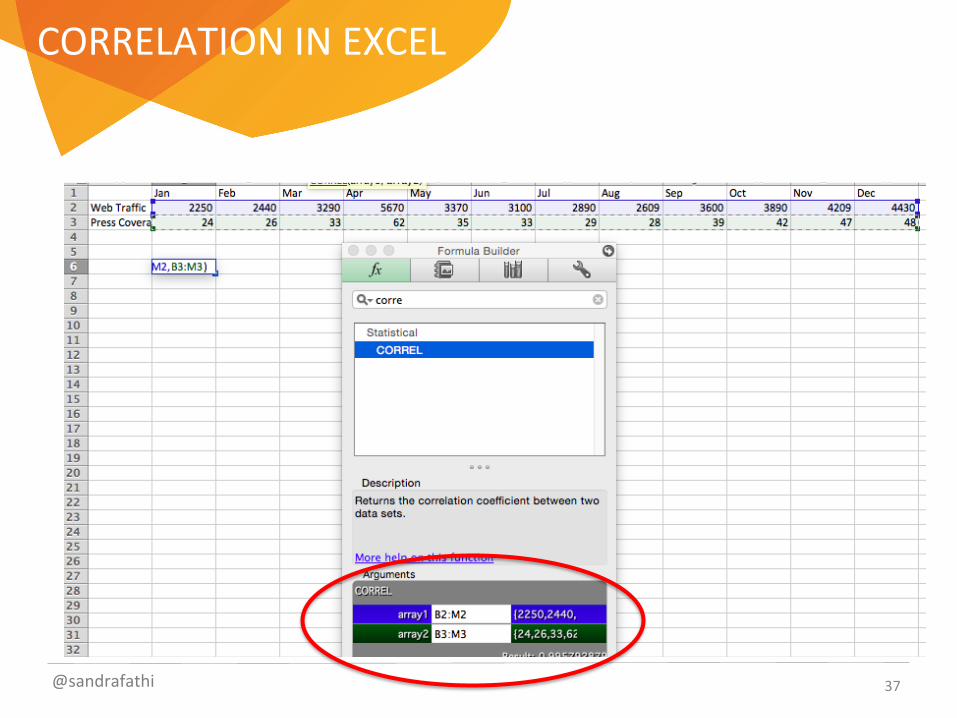
CORRELATION IN EXCEL
37 @sandrafathi

FUNCTION IN EXCEL
38 @sandrafathi
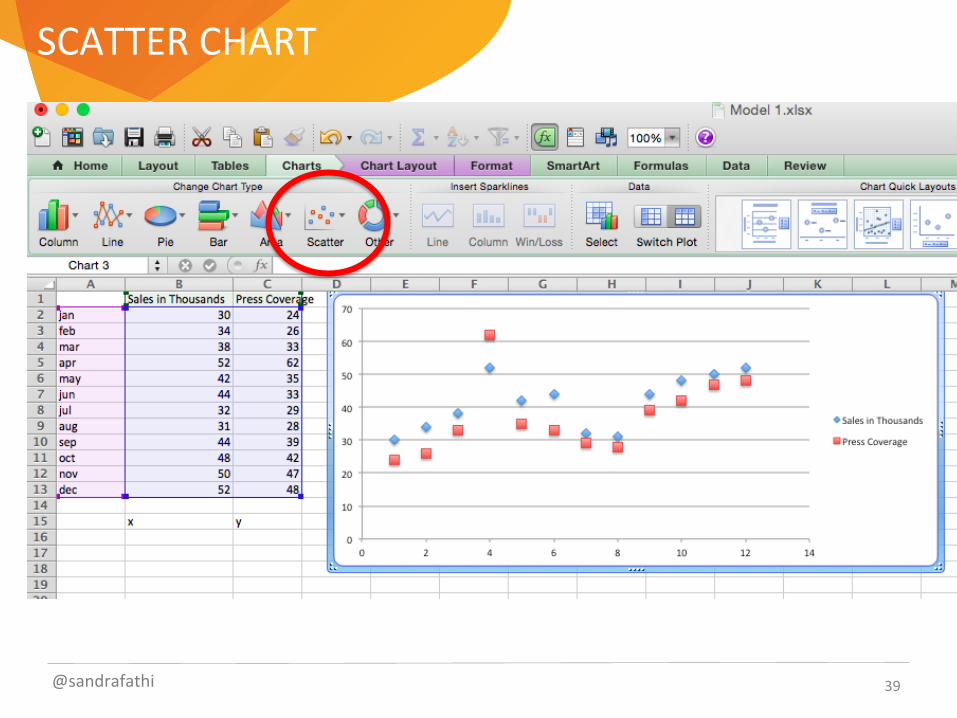
SCATTER CHART
39 @sandrafathi
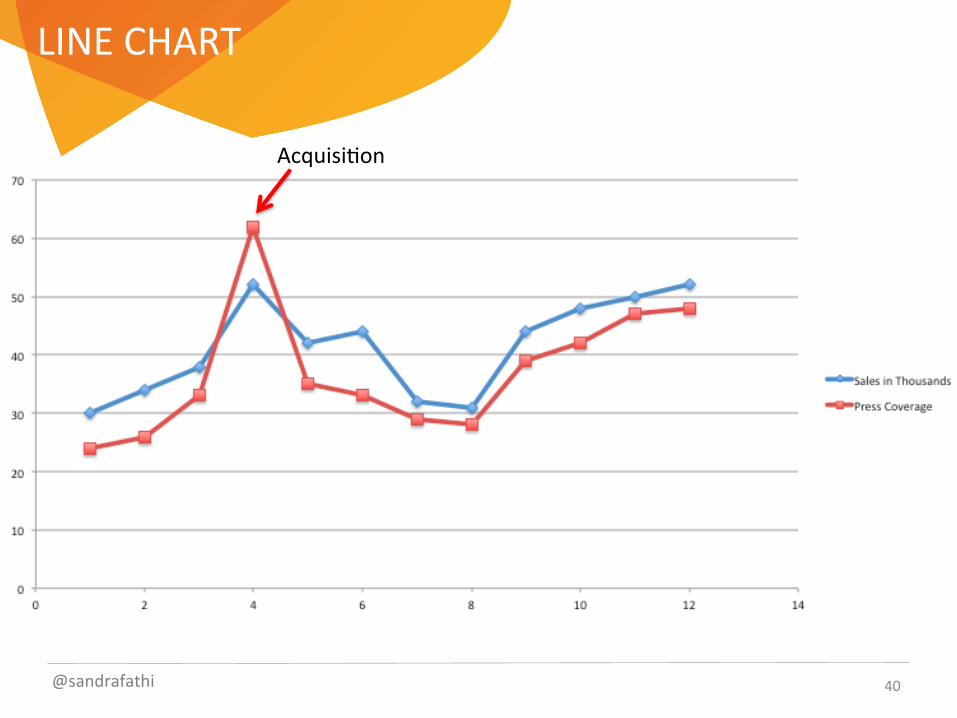
LINE CHART
40 @sandrafathi
AcquisiKon
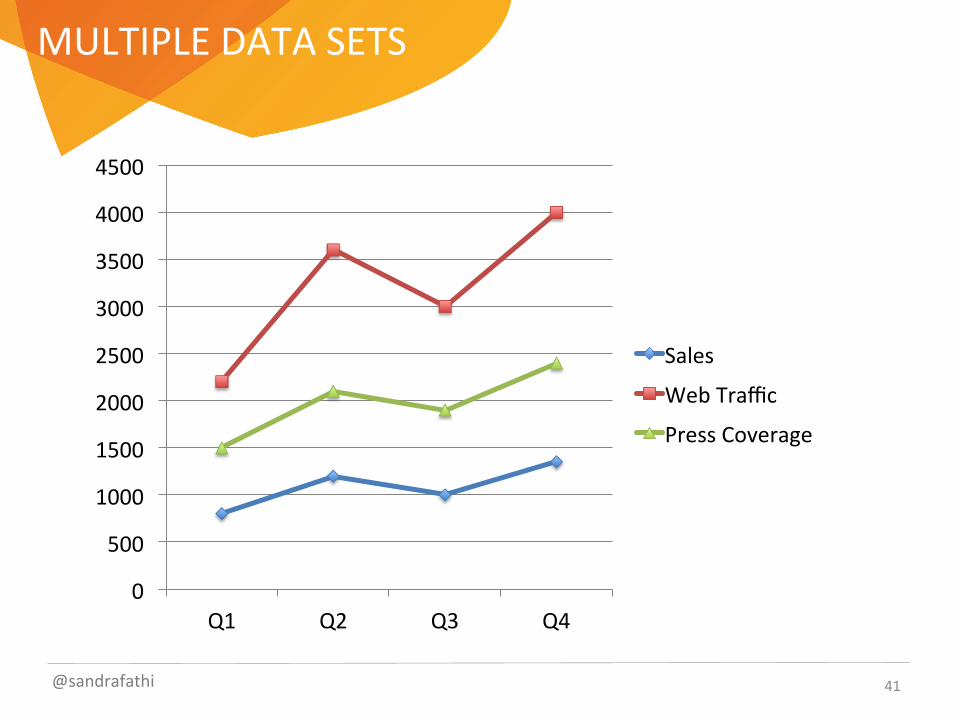
MULTIPLE DATA SETS
41 @sandrafathi
0
500
1000
1500
2000
2500
3000
3500
4000
4500
Q1 Q2 Q3 Q4
Sales
Web Traffic
Press Coverage
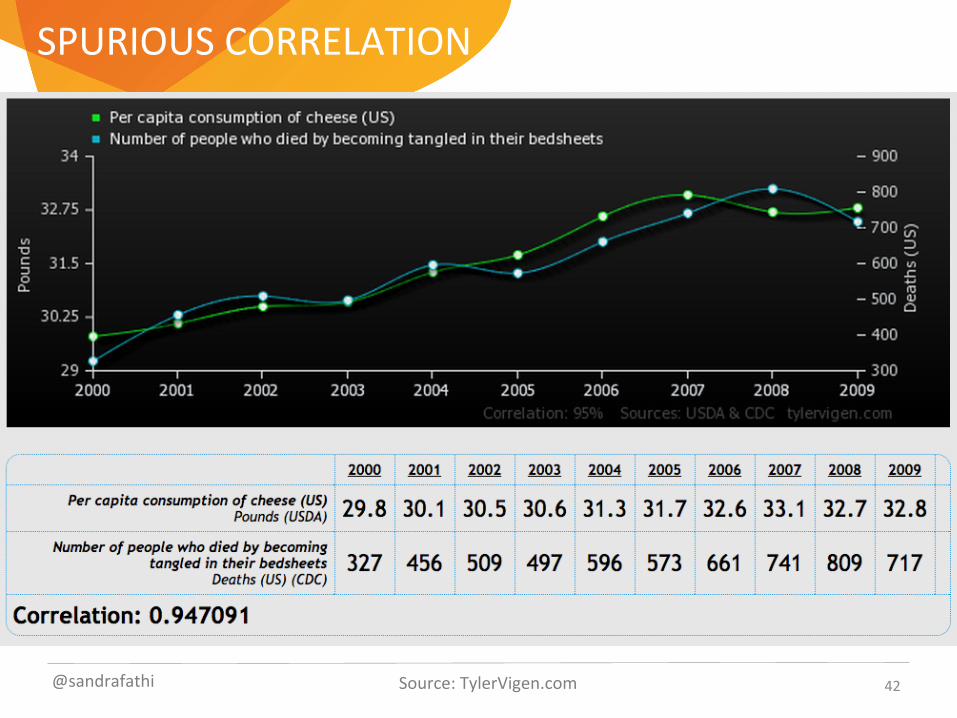
SPURIOUS CORRELATION
42 @sandrafathi Source: TylerVigen.com
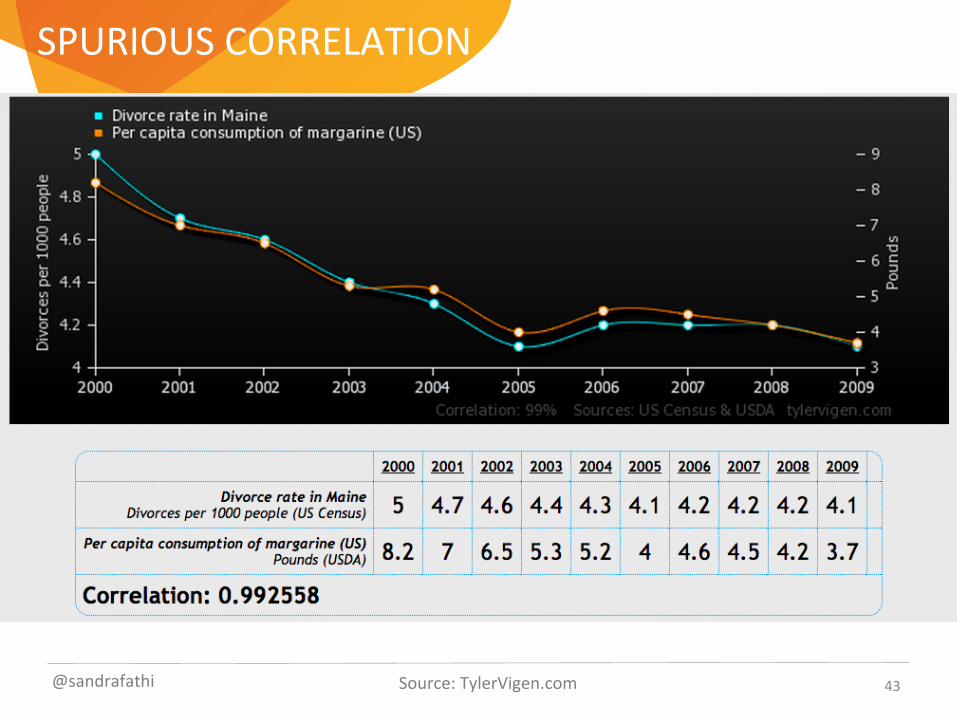
43 @sandrafathi Source: TylerVigen.com
SPURIOUS CORRELATION
CONSIDERATIONS
• User correlaKons cauKously and don’t trust the math blindly
• The visuals omen tell a story as well • Remember that correlaKon is not causality, it can only help as an indicator or potenKally predict probability
• Data is sKll beYer that your opinion
44 @sandrafathi
FINAL THOUGHTS
• In measurement, speak the language of the C-‐Suite • Excel is sKll the best dashboard for data visualizaKon • Don’t be afraid to learn that you are wrong • Don’t be afraid to change direcKon • Use the data to gain execuKve support
– Strategy – Resources – Headcount – Budget
45 @sandrafathi

THANK YOU
CONTACT:
Sandra Fathi President Affect @sandrafathi
web: affect.com blog: techaffect.com email: [email protected]
Slides: www.slideshare.net/sfathi