fear of isolation - university of limerick
TRANSCRIPT

Fear of Social Isolation: Testing an Assumption from the Spiral of Silence
Pamela J. Shoemaker Michael Breen
Marjorie Stamper
Corresponding Author: Michael Breen Media & Communication Studies,
Mary Immaculate College, University of Limerick, South Circular Road,
Limerick
Pamela J. Shoemaker is the John Ben Snow Professor in the Newhouse School of Public Communication, Syracuse University. Michael Breen is
Head of Media & Communication Studies, Mary Immaculate College, University of Limerick. Marjorie Stamper is a doctoral candidate in the
Newhouse School.

FEAR OF ISOLATION 2
ABSTRACT
Fear of Social Isolation: Testing an Assumption from the Spiral of Silence
An untested assumption of the Spiral of Silence has been whether people’s
fear of social isolation affects their willingness to voice their opinions in public,
especially if their opinions are in the minority. It has also been unclear
whether this should be antecedent to opinion formation or intervening
between opinions and willingness to voice the opinions. This study is
intended to explicate and operationalize fear of social isolation and, through
the use of path analysis, to determine whether it is more logically antecedent
or intervening. The results were mixed, with limited support for the Spiral of
Silence theory. The path diagrams show that fear of negative evaluation (the
operationalization of fear of social isolation) is negatively related to the
individual’s opinion, whether the concept is antecedent or intervening. But
the fear variable is not related to willingness to voice one’s opinion,
suggesting that it may not therefore be an intervening variable.
FEAR OF ISOLATION 3 Although Elisabeth Noelle-Neumann’s Spiral of Silence Theory (1984)
has been regarded as a basis for studying changes in public opinion, a major
assumption in the theory — that people fear social isolation and therefore are
hesitant to voice their unpopular opinions — has been given little empirical
testing. Although Noelle-Neumann (1977) has conducted field experiments
and surveys in which fear of isolation was manipulated, other scholars’ work
has taken fear of isolation as an assumption.
This study is designed specifically to test the fear of isolation
assumption and to explore its position in the Spiral of Silence model. It has
been unclear from the literature whether fear of isolation is antecedent to
opinion formation and dominant opinion assessment or an intervening
variable between opinion formation and willingness to voice the opinion. Path
analyses are used to empirically investigate the relationship of the fear of
isolation variable to other variables in the model.
The study helps determine the importance of fear of isolation in the
overall Spiral of Silence model. Several studies (e.g., Glynn & McLeod, 1984;
Katz & Baldassare, 1992; Shamir, 1995) have found little or no support for the
Spiral of Silence theory, but these did not include fear of isolation as a
variable. We hope that measuring fear of isolation and including it in
hypothesis testing will help move the development of the theory.
THEORY
FEAR OF ISOLATION 4 The Spiral of Silence is Noelle-Neumann’s attempt to explain public
opinion as a dynamic process. It has been an important theory, because
previous theoretical work had studied public opinion as a static concept,
looking at interrelationships between public opinion and other variables at one
point in time. Noelle-Neumann (1984) hypothesizes that public opinion
changes across time in relationship to people’s monitoring of the “climate of
opinion.”
According to the theory, if the majority of people hold an opinion
opposite mine, then I may be hesitant to voice my opinion in public. This is
especially true if I perceive that my opinion is likely to lose more support in the
future.
Thus, if people who have opinions similar to mine also do not speak
out in public, I will observe a decreasing amount of publicly voiced support for
my opinion. Over time, I perceive that support for my opinion spirals
downward, hence the name of the theory. It is not clear, however, whether
the downward spiral represents only a decline in public support for an opinion
or an actual shift in private opinions, i.e., that I have actually changed my own
opinion to be consistent with the dominant opinion.
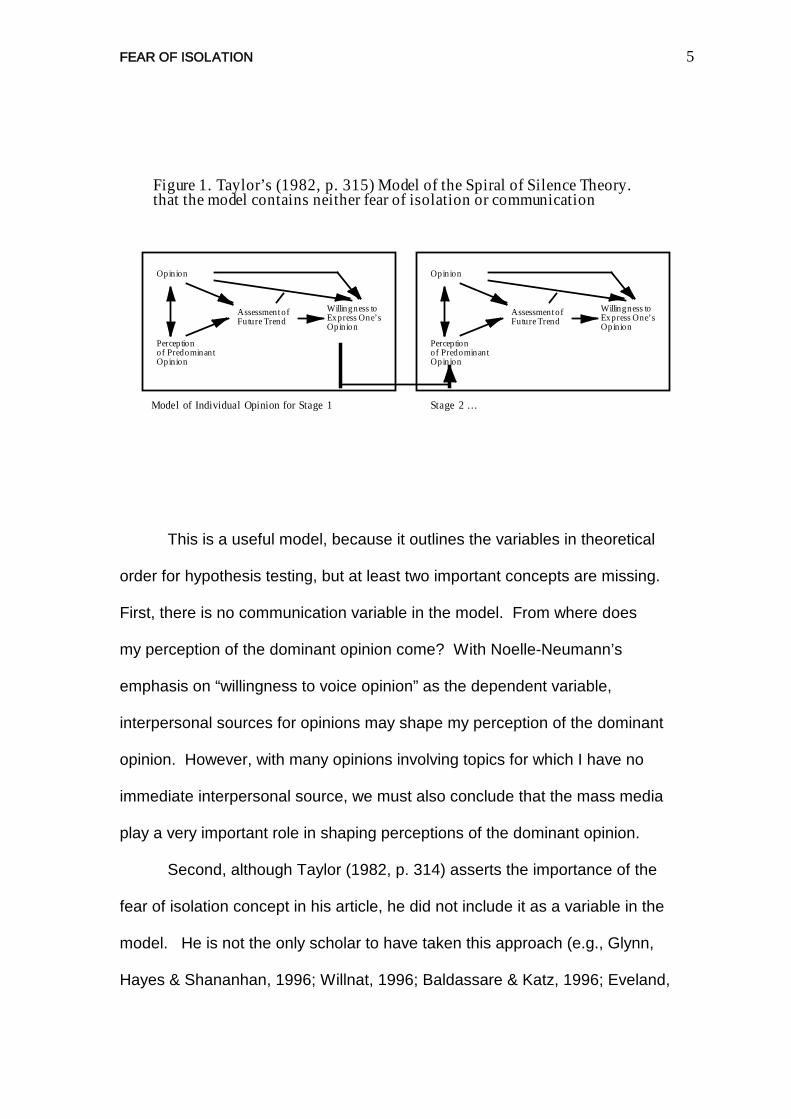
Figure 1 shows this process in a model by Garth Taylor (1982, p. 315).
Taylor specifies the theory as consisting of four variables at two or more time
periods: (1) individual’s opinion, (2) individual’s perception of predominant
opinion, (3) individual’s assessment of future trend concerning the opinion,
and (4) individual’s willingness to express her/his opinion public.
FEAR OF ISOLATION 5
Opinion
Perceptionof PredominantOpinion
Assessment ofFuture Trend
Willingness toExpress One’sOpinion
Opinion
Perceptionof PredominantOpinion
Assessment ofFuture Trend
Willingness toExpress One’sOpinion
Model of Individual Opinion for Stage 1 Stage 2 . . .
Figure 1. Taylor’s (1982, p. 315) Model of the Spiral of Silence Theory.that the model contains neither fear of isolation or communication
This is a useful model, because it outlines the variables in theoretical
order for hypothesis testing, but at least two important concepts are missing.
First, there is no communication variable in the model. From where does
my perception of the dominant opinion come? With Noelle-Neumann’s
emphasis on “willingness to voice opinion” as the dependent variable,
interpersonal sources for opinions may shape my perception of the dominant
opinion. However, with many opinions involving topics for which I have no
immediate interpersonal source, we must also conclude that the mass media
play a very important role in shaping perceptions of the dominant opinion.
Second, although Taylor (1982, p. 314) asserts the importance of the
fear of isolation concept in his article, he did not include it as a variable in the
model. He is not the only scholar to have taken this approach (e.g., Glynn,
Hayes & Shananhan, 1996; Willnat, 1996; Baldassare & Katz, 1996; Eveland,
FEAR OF ISOLATION 6 McLeod, & Signorielli, 1995; Katz & Baldassare, 1994; Katz & Baldassare,
1992; Kennamer, 1990; Glynn & McLeod, 1984). Other than Noelle-
Neumann’s experimental approaches to manipulating levels of fear of
isolation, it seems that researchers have mostly been content to assume that
the downward spiral of opinion is due to a fear of social isolation without
actually testing it. As Glynn & McLeod (1984) suggest, the theory may be
improved if fear of isolation were measured and used as a variable, rather
than being an assumption. Noelle-Neumann (1984, p. 42) has herself argued
for operationalizing fear of isolation.
Fear of Isolation
In her 1984 book, The Spiral of Silence, Noelle-Neumann introduces
the fear of isolation concept as one of two motives for why we imitate other
people. (The other motive is learning.) This is in response to the results of
1950s experiments by Solomon Asch (1951, 1952) in which subjects were
swayed by experimental confederates to give clearly incorrect responses to
questions involving the length of lines.
Noelle-Neumann found in these experiments the theoretical linkage for
her theory: To study changes in public opinion, we must look at changes in
individual opinions over time. What might cause someone to change an
opinion? Either that something new has been learned about the opinion
object or that the person feels a need to express opinions consistent with
those of other people. While learning has been used as an explanation for

FEAR OF ISOLATION 7 imitation, it is the latter explanation that forms the basis for the fear of
isolation concept.
To fear social isolation is to need to agree with other people, an idea
she cites from Gabriel Tarde (1969). Noelle-Neumann (1984) says that there
is a “social nature” of human beings that is separate from just using learning
as an explanation for imitation. “Our social nature causes us to fear
separation and isolation from our fellows and to want to be respected and
liked by them” (p. 41).
In her early studies, Noelle-Neumann (1977) defines public opinion as
“pressure to conform,” and her theory’s first two theses demonstrate the role
that fear of isolation plans in the Spiral of Silence.
1. As social beings, most people are afraid of becoming isolated from their environment. They would like to be popular and respected. 2. In order to avoid becoming isolated and in order not to lose popularity and esteem, people constantly observe their environment very closely. They try to find out which opinions and modes of behavior are prevalent, and which opinions and modes of behavior are becoming more popular. They behave and express themselves accordingly in public (p. 144).
When a person’s opinion is perceived to be in the majority, the person
may speak out in public without fear of losing popularity or self esteem. If the
converse is true, the person may elect to remain silent, avoiding situations in
which the person will be in a confrontational or embarrassing situation, such
as when one’s opinion is laughed at or criticized by others.
The problem is that no one has thus far tested the theory with fear of
isolation as a measured variable rather than an assumption. To do so
requires the explication of the construct fear of social isolation into
FEAR OF ISOLATION 8 dimensions or indicators that can be separately measured. Also, when
studying fear of isolation as a variable, we must distinguish between its
effects on opinions held and its effects on willingness to express opinions.
Any empirical test using the fear of isolation as a variable should be able to
say something about how and whether fear of isolation affects each. Noelle-
Neumann writes: “We assume that the normal individual’s fear of isolation
sets the spiral of silence in motion, and the Asch experiment shows for a fact
that this fear can be substantial” (1984, p. 40). This implies that fear of
isolation might be an antecedent variable in a model of the complete theory
(Glynn & McLeod, 1984). Yet others (Kennamer, 1990) believe that fear of
isolation intervenes between the establishment of the opinions and the
individual’s willingness to express the opinion.
Social Anxiety
The psychological literature on social anxiety suggests some
possibilities. Monfries and Kafer (1994) make a connection between self-
consciousness and a fear of being negatively evaluated by others. Cognitive
deficits (negative cognitions about one’s self) have been shown to be related
to internal attributions for failures (Beidel, Turner, & Dancu, 1985; Halford &
Foddy, 1982) and to negative self evaluations (Cacioppo, Glass, & Merluzzi,
1979; Jones & Briggs, 1984). Socially anxious people, such as those who
may fear social isolation, have been shown to hold negative self images
(Schlenker & Leary, 1982; Leary & Atherton, 1986).

FEAR OF ISOLATION 9 The negative self images probably come from the individual’s
perfectionistic expectations for themselves, although with a life-time of
experiences that demonstrate otherwise (Higgins, 1987; Higgins, Bond, Klein,
& Strauman, 1986). As the individual monitors the difference between her or
his schemata of an idealized performance and memories of actual or
anticipated less-than-perfect performances, the individual becomes
increasingly self-conscious.
Two types of self-consciousness have been assessed — public and
private. Public self-consciousness is closest to the idea of fear of isolation.
The individual monitors many elements of the self (not just opinions) that
others can and see and evaluate (Monfries & Kafer, 1994; Buss, 1980).
Public, but not private self-consciousness, has been found related to social
anxiety (Buss, Cheek & Buss, 1981).
Watson and Friend (1969) have developed a scale for measuring
social anxiety — the Fear of Negative Evaluation (FNE). It measures social
anxiety stemming from public self-consciousness, including apprehension
about what others think (Monfries & Kafer, 1994). Watson and Friend (1969,
p. 449) define fear of negative evaluation as “apprehension about others’
evaluations, distress over their negative evaluations, avoidance of evaluative
situations, and the expectation that others would evaluate oneself negatively.”
They go on to say that “fear of loss of social approval would be identical to
FNE” (p. 449). As these definitions of FNE indicate, it is very close to Noelle-
Neumann’s definition of fear of social isolation. Therefore the FNE scale will

FEAR OF ISOLATION 10 be adapted for this study and used to operationally define fear of social
isolation.
Hypotheses
The purpose of this study is to examine the role of an operationalized
fear of isolation variable in a model of the Spiral of Silence theory. Is there
more support for using it as an antecedent variable or one which intervenes
between opinion assessments and willingness to voice the opinion, as
suggested by Kennamer (1990)?
H1. The more a person fears negative evaluation, the less
discrepancy there will be between the person’s opinion and perception of the
predominant opinion. If fear of isolation is antecedent to opinion formation,
then we should expect that, in a dynamic public opinion system, over time the
person’s own opinion should move closer to the predominant opinion.
Therefore, at one point in time, there should be a positive relationship
between fearing and holding the majority opinion. We assume that we not
entering a discussion about the opinion subject at the beginning, but rather
that at the time of the survey the opinion subject has already been under
public discussion for some time. The more a person fear’s social isolation,
the more that person’s opinion should move toward the predominant opinion
over time. In this scenario, fear of isolation impacts opinion formation directly.
It impacts willingness to voice the opinion through other variables in the
model.
FEAR OF ISOLATION 11 The discrepancy of opinion is the difference between the individual’s
private opinion and the individual’s perception of the predominant opinion on
a specific topic. Fear of isolation is defined as a person’s fear of being
negatively evaluated by others.
H2. The more a person fears negative evaluation, the less likely he or
she will be to discuss a minority opinion. If fear of isolation is intervening, we
should observe this relationship. Opinions are formed and then the person
considers his or her fear of social isolation. Fear will then mediate the
relationship between opinions and willingness to voice opinions. A minority
opinion is one which the individual perceives to be supported by less than half
of the public; a majority opinion is one perceived to be supported by half or
more of the public.
In addition, the study aims to look at an inference of making fear of
isolation an assumption in the theory — that it applies to everyone and is
therefore a nonvariable. We already know that some “hard-core” people do
not seem to fear being in the minority. However, in this study, it would be
reassuring to see that there is substantial variance among respondents in
their fear of negative evaluation. This would allow for the “hard-core”
supporters of minority opinions, as well as for those who feel a stronger need
to socially conform. Treating fear of isolation as an assumption does not
allow for such variability.
METHOD A telephone survey of adults 18 years and older was conducted in a
mid-size Eastern U.S. city ; 403 interviews were completed. Graduate
FEAR OF ISOLATION 12 students in two classes acted as supervisors and interviewers in a centralized
telephone facility. Telephone numbers were selected at random from a CD-
ROM directory of the area’s telephone numbers (SelectPhone CD-ROM
Northeast, 4th quarter, 1994). The procedural response rate was .77.
Opinion Variables
Individual’s opinion — “Women should have the right to a legal
abortion.” Responses were to a 5-point Likert scale, with 5 indicating
“strongly agree.”
Individual’s perception of the predominant opinion — “Thinking about
the people you normally socialize with, would most of them strongly agree,
agree, be neutral, disagree or strongly disagree that women should have the
right to a legal abortion? Responses were to the same Likert scale.
Discrepancy of opinion — Absolute difference between the above two
Likert scales . The minimum value of the scale is 0, indicating perfect
agreement between the individual’s opinion and the individual’s perception of
the predominant opinion. A value of 4 indicates the most difference.
Willingness to express individual’s opinion — “Now I want to come
back to the abortion issue for a moment. If you were at a social gathering and
people there were discussing abortion, how likely would you be to enter into
the conversation if their views on abortion were different from your own?
Would you be very likely [5], likely, neutral, unlikely, very unlikely [1]?”
(adapted from Glynn & McLeod, 1984, p. 55).

FEAR OF ISOLATION 13 Fear of Negative Evaluation Variables
The complete scale as developed by Watson & Friend (1969) has 30
items. We were unable to use that many items on our omnibus
questionnaire, so we selected six items that seemed most appropriate to the
fear of social isolation. Five items were measured on a 5-point Likert scale,
with 5 as strongly agree; one item was reverse coded.
• “I worry about seeming foolish to others.”
• “I worry about what people will think of me even when I know it
doesn’t make any difference.”
• “I become tense and jittery if I know someone is sizing me up.”
• “Other people’s opinions of me do not bother me.” [reverse coded]
• “When I am talking to someone, I worry about what they may be
thinking about me.”
• “I often worry that people who are important to me won’t think very
much of me.”
The scale yielded a Cronbach’s alpha coefficient of .81.
Media use variables
Television exposure — The product of the number of days a week R
watches television and the number of minutes per day television is watched.
Television news exposure — “On days when you watch TV, about how
much time do you spend watching news or public affairs programs?” Coded
in minutes.

FEAR OF ISOLATION 14 Other television exposure — “Now I’d like to ask you how often you
watch different types of TV programming. In an average week, how many
days do you watch . . . (Coded in days per week.)
• Morning news programs
• National network news
• Local news
• News magazine shows
• Talk shows
• Tabloid TV news like A Current Affair
• Public TV news shows like the McNeil-Lehrer News Hour
Newspaper exposure — The product of the number of days a week R
reads a daily local newspaper and the number of minutes per day spent
reading the newspaper.
National newspaper exposure — The product of the number of days a
week R reads daily national newspapers and the number of minutes per day
spent reading national newspapers.
Newsmagazine exposure — “Now I want to ask about other news
sources you might use. In an average week, about how many news
magazines do you read?”
Radio talk show exposure — “What about radio? In an average week,
how many days do you listen to a radio talk show?”
National radio news exposure — “In an average week, how many days
do you listen to a public radio news program, like NPR’s Morning Edition or All
Things Considered?”
FEAR OF ISOLATION 15
RESULTS
As Table 1 shows, there is similarity between the individual’s opinion
and the individual’s perception of the predominant opinion, with both showing
support for a woman’s right to a legal abortion. Thus, there was minimal
discrepancy between the two opinion variables, yielding an opinion
discrepancy score of only .74. Respondents were also willing to express
their opinions to others.
The Fear of Negative Evaluation index, which is the operationalization
of the fear of social isolation construct, is also shown on Table 1. When the
six items were added, they formed a reliable index (Cronbach’s alpha = .81).
Means and standard deviations for media use variables are shown on
Table 2. Respondents watch about 2.5 hours of television per day, with one
hour spent watching news. They also spend one-half hour per day reading
local newspapers.
Table 2 shows Pearson correlation coefficients for the opinion and
Fear of Negative Evaluation items. Individuals’ opinions were positively
correlated with their perceptions of the predominant opinion (r = .52). The
more a person supported a woman’s right to a legal abortion, the more the
person perceived that most others also supported abortion.
In addition, perception of the predominant opinion was positively
correlated with the person’s willingness to voice an unpopular opinion. The
more support a person thinks there is for abortion, the more willing the person
is to voice her/his own opinion in public (r = .15)

FEAR OF ISOLATION 16 Hypothesis 1 stated that the more a person fears negative evaluation,
the less discrepancy there will be between the person’s opinion and
perception of the predominant opinion. As Table 3 shows, this is not
supported. The correlation between the discrepancy of opinion (absolute
value of the difference between the individual’s opinion and the individual’s
perception of predominant opinion) and any of the Fear of Negative
Evaluation items never exceeds -.09 and is not statistically significant.
The FNE index is, however, negatively correlated (r = -.11, p < .05)
with the person’s opinion, indicating that the less fearful a person is of
negative evaluation, the more the person supports a woman’s right to a legal
abortion. The same is true of the index item “worry about seeming foolish;”
it is negatively correlated with the individual’s opinion at -.13 (p < .01). The
less a person worries about seeming foolish, the more the person supports
the abortion item.
Hypothesis 2 stated that the more a person fears negative evaluation,
the less likely the person will be to voice her/his opinion in public. Table 3
indicates no support for the hypothesis.
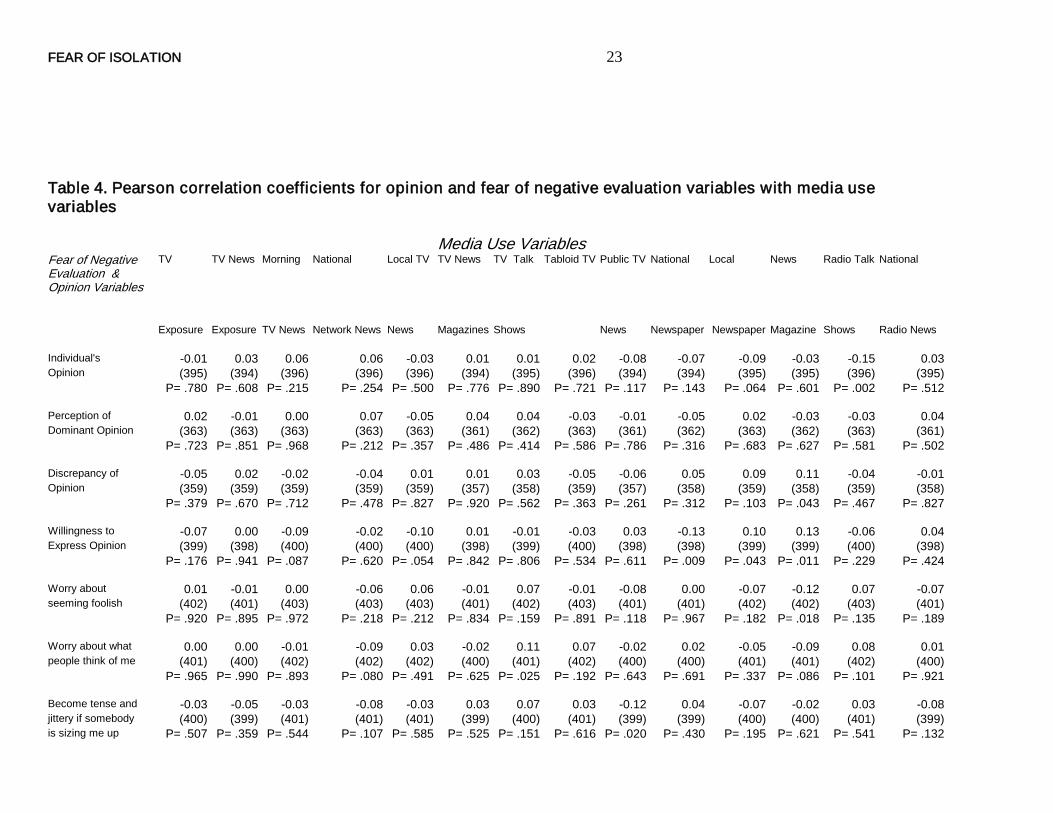
We were also interested in whether media use variables would be
related to the opinion and FNE variables. As Table 4 shows, there are only a
few statistically significant coefficients, possibly indicative of Type I error
rather than meaningful relationships. The FNE index negatively correlates
with two of the fourteen media variables — watching national TV network
news and watching public television news. The more fearful a person is, the
less she or he watches these types of shows.
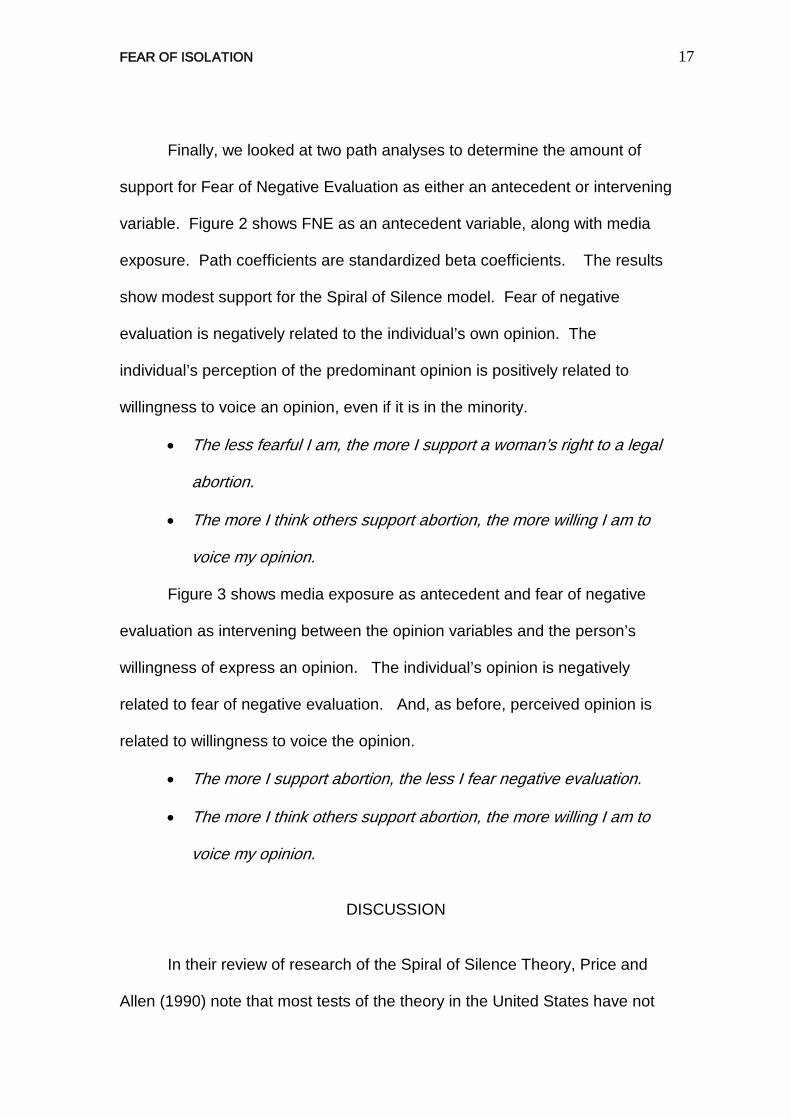
FEAR OF ISOLATION 17 Finally, we looked at two path analyses to determine the amount of
support for Fear of Negative Evaluation as either an antecedent or intervening
variable. Figure 2 shows FNE as an antecedent variable, along with media
exposure. Path coefficients are standardized beta coefficients. The results
show modest support for the Spiral of Silence model. Fear of negative
evaluation is negatively related to the individual’s own opinion. The
individual’s perception of the predominant opinion is positively related to
willingness to voice an opinion, even if it is in the minority.
• The less fearful I am, the more I support a woman’s right to a legal
abortion.
• The more I think others support abortion, the more willing I am to
voice my opinion.
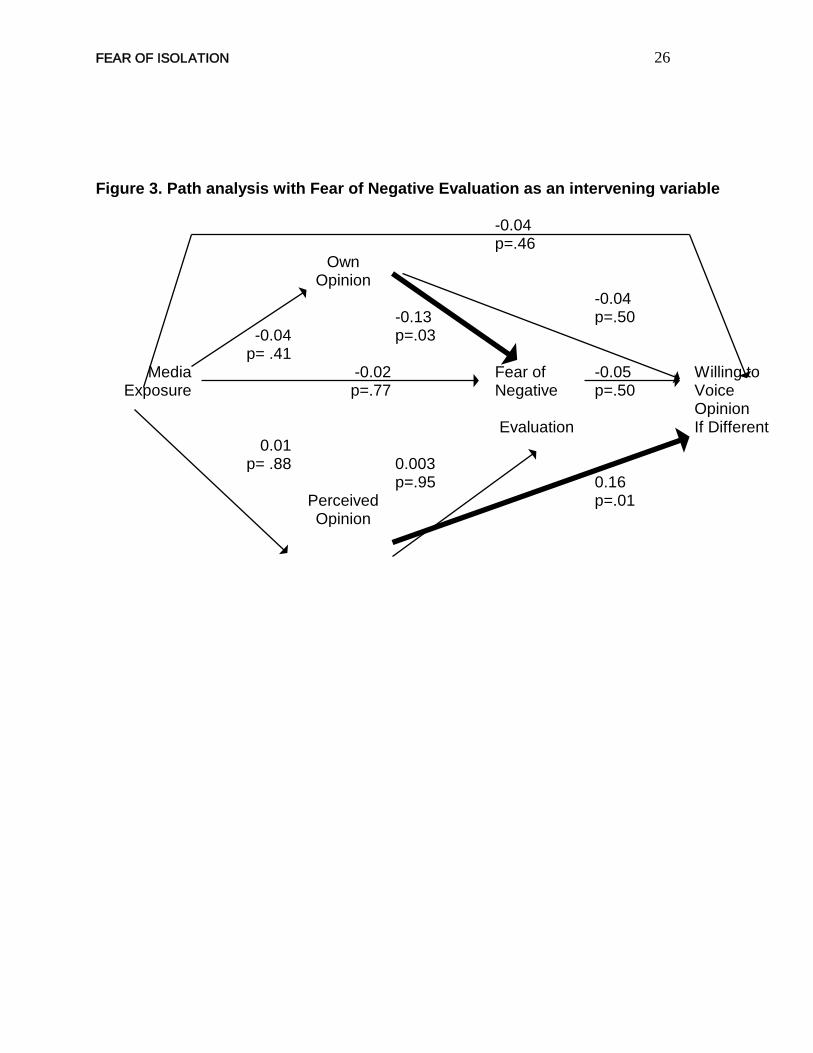
Figure 3 shows media exposure as antecedent and fear of negative
evaluation as intervening between the opinion variables and the person’s
willingness of express an opinion. The individual’s opinion is negatively
related to fear of negative evaluation. And, as before, perceived opinion is
related to willingness to voice the opinion.
• The more I support abortion, the less I fear negative evaluation.
• The more I think others support abortion, the more willing I am to
voice my opinion.
DISCUSSION
In their review of research of the Spiral of Silence Theory, Price and
Allen (1990) note that most tests of the theory in the United States have not

FEAR OF ISOLATION 18 supported the idea that holders of minority opinions are loath to present their
opinions in public due to a fear of social isolation. They also note that fear of
isolation has been assumed and not measured as a variable in the studies.
We have attempted to do just that, using a modified scale of Fear of Negative
Evaluation (Watson & Friend, 1969) as an operationalization of fear of social
isolation.
Like many other tests of the theory in the United States, our study
showed only the most modest support for the theory. On the other hand, we
have shown that it is possible to operationalize fear of social isolation. Our
adaptation of the Fear of Negative Evaluation index (Watson & Friend, 1969)
did allow us to put a measure of fear of social isolation into two path diagrams
— one with the fear variable antecedent and the other intervening. Fear of
social isolation appears to be negatively correlated with the individual’s
opinion, but the negative direction may be a function of the opinion topic — a
woman’s right to a legal abortion. This is a highly politicized and controversial
topic, yet it also has strong support among the public and is the law of the
land. Among this sample of respondents, most people thought that their
opinion was identical to most other people’s opinions. A topic less
entrenched might react differently.
Although we were pleased at the way our six-item Fear of Negative
Evaluation index came together (alpha = .81), it is certainly possible that a
revision in this scale could increase its usefulness in the path diagrams.
It is difficult to say from our results that fear of social isolation is either
antecedent or intervening. To say “The more I support abortion, the less

FEAR OF ISOLATION 19 fearful I am” may be equally sensible as saying “The less fearful I am, the
more I support abortion.” The former assumes that fear is a function of the
opinion, whereas the latter assumes that the opinion is a function of one’s
level of fear.
Noelle-Neumann, we think, would argue in favor of the latter — that
fear of social isolation (operationalized in this study as fear of negative
evaluation) is antecedent, a trait of humans, existing prior to the development
of opinions. If fear of social isolation is an intervening variable, then it is not a
trait, but rather ebbs and flows as each opinion topic comes up. In this study,
however, the fact that fear of social isolation is not related to willingness to
voice one’s opinion (Figure 3) sheds doubt on the status of fear of social
isolation as an intervening variable.
In conclusion, support for the Spiral of Silence Theory is minimal, but
we have perhaps advanced the theory by operationalizing fear of social
isolation and by considering whether it is an antecedent or intervening
variable.
Much more research and concept explication are necessary before we
can say that we know anything definitive about the role of the concept fear of
social isolation in the Spiral of Silence Theory. Although neither hypothesis
was supported (one where fear is antecedent and other intervening), we still
believe in their logic and hope that future researchers will retest the
hypotheses with new measures and/or new topics.

FEAR OF ISOLATION 20 TABLES & FIGURES
Table 1. Means and standard deviations for opinion and fear of negative evaluation variables
Variables Mean Standard Deviation N
Individual's opinion* 3.82 1.19 396
Individual's perception of the 3.55 1.06 363 predominant opinion*
Discrepancy between opinion and perception 0.74 0.87 359 of predominant opinion**
Willingness to express individual opinion*** 3.33 1.29 400
I worry about seeming foolish to others* 2.52 1.13 403
I worry about what people think of me even 2.42 1.02 402 when I know it doesn't make any difference *
I become tense and jittery if I know somebody 2.59 1.05 401 is sizing me up*
Other people's opinions do not bother me**** 2.75 1.09 403
When I am talking to someone I worry what 2.36 0.97 403 they may be thinking about me*
I often worry that people who are important to me won't think very much of me* 2.32 0.97 402
Fear of negative evaluation index
14.94 4.44 400
* 5=strongly agree, 4 = agree, 3 = neutral, 2 = disagree, 1 = strongly disagree **Absolute difference between two Likert scales *** 5 = very likely, 4 = likely, 3 = neutral, 2 = unlikely, 1 = very unlikely **** 1 = strongly agree, 2 = agree, 3 = neutral, 4 = disagree, 5 = strongly disagree *****The sum of the six individual items above. Cronbach's alpha = .81

FEAR OF ISOLATION 21
Table 2. Means and standard deviations for media use variables
Variables Mean Standard Deviation N
Minutes per week watch TV 1070.58 814.09 402
Minutes per week watch TV news 433.14 364.22 401
Days per week watch TV shows ... morning news programs 1.81 2.61 403
national network news 3.62 2.68 403 local news 4.47 2.45 403
news magazine shows 1.33 1.8 401 talk shows 1.34 1.95 402
tabloid tv shows 0.83 1.47 403 public TV news 0.99 1.68 401
Minutes per week read daily local paper 209.86 196.8 401
Minutes per week read national paper 32.51 98.15 402
# of news magazines read per week 0.59 0.97 402
Days per week listen to radio talk shows 1.62 2.42 403
Days per week listen to national radio news 1.09 2.14 401

Table 3. Pearson correlation coefficients for opinion and fear of negative evaluation variables
1 2 3 4 5 6 7 8 9 10 11 1 Individual's Opinion 2 Perception of 0.52 Dominant Opinion (359) P= .000 3 Discrepancy of -0.09 -0.35 Opinion (359) (363) P=.08 P=.000 4 Willingness to 0.05 0.15 -0.03 Express Opinion (394) (363) (359) P= .337 P= .005 P=.626 5 Worry about -0.13 -0.09 0.04 -0.07 seeming foolish (396) (363) (359) (400) P= .008 P= .073 P= .482 P= .184 6 Worry about what -0.08 -0.08 0.05 -0.08 0.54 people think of me (395) (362) (358) (399) (402) P= .113 P= .137 P= .371 P= .110 P= .000 7 Become tense and -0.08 -0.04 -0.01 0.01 0.50 0.46 jittery if somebody (394) (361) (357) (398) (401) (400) is sizing me up P= .129 P= .478 P= .887 P= .905 P= .000 P= .000 8 Other people's -0.05 -0.03 0.02 -0.05 0.30 0.39 0.33 opinions do not (396) (363) (359) (400) (403) (402) (401) bother me P= .277 P= .550 P= .759 P= .288 P= .000 P= .000 P= .000 9 When talking to -0.06 -0.04 0.03 -0.05 0.47 0.45 0.53 0.35 someone I worry (396) (363) (359) (400) (403) (402) (401) (403) what they think of me P= .219 P= .427 P= .526 P= .276 P= .000 P= .000 P= .000 P= .000 10 I often worry that -0.09 -0.02 0.06 0.03 0.38 0.40 0.37 0.28 0.47 important people (395) (362) (358) (399) (402) (401) (401) (402) (402) won't think much of me P= .080 P= .745 P= .281 P= .611 P= .000 P= .000 P= .000 P= .000 P= .000 11 Fear of Negative -0.11 -0.07 -0.05 -0.05 0.75 0.75 0.74 0.62 0.75 0.67 Evaluation Index (393) (360) (356) (397) (400) (400) (400) (400) (400) (400) P= .037 P= .186 P= .526 P= .345 P= .000 P= .000 P= .000 P= .000 P= .000 P= .000
FEAR OF ISOLATION 23
Table 4. Pearson correlation coefficients for opinion and fear of negative evaluation variables with media use variables
Media Use Variables
Fear of Negative Evaluation & Opinion Variables
TV TV News Morning National Local TV TV News TV Talk Tabloid TV Public TV National Local News Radio Talk National
Exposure Exposure TV News Network News News Magazines Shows News Newspaper Newspaper Magazine Shows Radio News
Individual's -0.01 0.03 0.06 0.06 -0.03 0.01 0.01 0.02 -0.08 -0.07 -0.09 -0.03 -0.15 0.03 Opinion (395) (394) (396) (396) (396) (394) (395) (396) (394) (394) (395) (395) (396) (395) P= .780 P= .608 P= .215 P= .254 P= .500 P= .776 P= .890 P= .721 P= .117 P= .143 P= .064 P= .601 P= .002 P= .512
Perception of 0.02 -0.01 0.00 0.07 -0.05 0.04 0.04 -0.03 -0.01 -0.05 0.02 -0.03 -0.03 0.04 Dominant Opinion (363) (363) (363) (363) (363) (361) (362) (363) (361) (362) (363) (362) (363) (361)
P= .723 P= .851 P= .968 P= .212 P= .357 P= .486 P= .414 P= .586 P= .786 P= .316 P= .683 P= .627 P= .581 P= .502
Discrepancy of -0.05 0.02 -0.02 -0.04 0.01 0.01 0.03 -0.05 -0.06 0.05 0.09 0.11 -0.04 -0.01 Opinion (359) (359) (359) (359) (359) (357) (358) (359) (357) (358) (359) (358) (359) (358)
P= .379 P= .670 P= .712 P= .478 P= .827 P= .920 P= .562 P= .363 P= .261 P= .312 P= .103 P= .043 P= .467 P= .827
Willingness to -0.07 0.00 -0.09 -0.02 -0.10 0.01 -0.01 -0.03 0.03 -0.13 0.10 0.13 -0.06 0.04 Express Opinion (399) (398) (400) (400) (400) (398) (399) (400) (398) (398) (399) (399) (400) (398)
P= .176 P= .941 P= .087 P= .620 P= .054 P= .842 P= .806 P= .534 P= .611 P= .009 P= .043 P= .011 P= .229 P= .424
Worry about 0.01 -0.01 0.00 -0.06 0.06 -0.01 0.07 -0.01 -0.08 0.00 -0.07 -0.12 0.07 -0.07 seeming foolish (402) (401) (403) (403) (403) (401) (402) (403) (401) (401) (402) (402) (403) (401)
P= .920 P= .895 P= .972 P= .218 P= .212 P= .834 P= .159 P= .891 P= .118 P= .967 P= .182 P= .018 P= .135 P= .189
Worry about what 0.00 0.00 -0.01 -0.09 0.03 -0.02 0.11 0.07 -0.02 0.02 -0.05 -0.09 0.08 0.01 people think of me (401) (400) (402) (402) (402) (400) (401) (402) (400) (400) (401) (401) (402) (400)
P= .965 P= .990 P= .893 P= .080 P= .491 P= .625 P= .025 P= .192 P= .643 P= .691 P= .337 P= .086 P= .101 P= .921
Become tense and -0.03 -0.05 -0.03 -0.08 -0.03 0.03 0.07 0.03 -0.12 0.04 -0.07 -0.02 0.03 -0.08 jittery if somebody (400) (399) (401) (401) (401) (399) (400) (401) (399) (399) (400) (400) (401) (399) is sizing me up P= .507 P= .359 P= .544 P= .107 P= .585 P= .525 P= .151 P= .616 P= .020 P= .430 P= .195 P= .621 P= .541 P= .132

FEAR OF ISOLATION 24 Other people's -0.07 -0.04 0.01 -0.05 -0.01 0.04 -0.03 -0.06 -0.09 0.08 -0.07 -0.03 0.06 0.07 opinions do not (402) (401) (403) (403) (403) (401) (402) (403) (401) (401) (402) (402) (403) (401) bother me P= .179 P= .437 P= .888 P= .284 P= .784 P= .457 P= .611 P= .209 P= .073 P= .101 P= .157 P= .493 P= .260 P= .180
When talking to -0.07 -0.12 -0.02 -0.07 -0.05 -0.03 0.02 0.08 -0.10 -0.03 -0.08 -0.04 0.07 0.00 someone I worry (402) (401) (403) (403) (403) (401) (402) (403) (401) (401) (402) (402) (403) (401) what they think of me P= .191 P= .018 P= .650 P= .142 P= .278 P= .521 P= .648 P= .111 P= .046 P= .553 P= .106 P= .394 P= .176 P= .965
I often worry that -0.01 -0.05 -0.07 -0.07 -0.05 -0.04 0.06 0.00 -0.04 0.05 -0.04 -0.03 0.04 -0.04 important people (401) (400) (402) (402) (402) (400) (401) (402) (400) (400) (401) (401) (402) (400) won't think much of me
P= .880 P= .366 P= .180 P= .135 P= .323 P= .402 P= .213 P= .977 P= .465 P= .283 P= .471 P= .534 P= .395 P= .396
Fear of Negative -0.04 -0.07 -0.03 -0.11 -0.01 -0.01 0.08 0.01 -0.10 0.03 -0.08 -0.07 0.07 -0.02 Evaluation Index (399) (398) (400) (400) (400) (398) (399) (400) (398) (398) (399) (399) (400) (398) P= .485 P= .193 P= .546 P= .034 P= .842 P= .767 P= .101 P= .806 P= .039 P= .497 P= .119 P= .139 P= .145 P= .622
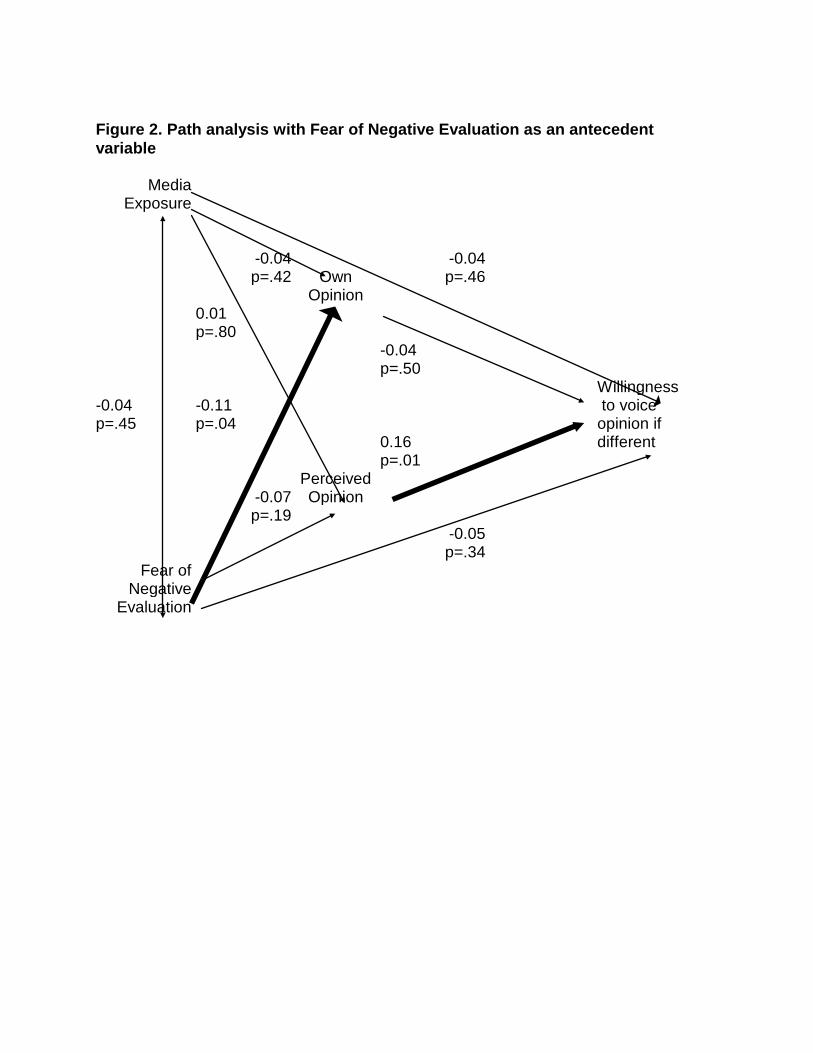
Figure 2. Path analysis with Fear of Negative Evaluation as an antecedent variable
Media
Exposure -0.04 -0.04 p=.42 Own p=.46 Opinion 0.01 p=.80 -0.04 p=.50 Willingness
-0.04 -0.11 to voice p=.45 p=.04 opinion if
0.16 different p=.01 Perceived -0.07 Opinion p=.19 -0.05 p=.34
Fear of Negative
Evaluation
FEAR OF ISOLATION 26
Figure 3. Path analysis with Fear of Negative Evaluation as an intervening variable -0.04 p=.46 Own Opinion -0.04 -0.13 p=.50 -0.04 p=.03 p= .41
Media -0.02 Fear of -0.05 Willing to Exposure p=.77 Negative p=.50 Voice
Opinion Evaluation If Different 0.01 p= .88 0.003 p=.95 0.16 Perceived p=.01 Opinion

FEAR OF ISOLATION 27 REFERENCES
Asch, S.E. (1951). Effects of group pressure upon the modification and distortion of
judgments. In H. Guetzkow (Ed.),Groups, leadership, and Men. Pittsburgh: Carnegie. Reprinted 1953 in D. Cartwright & A. Zander (Eds.),Group Dynamics: Research and Theory, pp. 151-162. Evanston IL: Row, Peterson.
Asch, S.E. (1952). Group forces in the modification and distortion of judgments. In Social Psychology, pp. 450-473. New York: Prentice Hall.
Baldassare, M., & Katz, C.. (1996). Measures of attitude strength as predictors of willingness to speak to the media. Journalism & Mass Communication Quarterly, 73, 147-158.
Beidel, D.C., Turner, S.M., & Dancu, C.V. (1985). Physiological, cognitive and behavioral aspects of social anxiety. Behaviour Research and Therapy, 23, 109-117.
Cacioppo, J.T., Glass, C.R., & Merluzzi, T.V. (1979). Self-statements and self-evaluations: A cognitive response analysis of heterosocial anxiety. Cognitive Therapy and Research, 3, 249-262.
Eveland, W. P., McLeod, D. M., & Signorielli, N. (1995). Actual and perceived U.S. public opinion: The spiral of silence during the Persian Gulf War. International Journal of Public Opinion Research, 7, 91-109.
Glynn, C. J., Hayes, A. F., & Shananhan, J.. (1996). Willingness to speak out and the spiral of silence: A meta analysis. Paper presented to the Association for Education in Journalism and Mass Communication, Anaheim, CA. August. (In review at Public Opinion Quarterly)
Glynn, C. J., & McLeod, J. M. (1984). Implications of the spiral of silence theory for communication and public opinion research. In Sanders, D.R., Kaid, L.L., & Nimmo, D. (Eds.), Political communication yearbook 1984 (pp. 43-65). Carbondale, IL: Southern Illinois University Press.
Halford, K., & Foddy, M. (1982). Cognitive and social skill correlates of social anxiety. British Journal of Clinical Psychology, 21, 17-28.
Higgins, E.T. (1987). Self-discrepancy: A theory relating self and affect. Psychological Review, 93, 319-340.
Higgins, E.T., Bond, R.M., Klein, R., & Strauman. T. (1986). Self-discrepancy and emotional vulnerability: How magnitude, accessibility and the type of discrepancy influence affect. Journal of Personality and Social Psychology, 51, 5-15.
Jones, W.H., & Briggs, S.R. (1984). The self-other discrepancy in social shyness. In R. Schwarzer (Ed.), The self in anxiety, stress and depression. Amsterdam: Elsevier Science Publishers.
FEAR OF ISOLATION 28 Katz, C., & Baldassare, M. (1992). Using the “L-word in public: A test of the spiral of
silence in conservative Orange County, California. Public Opinion Quarterly, 56, 232-235.
Katz, C., & Baldassare, M. (1994). Popularity in a freefall: Measuring a spiral of silence at the end of the Bush presidency. International Journal of Public Opinion Research, 6, 1-12.
Kennamer, J. D. (1990). Self-serving biases in perceiving the opinions of others: Implications for the spiral of silence. Communication Research, 17, 393-404.
Leary, M.R., & Atherton, S.C. (1986). Self-efficacy, social anxiety and inhibition in interpersonal encounters. Journal of Social and Clinical Psychology, 4, 256-257.
Monfries, M.M., & Kafer, N.F. (1994). Private self-consciousness and fear of negative evaluation. The Journal of Psychology, 128, 447-454.
Noelle-Neumann, E. (1977). Turbulences in the climate of opinion: Methodological applications of the Spiral of Silence Theory. Public Opinion Quarterly, 41, 143-158.
Noelle-Neumann, E. (1984). The spiral of silence. Chicago: University of Chicago Press.
Price, V., & Allen, S. (1990). Opinion spirals, silent and otherwise: Applying small-group research to public opinion phenomena. Communication Research, 17, 369-392.
Schlenker, B.R., & Leary, M.R. (1982). Social anxiety and self-presentation: A conceptualization and model. Psychological Bulletin, 92, 641-669.
Shamir, J. (1995). Information cues and indicators of the climate of opinion: The spiral of silence theory in the Intifada. Communication Research, 22, 24-53.
Tarde, G. (1969). Gabriel Tarde on communication and social influence: Selected papers. Ed. with intro. by Terry N. Clark. Chicago: University of Chicago Press.
Taylor, D. G. (1982). Pluralistic ignorance and the spiral of silence: A formal analysis. Public Opinion Quarterly, 46, 311-335.
Watson, D., & Friend, R. (1969). Measurement of social evaluative anxiety. Journal of Consulting and Clinical Psychology, 33, 448-458.
Willnat, L. (1996). Mass media and political outspokenness in Hong Kong: Linking the third-person effect and the spiral of silence. International Journal of Public Opinion Research, 8, 187-212.