feasibility of aerial measurements of methane emissions ... · 5.2 mass balancing 24 5.3 sampling...
TRANSCRIPT

Feasibility of aerial measurements of methane emissions from landfills Report - SC130034/R

ii Feasibility of aerial measurements of methane emissions from landfills
We are the Environment Agency. We protect and improve the environment and make it a better place for people and wildlife.
We operate at the place where environmental change has its greatest impact on people’s lives. We reduce the risks to people and properties from flooding; make sure there is enough water for people and wildlife; protect and improve air, land and water quality and apply the environmental standards within which industry can operate.
Acting to reduce climate change and helping people and wildlife adapt to its consequences are at the heart of all that we do.
We cannot do this alone. We work closely with a wide range of partners including government, business, local authorities, other agencies, civil society groups and the communities we serve.
This report is the result of research commissioned and funded by the Environment Agency.
Published by: Environment Agency, Horizon House, Deanery Road, Bristol, BS1 5AH www.environment-agency.gov.uk ISBN: 978-1-84911-329-8 © Environment Agency – July 2014 All rights reserved. This document may be reproduced with prior permission of the Environment Agency. The views and statements expressed in this report are those of the author alone. The views or statements expressed in this publication do not necessarily represent the views of the Environment Agency and the Environment Agency cannot accept any responsibility for such views or statements. Further copies of this report are available from our publications catalogue: www.gov.uk/government/publications or our National Customer Contact Centre: T: 03708 506506 Email: [email protected]
Author(s): Dr Grant Allen1 Professor Martin Gallagher1 Dr Peter Hollingsworth2 Dr Samuel Illingworth1 Khristopher Kabbabe2 Professor Carl Percival1
1Centre for Atmospheric Science 2School of Mechanical, Aerospace and Civil Engineering Dissemination Status: Publicly available Keywords: Unmanned aircraft system, UAV, methane, fugitive emissions, greenhouse gases, landfill, spectroscopic measurement, remote sensing Research Contractor: Centre for Atmospheric Science, University of Manchester, Oxford Road, Manchester M13 9PL Environment Agency’s Project Manager: Mark Bourn, Evidence Directorate Project Number: SC130034

Feasibility of aerial measurements of methane emissions from landfills iii
Evidence at the Environment Agency Evidence underpins the work of the Environment Agency. It provides an up-to-date understanding of the world about us, helps us to develop tools and techniques to monitor and manage our environment as efficiently and effectively as possible. It also helps us to understand how the environment is changing and to identify what the future pressures may be.
The work of the Environment Agency’s Evidence Directorate is a key ingredient in the partnership between research, guidance and operations that enables the Environment Agency to protect and restore our environment.
This report was produced by the Scientific and Evidence Services team within Evidence. The team focuses on four main areas of activity:
• Setting the agenda, by providing the evidence for decisions;
• Maintaining scientific credibility, by ensuring that our programmes and projects are fit for purpose and executed according to international standards;
• Carrying out research, either by contracting it out to research organisations and consultancies or by doing it ourselves;
• Delivering information, advice, tools and techniques, by making appropriate products available.
Miranda Kavanagh
Director of Evidence

iv Feasibility of aerial measurements of methane emissions from landfills
Executive summary This study delivers expert advice in the context of existing and emerging technology for the measurement of methane concentrations from instrumented unmanned aerial vehicles (UAVs) appropriate to the assessment of fugitive emissions from regulated landfill sites in the UK.
The report focuses on the necessary combination of sampling techniques and complementary data, such as wind, which together may enable methane flux calculation with corresponding known uncertainty.
The study discusses scientific and technological constraints and existing UAV practice such that the cost–benefits and risks in the operational use of possible systems can be assessed. The engineering requirements for candidate systems within the current, and anticipated future, UAV regulatory framework are described and advice is provided on the design of field trials necessary to characterise measurement uncertainty and to validate methods.
In summary, the report suggests airborne methane measurement using precision closed path cavity ring-down spectroscopic techniques, along with simultaneous wind measurement on moving UAV platforms. A small (less than 20 kg maximum take-off weight) fixed wing UAV is the recommended platform.
Such a system would provide precision continuous measurements that would enable flux calculation across the scale of typical landfill sites with an uncertainty broadly estimated to be within 20%. Tailored sampling design would be necessary to optimise the measurements for mass balancing and eddy covariance flux calculation.

Feasibility of aerial measurements of methane emissions from landfills v
Contents 1 Introduction 1
2 Current methods and requirements 2
3 Methane remote sensing measurement techniques 5 3.1 Open path passive remote sensors 5 3.2 Open path active remote sensing sensors 11
4 In situ instrumentation 15 4.1 Wind 15 4.2 In situ instrumentation 16 4.3 Summary of recommended instrumentation 20
5 Sampling design and methods 22 5.1 Eddy covariance 22 5.2 Mass balancing 24 5.3 Sampling considerations 25 5.4 Recommended sampling 26
6 UAV systems 28 6.1 CRDS remote sensing platform 28 6.2 PID in situ flux measurements 30 6.3 Other UAV systems 31 6.4 Recommended UAV platforms 33
7 General UAS regulatory environment 34
8 Development strategy 35 8.1 Measurement-platform constraints 35 8.2 Capital and hardware investment 36 8.3 Field trial 36 8.4 Cost–benefit of development options 38 8.5 Operational cost 39
9 Conclusions 41
References 42
List of abbreviations 48
Appendix A – Regulation of UAVs 50 A.1 Applicable articles from the Air Navigation Order 50

vi Feasibility of aerial measurements of methane emissions from landfills
A.2 Article 166 – Small unmanned aircraft 51 A.3 Article 167 – Small unmanned surveillance aircraft 52
Appendix B – Platform specifications 53
Appendix C – GAUGE project 55 Table 6.1 Summary of small UAV options for CRDS sensor 30 Table 7.1 Summary of regulations and requirements for operation of different UAS systems 34 Table 8.1 Summary constraints for a UAV methane measurement platform 35 Table 8.2 Advantages and disadvantages of proposed measurement platforms 39 Table 8.3 Estimated capital cost for integrated measurement platform 39 Table 8.4 Estimated operational cost 40 Table A.1 Air Navigation Order articles relevant to unmanned aircraft operations 50 Figure 3.1 Schematic of the FTS system Michelson interferometer 6 Figure 3.2 System configuration of the static polarisation interference imaging spectrometer 8 Figure 3.3 Schematic of a FPE 9 Figure 3.4 Mechanical setup of the Fabry–Pérot detector for methane measurements 9 Figure 3.5 Schematic principle of a dispersive spectrometer 10 Figure 3.6 Using a DIAL system to calculate mass emissions over a site 12 Figure 3.7 Basic setup of the Standoff-TDLAS system 13 Figure 4.1 M2AV system 16 Figure 4.2 LGR-UPGACRDS system 18 Figure 4.3 UAV greenhouse gas analyser (a), integrated into the SIERRA nose cone (b) 19 Figure 4.4 Integrated ozonesonde and Skywalker airframe 19 Figure 5.1 Eddy covariance schematic showing turbulent eddies in the Earth’s boundary layer and a typical eddy
covariance flux tower 23 Figure 5.2 Aircraft methane measurements downwind of London 25 Figure 5.3 Methane concentration curtains retrieved from FTS remote sensing on the FAAM aircraft 26 Figure 5.4 Recommended sampling schematic for a typical landfill site 27 Figure 6.1 Bormatec Explorer aircraft 28 Figure 6.2 UAV Factory Penguin B 29 Figure 6.3 Steadidrone QU4D X 29 Figure 6.4 Bormatec Maja 30 Figure 6.5 MIPAS-B2 gondola ready for the launch in the balloon assembly hall near Kiruna, Sweden 32 Figure 6.6 AeroVironment Pathfinder HAP 32 Figure 6.7 An RQ-4 Global Hawk flying in 2007 33

1 Introduction This report presents the findings of a project commissioned by the Environment Agency for a four-month period beginning in December 2013. The project’s overall aim was to determine whether the current state of remote sensing technology, in particular unmanned aerial vehicle (UAV) mounted techniques, would enable a cost-effective method to be developed to quantify whole site methane emissions from landfills.
This report consists of an overview of current landfill methane flux measurement methods (Section 2). This is followed by a review of remote sensing techniques and their suitability for methane flux measurement (Section 3) which outlines existing and emergent UK and international expertise in UAV deployment and methane remote sensing technology. Section 4 discusses complementary measurement techniques for wind and in situ methane measurements. Section 5 discusses flux methods in detail and identifies an optimal sample design appropriate to UAV remote sensing. Section 6 considers the different small UAV systems, including other UAV platforms such as tethered balloons, and identifies candidate platform designs. Section 7 summarises the regulatory limitations for UAVs. Section 8 presents a development strategy, including the potential design of a field study to evaluate the proposed technique. Finally, Section 9 draws together the study’s conclusions.
The technology and sampling designs investigated and proposed in this study represent potential strategies for flux quantification at local scales over so-called ‘hotspot’ areas, which may also include natural (and unconventional) gas infrastructure. In summary, the measurement and modelling principles highlighted in this study could be transferable to other regulated locations.
2 Feasibility of aerial measurements of methane emissions from landfills
2 Current methods and requirements
This section provides a brief overview of known methods currently in use for determining methane fluxes at the local scale. This overview is not intended to be exhaustive or detailed as it is beyond the scope of this report. However, several of the methods are relevant to the later discussion and are therefore introduced here.
Many methods are currently used, or are useful, when attempting to make methane flux measurements from open areas such as landfills or cities (see, for example, McKain et al. 2012). Each has its own set of optimal and limiting characteristics in terms of the spatial and temporal scales it attempts to represent.
For example, ground-based flux chambers can provide accurate measurements and may operate over long timescales at a specific point location; however, in the practical absence of a complete surface overage of a site, such point fluxes may not be representative (or scalable) for other (or larger) areas of a site. Other, wider area bulk airmass techniques include:
• the National Physical Laboratory (NPL) differential absorption LIDAR (DIAL) system
• eddy covariance flux towers, for example, the Department for Energy and Climate Change (DECC) tall tower network
• open path Fourier transform infrared (FTIR) remote sensing
• fence-line monitoring (that is, employing surface instrumentation around a site)
All these methods are typically less accurate than state-of-the science static in situ (that is, directly measured within a sample of air) instrumentation. However, they do have the advantage that they represent a measurement of an entire site/area, so long as careful validated assumptions and modelling of atmospheric dynamics and environmental background can be invoked. This latter point on validated assumptions and background is critical to the success of area-wide measurements and requires careful thought when planning the sampling strategy (see Section 6).
Attempts are also being made to retrieve hotspot fluxes at relatively local scales from satellite measurements coupled with inverse transport models (see, for example, Bergamaschi et al. 2009, Polson et al. 2011), albeit with arguable success. This and all the methods above carry their own unique set of uncertainties. Such uncertainties are often poorly understood or quantified or simply not known at all (see, for example, Grimmond et al. 2002).
Constraining and understanding uncertainty is a key theme of the GAUGE (Greenhouse gAs Uk and Global Emissions) programme and a study led by Dr Grant Allen as part of Deliverable D of the National Environment Research Council (NERC) GREENHOUSE programme is currently investigating some of the methods above, as well as novel ones, as part of an intercomparison test bed at a landfill site in the east of England planned for July to August 2014 (see Appendix C). The purpose of this study is to characterise intercomparability and uncertainty, while simultaneously improving understanding of the principal factors controlling uncertainty (for example, assumptions relating to boundary layer mixing depth, upwind background concentrations and instrumental uncertainty).

Ultimately, idealised net surface flux determination of relatively inert trace gases such as methane from open (and heterogeneous) sites requires optimised, dense and continuous sampling of three-dimensional (3D) thermodynamics and methane concentrations (Duren and Miller 2013). However, compromises must clearly be made for practicality and assumptions are necessary. Therefore measurements are often interpolated in the 3D frame and/or assimilated into, or interpreted using, transport models such as the Met Office NAME Eulerian dispersive model or its analogues (see, for example, Brioude et al. 2013). The efficacy of such analysis may be mathematically limited by sampling and uncertainties are often poorly quantified in the published academic literature.
Remote sensing offers a practical way to improve the sampling that underpins such flux calculations. It essentially measures (or retrieves) methane concentrations without traversing an airmass, thereby potentially improving the density and spatial resolution of sampling. Methane remote sensing techniques rely exclusively on spectroscopic retrieval in the infrared or near infrared by virtue of methane’s strong radiative absorption (or emission) at these wavelengths. This is also precisely why this molecule is a strong greenhouse gas – 23 times the infrared absorption molecule-for-molecule compared with carbon dioxide (CO2). The remote sensing configuration may include:
• thermal infrared nadir-viewing FTIR
• hyper-spectral near-infrared imaging – for example, the Methane Airborne MAPper (MAMAP) system described by Gerilowski et al. (2011)
• ground-based (for example, as operated by NPL) or airborne LIDAR (light detection and ranging)
Such remote sensing measurements are usually less precise (for example, ~1.5% accuracy at 1σ for methane total columns from nadir FTIR on aircraft; Allen et al. 2014) than state-of-the-science in situ instrumentation such as cavity ring-down or quantum cascade laser spectrometers from manufacturers like Los Gatos, Aerodyne and Picarro, which have an accuracy of the order 1 part per billion (ppb) at 1σ at 1 Hz. But when properly validated and/or calibrated, the measurements could be used to provide rapid 3D sampling of a site using a moving (or scanning) platform in conjunction with tomographic techniques.
The rate of complete spatial coverage of a site has to be balanced against the expected rate of change of flux and/or background inflow; that is, too slow and what may have been measured in one scan may have advected with the wind in the inertial frame. This can lead to a variety of significant sampling artefacts if not carefully considered (see Section 6). Rapid scanning of a site is therefore important and preferable. Static ground-based scanning remote sensing platforms may be useful in this regard, but suffer from the fact that they ‘see’ total column concentrations from a fixed viewpoint. They therefore rely heavily on tomographic techniques, and have an inherent decrease in spatial resolvability and accuracy with distance from the observer. Moving remote sensing platforms could overcome this problem by optimising (and changing) sensitivity in the 3D frame.
The rapid speed and flight restrictions of large aircraft for the application considered here make these platforms unsuitable for measurement at the local scale. However, they could play a role (albeit an expensive one) in characterising upwind and downwind background and bulk regional fluxes (see, for example, Mays et al. 2009, O’Shea et al. 2014).
Emerging UAV technology may offer such a platform for remote sensing at the spatial scale of landfill sites in the UK (Illingworth et al. 2014a). But although the basic concept of using small unmanned systems has been shown to be worthwhile, there are a

4 Feasibility of aerial measurements of methane emissions from landfills
number of specific engineering and certification challenges, and flight restrictions remain to be overcome (see Section 9). The specific engineering challenges include:
• positional and speed accuracy relative to both the ground and moving air masses
• integration between the specific measuring sensors and the airframes
• the overall compromises induced by the performance properties of different classes of small UAVs (for example, fixed wing and rotorcraft)
This is combined with a UAV regulatory environment that depends on:
• the size of the UAV being used
• the manner in which it is employed
This feasibility study sought to identify and characterise the specific challenges associated with each of the sensing techniques and operational UAV combinations.
The next section discusses current methane remote sensing techniques and their potential for deployment on existing UAVs.

3 Methane remote sensing measurement techniques
This section considers a number of open path remote sensing measurement techniques that are used to determine total column abundances of atmospheric methane (CH4). Total column abundance is defined here as the column measurement of the mass of air between the UAV and the ground.
Each open path technique is introduced, along with its operating principles. Where known, example projects are be highlighted where instruments have been developed for suitability to fly on UAVs. The recommendations in this section are based on technology for a 7 or 20 kg (total weight) UAV – defined hereafter as a ‘small’ UAV.
In general, open path remote sensing measurement techniques are either passive or active.
• Passive techniques (Section 3.1) rely on an attenuated electromagnetic signal detected at some distance from a radiation source such that absorbing (or emitting) gases in the column between source and observer will modify the detected spectrum in a way that can be related directly to the quantity of gas in the column. This is called retrieval (of concentration data from a radiance measurement or set of measurements).
• Active techniques (Section 3.2) utilise the same broad retrieval principle but involve the attenuation of a powerful emitted light source (such as a laser tuned to the wavelength of an identified gas absorption line). Active techniques can therefore often improve the detected signal-to-noise ratio, but this may be at the expense of spectral coverage (which is often necessary to diagnose, and account for, the presence of interfering spectral absorption features from other trace gases for example).
In summary, either passive or active techniques may be preferential in terms of retrieval depending on:
• the surface environment in question
• the location of the observer
• constraints on the prior knowledge about the broader composition of the atmosphere
These considerations are discussed in Section 6.
Closed path remote sensing methods (including in situ measurement – directly measured within a sample of air) are discussed in Section 4.2.
3.1 Open path passive remote sensors
3.1.1 Michelson Fourier transform spectrometer
A Fourier transform spectrometer (FTS) consists of an interferometer, detector, amplifier, analogue to digital (A/D) convertor, and a computer. When using a Michelson interferometer (Figure 3.1), an FTS consists of two mirrors located at a right angle to

6 Feasibility of aerial measurements of methane emissions from landfills
each other and oriented perpendicularly, with a beamsplitter placed at the vertex of the right angle and oriented at a 45° angle relative to the two mirrors. The incident radiation from the source is divided into two parts, each of which propagates down one of the two arms and is reflected off one of the mirrors. The two beams are then recombined by the beamsplitter and transmitted to a detector. When the position of one mirror is continuously varied with respect to the beamsplitter, an interference pattern is generated because of the path difference between the two beams when they are recombined. The interference pattern is detected as a function of time as the mirror moves, which in turn is the Fourier transform of the spectrum. An inverse Fourier transform is then computed, giving a spectrum. This method has the advantage that total radiation at all wavelengths can be measured simultaneously within the bandpass of the detector used (the multiplex advantage), though the spectral resolution within this bandpass is determined by the maximum path difference available.
The detected radiance by a thermal infrared (TIR) FTS system requires calibration against target black bodies at fixed reference temperatures. These are typically both hot (~300K) and cold (<200K) to provide linearity across a wide range, and therefore necessitate active cooling and heating systems. Any radiometric calibration would not be possible on board a small UAV-based system due to the large weight of typical blackbodies (several kg) and therefore calibration would have to be performed before or after deployment (Hartmut Bösch, University of Leicester, personal communication, 2014).
Figure 3.1 Schematic of the FTS system Michelson interferometer
Source: http://hank.uoregon.edu/teaching-modules/Broadband-Interferometer/bbinterferometer.html
The atmospheric emitted radiance interferometer (AERI) for an unmanned aerial vehicle (AERI-UAV) was developed as a high-resolution FTS to operate in the 3.3–24 μm band, with a spectral resolution of 0.5 cm-1 and a field of view (FOV) of 100 mrad in the nadir, zenith and intermediate angles (Revercomb et al. 1996). In principle this would make it an ideal candidate for retrieving methane columns in the TIR; absorption in the TIR for methane occurs at around 8 μm. This would be in a manner analogous to the Met Office’s Airborne Research Interferometer Evaluation System (ARIES) on board the UK’s Atmospheric Research Aircraft (ARA).
The AERI-UAV is now known as the scanning high-resolution interferometer sounder (S-HIS) (Tobin et al. 2006). It is used for remote sensing studies – most recently on board the National Aeronautics and Space Administration (NASA) Hurricane and Severe Storm Sentinel aircraft – and for the validation of spacecraft instruments, for example, the Cross-track Infrared Sounder (CrIS). It has flown on many manned
aircraft starting with the NASA DC-8 in 1998. This was followed by the scaled composites Proteus, the NASA WB57 and the NASA ER2, before being flown on the large NASA Global Hawk UAV.
The large size (>50 cm length) and weight (>20 kg), means that it is not feasible for such an instrument to be flown on board the small UAVs considered in this study (Hank Revercomb, S-HIS Instrument Principal Investigator, personal communication, January 2014). Furthermore, the active detector cooling and mirror stability requirements of the S-HIS instrument would present a difficult engineering and cost challenge on current platforms. These drawbacks are not unique to the S-HIS FTS instrument, as the nature of the moving mirror in Michelson systems requires a level of vibrational stability that is currently impractical on a small UAV platform.
In addition to concerns about the required stability of the instrument, detectors operating in the TIR between ~3 and 10 μm typically require a mercury cadmium telluride (MCT) array, which itself requires cryogenic cooling to minimise the radiometric noise and dark current (that is, the residual electric current flowing in a photoelectric device when there is no incident illumination). The most recent MCT devices require cooling to around 17 K (Pidancier et al. 2013). The addition of coolant to the UAV system adds additional health and safety concerns.
In conclusion, a Michelson FTS system operating in the TIR may be currently impractical for use on small UAVs due to bulk, cooling and stability limitations.
3.1.2 Static Fourier transform spectrometer
To overcome the disadvantages posed by the moving mirror of a traditional FTS system, an alternative method of static (or stationary) FTS was proposed in the 1960s by Stroke and Funkhouser (1965). In this method the optical parts of the interferometer are fixed in their positions and the interferogram is produced in the spatial rather than the temporal domain.
Most of these systems are based on lateral shearing interferometers, such as a Savart polariscope or a Fresnel double mirror (Zhang et al. 2000). In these cases the interferometer is configured with tilted mirrors to give a path difference, which varies with lateral position across the exit aperture of the prism –rather than with time as is the case for a moving interferometer. The resulting interferogram may then be recorded using a detector array, thereby eliminating any moving parts from the design (Patterson et al. 1996). Figure 3.2 shows the setup of the static polarisation interference imaging spectrometer (SPIIS), a type of static FTS that utilises a Savart polariscope.1
The French space agency, CNES, began investigating the use of static FTS instruments for use on small satellites in the early 1990s, eventually patenting a design, which led to the development of a demonstrator for the MOtionLess Interferometer (MOLI). This has been successfully tested on the ground for the retrieval of carbon dioxide.
CNES also developed a breadboard for another static FTS satellite instrument called MOPI, which was designed to operate in the TIR, specifically for the retrieval of carbon monoxide (CO) and ozone (O3) (Brachet et al. 2008). MOPI stands for ‘Maquette Optique de Performances Infrarouges’, which approximately translates into ‘Optical Breadboard for Infrared Performances’.
1 A polariscope consists of a specially constructed double-plate polariser and a tourmaline plate analyser. Polarised light passing through the instrument is indicated by the presence of parallel coloured fringes, while unpolarised light results in a uniform field.

8 Feasibility of aerial measurements of methane emissions from landfills
Originally the MOLI design was selected as a candidate for the MICROCARB mission (http://smsc.cnes.fr/MICROCARB/index.htm), but was superseded by a grating-based design (see Section 3.4).
Figure 3.2 System configuration of the static polarisation interference imaging spectrometer
Notes: The spectrometer is composed of a pre-optical system, L1 and L2, a polarised interferometer (polariser P1, Savart polariscope and analyser P2), imaging lens L3 and detector.
Source: Zhang et al. (2000)
The optical path difference in static FTS systems must be known – and fixed – to the order of nanometre accuracy, meaning that vibration is an important consideration, thereby making it unsuitable for current small UAV applications (Frank Brachet, CNES, personal communication, 2014).
Furthermore, a static FTS (as well as a traditional FTS) would require regular blackbody reference calibration, adding further weight and cooling considerations. The CNES team found that such cooling systems (in their case a Stirling cycle cooler) also introduced unwanted vibrations that led to measurement inaccuracy.
In summary, although potentially within the weight and size constraints for small UAVs considered in this study, a static FTS instrument would be unsuitable because of cooling and stability limitations.
The Michelson FTS and static FTS systems discussed in Sections 3.1 and 3.2 have been described for the thermal infrared. If operating in the short wave infrared (SWIR), then an indium gallium arsenide (InGaAs) detector could be used which may not necessarily require cryogenic cooling. However, operating with a passive instrument in the SWIR would require a signal from backscattered solar radiation when viewing in the nadir. This could be a practical issue in the operational deployment of such a system, for example, on cloudy days.
3.1.3 Fabry–Pérot etalon
A Fabry–Pérot etalon (FPE) is a technology that uses multiple beam interferences of light to perform high-resolution spectroscopy. An FPE consists of two planar, partially reflective, and immovable surfaces that are not quite parallel (curved surfaces help to prevent the rear surfaces from also producing interference patterns). The schematic geometry is shown in Figure 3.3.

Figure 3.3 Schematic of a FPE
Source: http://www.phy.davidson.edu/stuhome/cabell_f/diffractionfinal/pages/fabry.htm
Light passing through the FPE undergoes multiple reflections on each inside surface of the mirror, creating an interference pattern of evenly spaced fringes as a function of wavelength when combined. For a complete description of FPE measurement principles, see Hernandez (1988).
The main advantage of the FPE in the context of small UAVs is its small size and weight; an FPE ‘folds’ the distances required by a conventional interferometer into a total package that can be just a few centimetres in size.
Recently, the University of Baltimore and the NASA Goddard Space Flight Centre developed a miniaturised FPE system for the retrieval of methane total columns (Georgieva and Heaps 2011, Georgieva et al. 2008, 2012) from satellite platforms. The setup for this device is shown in Figure 3.4. Light enters the instrument from the left, passes through a band-pass filter, and is then split. One half goes directly to a detector and the other half passes through a FPE tuned to transmit at wavelengths where methane absorbs light. The detector for this half responds strongly to changes in the atmospheric methane.
Figure 3.4 Mechanical setup of the Fabry–Pérot detector
Source: Georgieva and Heaps (2011)

10 Feasibility of aerial measurements of methane emissions from landfills
The study by Georgieva and Heaps published in 2011 was concerned with the use of these FPE devices to retrieve total column methane from UAV-based systems. However, work by this group is now focused on adapting these devices for use on the Abundance of Methane by Interferometric Glint Observation (AMIGO) satellite instrument (http://acdb-ext.gsfc.nasa.gov/People/Weaver/AMIGO.html).
As this FPE method operates in the SWIR, InGaAs detectors can be used, which may not require cryogenic cooling. A drawback of this is the requirement for backscattered solar radiation as discussed in Section 3.2. Although possible, using a FPE that operates in the TIR would introduce the cooling and calibration issues discussed in Section 3.1. Clearly, there is no easy choice between TIR and SWIR that meets all the UAV constraints – the former has detector cooling engineering challenges, while the latter has the practical problem of a potentially weak solar backscattered signal operationally.
In summary, FPE-based instrumentation represents a plausible future opportunity for monitoring total column measurements of methane from a UAV. At present, however, there is no commercial-off-the-shelf (COTS) technology for such instrumentation. Both Peter Muller (University College London, in conjunction with the authors of this report) and Hartmut Bösch (University of Leicester) are currently investigating the use of miniature FPE instrumentation. As this technology is currently under active investigation and not academically mature at the time of writing, FPE systems should be monitored for future applications.
3.1.4 Dispersive (hyperspectral) spectrometer
The optical principle of a dispersive spectrometer is shown in Figure 3.5. A pointing mirror deflects the radiation into a telescope that forms an image of the observed scene. A strip field of view is defined by the entrance slit to a spectrometer section, which consists of a collimator, a disperser (typically a prism or a grating) and an imager. A two-dimensional detector array receives the spectrally dispersed image, with rows of the array containing the spatial information, and the spectral information being contained in each column (Blechinger et al. 1995). Software can then be used to interpolate the signal based on the number of pixels in the detector and the linear dispersion, enabling the detected radiance to be plotted as a function of wavelength.
Figure 3.5 Schematic principle of a dispersive spectrometer
NASA’s Jet Propulsion Laboratory developed the hyperspectral thermal emission spectrometer (HyTES), which currently flies on a Twin Otter operated by Twin Otter

International from Grand Junction, Colorado. HyTES uses a compact 7.5–12 μm hyperspectral grating spectrometer in combination with a quantum well infrared photodetector (QWIP) and grating based spectrometer (Johnson et al. 2011). Although such a system could be ideal for monitoring methane emissions in the TIR, the system requires two mechanical cryocoolers to maintain the instrument temperature to prevent variable stray TIR light inside the optical system. The need for these coolers presents weight and vibrational issues for small UAV applications.
CNES is also currently working on a grating spectrometer for integration into the planned MICROCARB satellite (http://smsc.cnes.fr/MICROCARB/GP_instrument.htm). However, this instrument is only at the design process and, importantly, does not currently contain a spectral band that is appropriate for methane absorption.
Work has also been conducted to produce compact high resolution SWIR hyperspectral instruments using a dispersion system described by Hyvärinena et al. (2011) and (Warren et al. 2012). However, the spectral resolution that is available in the SWIR from this instrument is still poor for precision measurement applications, being typically of the order of 3 nm (~35 cm-1 resolution in the 1.6 μm methane absorption band). This is too coarse2 for the purposes of determining useful information about the ambient atmospheric concentrations of methane in the context of landfill emissions.
In summary, while dispersive spectrometers present greater flexibility in terms of both stability and size and weight than FTS or FPE systems, the current technology (spectral resolution) is not suitable for making remote sensing measurements of methane from a small UAV.
3.2 Open path active remote sensing sensors
3.2.1 DIAL
Differential absorption LIDAR (DIAL) is a laser-based method of measuring and mapping concentrations and mass emissions of various molecules in the lower atmosphere. The measurement relies on the unique ‘fingerprint’ absorption spectrum of each molecule, with the DIAL instrument transmitting at two wavelengths:
• an ‘on-line’ wavelength that is absorbed by the gas of interest
• an ‘off-line’ wavelength that is not absorbed
The differential absorption between the two wavelengths is a measure of the concentration of the gas as a function of range.
These concentrations can be converted into mass emissions by making a series of scans with the DIAL along different lines within a plume and combining these with meteorological data. These measurements are then used to produce a mass emission profile for a whole site, for instance for fugitive emissions from an oil refinery or landfill. For a ground-based system, NPL uses DIAL technology in a similar setup to that shown in Figure 3.6.
2 The full width and half maximum (FWHM) line widths in this band are typically less than 0.1 cm-1.

12 Feasibility of aerial measurements of methane emissions from landfills
Figure 3.6 Using a DIAL system to calculate mass emissions over a site
Source: http://www.spectrasyne.ltd.uk/html/technique.html
A DIAL system was developed by Refaat et al. (2013) to measure methane absorption in the SWIR (at 1.6 µm). This can be, and has been, operated either from the ground, or from an aircraft or UAV platform. From an airborne platform, the reflected radiation from the surface for both pulses is collected with a telescope and imaged onto photodetectors. This then produces column-weighted-average volume mixing ratios for the target gas. The diameter of the telescope receiver is typically 0.4 m, with a receiver FOV of 500 μrad.
The main limitations of these DIAL systems for small UAV platforms are their cost, weight and bulk. For example the Global Ozone Lidar Demonstrator (GOLD), which like the Refaat et al. (2013) system was also developed by Fibertek Inc., weighs ~350 kg (Hair et al. 2010).
In conclusion, the weight and cost restrictions of current DIAL technology preclude it from being used on board a small UAV.
3.2.2 Tuneable diode laser absorption spectroscopy
Tuneable diode laser absorption spectroscopy (TDLAS) works by transmitting a beam of light through the atmosphere, and then tuning the beam’s wavelength to one of the target gas absorption lines and scanning across it, allowing a measurement of beam absorption across the wavelength of the scan by the target gas. The concentration of the target gas integrated over the beam’s path length can then be deduced from the Beer–Lambert law.
The laser wavelength is scanned across the targeted absorption feature to include regions of non-target-absorption (baseline) on both sides of the absorption feature. The baseline regions indicate the level of attenuation due to effects other than the target molecule absorption, for example, ash, soot and water vapour. This baseline may fluctuate quickly due to effects such as turbulence and variable opacity, but the ratio of the size of the absorption feature to the baseline does not change for constant target concentration. It is this ratio that is used to quantify concentrations. Therefore, the measurement is robust provided that sufficient light remains to be detected above any detector noise or radiometric measurement uncertainty.

The TDLAS instrument developed by Frish et al. (2013) transmits a laser beam (centred at 1.6 µm for methane) which then illuminates a distant surface. The transceiver collects laser light backscattered from the illuminated surface and concentrates the received laser power onto a photodetector, where the amount of methane in the sampled air mass can be calculated. This process is known as Standoff-TDLAS, and is illustrated in Figure 3.7.
Figure 3.7 Basic setup of the Standoff-TDLAS system
Source: Frish et al. (2007)
The technique developed by Frish et al. (2013) is available as COTS technology, and has been implemented by Picciaia et al. (2011) for use on board a small UAV for the detection of methane fugitive emissions over a landfill site. The preliminary results are promising, indicating that such a system can make useful measurements in principle. However, the accuracy in the calculations of flux at low absolute ambient concentrations of methane in the study by Picciaia et al. (2011) was noted to be poor. This low accuracy was related to the poor knowledge of the wind (winds were estimated rather than directly measured) and hence the uncertainty on the advective term in their approach, rather than to the accuracy of methane column measurement. In the context of this study, direct measurements of winds may be possible from the UAV platform and surface locations (see Section 4).
If fitted with a range finder to provide the path length between the detector and the ground, the Standoff-TDLAS instrument described here could be used to calculate the average methane across the total column. The airborne unit streams data output via the commercially available Vaisala RS-232 radio system, and if the data is telemetered to a ground station, integrated software can acquire, store and display data in real time. If rangefinder data are also telemetered, additional software could calculate the average concentration across the column (Mickey Frish, Industrial Sensors, Physical Sciences Inc., personal communication, January 2014). The lower detection limit of the above system is quoted at ~5 parts per million metres (ppm m) at a standoff range of ~30 m, thereby giving an average lower detection limit of 5 ppm m per 30 m (~0.16 ppm). This is sufficient to permit detection of typical ambient background concentrations; however accuracy and precision can only be determined when compared with calibrated precision in situ instruments. This requirement is discussed further in Section 6.
The Standoff-TDLAS system weighs ~2.5 kg and could therefore suitable for integration onto a small UAV with total weight of less than 7 kg. The sensor itself is

14 Feasibility of aerial measurements of methane emissions from landfills
1.4 kg (including batteries), the rangefinder is ~1 kg, and the weight of the telemetry board is ~100 g. If the UAV supplies power (from its motor turbine or other UAV peripheral systems), the sensor and rangefinder batteries can also be eliminated, thereby further reducing the weight. The system requires a few watts average power, mostly for telemetry, and the costing of this system (without UAV) is between $50,000 and $100,000 (Mickey Frish, personal communication, January 2014).
4 In situ instrumentation The term ‘in situ’ refers to the measurement of a quantity directly within a sampled volume of air. This section discusses the measurement of methane concentration and wind using in situ techniques, including closed path remote sensing.
The accurate measurement of wind is critical for the calculation of fluxes using the methane measurements from a UAV (or any other) platform or instrument, with ground-based meteorological sensors possibly not providing the required spatial and vertical resolution. Therefore, it is recommended that the wind vector be measured using instrumentation on board the UAV itself, as well as on the ground to add verticality.
Furthermore, all the remote sensing measurements described in Section 3 require validation and calibration against other calibrated instruments. Validation can be achieved through dedicated field trials to assess any sources of random error or bias statistically. It is essential to perform calibration before and after any operational activity, or ideally throughout such activity, to account for potential sources of systematic bias. This need is further discussed in Section 6.
4.1 Wind Wind is calculated as the difference between aircraft speed relative to the Earth (inertial velocity) and relative to the airflow (true airspeed).
One method of measuring the wind vector is by the displacement of the UAV during a spiral flight trajectory, which is analogous to wind measurements made with a balloon. A Pitot tube mounted on the nose of a fixed-wing UAV could instead be used to calculate the horizontal wind. However, because only scalar wind is available (no airflow angles), the wind vector can only be calculated by performing special manoeuvres, giving a horizontal resolution of about 300 m.
A suitable instrument in the context of UAVs would be the meteorological mini aerial vehicle (M2AV), developed by Van den Kroonenberg et al. (2008) (Figure 4.1). This system uses a five-hole probe (5HP), in addition to a GPS receiver and inertial measurement unit (IMU), meaning that an inertial sub-range of locally isotropic turbulence can be measured up to 40 Hz (or 0.55 m at 22 ms-1 airspeed).
For weaker wind conditions, the M2AV data were found to agree with SODAR (sonic detection and ranging) and meteorological tower data to within 1 ms-1. In stronger winds, the M2AV measured higher mean wind speeds compared with nearby SODAR profiles, but agreed well with tower measurements.
From the work carried out by Van den Kroonenberg et al. (2008), it would appear that in order to accurately characterise the wind vector, any UAV would also need to be fitted with a 5HP, GPS receiver and IMU.

16 Feasibility of aerial measurements of methane emissions from landfills
Figure 4.1 M2AV system
Source: Van den Kroonenberg et al. (2008)
4.2 In situ instrumentation Current in situ sensing technologies are based on electrochemical, gravimetric or closed path optical remote sensing technology – all of which have their advantages and disadvantages.
Electrochemical methods based on, for example, metal oxide films (Tamaki et al. 2003) have potential as they inexpensive and portable (Kiriakidis et al. 2008). Sensors based on metal oxide semiconductors are mainly applied to detect target gases through redox reactions between the target gases and the oxide surface (Yamazoe and Shimanoe 2002). This process includes two steps:
(1) Redox reactions, during which oxygen distributed on the surface of the materials reacts with molecules of the target gas, leading to an electronic variation of the oxide surface.
(2) This variation is transduced into an electrical resistance variation of the sensors.
However, electrochemical sensors are not inherently selective and can suffer from cross interference. To overcome this interference, Mead et al. (2013) have shown that the use of a multi-sensor enables carbon monoxide (CO), ozone (O3), nitric oxide (NO) and nitrogen dioxide (NO2) to be derived directly on mobile and static platforms in the urban environment.
Solid state electrochemical sensors have relatively poor sensitivity at room temperature, whereas carbon nanotubes have unique properties that have potential for being highly sensitive gas sensors. In general, carbon nanotubes have a much greater adsorptive capacity with a large surface area to volume ratio resulting in significant changes in electrical properties compared with conventional electrochemical sensors (Thai et al. 2011). Although carbon nanotube sensors can be sensitive down to 50 pbb, they still have a time response of 100 seconds. This greatly limits their application to landfill flux calculation derived from measurements in air that typically changes in character (for example, wind, methane concentration) over much shorter timescales (of the order of seconds) (Park et al. 2009).
Gravimetric sensors such as the quartz crystal microbalance (QCM) or surface acoustic wave (SAW) devices are well suited as transducer elements for chemical sensors being portable, rapid and sensitive. For applications in chemical sensing, a

recognition element is added to the acoustic wave device capable of selectively binding or reacting the analyte to the device surface. The response of these devices is based on a change in their resonant frequency as mass is attached to the device or to the recognition element. The effectiveness of SAW devices for field-based atmospheric applications was demonstrated by Hansford et al. (2006), who used the mass sensing principle to determine the dew point variation with altitude. However, such devices are operationally limited by the lifetime of the coating (Muller et al. 2011).
Optical (close path remote sensing) techniques (Ando 2009) have promising limits of detection (LODs) – much lower than typical ambient methane concentrations – and response times are of the order of seconds. The use of a high-finesse cavity permits hundreds, or even thousands, of traverses through the absorber, and thus reaches markedly long effective path lengths and provides excellent detection sensitivity. The two main approaches are:
• cavity ring-down spectroscopy (CRDS), based on the measurement of the time for light to decay within the cavity, as utilised by Picarro instruments
• a continuous wave (CW) cavity-enhanced absorption spectroscopy (CEAS) with an off-axis alignment of the cavity geometry and with time integration of the output of the cavity for measurement of the absorption of narrow-band and broadband absorbers, as utilised by Los Gatos instruments
However, closed path remote sensing application as gas sensors on UAVs are challenging due to miniaturisation and relatively high cost. Despite these challenges, these sensors could provide the most accurate and fastest (and therefore useful) methane concentration measurement that would enable flux measurement while still just being within the weight and power constraints of currently available UAV platforms (see Section 4.3). Infrared-source gas sensors (using closed path remote sensing) based on optical sensing principles are widely used and have been used successfully to measure atmospheric methane from aircraft (O’Shea et al. 2013), albeit not yet on-board UAVs.
The University of Manchester recently purchased a portable analogue of its large aircraft counterpart – a Los Gatos Research Ultraportable Greenhouse Gas Analyser –known as the LGR-UPGA (see Figure 4.2).
The LGR-UPGA reports measurements of methane, carbon dioxide and water vapour simultaneously. In addition, it reports and stores all measured absorption spectra. This allows the instrument to accurately correct for water vapour dilution and absorption line broadening effects, and thus to report methane and carbon dioxide on a dry mole fraction basis without drying or post processing.
The measurement rates are user selectable between 0.01 and 1 Hz with 1σ 5 sec/100 sec precision of 2 ppb/0.6 ppb, 300 ppb/100 ppb and 200 ppm/60 ppm for methane, carbon dioxide and water vapour, respectively.
The measurement range for the instrument is reported as being 0.01–100 ppm, 200–2,000 ppm, 7,000–70,000 ppm for methane, carbon dioxide and water vapour, respectively, with an uncertainty of <1% without calibration, in the temperature range 10–35°C.
The power requirements of the LGR-UPGA are between 60 and 66 W depending on operating procedures, and the dimensions and weight of the device are 18.5 feet × 14 feet × 7 feet, and 15 kg, respectively.
The precision and cost of this instrument, coupled with a weight and power requirement that is just within the limit of UAV constraints, make this technology a very promising candidate.

18 Feasibility of aerial measurements of methane emissions from landfills
Figure 4.2 LGR-UPGACRDS system
4.2.1 Current measurement of trace gases on UAVs
Astuti et al. (2009) installed off-the-shelf solid state electrochemical sensors to measure sulphur dioxide (SO2) and an IR spectrometer to measure carbon dioxide on a UAV to monitor volcanic eruptions. This early work showed it was possible to incorporate a gas sensor system on a UAV, but the experiment focused on integration rather than quantification of trace gas species.
Berman et al. (2012) developed a compact, lightweight atmospheric gas analyser integrated in a UAV (Figure 4.3). The unit utilises two lasers:
• a 1650 nm laser for methane measurements
• a 1603 nm laser for simultaneous measurements of carbon dioxide and water
The instrument measures approximately 30.5 cm × 30.5 cm × 28 cm, and weighs 19.5 kg. It has a 1σ precision of ±0.6 ppm for carbon dioxide, ±2 ppb for methane and ±35 ppm for water for a 1 Hz measurement frequency.
The instrument was installed on the NASA Sensor Integrated Environmental Remote Research Aircraft (SIERRA) UAV.

Figure 4.3 UAV greenhouse gas analyser (a), integrated into the SIERRA nose cone (b)
Source: Berman et al. (2012)
Illingworth et al. (2014a) adapted an electrochemical concentration cell (ECC) ozonesonde to fly on a fixed-wing low altitude, short endurance (LASE) UAV (Skywalker). The ECC ozonesonde has a typical relative precision of ±3–6% (Smit and Strater 2004), corresponding to ~1–2 ppb at the concentrations measured here, with a sampling frequency of 0.5 Hz. It was shown that the UAV measured O3 variability at the sub-urban scale.
Figure 4.4 Integrated ozonesonde and Skywalker airframe
Source: Illingworth et al. (2014a)
4.2.2 Future directions
Miniaturisation of optical sensors
The advent of light-emitting diodes (LEDs) operating in the mid-IR region (3–5 μm) made possible the development of a very compact and high performance optical sensor that can monitor ambient concentrations of carbon dioxide and methane with good precision (Allen 2011). In conjunction with miniaturised multipass cells, Krzempek et al. (2013) could produce low cost lightweight, compact detectors for a range of volatile organic compounds (VOCs) and thus overcome the restrictions of optical

20 Feasibility of aerial measurements of methane emissions from landfills
techniques on only large UAV platforms. Indeed, they demonstrated it was possible to produce a device that can detect ethane with a 1σ minimum detection limit of 740 parts per trillion volume (pptv).
Photoionisation detectors
Ultraviolet (UV) photoelectron spectroscopy (PES) has been shown to be a powerful spectroscopic tool for the universal detection of radical and stable species (see, for example, Dyke et al. 1979, Copeland et al. 2011). The species investigated are normally ionised using He(I) (21.22 eV) radiation and an electron energy analyser is used to measure the kinetic energy spectrum of the ejected photoelectrons. The photoelectron spectrum can be interpreted as electron ejection from the occupied orbitals of the atom or molecule studied. Also, the vibrational structure and envelope of a photoelectron band can be used in conjunction with Franck–Condon analysis to infer the structural changes on ionisation (Berkowitz 1989).
Photoionisation detectors (PIDs) use the same principle to detect VOCs and convert ejected energy into a current without energy analysis. The loss of energy analysis results in a sensor that is not selective. PIDs can detect VOC levels at the sub ppb level, are low power and lightweight, and ideally suited to deployment on UAVs. However, further work is required to obtain selectivity via, for example, separation techniques.
4.3 Summary of recommended instrumentation TDLAS has been identified (Section 4.2) as an open path remote sensing technology that is currently available in a COTS format suitable for integration with small UAVs at a cost of around £50,000 (instrument only). The low weight and low power restrictions suggest that it could be flown on board a 20 kg (total weight) UAV, and potentially also a 7 kg UAV with careful design. This system, developed by Industrial Sensors, Physical Sciences Inc. (PSI), could be integrated with existing University of Manchester UAV systems. The system has a limit of detection of ~1,600 ppb (just below ambient levels), but there is yet little validation of the technique in terms of accuracy, measurement stability, or resolution (that is, incremental reporting of concentration above the LOD). A full validation and calibration exercise would be required prior to the production of useful flux quantities (see Section 6).
Photoionisation cells offer a cheaper option (~£200 per sensor at time of writing) and are extremely small (few cm) and light (<200 g), with low power requirements (a few Watts). However, they are fundamentally limited for the application considered here as they currently have limits of detection and accuracy much lower than that necessary to provide any useful flux estimate.
Conversely, the LGR-UPGA CRDS closed path remote sensing system, described in Section 4.2, offers a lower cost (than TDLAS), highly precise (but in situ) measurement system, while still being within the weight and power constraints of current UAV systems. In the authors’ view, the inability to sample the (less accurate) total column (as in open path remote sensing) is outweighed by the advantage of precision (but in situ) measurement offered by closed path systems. With rapid vertical sampling (such as that offered by UAVs), this limitation is also easily overcome. Furthermore, in situ instrumentation on a UAV can provide upwind measurements that are useful in the flux modelling approaches discussed in Section 5.

Therefore, the CRDS system is recommended by the authors of this report as the best available current system suitable for both integration with UAVs (<20 kg) and the precision measurement necessary for robust flux calculation.
One of the critical aspects in quantifying flux measurements from a landfill site is the accurate measurement of wind. This means that, in addition, any potential UAV design must also incorporate such capability (for example, a 5HP, see Section 4.1).

22 Feasibility of aerial measurements of methane emissions from landfills
5 Sampling design and methods
It is essential that sampling design by any method or combination of methods is carefully tailored to the site or spatial scale of interest to optimise the density and frequency of concentration and the wind data from which to invert or calculate flux information. Methods from which to derive resolved net surface fluxes at the scale of typical UK landfill sites (<100 hectares) include:
• eddy covariance
• mass balancing (or box modelling)
• in situ chamber monitoring
Each of these methods has its own advantages and disadvantages with respect to accuracy, spatial representivity, practicality and cost. This section outlines the potential of eddy covariance and mass balancing for UAV measurement at landfill sites.
5.1 Eddy covariance Eddy covariance, also known as eddy correlation and eddy flux, is a key atmospheric measurement technique for the measurement and calculation of vertical turbulent fluxes within atmospheric boundary layers. The method analyses high-frequency (typically 20 Hz or greater) wind and state data (for example, gas concentration), and yields vertical fluxes for these parameters. It is a statistical method used in meteorology and other applications to determine exchange rates of trace gases over natural ecosystems, agricultural fields and so on.
The technique has been used extensively to estimate carbon dioxide and methane fluxes at spatial scales commensurate with those considered here (see, for example, Baldocchi et al. 1988, Verma 1990, Aubinet et al. 2013, Burba 2013). The accuracy of calculated fluxes can be limited by the nearby presence of steeply rising (and falling) topography that can perturb the flow characteristics across the typical scale of landfill sites over short timescales (seconds).
Operationally, the eddy covariance measurement system typically consists of a high frequency anemometer and temperature and pressure sensors, together with a high frequency measurement of the parameter of interest – in this case methane (see Figure 5.1).
These measurements are usually recorded on a tower, often at positions as high as possible, in order to measure a range of eddy spatial scales. It is also possible to perform eddy covariance measurement from aircraft (see, for example, Hiller et al. 2014), including UAVs but a static tower may be more appropriate to local-scale emission sources and flux footprints.
The eddy covariance technique is mathematically complex and requires significant care in setting up and processing data. Put simply, the eddy flux is computed as the covariance between an instantaneous deviation in vertical wind speed from a mean vertical wind value and an instantaneous deviation in gas concentration mixing ratio from a mean background value, multiplied by the mean air density. Several mathematical operations and assumptions are involved in getting from physically complete equations of the turbulent flow to practical equations for computing the flux.

Figure 5.1 Eddy covariance schematic showing turbulent eddies in the Earth’s boundary layer and a typical eddy covariance flux tower
Source: Figure courtesy of Licor Inc. (http://www.licor.com/env/products/eddy_covariance/theory.html)
To date, there is no uniform terminology or a single methodology for the eddy covariance technique, but much effort is being made by flux measurement networks (for example, Fluxnet, Ameriflux, ICOS, CarboEurope, Fluxnet Canada, OzFlux, NEON and iLEAPS) to unify the various approaches. This non-uniformity in approaches can lead to sources of systematic bias between measurement locations and instruments (see Massman and Lee 2002, for an excellent summary of these issues).
An immediately obvious, and likely, source of systematic bias – in addition to the mathematical and instrumental sources described above – with the eddy covariance technique is the implicit assumption of the mean background concentration from which any measured enhancement is assumed. This problem is common to all flux methods (global, regional or local) described here and elsewhere in this study.
In the authors’ extensive experience with the measurement of methane fluxes, it is extremely difficult to assume any static (or slowly varying) methane background in the natural environment (that is, constant concentration in air flowing into the flux footprint of interest). In other words, the methane in the air flowing into a site of interest is always changing – sometimes subtly, sometimes markedly – over the range of timescales important to eddy covariance flux calculation. This is because the air flowing into the flux footprint contains the sum of all surface emissions (and sinks) and atmospheric chemical modulation throughout the entire history of the airmass. The modulation of this background may be low enough in idealised conditions (for example, constant inflow of air from a long-range ocean fetch) for short-term fluxes to be well-apportioned in the local frame. Such conditions are rare, however, especially for densely populated areas.
The effect of background modulation can, in principle, greatly perturb the calculated local flux unless the background is re-evaluated frequently. Therefore, in addition to eddy covariance towers, it would always be necessary (in the authors’ opinion) to take advantage of, or otherwise provide, measurements at locations just upwind of the site of interest to continuously evaluate any changing background. This need is common to all bulk airmass flux techniques, including the mass balancing method discussed below.

24 Feasibility of aerial measurements of methane emissions from landfills
5.2 Mass balancing The principle of mass balancing is essentially – and simply – one of measuring what goes into and out of some volume of air and evaluating any difference as the net surface flux (or chemical modulation) within that volume in the time between inflow and outflow measurement.
For methane, the chemical lifetime is extremely long (~10 years) relative to the emission (and measurement) timeframe considered here and so chemical modulation can be ignored. In this scenario, the total flux (in mol s-1) integrated between the point of upwind and downwind measurement can be calculated from the following equation:
(5.1)
where Sij is the mole fraction (mol mol-1) of species S for each coordinate on the vertical plane AB (oriented perpendicular to the prevailing mean wind vector), S0 is the measured (or assumed) background, which is calculated as the mean mole fraction upwind. The nij term is the mole density of air (mol m-3), which is determined using an ideal gas assumption. The (m s-1) term is the wind speed perpendicular to the downwind plane AB. Fluxes are then integrated over some vertical extent and horizontal (AB) extent of the plane to calculate a total flux through this plane. The area-averaged surface flux can then be calculated by dividing the bulk flux by the surface area bounded by the measurement box.
This method carries the caveat that spatially resolved fluxes within the box cannot be discerned – the flux is a bulk quantity for the box in question. However, with careful sampling design, such boxes can be appropriately defined to sample regions of interest within the perimeter of sites (for example, operational versus closed/capped areas).
Crucially, this method permits robust quantification of uncertainty (unlike other approaches which may not always quantify sources of error) as the statistical error on each of the terms in equation (5.1) can be expected to be known as each term represents a direct measurement from instrumentation with calibrated uncertainty and bias. In summary, so long as measurement uncertainty is known, the resultant error in the derived flux can be evaluated from error propagation through equation (5.1).
This technique has recently been successfully applied to aircraft-based measurements of methane and other trace gas fluxes at the urban scale (see, for example, O’Shea et al. 2014, and references therein). In the study by O’Shea et al. (2014), fluxes for the Greater London area were derived as a snapshot for one day in summer 2012. Uncertainties in methane and carbon dioxide flux using the above method were of the order of 10%.
The CRDS system proposed here has measurement uncertainty around a factor of two worse than the LGR Fast Greenhouse Gas Analyser on the UK Facility for Airborne Atmospheric Measurements (FAAM) aircraft described by O’Shea et al. (2013). Assuming similar accuracy for other components in equation (5.1) and sampling at 1 Hz, this would result in a ~20% uncertainty on fluxes from UAVs. However, the exact uncertainty is a function of the variability in background, which can only be determined in the field for conditions on the day.
The principal limitation of the mass balancing approach is one of density and frequency of sampling, and any assumptions that are therefore required. This is the subject of the following section.

5.3 Sampling considerations The ideal sampling of a site to calculate absolutely accurate surface flux would require complete, continuous 3D sampling of a site with 100% measurement accuracy. Clearly, this is impossible. Therefore, to obtain the best possible flux estimate (with a known uncertainty), it is important to design sampling appropriately and optimally within the constraints of cost, practicality and desired flux uncertainty.
It is essential to balance the rate and density of measurement coverage of a site against the expected rate of change of flux and/or background inflow. Too slow and what may have been measured in one scan of an area of a site may have advected with the wind. This can lead to a variety of significant sampling artefacts if not carefully considered. Rapid scanning of a site is therefore important and preferable. Static ground-based scanning remote sensing platforms may be useful in this regard but suffer from the fact that they ‘see’ total column concentrations from a fixed viewpoint. This means that they therefore rely heavily on tomographic techniques and an inherent decrease in spatial resolvability and accuracy with distance from the observer. Moving remote sensing platforms could overcome this problem by optimising (and changing) sensitivity in the 3D frame.
Figure 5.2a shows an example of aircraft-measured in situ methane concentrations around London in the 3D frame. The discrete data points in Figure 5.2a have been interpolated onto a regular grid using the kriging methodology described in detail and applied by Mays et al. (2009) to define a continuous measurement plane (with a known statistical uncertainty in the data gaps). It is this measurement plane that represents the Sij and S0 terms in equation (5.1) as a function of distance in the vertical and horizontal. The statistical uncertainty increases with distance from a ‘true’ measurement point. This is one of the limiting factors in in situ measurement in the context of mass balancing (that is, sparse sampling). However, remote sensing offers a way to fill the data voids in Figure 5.2, thereby reducing the uncertainty associated with the interpolated field in Figure 5.2b.
Figure 5.2 Aircraft methane measurements downwind of London
Notes: Horizontal distance is defined perpendicular to the centre of a pollution plume moving with the prevailing wind.

26 Feasibility of aerial measurements of methane emissions from landfills
The discrete flight tracks shown in panel (a) have been interpolated over a two-dimensional plane using a kriging methodology for panel (b), which shows the total methane flux through the plane.
Source: O’Shea et al. (2014)
The improved sampling of remote sensing is demonstrated in Figure 5.3, which shows retrieved methane concentrations from FTS spectra recorded on the FAAM aircraft (see Allen et al. 2014). Essentially, it is possible to obtain ‘curtains’ of methane concentration as an aircraft flies over a surface, greatly increasing the sampling seen in Figure 5.2a. But because remote sensing is typically less accurate than any in situ measurement, it ideally requires synergistic in situ measurement from which to continuously validate or normalise retrieved quantities.
Figure 5.3 Methane concentration curtains retrieved from FTS remote sensing on the FAAM aircraft
5.4 Recommended sampling This section discusses optimal sampling design and instrument requirements based on the considerations raised in Section 5.
In principle, UAVs equipped with remote sensing and in situ instrumentation could provide fluxes derived from either eddy covariance or mass balancing. However, the authors believe that eddy covariance fluxes would be more appropriately derived from a fixed tower for long durations; however, this is beyond the scope of this study, which is limited to an assessment of the readiness of techniques on UAVs for flux measurement. Therefore, the mass balancing approach (see Section 5.3) is suggested as an optimal current method from which to derive fluxes from small UAVs as these moving platforms can densely and rapidly sample (or scan in the case of remote sensing) air over a typical landfill site.
The rapid sampling of the vertical column by closed path remote sensing as a UAV flies up and down and over a site provides dense sampling and the potential for spatially disaggregated fluxes within the site perimeter (for example, as bounded by the race-track pattern in Figure 5.4).

Figure 5.4 Recommended sampling schematic for a typical landfill site
Notes: Red arrow exemplifies prevailing wind over the site. Yellow racetrack represents sampling by in situ techniques
A possible optimal sampling configuration is shown in Figure 5.4. In this design, high precision in situ measurements on a moving UAV platform would be recorded by racetrack measurements of the site perimeter and within; this would also provide an upwind and downwind background measurement. It would be advantageous to fly up and down throughout the boundary layer during this perimeter racetrack to increase the spatial sampling and verticality. In this design, the precision in situ measurement could be achieved from a CRDS system. In principle, this sampling network could be added to with additional platforms to provide additional and more rapid sampling, with potential benefits on accuracy given the error propagation implicit in equation (5.1). However, this would mean a potential doubling of costs for instrument use and operation for less than a two-fold increase in accuracy.
Using equation (5.1) with typical assumptions for landfill environments and prior flux, it can be calculated that a flux uncertainty (at 1σ of the mean) of 20% would be achievable using a system with >5 ppb accuracy sampling at 1 Hz on a UAV flying at <20 ms-1 and sampling a vertical profile between surface and 100 m once per two-minute period for a total time of approximately two hours at an idealised square 10 ha site.
Section 6 describes suitable platforms for the above sampling design, together with their cost, practicality and regulatory implications.

28 Feasibility of aerial measurements of methane emissions from landfills
6 UAV systems The recommended sensor suite for remote sensing of fugitive emissions, in the near-term, is the combination of a CRDS remote sensor platform with wind sensors to measure upstream and downstream fluxes.
6.1 CRDS remote sensing platform The fast response nature of the CRDS system provides multiple basic options for integrating into a small, unmanned aircraft. Given the maximum sensor weight of ~10 kg, it is possible to place it on an aircraft that has a total mass <20 kg. This could be either a fixed-wing or multi-rotor vehicle. The main decision point would be the trade-off between a larger coverage area and maximisation of measurements above a specific point on the ground. It is recommended that mission plans be based on larger platforms. This is especially true of the multi-rotor option, which generally has shorter flight durations and will suffer a greater weight penalty to incorporate the 3D wind measurement device.
6.1.1 Fixed-wing option
The fixed-wing options available are quite broad. In the case of a small site or proof of concept where shorter time aloft is required, the recommendation is an aircraft in the class of the Bormatec Explorer, a twin-motor electrically powered aircraft (Figure 6.1). Further information on this example UAV is provided in Appendix B.
The current combination of payload and battery would provide sampling durations of approximately 10 to 20 minutes. In addition to the more open operational regulatory environment, the small size of this class of UAV allows the aircraft to be launched and recovered from relatively small, flat grassy spaces (that is, it does not require a road or runway).
Figure 6.1 Bormatec Explorer aircraft
These UAVs have a typical cruise speed of approximately 15 ms-1 (54 km h-1), which would allow them to sample a reasonable area in the available flight time. However, they would not be able to obtain a significant number of samples above a single point on the site.
The cost of the basic airframe and flight support systems for the purchase of, for example, an Explorer is £1,500–4,000 depending on the autopilot systems used. It was not possible to find out how much it costs to hire such vehicles commercially.

For larger sites, or longer duration flights, a UAV in the class of UAV Factory Penguin B or Penguin B–Electric (see Figure 6.2) small unmanned aircraft is recommended with a maximum take-off weight (MTOW) in the 20 kg range. These aircraft can easily provide long duration sampling missions of over an hour. This is appropriate for larger sites or cases where repeated sampling of the same site over a long period of time is desired.
Figure 6.2 UAV Factory Penguin B
Due to the similar nature of the sampled gases, use of an internal combustion, fuel-powered aircraft is not recommended for these missions. Furthermore it is anticipated that electric power versions would have sufficient coverage area and sampling duration for the needs of this work.
A further advantage of the fixed-wing options is the ease of integration of the 3D wind sampling probe. This is because the probe can be placed in the nose of the aircraft, providing easy access to an area outside the aircraft’s sphere of influence – a problem with multi-rotor configurations. The primary downside of the larger aircraft in the small UAV class is that they require a straight paved landing surface, such as an access road, for launch and recovery. As an example, the Penguin B’s acquisition cost, with all flight support and control systems is approximately £25,000.
6.1.2 Multi-rotor option
Multi-rotor options such as the Stedidrone QU4D X system (Figure 6.3) offer the advantage of stop-and-stare measurement. However, their rotary nature means that air is constantly drawn down around the airframe with consequences for the utility of the data in representing a point measurement.
Figure 6.3 Steadidrone QU4D X
30 Feasibility of aerial measurements of methane emissions from landfills
There are alternative COTS units that would require almost no integration. However, the cost of purchase of similar systems such as Aibiotix (www.aibotix.com) may be well in excess of £20,000 (informal personal communication).
6.1.3 Summary of small UAV options
Depending on the final weight, power consumption and station keeping requirements for the CRDS sensor and sampling mission, the recommendations given above are summarised in Table 6.1.
Table 6.1 Summary of small UAV options for CRDS sensor
Sensor mass Sensor power requirement
UAV class UAV type Example UAV
≤10 kg <100 W ≤20 kg Fixed-wing Penguin B, liquid fuel
≤6 kg
<50 W Penguin B, electric
Multi-rotor Stedidrone QU4D X
≤3 kg <50 W ≤7 kg Fixed-wing Bormatec Explorer
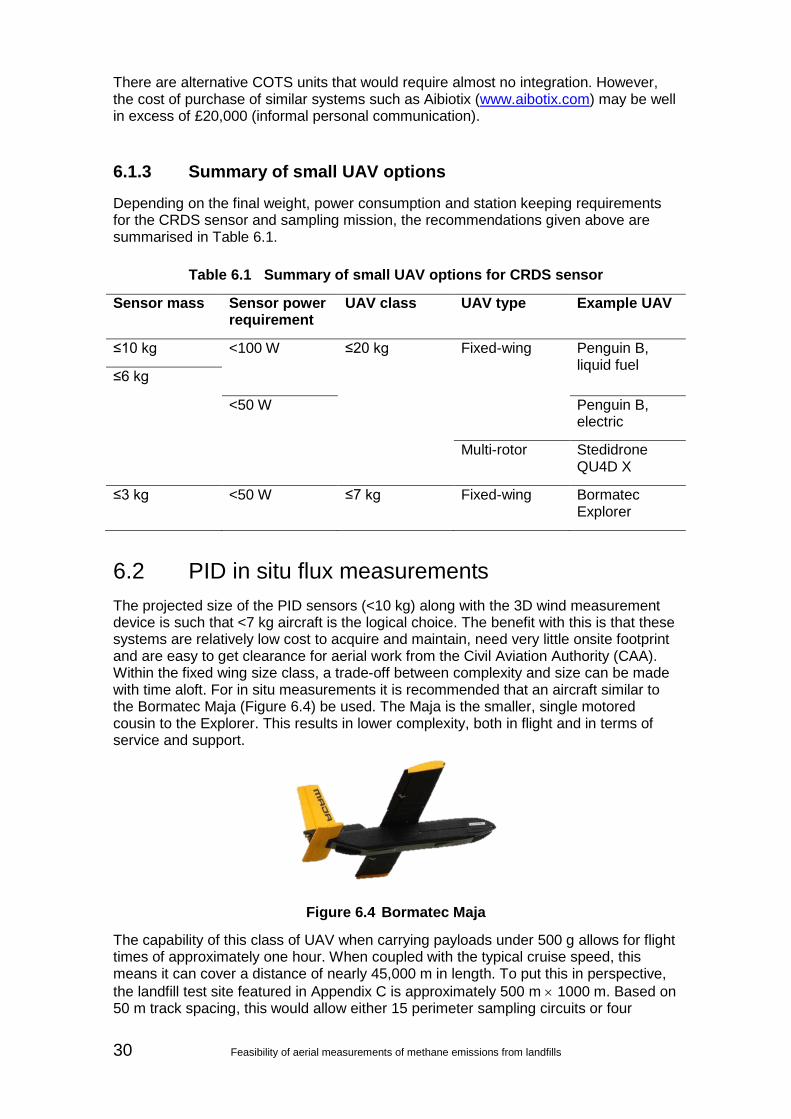
6.2 PID in situ flux measurements The projected size of the PID sensors (<10 kg) along with the 3D wind measurement device is such that <7 kg aircraft is the logical choice. The benefit with this is that these systems are relatively low cost to acquire and maintain, need very little onsite footprint and are easy to get clearance for aerial work from the Civil Aviation Authority (CAA). Within the fixed wing size class, a trade-off between complexity and size can be made with time aloft. For in situ measurements it is recommended that an aircraft similar to the Bormatec Maja (Figure 6.4) be used. The Maja is the smaller, single motored cousin to the Explorer. This results in lower complexity, both in flight and in terms of service and support.
Figure 6.4 Bormatec Maja
The capability of this class of UAV when carrying payloads under 500 g allows for flight times of approximately one hour. When coupled with the typical cruise speed, this means it can cover a distance of nearly 45,000 m in length. To put this in perspective, the landfill test site featured in Appendix C is approximately 500 m × 1000 m. Based on 50 m track spacing, this would allow either 15 perimeter sampling circuits or four

coverage circuits to be taken in each flight. This provides both good coverage and sampling repetition rates in a single operation. If additional time aloft is needed, a larger aircraft, for example, the Explorer, could be used, effectively doubling time aloft and the number of samples taken.
The acquisition cost for the Maja and its associated mission management hardware is slightly less than the Explorer, in the range of £1,000 to £3,500 depending the mission management systems chosen.
6.3 Other UAV systems So far this report has focussed on the use of remote sensing instrumentation for monitoring methane on board small UAVs (that is, total weight of less than 20 kg). However, there are three other major types of UAVs that could also make these measurements:
• tethered balloons
• large UAVs
• high altitude platforms (HAPs)
This section considers possible remote sensing technology that could be used on these platforms. It also provides comments on why such platforms may not be suitable for this study at the present time.
6.3.1 Tethered balloons
Remote sensing instruments capable of flying on the tether line of a sturdy tethered balloon have been used to help bridge sampling gaps between ground-based and satellite instrumentation (Chen and Vierling 2006). Because the flight altitude of a tethered balloon can be precisely controlled and rapidly changed, a balloon-mounted remote sensing platform can acquire surface spectral data at a variety of spatial scales ranging from >5 m diameter FOV to the level of moderate resolution satellite sensors, that is, ~500 m diameter FOV.
Tethered balloons may carry much heavier instrumentation than the small UAVs considered so far in this report. For example, the balloon used by the Short Wave Aerostat-Mounted Imager (SWAMI) platform is capable of attaining 78 kg free lift at sea level (Vierling et al. 2006). The platforms on which the instrumentation is mounted also present a greater degree of stability than may be currently afforded by small UAVs.
Balloons may also be able to operate in much stronger winds with a smaller risk of damage to the instrumentation.
The greater flexibility afforded to weight and stability considerations means that the TIR FTS instruments described in Sections 3.1 and 3.2 could feasibly be mounted on board the platform of a tethered balloon. However, no COTS instrumentation currently exists that has been specifically tailored to make balloon-borne remote sensing measurements of methane. The balloon-borne Michelson interferometer for passive atmospheric sounding (MIPAS-B2) (Friedl-Vallon et al. 2004) could allow such measurements to be made, but this is a potentially expensive system (>£1 million) and represents a unique academic development/instrument. Figure 6.5 shows the MIPAS-B2 gondola ready for launch.
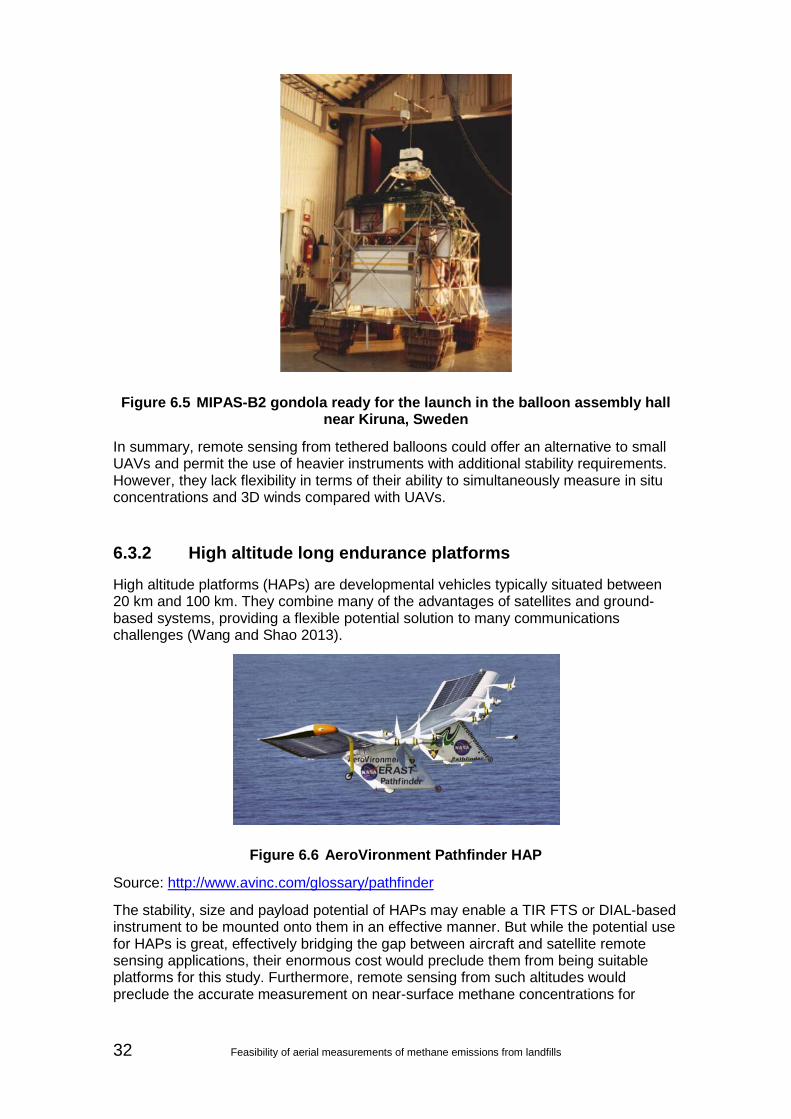
32 Feasibility of aerial measurements of methane emissions from landfills
Figure 6.5 MIPAS-B2 gondola ready for the launch in the balloon assembly hall near Kiruna, Sweden
In summary, remote sensing from tethered balloons could offer an alternative to small UAVs and permit the use of heavier instruments with additional stability requirements. However, they lack flexibility in terms of their ability to simultaneously measure in situ concentrations and 3D winds compared with UAVs.
6.3.2 High altitude long endurance platforms
High altitude platforms (HAPs) are developmental vehicles typically situated between 20 km and 100 km. They combine many of the advantages of satellites and ground-based systems, providing a flexible potential solution to many communications challenges (Wang and Shao 2013).
Figure 6.6 AeroVironment Pathfinder HAP
Source: http://www.avinc.com/glossary/pathfinder
The stability, size and payload potential of HAPs may enable a TIR FTS or DIAL-based instrument to be mounted onto them in an effective manner. But while the potential use for HAPs is great, effectively bridging the gap between aircraft and satellite remote sensing applications, their enormous cost would preclude them from being suitable platforms for this study. Furthermore, remote sensing from such altitudes would preclude the accurate measurement on near-surface methane concentrations for

reasons associated with radiative transfer that are beyond the scope of this study (see Illingworth et al. 2014b for further details).
6.3.3 Large high altitude UAVs
High altitude, long endurance (HALE) UAVs are can be larger than many general aviation manned aircraft; for example the NASA Global Hawk has a wingspan of almost 40 m and a length of approximately 15 m. These UAVs may fly at altitudes of up to 20 km or more on missions that can extend for thousands of km.
A well-known example of a HALE UAV is NASA’s Global Hawk, which has been involved in a number of scientific remote sensing campaigns since 2008. The Global Hawk has an operating altitude of 19,800 m and a flight endurance of over 30 hours, with a payload of ~750 kg (Watts et al. 2012). Figure 6.7 shows an RQ-4 Global Hawk manufactured by Northrop Grumman.
Figure 6.7 An RQ-4 Global Hawk flying in 2007
Source: http://en.wikipedia.org/wiki/Global_Hawk
As with HAPs, measurements made from HALE UAVs such as the Global Hawk represent a useful bridge between traditional airborne and satellite remote sensing instruments, and are far less restrictive than smaller UAVs in terms of their stability and weight limitations. However, their high operating cost (the Global Hawk platform is valued at around $35 million) and current restrictions imposed by the CAA for the operation of UAVs in the UK mean that they are not a viable option for this study.
6.4 Recommended UAV platforms For the recommended CRDS system (Section 4.2), an liquid fuelled or electric motored, fixed wing UAV, at the larger end of the class of small UAVs (for example the Penguin B – see Section 6.1.1) is identified as the necessary platform that could carry the weight and dimensions of the CRDS system. The cost of buying this platform would be ~£12,500, with additional costs for flight software and so on giving a total of ~£25,000.
For the PID sensors, an electric motored, fixed wing UAV of less than 7 kg (see Section 6.2) is the recommended platform.

34 Feasibility of aerial measurements of methane emissions from landfills
7 General UAS regulatory environment
The current regulatory environment for an unmanned aerial system (UAS) falls under a two-part governance scheme. This is similar to the general regulatory environment for manned aircraft in that larger systems fall under the auspices of the European Aviation Safety Agency (EASA) and smaller ones under the local aviation regulation authority; in the UK’s case the Civil Aviation Authority (CAA).
For the purposes of this work this demarcation separates small/medium from large UASs. Those systems that fall under the CAA’s prevue, less than 150 kg maximum take-off weight (MTOW), can be considered small, and those above 150 kg fall under the remit of EASA. The consequence of this is that any UAS larger than 150 kg must meet EASA’s certification requirements, given in CS-23 (EASA 2012) and CS-25 (EASA 2013). These more stringent requirements, based soley on certified, manned production aircraft, mean that for payloads and sampling missions that require aircraft with a MTOW over 150 kg are, at this time, better served by manned aircraft.
For missions with UASs that are less than 150 kg, the CAA has the remit for the regulations. The basic regulations for the operation of all aircraft are contained in the Air Navigation Order, summarised and collated in Civil Aviation Publication (CAP) 393 (CAA 2014). The CAA further distinguishes between small unmanned aircraft , less than 20 kg weight without fuel, and light UAS, less than 150 kg (CAA 2014).
The different regulatory environments are explained in detail in CAP 722 (Safety Regulation Group 2012) and a full breakdown is provided in Appendix A. Table 7.1 provides a quick summary of the critical aspects. The basic result is that the light UAS systems require specific authorisation from the CAA in terms of the airframe, a safe to fly certificate, the operator and the specific flight. This puts a significant burden on operators performing surveys for fugitive emissions, as they must request a temporary exclusion zone around any landfill or similar site. For the small unmanned aircraft, the rules regarding surveillance (CAA 2014) and aerial work still apply. However, there is, or soon will be, a significant body of UAS operators who have the required certification and experience in dealing with the CAA. Furthermore, there are no significant airspace restrictions beyond those given in Table 7.1.
Table 7.1 Summary of regulations and requirements for operation of different UAS systems
Requirement <7 kg <20 kg <150 kg >150 kg
Aircraft certification
No CAA requirement CAA certification or ‘safe to fly’
EASA
Operator CPL or CAA equivalent Commercial pilot’s licence
Operational limits Visual line of sight (VLOS)
VLOS, <500 m distant, <400 feet above ground level (AGL)
Sense and avoid Restricted airspace
Same as manned aircraft

8 Development strategy The steps and costs involved in making this technology a useful and viable operational tool for flux calculation consist of:
• capital investment
• field validation
• operational deployment
The recommended instrumented platform consists of a fixed wing UAV (<20 kg) and a CRDS instrument.
This section outlines the general constraints identified in earlier sections of this report before describing the itemised cost estimates for each of the above steps for a viable CRDS UAV system. All costs are estimates only and do not represent an official quote.
8.1 Measurement-platform constraints Table 8.1 summarises the parameters identified in previous sections in terms of the platform, CAA regulatory, measurement and sampling constraints necessary to achieve a methane flux to within approximately 20% uncertainty. The listed constraints are technical and not economical. The range of potential capital and operational costs for such systems are discussed in the following sections.
Table 8.1 Summary constraints for a UAV methane measurement platform
Parameter Constraint1
Platform weight 20 kg MTOW (including payload)
Payload weight <10 kg
Payload size <40 cm × 20 cm × 20 cm
Payload power <100 W
Methane measurement accuracy2 >5 ppb (1σ @ 1 Hz)
Sampling rate > 1 Hz
Sampling time/duration >120 minutes
Platform speed <20 ms-1
Vertical sampling3 0–100 m once per two-minute period
Notes: 1 The table summarises the necessary constraints to derive fluxes using
mass balancing at an assumed typical site for typical environmental conditions.
2 This represents the random error (or repeatability) of the measurement and not systematic errors (bias), as the latter would not be important in the mass balancing approach.
3 This represents an assumed full cross-section through the vertical extent of a rising plume from a site measured downwind. True conditions will vary from day to day depending on the weather.

36 Feasibility of aerial measurements of methane emissions from landfills
8.2 Capital and hardware investment The purchase of hardware represents an initial cost. Maintenance cost/needs and operational lifetime are estimated based on experience with similar systems. The items below represent informal quotes provided by manufacturers at the time of writing and do not represent official quotes.
• CRDS instrument ~£20000
• 5HP wind sensor ~£1320
• <20 kg UAV and autopilot software ~£25000
8.3 Field trial Before reliable advice can be provided on the expected accuracy and sources of uncertainty in the method reported on here, it is vital to carry out field trials and specialist data analysis to determine:
• instrument and platform performance and reliability
• measurement accuracy
• modelling sensitivity
The measurement accuracy of both the CRDS and 5-HP system are well known and may be expected to perform similarly to ground trials when integrated with UAVs. However, it is important to validate this expectation against ground-based measurements, especially in the case of the CRDS. This could be achieved through an operational test lasting up to five working days where UAVs are flown around a site of interest and near to ground-based calibrated equipment.
Validation should take the form of comparing statistics of airborne versus ground-based concentration measurements across the entire sampling period to examine sources or systematic bias and changes in measurement variability (random error).
The flux calculation method should also be assessed as part of this trial by examining the intra-day and inter-day variability in measured fluxes, and ideally using alternative flux methods such as DIAL, chamber measurements and eddy covariance.
The PID sensors are not considered precise enough to provide a methane flux measurement, but their use, perhaps alongside carbon dioxide sensors could allow the investigation of a number of elements of the mass balance method.
There are several options available to maximise the success of any field trial. These are laid out as options below.
8.3.1 Short-term field trial using PID sensors
The engineering of a currently available off-the-shelf CRDS system for integration onto a UAV is a significant design and integration task. This means any field trial for this instrument would need a lead in time of several months
It should be possible to undertake a field trial using a simplified UAV system using less accurate, but off-the-shelf, PIDs. This would allow the identification of techniques for sampling at such sites while simultaneously characterising the potential use of these less accurate, but cheaper, systems. It may not be possible to deliver useful flux

estimates with such a system, which should be seen as a development opportunity only.
There is the opportunity to piggyback components of this activity onto existing NERC-funded projects such as Deliverable D of the NERC Greenhouse Gas and Feedbacks programme, which includes a two-week deployment of several UK academic groups and measurement infrastructure at Mason’s Landfill Site, Ipswich, during August 2014. This project, led by Dr Grant Allen of the Centre for Atmospheric Science, University of Manchester, seeks to test several state-of-the-art flux methods using precision ground-based, remote sensing and aircraft platforms, providing an excellent validation dataset from which to intercompare and test the UAV measurements described in Section 6.4. The funded proposal summary for this project is included in Appendix C.
The cost to add and conduct a UAV field trial, of PID and carbon dioxide instrumentation only, is estimated as follows:
• Travel and subsistence (T&S) for a two-week (10 days at £150/day) deployment of UAV pilot and project manager: £3,000
• Purchase of <7 kg MTOW UAV: £1,500
• Purchase of photoionization methane instrumentation (three units for contingency and calibration): £450
• Purchase of 5HP wind probe: £1,320
• Four months of technical staff time for operation, data analysis and report writing: £15,000
• Project management (15% senior staff time for four months): £5,000
• One month of technical staff time for platform design and integration, testing: £4,000
Approximate total: £30,000
This excludes the purchase of the ground-station, autopilot batteries and launching infrastructure.
8.3.2 CDRS field trial
With sufficient funding, it would be possible to engineer a CRDS system for UAV use by March 2015 and to test at a specified landfill site within that timeframe. To do this, it would be necessary to invest in the instrument and platforms necessary for later operational deployment. These are significant costs, but represent the best chance of success in delivering useful flux estimates. These costs are estimated below.
• T&S for a two-week (10 days at £150/day) deployment of UAV pilot and project manager: £3,000
• Purchase of <20 kg MTOW UAV: £12,500
• Purchase of CRDS system: £20,000
• Purchase of 5HP wind probe: £1,320
• Six months of technical staff time for operation, data analysis and report writing: £22,000

38 Feasibility of aerial measurements of methane emissions from landfills
• Six months of experienced workshop technician to reverse engineer the CRDS system and assist with integration on to the UAV platform: £18,000
• Project management (15% senior staff time for two staff for eight months): £10,000
• One month of technical staff time for platform design and integration, testing: £4,000
Approximate total: £90,000
In the authors’ view this option would deliver the best characterisation of a future operational system.
It may be possible to work with the manufacturers of suitable CRDS instruments to arrive at a version of the current instrument stripped down for UAV use. This could potentially reduce the re-engineering costs and the time necessary to produce an instrument ready for then field trial.
8.3.3 Outputs of the field trial
The outputs of any field trial would be:
• validated characterisation of a future potential operational system
• guidance on flux uncertainty
• advice on best operational practice, sampling and deployment, and analysis
The mass balancing and eddy covariance flux techniques could both be assessed as part of such a task.
Development of operational flux calculation software would be a necessary additional task that could form part of the field trial (estimated cost ~£5,000).
8.4 Cost–benefit of development options Table 8.2 summarises the pros and cons of the two integrated platforms identified as candidates for a field trial. In the authors’ opinion, the necessary precision of the CRDS system outweighs the lower cost and weight of the PID system.
It should be noted that this is a fast moving technological sector and that new measurement technology is under development all the time. It will be crucial to monitor the technology for future integration as this new developments could greatly reduce operational costs. Table 8.2 represents a summary of the authors’ current understanding of such technology.

Table 8.2 Advantages and disadvantages of proposed measurement platforms
Instrument and platform
Advantages Disadvantages Estimated cost (including field trial)
CRDS +20 kg MTOW UAV
High measurement precision
High cost, high weight (low endurance)
No current off-the-shelf instrument so re-engineering is required
£90,000
PID+ 7 kg MTOW UAV
Low cost, low weight (high endurance)
Off- the-shelf sensors, so limited lead-in time to a field trail
Low measurement precision
£30,000
8.5 Operational cost The items below are estimated and exclusive of hardware costs. Note that the estimated costs given below represent physical operation only and not data analysis.
8.5.1 System acquisition cost
Individual operators would require a turnkey system for operation. This would be based upon a 20 kg MTOW, fixed-wing platform with an integrated autopilot and mission management platform. Based on current estimates of the operational life of different components of these systems, it is assumed that the entire flight system would need to be replaced every 100 operational days. This is considered to be conservative, as the autopilot and possibly the sensors should have much longer operational lives. In addition, the catapult and ground station are assumed to be durable goods. The current estimated ‘fly away’ cost is shown in Table 8.3.
Table 8.3 Estimated capital cost for integrated measurement platform
System Recommendation Indicative cost
UAV Fixed wing <20 kg MTOW £12,500
Autopilot For example, GAMMA (Growing Autonomous Mission Management Applications)
£3,000
Catapult For example, Trimble UAS £5,900
Sensor CRDS £21,300
Ground station Representative £3,000
Total
£45,700

40 Feasibility of aerial measurements of methane emissions from landfills
8.5.2 Operational deployment cost
Operational costs are based on an estimate of the minimum amount an independent service provider could charge to provide a single day of measurements at a site. This is based upon a crew of three (pilot, mission management officer and safety observer). Additionally, a capital charge is assumed based on replacing the flight system every 100 operational days. The minimum operating cost is shown in Table 8.4.
Table 8.4 Estimated operational cost
Operation Cost per day Number of days Cost
Pilot £600.00 1 £600
Support staff £600.00 2 £1,200
Sustenance £50.00 3 £150
Energy £25.00 1 £25
Capital £104.90 1 £105
Total £2,080

9 Conclusions This report has discussed the current state of knowledge of various open and closed path remote sensing technologies, plus other technologies, that may be considered suitable for operation on an instrumented UAV platform to measure methane concentrations to enable calculation of landfill fugitive emission flux.
The report has identified the constraints of the power, weight, size, measurement accuracy and sampling methods required to enable field-based statistics of methane flux calculation with a known uncertainty to within ~20%. The conclusion of this study is that suitable and viable measurement platform technologies are achievable within relatively short timeframes (within 12 months).
The integrated platform which optimises cost, weight, power, measurement accuracy and appropriate sampling rate is a CRDS onboard an electric motored, fixed-wing, 20 kg maximum take-off weight UAV, with simultaneous wind measurement from a standard five-hole probe.
Although of a higher weight, cost and size than other off-the-shelf instrumentation, crucially this system provides the only measurement with sufficient methane concentration precision to enable flux estimates to within 20% using a mass balancing approach. The mass balancing approach has been idenitified as the most promising technique from which to calculate bulk fluxes.
The above system requires several steps to operational deployment. These are:
• re-engineering of an off-the-shelf CRDS system, and its design and integration with the UAV
• a field trial to test, validate and advise on operational best practice for sampling and flux calculation
• arranging for a commercial enterprise to operate the system

42 Feasibility of aerial measurements of methane emissions from landfills
References ALLEN, M.G., 2011. Low cost absorption sensors for networked applications. In Proceedings of Conference on Lasers and Electro-Optics (CLEO: 2011) (1–6 May 2011, Baltimore, MA), pp. 1882-1883. Piscataway, NJ: Institute of Electrical and Electronic Engineers.
ALLEN, G., ILLINGWORTH, S.M., O’SHEA, S., MULLER, J., GALLAGHER, M.W., NEWMAN, S., VANCE, A., F. MARENCO, KENT, J., BOWER, K., MORGAN, W., PERCIVAL, C., LEE, J. SULLIVAN, D.O., HARLOW, C. AND PYLE, J., 2014. Remotely-sensed trace gas and thermodynamic retrievals from the ARIES airborne TIR-FTS system – Part 2: Validation and results from aircraft campaigns, Atmospheric Measurement Techniques Discussions, 7, 3397-3441.
ANDO, M., 2009. Recent advances in optochemical sensors for the detection of H2, O2, O3, CO, CO2 and H2O in air. Trends in Analytical Chemistry, 25 (10), 937-948.
ASTUTI, G., GIUDICE, G., LONGO, D., MELITA, C.D., MUSCATO, G. AND ORLANDO, A., 2009. An overview of the ‘Volcan Project’: an UAS for exploration of volcanic environments. Journal of Intelligent Robotic Systems, 54 (1-3), 471-494.
AUBINET, M., VESALA, T., AND PAPALE, D. (ed.), 2012. Eddy Covariance: A Practical Guide to Measurement and Data Analysis. Springer Atmospheric Sciences. Dordrecht and London: Springer.
BALDOCCHI, D., HICKS, B. AND MEYERS, T., 1988. Measuring biosphere-atmosphere exchanges of biologically related gases with micrometeorological methods. Ecology, 69, 1331-1340
BERKOWITZ, J., 1989. Photoionization mass spectrometric studies of free radicals. Accounts of Chemical Research, 22 (12), 413-420.
BERGAMASCHI, P., FRANKENBERG, C., MEIRINK, J.F., KROL, M., VILLANI, M.G., HOUWELING, S., DENTENER, F., DLUGOKENCKY, E.J., MILLER, J.B., GATTI, L.V., ENGEL, A. AND LEVIN, I., 2009. Inverse modeling of global and regional CH4 emissions using SCIAMACHY satellite retrievals. Journal of Geophysical Research: Atmospheres, 114 (D22), D22301.
BERMAN, E., LIEM, J., KOLYER, R. AND GUPTA, M., 2012. Greenhouse gas analyzer for measurements of carbon dioxide, methane, and water vapor aboard an unmanned aerial vehicle. Sensors and Actuators B: Chemistry, 169, 128-135.
BLECHINGER, F., HARNISCH, B. AND KUNKEL, B.P., 1995. Optical concepts for high-resolution imaging spectrometers. In SPIE Proceedings Volume 2480, Imaging Spectrometry, 1995 Symposium on OE/Aerospace Sensing and Dual Use Photonics (17 April 1995, Orlando, FL), ed. M.R. Descour, J.M. Mooney, D.L. Perry and L.R. Illing, pp. 165-179. Bellingham, WA: International Society for Optics and Photonics.
BOGNER, J., PIPATTI, R., HASHIMOTO, S., DIAZ, C., MARECKOVA, K., DIAZ, L., KJELDSEN, P., MONNI, S., FAAIJ, A., GAO, Q., ZHANG, T., AHMED, M.A., SUTAMIHARDJA, R.T., GREGORY, R. AND INTERGOVERNMENTAL PANEL ON CLIMATE CHANGE (IPCC) WORKING GROUP III (MITIGATION), 2008. Mitigation of global greenhouse gas emissions from waste: conclusions and strategies from the Intergovernmental Panel on Climate Change (IPCC) Fourth Assessment Report. Working Group III (Mitigation). Waste Management & Research, 26 (1), 11-32.

BRACHET, F., HÉBERT, P.-J., CANSOT, E., BUIL, C., LACAN, A., ROUCAYROL, L., COURAU, E., BERNARD, F., CASTERAS, C. AND LOESEL, J., 2008. Static Fourier transform spectroscopy breadboards for atmospheric chemistry and climate. In SPIE Proceedings Volume 7100, Optical Design and Engineering III (1 September 2008, Glasgow), ed. L. Mazuray, A. Wood, J.-L. Tissot and J.M. Raynor, doi: 10.1117/12.797686. Bellingham, WA: International Society for Optics and Photonics.
BRIOUDE, J., ANGEVINE, W.M., AHMADOV, R., KIM, S.-W., EVAN, S., MCKEEN, S.A., HSIE, E.-Y., FROST, G.J., NEUMAN, J.A., POLLACK, I.B., PEISCHL, J., RYERSON, T.B., HOLLOWAY, J., BROWN, S.S., NOWAK, J.B., ROBERTS, J.M., WOFSY, S.C., SANTONI, G.W., ODA, T., AND TRAINER, M., 2013. Top-down estimate of surface flux in the Los Angeles Basin using a mesoscale inverse modeling technique: assessing anthropogenic emissions of CO, NOx and CO2 and their impacts. Atmospheric Chemistry and Physics, 13, 3661-3677.
BURBA, G., 2013. Eddy Covariance Method for Scientific, Industrial, Agricultural and Regulatory Applications: a Field Book on Measuring Ecosystem Gas Exchange and Areal Emission Rates. Lincoln, NE: LI-COR Biosciences.
CHEN, X. AND VIERLING, L., 2006. Spectral mixture analyses of hyperspectral data acquired using a tethered balloon, Remote Sensing of Environment, 103 (3), 338-350.
CAA (CIVIL AVIATION AUTHORITY), 2014. Air Navigation: The Order and the Regulations. CAP 393. Version reprinted 7 February 2014, incorporating amendments to 8/2012. Norwich: TSO.
CHILDERS, J.W., THOMPSON, E.L., HARRIS, D.B., KIRCHGESSNER, D.A., CLAYTON, M., NATSCHKE, D.F. AND PHILLIPS, W.J., 2001. Multi-pollutant concentration measurements around a concentrated swine production facility using open-path FTIR spectrometry. Atmospheric Environment, 35 (11), 1923-1936.
COPELAND, G., GHOST, M.V., SHALLCROSS, D.E., PERCIVAL, C.J. AND DYKE, J.M., 2011. A study of the ethene-ozone reaction with photoelectron spectroscopy: measurement of product branching ratios and atmospheric implications. Physical Chemistry Chemical Physics, 13 (33), 14839-14847.
DYKE, J.M., JONATHAN, N. AND MORRIS, A., 1979. In Electron Spectroscopy: Theory, Techniques and Applications, Volume 3 (ed. C.R. Brundle and A.D. Baker), p. 189. London: Academic Press.
EASA, 2012. Certification Specifications for Normal, Utility, Aerobatic, and Commuter Category Aeroplanes. CS-23, Amendment 3, 20 July 2012. Cologne: European Aviation Safety Agency.
EASA, 2013. Certification Specifications and Acceptable Means of Compliance for Large Aeroplanes. CS-25, Amendment 4, 19 December 2013. Cologne: European Aviation Safety Agency.
FRIEDL-VALLON, F., MAUCHER, G., SEEFELDNER, M., TRIESCHMANN, O., KLEINERT, A., LENGEL, A., KEIM, C., OELHAF, H. AND FISCHER, H., 2004. Design and characterization of the balloon-borne Michelson interferometer for passive atmospheric sounding (MIPAS-B2). Applied Optics, 43 (16), 3335-3355.
FRISH, M.B., LADERER, M.C., WAINNER, R.T., WRIGHT, A.O., PATEL, A.H., STAFFORD-EVANS, J., MORENCY, J.R., ALLEN, M.G. AND GREEN, B.D., 2007. The next generation of TDLAS analyzers. In SPIE Proceedings Volume 6765, Next-Generation Spectroscopic Techniques (10 September 2007, Boston, MA), ed. C.D. Brown, M.A. Druy and J.P. Coates, doi: 10.1117/12.738195. Bellingham, WA: International Society for Optics and Photonics.

44 Feasibility of aerial measurements of methane emissions from landfills
FRISH, M.B., WAINNER, R.T., LADERER, M.C., ALLEN, M.G., RUTHERFORD, J., WEHNERT, P., DEY, S., GILCHRIST, J., CORBI, R. AND PICCIAIA, D., 2013. Low-cost lightweight airborne laser-based sensors for pipeline leak detection and reporting. In SPIE Proceedings Volume 8726, Next-Generation Spectroscopic Techniques VI (29 April 2013, Baltimore, MA), ed. M.A. Druy and R.A. Crocombe, doi: 10.1117/12.2015813. Bellingham, WA: International Society for Optics and Photonics.
GEORGIEVA, E.M. AND HEAPS, W.S., 2011. Robust IR remote sensing technique of the total column of trace gases including carbon dioxide and methane. In Proceedings of at Geoscience and Remote Sensing Symposium (IGARSS), 2011 IEEE International (24–29 July 2011, Vancouver), pp. 997-1000. Piscataway, NJ: Institute of Electrical and Electronic Engineers.
GEORGIEVA, E.M., HEAPS, W.S. AND WILSON, E.L., 2008. Differential radiometers using Fabry–Perot interferometric technique for remote sensing of greenhouse gases. Geoscience and Remote Sensing, IEEE Transactions 46 (10), 3115-3122.
GEORGIEVA, E.M., HUANG, W. AND HEAPS, W.S., 2012. A new remote sensing filter radiometer employing a Fabry-Perot etalon and a CCD camera for column measurements of methane in the Earth atmosphere. In Proceedings of at Geoscience and Remote Sensing Symposium (IGARSS), 2012 IEEE International (22–27 July 2012, Munich), pp. 2434–2437. Piscataway, NJ: Institute of Electrical and Electronic Engineers.
GERILOWSKI, K., TRETNER, A., KRINGS, T., BUCHWITZ, M., BERTAGNOLIO, P.P., BELEMEZOV, F., ERZINGER, J., BURROWS, J.P. AND BOVENSMANN, H., 2011. MAMAP– a new spectrometer system for column-averaged methane and carbon dioxide observations from aircraft: instrument description and performance analysis. Atmospheric Measurement Techniques, 4 (2), 215-243.
GREGORY, R.G., GILLET, A.G. AND BRADLEY, D., 2003. Methane Emissions from Landfill Sites in the UK. Final Report. Report by Land Quality Management Ltd for Defra. London: Defra.
GRIMMOND, C.S.B., KING, T.S., CROPLEY, F.D., NOWAK, J. AND SOUCH, C., 2002. Local-scale fluxes of carbon dioxide in urban environments: methodological challenges and results from Chicago. Environmental Pollution, 116, S243-S254.
HAIR, J.W., CLECKNER, C., MURRAY, K., FRATELLO, D., NAFTEL, C., COLLINS, J., NOTARI, A. AND WELCH, W., 2010. Development of the Global Ozone Lidar Demonstrator (GOLD) for the Global Hawk. In Proceedings of the Earth Science Technology Forum (ESTF 2010) (22–24 June 2010, Arlington, VA).
HANSFORD, G.M., FRESHWATER, R.A., EDEN, L., TURNBULL, K.V.F., HADAWAY, D.E., OSTANIN, V.P. AND JONES, R.L., 2006. Lightweight dew-/frost-point hygrometer based on a surface-acoustic wave sensor for balloon-borne atmospheric water vapour profile sounding. Review of Scientific Instruments, 77 (1), 014502.
HASHMONAY, R.A., NATSCHKE, D.F., WAGONER, K., HARRIS, D.B., THOMPSON, E.L. AND YOST, M.G., 2001. Field evaluation of a method for estimating gaseous fluxes from area sources using open-path Fourier transform infrared. Environmental Science & Technology, 35 (11), 2309-2313.
HERNÁNDEZ, G., 1988. Fabry-Perot Interferometers, Volume 3. Cambridge: Cambridge University Press.
HILLER, R., NEININGER, B., BRUNNER, D., GERBIG, C., BRETSCHER, D., KÜNZLE, T., BUCHMANN, N. AND EUGSTER, F., 2014. Aircraft based CH4 flux estimates for validation of emissions from an agriculturally dominated area in

Switzerland. Journal of Geophysical Research: Atmospheres, DOI: 10.1002/2013JD02091.
HYVÄRINENA, T., HERRALAA, E., PROCINOB, W. AND WEATHERBEEB, O., 2011. Compact high resolution VIS/NIR hyperspectral sensor. In SPIE Proceedings Volume 8032, Next-Generation Spectroscopic Techniques IV, ed. M.A. Druy and R.A. Crocombe (25 April 2011, Orlando, FL), doi: 10.1117/12.887003. Bellingham, WA: International Society for Optics and Photonics.
ILLINGWORTH, S., ALLEN, G., PERCIVAL, C., HOLLINGSWORTH, P., GALLAGHER, M., RICKETTS, H., HAYES, H. ŁADOSZ, P., CRAWLEY, D. AND ROBERTS, G., 2014a. Measurement of boundary layer ozone concentrations on-board a Skywalker unmanned aerial vehicle. Atmospheric Science Letters, doi: 10.1002/asl2.496.
ILLINGWORTH, S.M., ALLEN, G., NEWMAN, S., VANCE, A., MARENCO, F., HARLOW, R.C., TAYLOR, J., MOORE, D.P. AND REMEDIOS, J.J., 2014b. Atmospheric composition and thermodynamic retrievals from the ARIES airborne FTS system – Part 1: Technical aspects and simulated capability. Atmospheric Measurement Techniques, 7, 1133-11150.
JARDINE, C.N., BOARDMAN, B., OSMAN, A., VOWLES, J. AND PALMER, J., 2009. Methane UK. Oxford: Environmental Change Institute, University of Oxford.
JOHNSON, W.R., HOOK, S.J., MOUROULIS, P., WILSON, D.W., GUNAPALA, S.D., REALMUTO, V., LAMBORN, A., PAINE, C., MUMOLO, J.M. AND ENG, B.T., 2011. HyTES: Thermal imaging spectrometer development. In Proceedings of IEEE Aerospace Conference (5–12 March 2011, Big Sky, MT), pp. 1803-1810. Piscataway, NJ: Institute of Electrical and Electronic Engineers.
KIRIAKIDIS, G., KORTIDIS, J. AND MOSCHOVIS, K., 2008. On the road to inexpensive, sub-ppb, room temperature ozone detectors. Sensor Letters, 2008, 6 (6), 812-816.
KRZEMPEK, K., JAHJAH, M., LEWICKI, R., PRZEMYSŁAWSKI, S., SO, S., THOMAZY, D. AND TITTEL, F.K., 2013. CW DFB RT diode laser-based sensor for trace-gas detection of ethane using a novel compact multipass gas absorption cell. Applied Physics B, 112 (4), 461-465.
MASSMAN, W.J. AND LEE, X., 2002. Eddy covariance flux corrections and uncertainties in long-term studies of carbon and energy exchanges. Agricultural and Forest Meteorology, 113 (1-4), 121-144.
MAYS, K.L., SHEPSON, P.B., STIRM, B.H., KARION, A., SWEENEY, C. AND GURNEY, K.R., 2009. Aircraft-based measurements of the carbon footprint of Indianapolis. Environmental Science & Technology, 43 (20), 7816-7823.
MCKAIN, K., WOFSY, S.C., NEHRKORN, T., ELUSZKIEWICZ, J., EHLERINGER, J.R. AND STEPHENS, B.B., 2012. Assessment of ground-based atmospheric observations for verification of greenhouse gas emissions from an urban region. Proceedings of the National Academy of Science of the United States of America, 109 (22), 8423-8428.
MEAD, M.I., POPOOLA, O.A.M., STEWART, G.B., LANDSHOFF, P., CALLEJA, M., HAYES, M., BALDOVI, J.J., MCLEOD, M.W., HODGSON, T.F., DICKS, J., LEWIS, A., COHEN, J., BARON, R., SAFFELL, J.R. AND JONES, R.L. 2013.,The use of electrochemical sensors for monitoring urban air quality in low-cost, high-density networks. Atmospheric Environment, 70, 186-203.

46 Feasibility of aerial measurements of methane emissions from landfills
MULLER, J.B.A., SMITH, C.E., NEWTON, M.I. AND PERCIVAL, C.J., 2011. Evaluation of coated QCM for the detection of atmospheric ozone. Analyst, 136, 2963-2968.
O’SHEA, S.J., BAUGUITTE, S.J.-B., GALLAGHER, M.W., LOWRY, D. AND PERCIVAL, C.J., 2013. Development of a cavity-enhanced absorption spectrometer for airborne measurements of CH4 and CO2. Atmospheric Measurement Techniques, 6 (5), 1095-1109.
O’SHEA, S.J., ALLEN, G., FLEMING, Z.L., BAUGUITTE, S.J.-B., PERCIVAL, C.J., GALLAGHER, M.W., LEE, J., HELFTER, C. AND NEMITZ, E., 2014. Area fluxes of carbon dioxide, methane and carbon monoxide derived from airborne measurements around Greater London: a case study during summer 2012. Journal of Geophysical Research: Atmospheres, doi: 10.1002/2013JD021269.
PARK, Y., DONG, K.-Y., LEE, L., CHOI, J., BAE, G.-N. AND JU, B.-K., 2009. Development of an ozone gas sensor using single-walled carbon nanotubes. Sensors and Actuators B, 140 (2), 407-411.
PATTERSON, B., ANTONI, M., COURTIAL, J., DUNCAN, A., SIBBETT, W. AND PADGETT, M., 1996. An ultra-compact static Fourier-transform spectrometer based on a single birefringent component. Optics Communications, 130 (1), 1-6.
PICCIAIA, D., ZAZZERI, G., GIMBERINI, M.S. AND ANDREUSSI, P, 2011. A new remote sensing method for landfill emissions quantification. In Proceedings of Sardinia 2011 Thirteenth International Waste Management and Landfill Symposium (3–7 October 2011, S. Margherita di Pula, Cagliari, Italy), ed. R. Cossu, P. He, P. Kjeldsen, Y. Matsufuji, D. Reinhart and R. Stegmann.
PIDANCIER, P., JAMIN, N., FIÈQUE, B., LEROY, C. AND CHORIER, P., 2013. A review of the latest developments of MCT infrared technology from visible to VLWIR for space applications at Sofradir. In SPIE Proceedings Volume 8704, Infrared Technology and Applications XXXIX III (29 April 2013, Baltimore, MA), ed. B.F. Andresen, G.F. Fulop, C.M. Hanson, P.R. Norton and P. Robert, doi: 10.1117/12.797686. Bellingham, WA: International Society for Optics and Photonics.
POLSON, D., FOWLER, D., NEMITZ, E., SKIBA, U., MCDONALD, A., FAMULARI, D., DI MARCO, C., SIMMONS, I., WESTON, K., PURVIS, R., COE, H., MANNING, A.J., WEBSTER, H., HARRISON, M., O’SULLIVAN, D., REEVES, C. AND ORAM, D., 2011. Estimation of spatial apportionment of greenhouse gas emissions for the UK using boundary layer measurements and inverse modelling technique. Atmospheric Environment, 45 (4), 1042-1049.
REFAAT, T.F., ISMAIL, S., NEHRIR, A.R., HAIR, J.W., CRAWFORD, J.H., LEIFER, I. AND SHUMAN, T., 2013. Performance evaluation of a 1.6-µm methane DIAL system from ground, aircraft and UAV platforms. Optics Express, 21 (25), 30415-30432.
REVERCOMB, H.E., SMITH, W.L., BEST, F.A., GIROUX, J., LAPORTE, D.D., KNUTESON, R.O., WERNER, M.W., ANDERSON, J.R., CIGANOVICH, N.N., CLINE, R.W., ELLINGTON, S.D., DEDECKER, R.G., DIRKX, T.P., GARCIA, R.K. AND HOWELL, H.B., 1996. Airborne and ground-based Fourier transform spectrometers for meteorology: HIS, AERI, and the new AERI-UAV. In SPIE Proceedings Volume 2832 Optical Instruments for Weather Forecasting, (4 August 1996, Denver, CO), ed. G.W. Kamerman, doi: 10.1117/12.258890. Bellingham, WA: International Society for Optics and Photonics.
SAFETY REGULATION GROUP, CIVIL AVIATION AUTHORITY, 2012. Unmanned Aircraft System Operations in UK Airspace – Guidance, 5th edition. CAP 722. Norwich: TSO.
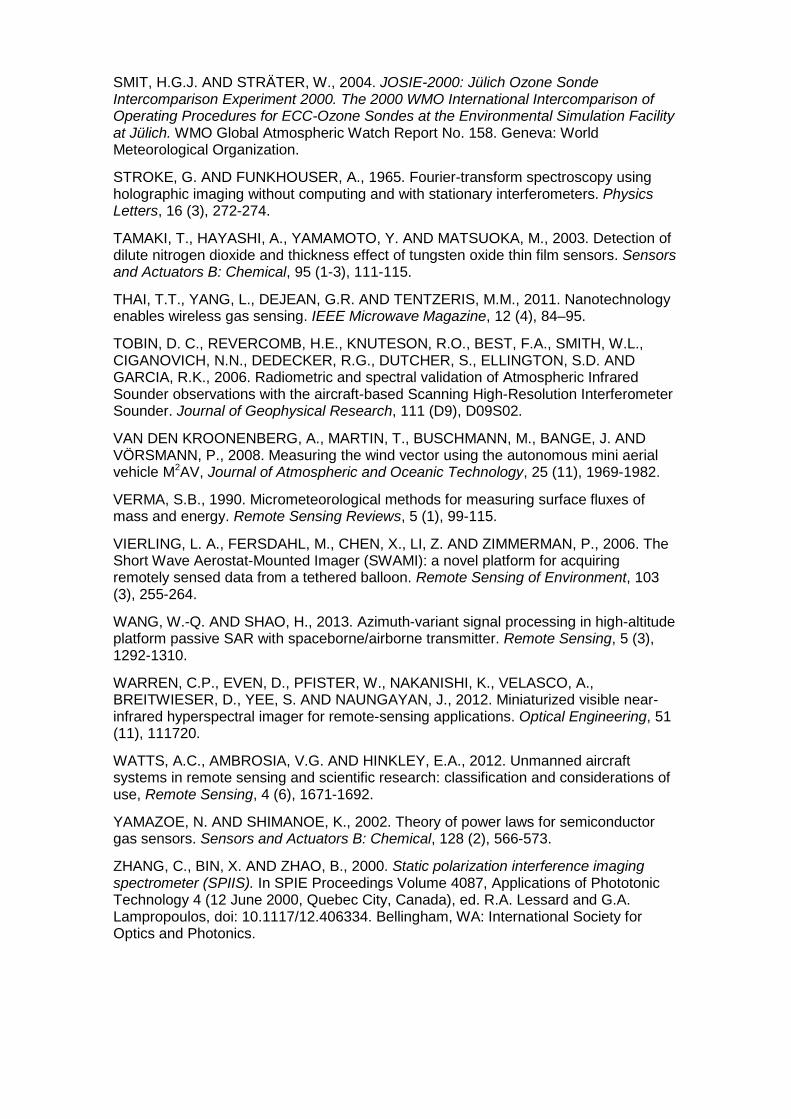
SMIT, H.G.J. AND STRÄTER, W., 2004. JOSIE-2000: Jülich Ozone Sonde Intercomparison Experiment 2000. The 2000 WMO International Intercomparison of Operating Procedures for ECC-Ozone Sondes at the Environmental Simulation Facility at Jülich. WMO Global Atmospheric Watch Report No. 158. Geneva: World Meteorological Organization.
STROKE, G. AND FUNKHOUSER, A., 1965. Fourier-transform spectroscopy using holographic imaging without computing and with stationary interferometers. Physics Letters, 16 (3), 272-274.
TAMAKI, T., HAYASHI, A., YAMAMOTO, Y. AND MATSUOKA, M., 2003. Detection of dilute nitrogen dioxide and thickness effect of tungsten oxide thin film sensors. Sensors and Actuators B: Chemical, 95 (1-3), 111-115.
THAI, T.T., YANG, L., DEJEAN, G.R. AND TENTZERIS, M.M., 2011. Nanotechnology enables wireless gas sensing. IEEE Microwave Magazine, 12 (4), 84–95.
TOBIN, D. C., REVERCOMB, H.E., KNUTESON, R.O., BEST, F.A., SMITH, W.L., CIGANOVICH, N.N., DEDECKER, R.G., DUTCHER, S., ELLINGTON, S.D. AND GARCIA, R.K., 2006. Radiometric and spectral validation of Atmospheric Infrared Sounder observations with the aircraft-based Scanning High-Resolution Interferometer Sounder. Journal of Geophysical Research, 111 (D9), D09S02.
VAN DEN KROONENBERG, A., MARTIN, T., BUSCHMANN, M., BANGE, J. AND VÖRSMANN, P., 2008. Measuring the wind vector using the autonomous mini aerial vehicle M2AV, Journal of Atmospheric and Oceanic Technology, 25 (11), 1969-1982.
VERMA, S.B., 1990. Micrometeorological methods for measuring surface fluxes of mass and energy. Remote Sensing Reviews, 5 (1), 99-115.
VIERLING, L. A., FERSDAHL, M., CHEN, X., LI, Z. AND ZIMMERMAN, P., 2006. The Short Wave Aerostat-Mounted Imager (SWAMI): a novel platform for acquiring remotely sensed data from a tethered balloon. Remote Sensing of Environment, 103 (3), 255-264.
WANG, W.-Q. AND SHAO, H., 2013. Azimuth-variant signal processing in high-altitude platform passive SAR with spaceborne/airborne transmitter. Remote Sensing, 5 (3), 1292-1310.
WARREN, C.P., EVEN, D., PFISTER, W., NAKANISHI, K., VELASCO, A., BREITWIESER, D., YEE, S. AND NAUNGAYAN, J., 2012. Miniaturized visible near-infrared hyperspectral imager for remote-sensing applications. Optical Engineering, 51 (11), 111720.
WATTS, A.C., AMBROSIA, V.G. AND HINKLEY, E.A., 2012. Unmanned aircraft systems in remote sensing and scientific research: classification and considerations of use, Remote Sensing, 4 (6), 1671-1692.
YAMAZOE, N. AND SHIMANOE, K., 2002. Theory of power laws for semiconductor gas sensors. Sensors and Actuators B: Chemical, 128 (2), 566-573.
ZHANG, C., BIN, X. AND ZHAO, B., 2000. Static polarization interference imaging spectrometer (SPIIS). In SPIE Proceedings Volume 4087, Applications of Phototonic Technology 4 (12 June 2000, Quebec City, Canada), ed. R.A. Lessard and G.A. Lampropoulos, doi: 10.1117/12.406334. Bellingham, WA: International Society for Optics and Photonics.

48 Feasibility of aerial measurements of methane emissions from landfills
List of abbreviations 5HP five-hole probe
AERI atmospheric emitted radiance interferometer
CAA Civil Aviation Authority
CAP Civil Aviation Publication
COTS commercial-off-the-shelf
CRDS cavity ring-down spectroscopy
DECC Department of Energy & Climate Change
Defra Department for Environment, Food and Rural Affairs
DIAL differential absorption LIDAR
ECC electrochemical concentration cell
FAAM Facility for Airborne Atmospheric Measurement
FOV field of view
FPE Fabry Perot étalon
FTIR Fourier transform infrared
FTS Fourier transform spectrometer
GHG greenhouse gas
HALE high altitude long endurance platform
HAP high altitude platform
HyTES hyperspectral thermal emission spectrometer
IMU inertial measurement unit
IR infrared
LIDAR light detection and ranging
LGR-UPGA Los Gatos Research Ultraportable Greenhouse Gas Analyser
M2AV meteorological mini aerial vehicle
MCT mercury cadmium telluride
MTOW maximum take-off weight
NASA National Aeronautics and Space Administration
NERC Natural Environment Research Council
NPL National Physical Laboratory
PES photoelectron spectroscopy
ppb parts per billion
PID photoionisation detector

SAW surface acoustic wave
S-HIS scanning high-resolution interferometer sounder
SODAR sonic detection and ranging
SWDS solid waste disposal sites
SWIR short wave infrared
T&S travel and subsistence
TDLAS tuneable diode laser spectroscopy
TIR thermal infrared
UAS unmanned aerial system
UAV unmanned aerial vehicle
UV ultraviolet
VLOS visual line of sight
VOC volatile organic compound
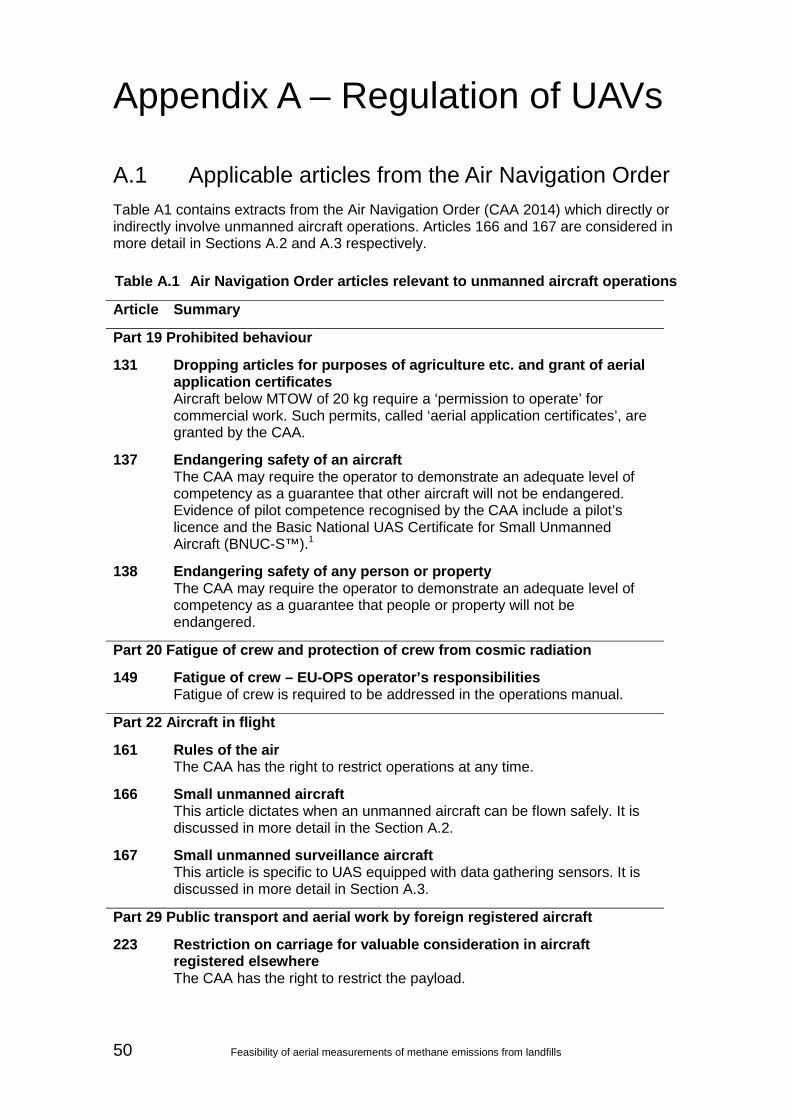
50 Feasibility of aerial measurements of methane emissions from landfills
Appendix A – Regulation of UAVs
A.1 Applicable articles from the Air Navigation Order Table A1 contains extracts from the Air Navigation Order (CAA 2014) which directly or indirectly involve unmanned aircraft operations. Articles 166 and 167 are considered in more detail in Sections A.2 and A.3 respectively.
Table A.1 Air Navigation Order articles relevant to unmanned aircraft operations
Article Summary
Part 19 Prohibited behaviour
131 Dropping articles for purposes of agriculture etc. and grant of aerial application certificates Aircraft below MTOW of 20 kg require a ‘permission to operate’ for commercial work. Such permits, called ‘aerial application certificates’, are granted by the CAA.
137 Endangering safety of an aircraft The CAA may require the operator to demonstrate an adequate level of competency as a guarantee that other aircraft will not be endangered. Evidence of pilot competence recognised by the CAA include a pilot’s licence and the Basic National UAS Certificate for Small Unmanned Aircraft (BNUC-S™).1
138 Endangering safety of any person or property The CAA may require the operator to demonstrate an adequate level of competency as a guarantee that people or property will not be endangered.
Part 20 Fatigue of crew and protection of crew from cosmic radiation
149 Fatigue of crew – EU-OPS operator’s responsibilities Fatigue of crew is required to be addressed in the operations manual.
Part 22 Aircraft in flight
161 Rules of the air The CAA has the right to restrict operations at any time.
166 Small unmanned aircraft This article dictates when an unmanned aircraft can be flown safely. It is discussed in more detail in the Section A.2.
167 Small unmanned surveillance aircraft This article is specific to UAS equipped with data gathering sensors. It is discussed in more detail in Section A.3.
Part 29 Public transport and aerial work by foreign registered aircraft
223 Restriction on carriage for valuable consideration in aircraft registered elsewhere The CAA has the right to restrict the payload.

224 Filing and approval of tariffs The CAA has the right to approve tariffs.
225 Restriction on aerial photography, aerial survey and aerial work in aircraft registered elsewhere than in an EEA state Data gathering operations are restricted for an aircraft that is not registered in the UK. The article does not apply to an aircraft registered in a country that is a member of the European Economic Area (EEA).
Part 31 Powers and penalties
228 Revocation, suspension and variation of certificates, licences and other documents The CAA has the right to revoke exemptions.
230 Revocation, suspension and variation of permissions, etc. granted under article 223 or article 225 The CAA has the right to change the terms of permissions given.
232 CAA’s power to prevent aircraft flying The CAA has the right to ground the aircraft.
Part 33 Interpretation
256 Interpretation An aircraft is set to be ‘in flight’ from the moment it moves by its own accord with the intention of flying.
259 Meaning of aerial work Aerial work is defined as when there is any compensation (‘valuable consideration’) for aerial services.
Notes: 1 www.caa.co.uk/default.aspx?catid=1995&pagetype=90&pageid=11190
[Accessed 8 May 2014]. Source: Civil Aviation Publication 393 (CAA 2014)
A.2 Article 166 – Small unmanned aircraft Article 166 consists of five general rules to complement Articles 137 and 138 of the Air Navigation Order (see Table A.1).
(1) A person must not permit any article or animal to be dropped from an aircraft (whether or not attached to a parachute) to be dropped from a small unmanned aircraft so as to endangered people or property.
(2) The pilot (person in charge of the small unmanned aircraft) must only fly the aircraft if reasonably sure it is safe to do so.
(3) The pilot must maintain visual line of sight (VLOS).
(4) If the aircraft is over 7 kg, the aircraft must not be flown:
(a) in Class A, C, D or E airspace unless permission is granted by the appropriate air traffic control unit;
(b) within the vicinity of an airport during the notified hours of watch unless granted by the air traffic control unit; or

52 Feasibility of aerial measurements of methane emissions from landfills
(c) at a height above 400 feet above the surface (unless it is flying in airspace described in (a) or (b) and in accordance with the requirements for that airspace
(5) Aircraft must not be flown for commercial work unless permitted by the CAA.
A.3 Article 167 – Small unmanned surveillance aircraft
Article 167 consists of five rules which apply specifically to aircraft equipped with cameras, data loggers, or any other data acquisition system.
(1) Unless permitted by the CAA, the aircraft must not be flown under any of the circumstances set out in paragraph (2).
(2) The circumstances referred to in paragraph (1) are:
(a) over or within 150 metres of a congested area;
(b) over or within 150 metres of any organised open-air assembly of over 1,000 people;
(c) within 50 metres of any vessel, vehicle or structure that is not under the control of the person in charge of the aircraft; or
(d) subject to paragraphs (3) and (4), within 50 metres of any person.
(3) Subject to paragraph (4), within 30 metres of any person during take-off and landing.
(4) Sub-paragraphs (2) and (3) do not apply to the operator.
(5) This article applies to any small aircraft equipped to do surveys, photography or any other data acquisition apparatus.

Appendix B – Platform specifications
Bormatec Maja
Category Sub 7 kg – fixed wing
Manufacturer Bormatec Model Maja [2]
Spec
ifica
tions
Cost £3,500 + sensor Powerplant 400 W brushless motor Wingspan 180 cm
Take-off and landing Hand launched / catapult Payload 1.5 kg
Endurance 25 minutes (4S 5,000 mAh @ 14 m s-1) Avionics SkyCircuits SC2 autopilot for automated waypoint following, take-off
and landing Suggested payload Vaisala RS 232
Bormatec Explorer
Category Sub 7 kg – fixed wing
Manufacturer Bormatec Model Explorer [3]
Spec
ifica
tions
Cost £4,000 + sensor Powerplant 2 × 400 W brushless motor Wingspan 180 cm
Take-off and landing Catapult Payload 2.5 kg
Endurance 20 minutes (4S 5,000 mAh @ 15 m s-1) Avionics SkyCircuits SC2 autopilot for automated waypoint following, take-off and
landing Suggested payload TDLAS system / Vaisala RS 232 / 5 hole probe

54 Feasibility of aerial measurements of methane emissions from landfills
UAV Factory Penguin BE Category Sub 20 kg – fixed wing
Manufacturer UAV Factory
Model Penguin BE [4]
Spec
ifica
tions
Cost £25,000 + sensor Powerplant 2700 W brushless motor Wingspan 3.3 m
Take-off and landing Catapult, runway, car top launch Payload 6.6 kg
Endurance 110 minutes (2.8 kg payload @ 22 m s-1) Avionics SkyCircuits SC2R autopilot for automated waypoint following,
take-off and landing Suggested payload TDLAS system / 5 Hole probe
Steadydrone QU4D X
Category Sub 20 kg – rotary wing
Manufacturer SteadiDrone Model QU4D X [5]
Spec
ifica
tions
Cost £15,000 + sensor Powerplant 4 × brushless 100 kV motors with 28 foot props and 65 A
electronic speed controllers (ESCs) Rotor diameter 1.24 m
Take-off and landing Vertical Payload 8 kg
Endurance 30 minutes (4 kg payload) Avionics DJI A2 flight control system, with telemetry, navigation and
stabilisation Suggested payload TDLAS system / Vaisala RS 232

Appendix C – GAUGE project This appendix reproduces the funded proposal study for Deliverable D (Integrative activity – Improved characterisation of UK greenhouse gas emission hotspots) of the GAUGE project.
Contributors:
• Grant Allen, Martin Gallagher and Carl Percival, University of Manchester
• Mathew Williams and Tom Wade, University of Edinburgh
• Hartmut Bösch, University of Leicester
• Neil Harris, University of Cambridge
• Mark Bourn, Environment Agency
This additional study serves to address Deliverable D through exploiting, and adding to, hitherto unrealised measurement synergies between GAUGE (Deliverable A) and GREENHOUSE (Deliverable B).
A key question posed by both consortia was the efficacy of both the proposed measurement networks and modelling inversions to deliver flux estimates of strong emission hotspots and/or point sources such as landfill and power stations.
Emissions from solid waste disposal sites (SWDS) are a particular issue for the UK, with 22% of all methane (0.46 million tonnes/year) attributed to landfill in 2009 (Jardine et al. 2009), with UK SWDS accounting for 32% of all landfill emissions across the European Union. This compares with a figure of just 3% for SWDS as a contributor to global anthropogenic greenhouse gas (GHG) emissions (Bogner et al. 2008).
Much recent effort has been put into the capture of methane from SWDS in the UK for energy generation with notable success, yet emission of methane from SWDS remains a source of considerable uncertainty for the UK National Atmospheric Emissions Inventory (NAEI) with a range of between 0.65 and 1.15 million tonnes per year, and order of magnitude uncertainties on future emissions scenarios (Gregory et al. 2003). Furthermore, SWDS are known sources of many other GHG and trace gases with significantly less understanding. This uncertainty arises because attributing and quantifying GHG fluxes to hotspot sources generally remains non-trivial and requires validation to characterise uncertainty and sources of potential systematic error (for example, due to meteorology and model background conditions). This work package aspires to provide an idealised dataset for such validation through a coordinated case study, while simultaneously also serving as a multi-instrument, multi-platform, comparison–validation exercise for hotspot flux calculations from multiple novel techniques across GAUGE and GREENHOUSE.
This study will target an open SWDS site of key interest to the Environment Agency, identified by it as a site with uncharacterised GHG emissions. Mark Bourn of the Environment Agency will assist with access to this site and will seek to deploy the NPL DIAL system to operate alongside this study. We will also work with the newly started European Commission funded ACUMEN project coordinated by the Environment Agency and involving DECC and Defra, which have common interests in closed landfills for energy generation from landfill methane.
The study site will be jointly decided in Q2 of 2013 and will be in the east of England (for example, near Peterborough). We will employ both long-term measurements downwind and a four-week intensive observation period in April 2014 (within the

56 Feasibility of aerial measurements of methane emissions from landfills
timeframe of existing long-term measurements planned in GAUGE and GREENHOUSE). The combination of long-term and focused measurements of this source will facilitate representative and scalable emission calculations, which will use the deliverables of this study while also assessing mechanisms of variability across the period of the intensive. Access and infrastructure to these sites will be coordinated by the Environment Agency. Our deployment will build on past and ongoing Environment Agency/NPL LIDAR work, which quantifies SWDS fluxes at a range of locations.
The important novelty of this study will be to compare and characterise flux calculation methods from a range of different techniques, some of which are being considered for important long-term monitoring applications such as at exploratory fracking sites (EPA, personal communication) using tomographic methods and multi-ray open path FTIR (for example, Childers et al. 2001, Hashmonay et al. 2001).
We will deploy a range of well-characterised in-situ instruments and novel remote sensing methods for this study. These include the GAUGE-funded closed path FTS (Bösch, University of Leicester), a high-resolution open path Midac FTIR spectrometer on loan from the NERC Field Spectroscopy Facility (Allen, University of Manchester; see facility approval letter attached), and gas chromatographs (Harris, University of Cambridge). Added (non-critical) value will be sought through additional and separate capital funding for enhanced instrumentation that would permit a methane isotopic capability and better short- and long-range source attribution.
Novel multi-ray-path FTIR tomographic techniques will be well tested here against the in situ dataset. Time is requested here to develop and test this new tomographic technique. Flux measurements for methane together with CO2 and N2O will also be obtained from the closed path FTS with a flux-gradient method and we request modest funding for the flux-gradient setup.
In addition to this ground component, the potential for airborne flux estimates using the Edinburgh Dimona Picarro instrument (Williams, University of Edinburgh) will be validated against the ground measurements and cost is requested to fly the Dimona during four dedicated three-hour flights in April 2014 with dedicated time for analysis. Both opportunistic and dedicated use will be made of FAAM aircraft measurements of GHGs upwind and downwind of the site during existing GAUGE flights. The Met Office has also granted Dr Allen five hours of FAAM aircraft time for tailored use during the intensive observation period in this study, representing a contribution in-kind of £35,000. Furthermore, this combined ground and airborne dataset will test the ability of satellite instruments (GOSAT, S5P) to observe enhancements of concentration data around sites typified by the spatial scale of SWDS sites (Bösch, University of Leicester).
The dataset and flux deliverable of this study will link GREENHOUSE and GAUGE modelling activity through their mutual question surrounding characterisation of point sources. For GAUGE, inversions and resulting flux footprints calculated by the NAME model (Harris, University of Cambridge) using the existing network will be tested against these localised measurements, while the flux estimates derived here will be included in a sensitivity study using the JULES land-surface model. The scale-up resulting from the deliverable of this study will be achieved not by atmospheric models but by inventory models, in particular assessing (a) the implications of the case study for emission estimates made across the UK (poorly constrained as described above), and (b) the development of techniques capable of being used in future which can fill the gap between the point emission estimates / landfill process modelling and the wider atmosphere through the national inventory.
The deliverable of this activity will be:

• a multi-platform, multi-instrument dataset (archived with BADC) and case study to test model efficacy in attributing fluxes from remote point sources and hotspots
• development of new methodologies for determining point source emission estimates
Addendum
Since this project was awarded by NERC, additional measurement capability has been promised to the project including a perfluorocarbon tracer release system (University of Bristol), ground gas monitors and surface flux chamber measurement (Ground Gas Solutions Ltd and Dr Steve Boult, University of Manchester).
It has now been decided that a two-week intensive observation period will take place at Mason’s Landfill Site, Ipswich, during August 2014.

15 of 15
www.gov.uk/environment-agency