feasibility of friction stir processing (fsp) as a method
TRANSCRIPT

Brigham Young University Brigham Young University
BYU ScholarsArchive BYU ScholarsArchive
Theses and Dissertations
2016-12-01
Feasibility of Friction Stir Processing (FSP) as a Method of Feasibility of Friction Stir Processing (FSP) as a Method of
Healing Cracks in Irradiated 304L Stainless Steels Healing Cracks in Irradiated 304L Stainless Steels
Cameron Cornelius Gunter Brigham Young University
Follow this and additional works at: https://scholarsarchive.byu.edu/etd
Part of the Mechanical Engineering Commons
BYU ScholarsArchive Citation BYU ScholarsArchive Citation Gunter, Cameron Cornelius, "Feasibility of Friction Stir Processing (FSP) as a Method of Healing Cracks in Irradiated 304L Stainless Steels" (2016). Theses and Dissertations. 6111. https://scholarsarchive.byu.edu/etd/6111
This Thesis is brought to you for free and open access by BYU ScholarsArchive. It has been accepted for inclusion in Theses and Dissertations by an authorized administrator of BYU ScholarsArchive. For more information, please contact [email protected], [email protected].
Feasibility of Friction Stir Processing (FSP)
as a Method of Healing Cracks in
Irradiated 304L Stainless Steels
Cameron Cornelius Gunter
A thesis submitted to the faculty of Brigham Young University
in partial fulfillment of the requirements for the degree of
Master of Science
Michael P. Miles, Chair Tracy W. Nelson Jason M. Weaver
School of Technology
Brigham Young University
Copyright © 2016 Cameron Cornelius Gunter All Rights Reserved
ABSTRACT
Feasibility of Friction Stir Processing (FSP) as a Method of Healing Cracks in Irradiated 304L Stainless Steels
Cameron Cornelius Gunter
School of Technology, BYU Master of Science
The current US fleet of nuclear reactors has been in service for three decades. Over this
period, existing welds in stainless steel (SS) shrouds have sustained stress corrosion cracking (SCC) and are in need of repair. Additionally, helium has formed interstitially as a byproduct of proton bombardment. Current repair technology, such as TIG welding, puts extreme amounts of heat into the material and allows for interstitial helium atoms to aggregate and form bubbles/voids at grain boundaries. This significantly weakens the material, proving to be a very counterproductive and ineffective repair technique.
Much study has been done on friction stir processing (FSP), but none has explored it as
an enabling repair technology for use in nuclear applications. Because of its relatively low energy input as a solid state joining technology, it is proposed that FSP could effectively heal SCCs in these existing welds without the negative side effect of helium bubble formation.
A spread of speeds and feeds were initially tested using a PCBN-W-Re tool on 304L SS.
Six of these parameter sets were selected as representations of high, medium, and low temperature-per-power outputs for this research: 2 IPM-80 RPM, 2 IPM-150 RPM, 4 IPM-150 RPM, 4 IPM-250 RPM, 6 IPM-125 RPM, and 6 IPM-175 RPM. These varied parameter sets were tested for their tensile, micro-hardness, and corrosion resistant properties. In general, the lower IPM and RPM values resulted in higher ultimate tensile strengths (UTS). Higher IPM and RPM values resulted in tunnel, pin hole, and surface void defects. These defects caused premature failure in tensile tests and could often be identified through microscopy.
Micro-hardness testing demonstrated a strong correlation per the Hall-Petch relationship
– finer grain sizes resulted in higher yield strength (hardness values) of the material. The tool temperature during FSP was a good indicator of the expected hardness – lower temperatures resulted in higher hardness values.
Corrosion testing was performed with a 1000-hour alternate immersion test in a room
temperature 3.5% NaCl solution. With these testing parameters, the results demonstrated that FSP had no effect on the corrosion resistance of 304L SS under these conditions. Keywords: Cameron Gunter, friction stir processing, welding, FSP, FSW, irradiated stainless steel, 304L, crack healing, alternate immersion corrosion testing, micrographs, tensile testing, micro-hardness maps

ACKNOWLEDGEMENTS
I would like to thank, first and foremost, my chair and mentor, Dr. Mike Miles. Without
his provided help and guidance from day one, I would not have had this opportunity and come as
far as I have. It is equally important that I recognize the National Science Foundation that funded
this research and Brigham Young University and MegaStir Technologies which provided most of
the necessary equipment and facilities for its completion.
I would also like to thank all those that aided me in various ways throughout this
experience. Without their help, the project's progression would have been drastically stunted. To
name a few: Dr. Tracy Nelson, Tyler Mathis, Nolan Crook, Scott Taysom, Dr. Fenghao Liu,
Cameron Gygi, Colin Kitchen, and Nitin Kumbhar.
Finally, I thank my wife, Jessica, who has constantly been there as a support for me in my
darkest hours and brightest days and my daughter who has further inspired me to complete this
research.
iv
TABLE OF CONTENTS
Table of Contents ........................................................................................................................... iv
List of Tables ................................................................................................................................. vi
List of Figures ............................................................................................................................... vii
1 Introduction ............................................................................................................................. 1
1.1 Background ...................................................................................................................... 1
1.1.1 State of Nuclear Reactors.......................................................................................... 1
1.1.2 Current Repair Technology....................................................................................... 2
1.2 Hypotheses ....................................................................................................................... 2
1.3 Significance of the Study ................................................................................................. 2
1.4 Delimitations .................................................................................................................... 3
1.5 Definition of Abbreviations and Terms ........................................................................... 3
2 Literature Review .................................................................................................................... 6
2.1 Stainless Steels ................................................................................................................. 6
2.1.1 Austenitic Stainless Steels ........................................................................................ 6
2.1.2 Stress Corrosion Cracking ........................................................................................ 7
2.2 Irradiated Stainless Steel and Helium Formation ............................................................. 7
2.2.1 Repairing Weldments in Irradiated Stainless Steel ................................................... 7
2.3 Friction Stir Processing (FSP) .......................................................................................... 8
2.3.1 FSP in Stainless Steel................................................................................................ 9
2.3.2 Tooling ...................................................................................................................... 9
2.3.3 Post-Processing Microstructure .............................................................................. 10
3 Methodology .......................................................................................................................... 11
3.1 Processing Parameters Validation .................................................................................. 11
3.1.1 Tensile Testing ........................................................................................................ 12
3.1.2 Microscopy ............................................................................................................. 13
3.1.3 Micro-Hardness Mapping ....................................................................................... 13
3.2 H1: Simulated Crack Healing ........................................................................................ 14
3.3 H2: Testing Corrosion Resistance .................................................................................. 17
4 Results and Discussion .......................................................................................................... 20
4.1 Processing Parameters Validation .................................................................................. 20
4.1.1 Tensile Testing ........................................................................................................ 24
v
4.1.2 Microscopy ............................................................................................................. 27
4.1.3 Micro-Hardness Mapping ....................................................................................... 30
4.2 H1: Simulated Crack Healing ........................................................................................ 36
4.3 H2: Testing Corrosion Resistance .................................................................................. 39
5 Conclusions and Recommendations ...................................................................................... 42
5.1 H1: Simulated Crack Healing ........................................................................................ 42
5.2 H2: Testing Corrosion Resistance .................................................................................. 43
5.3 Processing Parameters Validation .................................................................................. 43
5.3.1 Tensile Testing ........................................................................................................ 44
5.3.2 Microscopy ............................................................................................................. 45
5.3.3 Micro-Hardness Mapping ....................................................................................... 45
References ..................................................................................................................................... 47
Appendix A. Alternate Immersion Corrosion Tester ................................................................ 50
A.1 Corrosion Tester Assembly Images ................................................................................. 50
A.1.1 Assembly and Operation Checklist: ............................................................................ 54
A.2 Arduino Code ................................................................................................................... 55

vi
LIST OF TABLES
Table 4-1: MegaStir Varied Parameter Sets Plate Organization .................................................. 21
Table 4-2: Z-Force Control Welds Summary ............................................................................... 21
Table 4-3: Z-Depth Control Welds Summary .............................................................................. 22
vii
LIST OF FIGURES
Figure 2-1: Friction Stir Processing Schematic .............................................................................. 8
Figure 2-2: Q70 Friction Stir Processing Tool ............................................................................. 10
Figure 3-1: Preliminary Welds – Weld Temperature vs Power .................................................... 12
Figure 3-2: CNC-Machined Dogbone in Custom Fixture ............................................................ 13
Figure 3-3: Micro-Hardness Testing Machine .............................................................................. 14
Figure 3-4: Micro-Hardness Testing: Indent Grid ........................................................................ 14
Figure 3-5: Simulated Crack Healing Experiment 1 (SCH1) Drawing ........................................ 15
Figure 3-6: Simulated Crack Healing Experiment 2 (SCH2) Drawing ........................................ 16
Figure 3-7: SCH2 - Water Jet Cut Specimens .............................................................................. 17
Figure 3-8: Alternate Immersion Corrosion Tester ...................................................................... 18
Figure 3-9: U-Bending Die ........................................................................................................... 18
Figure 3-10: Corrosion Testing Specimens in Basket .................................................................. 19
Figure 4-1: Weld Parameter Validation – Water Jet-Cut Specimens ........................................... 22
Figure 4-2: Hardness vs Tool Temperature .................................................................................. 23
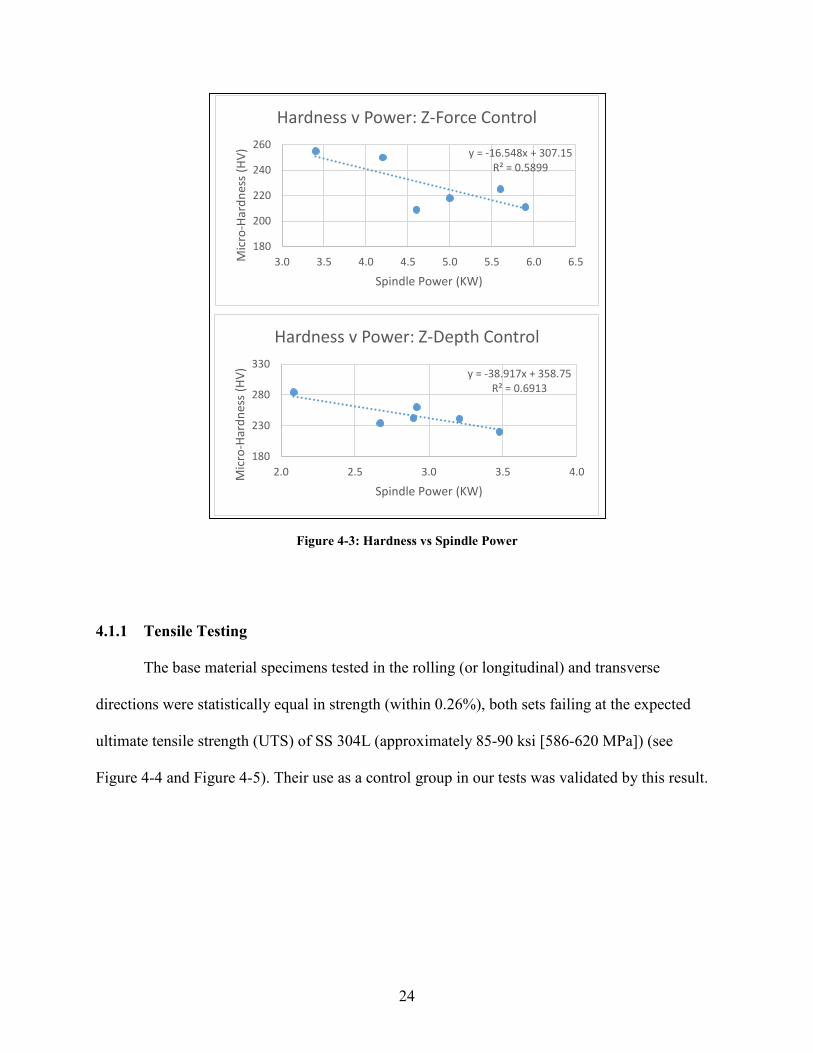
Figure 4-3: Hardness vs Spindle Power ........................................................................................ 24
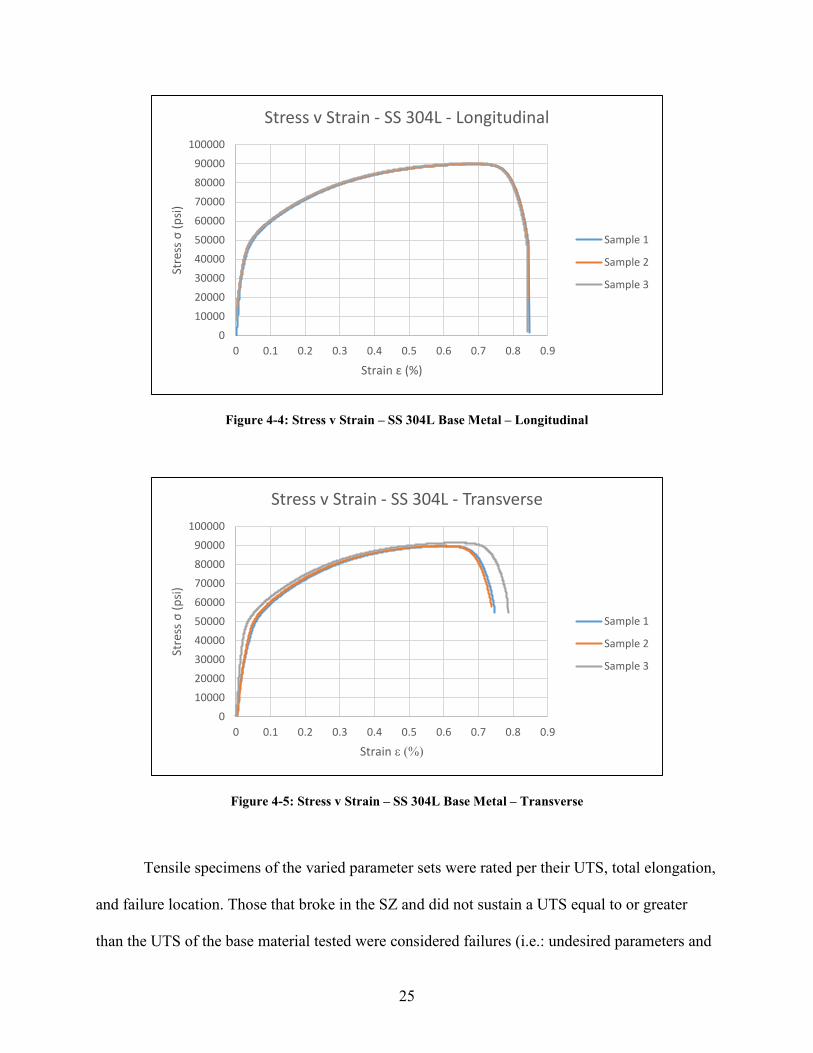
Figure 4-4: Stress v Strain – SS 304L Base Metal – Longitudinal ............................................... 25
Figure 4-5: Stress v Strain – SS 304L Base Metal – Transverse .................................................. 25
Figure 4-6: Tensile Failure of Z-Depth Control Specimen 4I-250R ............................................ 26
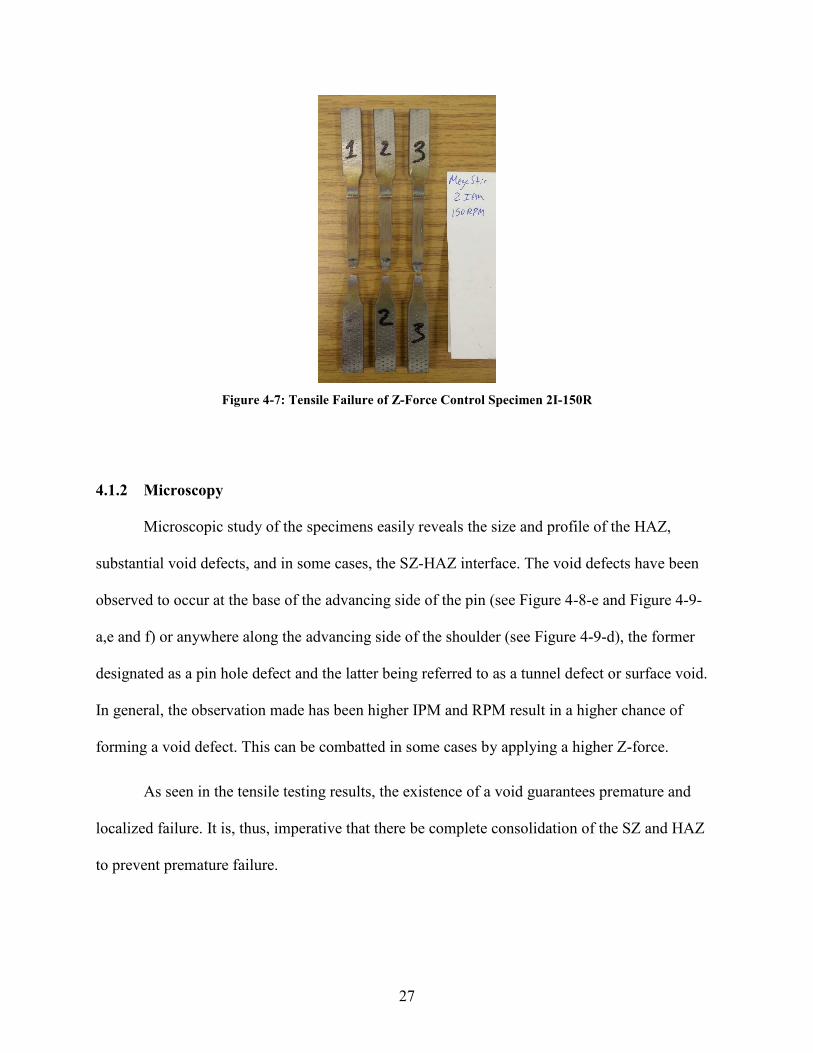
Figure 4-7: Tensile Failure of Z-Force Control Specimen 2I-150R ............................................. 27
Figure 4-8: Micrographs of Z-Force Control Specimens ............................................................. 28
Figure 4-9: Micrographs of Z-Depth Control Specimens ............................................................. 29
Figure 4-10: Micro-Hardness Results – Z-Force Control ............................................................. 31
viii
Figure 4-11: Micro-Hardness Results – Z-Depth Control ............................................................ 32
Figure 4-12: Evaluated Area for SZ Hardness Averages .............................................................. 33
Figure 4-13: Hardness v Grain Size Plot ...................................................................................... 34
Figure 4-14: Micro-Hardness vs Tool Temperature – Z-Depth Control Runs ............................. 35
Figure 4-15: Estimated Grain Size vs Tool Temperature – Z-Depth Control Runs ..................... 35
Figure 4-16: SCH1 – Example of Surface Void and Tunnel Defect ............................................ 36
Figure 4-17: SCH2 – Crack Healing Cross Section Progression .................................................. 38
Figure 4-18: Processed Specimens Post 1000-hr Corrosion Test ................................................. 40
Figure 4-19: Unprocessed Specimens Post 1000-hr Corrosion Test ............................................ 41

1
1 INTRODUCTION
1.1 Background
Much research has been done on the friction stirring process. This research ranges from
optimization of tooling materials and processing parameters to post-processing microstructure
and mechanical properties of friction stir processed specimens. Friction stir processing (FSP) has
been widely used to create finer grain structures in some applications to obtain much more
desirable mechanical properties of materials, steels in particular. This is due to its ability to be a
solid state joining process of relatively low temperatures. FSP has also been used to heal stress
corrosion cracks (SCCs) in existing welds in stainless steels. Never before, however, has it been
used to heal cracks in irradiated stainless steel (SS).
1.1.1 State of Nuclear Reactors
The current fleet of nuclear power plants in the U.S. has been in service for about three
decades. Over this long period, SCCs have formed in existing welds of the SS shrouds used in
the light-water reactors.
Another negative byproduct of their years of service comes from proton bombardment. A
reaction takes place when radioactive material sends protons at high velocity toward the SS
shrouds that forms helium interstitially within in the metal's crystalline lattice.
2
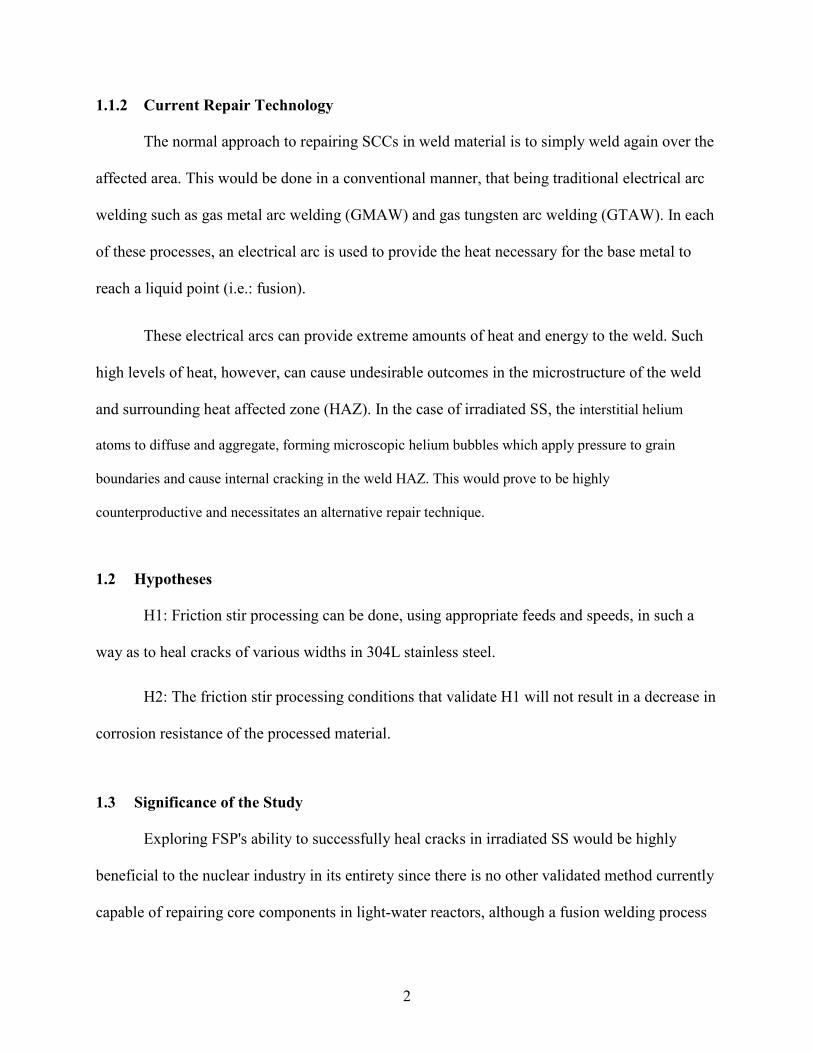
1.1.2 Current Repair Technology
The normal approach to repairing SCCs in weld material is to simply weld again over the
affected area. This would be done in a conventional manner, that being traditional electrical arc
welding such as gas metal arc welding (GMAW) and gas tungsten arc welding (GTAW). In each
of these processes, an electrical arc is used to provide the heat necessary for the base metal to
reach a liquid point (i.e.: fusion).
These electrical arcs can provide extreme amounts of heat and energy to the weld. Such
high levels of heat, however, can cause undesirable outcomes in the microstructure of the weld
and surrounding heat affected zone (HAZ). In the case of irradiated SS, the interstitial helium
atoms to diffuse and aggregate, forming microscopic helium bubbles which apply pressure to grain
boundaries and cause internal cracking in the weld HAZ. This would prove to be highly
counterproductive and necessitates an alternative repair technique.
1.2 Hypotheses
H1: Friction stir processing can be done, using appropriate feeds and speeds, in such a
way as to heal cracks of various widths in 304L stainless steel.
H2: The friction stir processing conditions that validate H1 will not result in a decrease in
corrosion resistance of the processed material.
1.3 Significance of the Study
Exploring FSP's ability to successfully heal cracks in irradiated SS would be highly
beneficial to the nuclear industry in its entirety since there is no other validated method currently
capable of repairing core components in light-water reactors, although a fusion welding process

3
like laser welding is being investigated for this application. Such a use for this technology would
enable repairs, save millions of dollars, and could greatly extend the service life of many nuclear
power plants.
1.4 Delimitations
This study will only be performed on SS alloy 304L because of its abundant use in
nuclear applications. It will also only be performed on non-irradiated metal at this stage since
this work is meant to be the groundwork for future studies that will test on irradiated material.
The tool chosen (a Polycrystalline Cubic Boron Nitride-Tungsten-Rhenium (PCBN-W-Re)
hybrid) to be used in this study has proven its effectiveness in FSP of SS, so other tooling
materials will not be considered.
1.5 Definition of Abbreviations and Terms
Advancing / Retreating Side (AS, RS) – in FSP/W, the advancing side refers to the side
of the tool where the rotational motion is in the same direction as the traversing direction. The
retreating side is, thus, the opposite side.
ASTM – American Society for Testing Materials; an internationally recognized standard
Base Material – material as received from the mill, unaffected by any other processing
Bead-on-Plate – an FSP/W run on a single plate, not joining two plates together
CNC – Computer Numerical Control
Dogbone – term given to tensile specimens due to their resembling a dog bone
EBSD – Electron Backscatter Diffraction
4
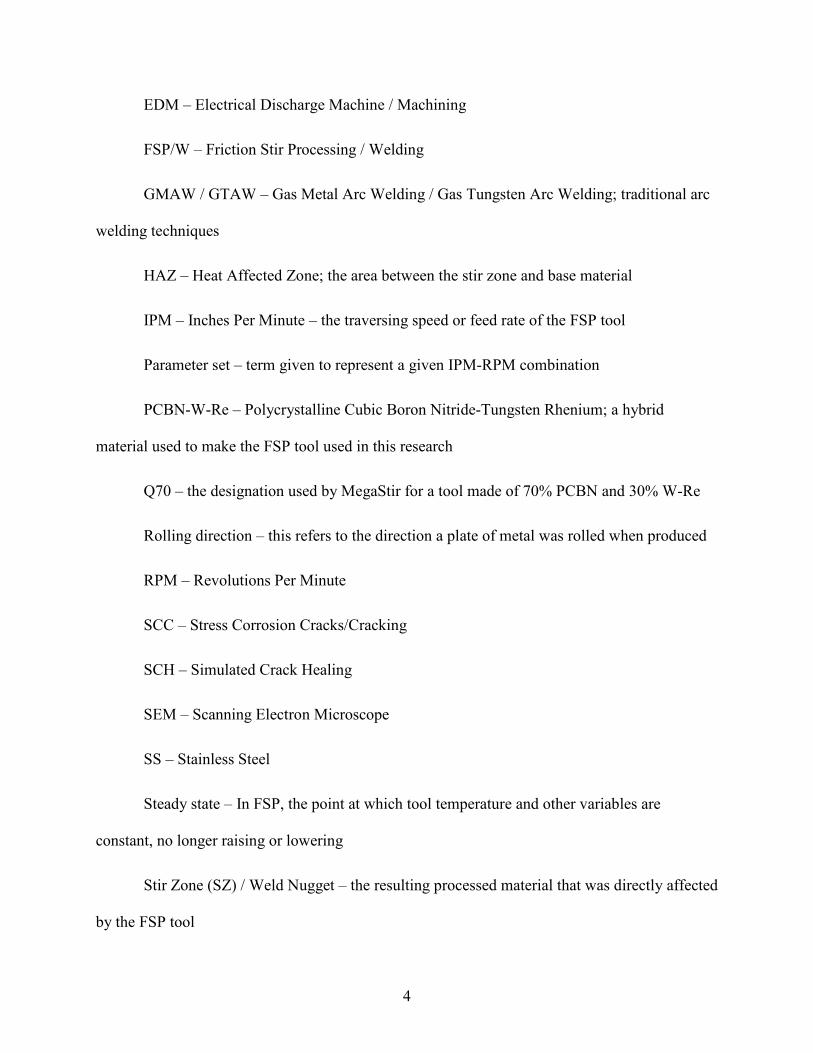
EDM – Electrical Discharge Machine / Machining
FSP/W – Friction Stir Processing / Welding
GMAW / GTAW – Gas Metal Arc Welding / Gas Tungsten Arc Welding; traditional arc
welding techniques
HAZ – Heat Affected Zone; the area between the stir zone and base material
IPM – Inches Per Minute – the traversing speed or feed rate of the FSP tool
Parameter set – term given to represent a given IPM-RPM combination
PCBN-W-Re – Polycrystalline Cubic Boron Nitride-Tungsten Rhenium; a hybrid
material used to make the FSP tool used in this research
Q70 – the designation used by MegaStir for a tool made of 70% PCBN and 30% W-Re
Rolling direction – this refers to the direction a plate of metal was rolled when produced
RPM – Revolutions Per Minute
SCC – Stress Corrosion Cracks/Cracking
SCH – Simulated Crack Healing
SEM – Scanning Electron Microscope
SS – Stainless Steel
Steady state – In FSP, the point at which tool temperature and other variables are
constant, no longer raising or lowering
Stir Zone (SZ) / Weld Nugget – the resulting processed material that was directly affected
by the FSP tool
5
Traversing – the lateral movement of the FSP/W tool once plunged into material
Tunnel defect – term given to the pin hole defect that runs along the length of the AS of
the SZ. They manifest themselves after a surface void has been consolidated.
Varied Parameter Sets – term for the 6 parameter sets used for weld parameter validation
Z-Force – The applied downward pressure during FSP
6
2 LITERATURE REVIEW
2.1 Stainless Steels
Stainless steels gain their ability to resist corrosion from a relatively high weight percent
(wt. %) of chromium and nickel. They are also preferred for their ability to be tailored to meet
certain material property needs with the addition of various alloying elements such as
molybdenum, copper, titanium, and silicon. Within the family of SS, there are several sub-
categories which include ferritic, martensitic, duplex, and austenitic. These alloys are classified
primarily by their compositions and the phases present in their microstructures (ASM
International, 2000).
2.1.1 Austenitic Stainless Steels
Of the different sub-categories of SS, austenitic is probably the most commonly used.
And of the austenitic SSs, the 300 series alloys are most abundant. In addition to the high
chromium content, austenitic SS are also high in nickel content which makes them especially
corrosion resistant. This makes them especially useful in chemical, nuclear, and other corrosive
environments (ASM International, 2008).

7
2.1.2 Stress Corrosion Cracking
The phenomenon of stress corrosion cracking is one that is all but inevitable in welds that
are meant to undergo usage over a prolonged period. The longer a weld is in service, the more
guaranteed it will suffer the effect of SCC. This is primarily due to traditional welds all being
subject to corrosion. The mix of phases and precipitation of alloying elements out of the SS and
potentially leave a weld bead vulnerable to corrosion (Lu, Chen, Luo, Patchett, & Xu, 2003). The
corrosion causes pitting at the surface that act as weak points where the physical stress against
the weld will inevitably lead to cracking in the weld.
2.2 Irradiated Stainless Steel and Helium Formation
Wang et al. report that SS used in fusion reactors is subjected to neutron bombardment and
generates entrapped helium (C. A. Wang, Grossbeck, Aglan, & Chin, 1996). Since helium is insoluble in
metals, it is favorable for the helium to precipitate as bubbles along grain boundaries. This causes material
weakening at the grain boundaries and the stresses of welding and cooling can quickly yield to fracturing
at said grain boundaries (Asano et al., 1999; Kanne, Lohmeier, Dunn, & Tosten, 1993). They also suggest
that a method of repairing inevitable failures of irradiation-degraded SS structures and pressure vessels
needs to be developed.
2.2.1 Repairing Weldments in Irradiated Stainless Steel
Currently, the only possible way of repairing irradiated SS is through traditional methods
of arc welding. These bring with them high levels of heat and allow for the microscopic helium
to precipitate out of the crystalline lattice. Since helium does not dissolve into SS, it is forced to
grain boundaries where it forms bubbles which stress the material causing severe weakening on
the macroscopic scale (Kanne, Louthan, Rankin, & Tosten, 1999; Li, Grossbeck, Zhang, Shen, &
8
Chin, 2011; Tsuchiya, Kawamura, & Kalinin, 2000; C. A. Wang, Grossbeck, Potluri, & Chin,
1996).
Some research is exploring the use of laser welding techniques as a way of reducing
overall energy input reducing the effect of helium propagation to grain boundaries (Yamada et
al., 2002).
2.3 Friction Stir Processing (FSP)
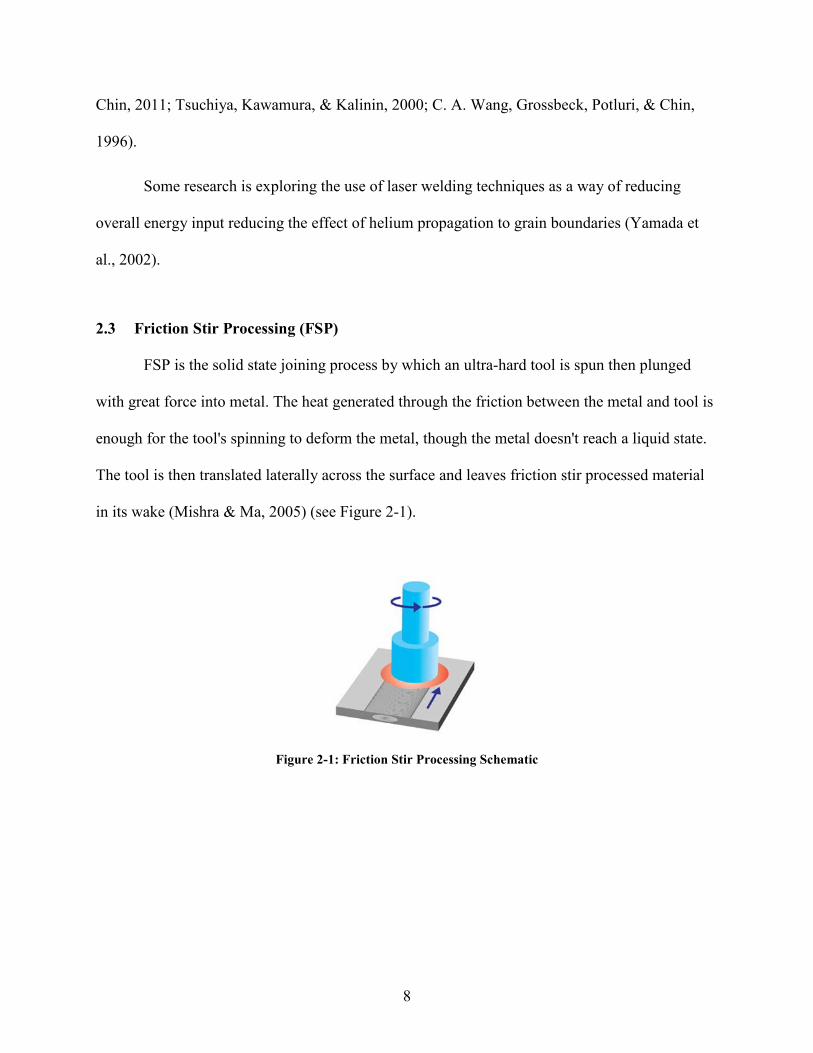
FSP is the solid state joining process by which an ultra-hard tool is spun then plunged
with great force into metal. The heat generated through the friction between the metal and tool is
enough for the tool's spinning to deform the metal, though the metal doesn't reach a liquid state.
The tool is then translated laterally across the surface and leaves friction stir processed material
in its wake (Mishra & Ma, 2005) (see Figure 2-1).
Figure 2-1: Friction Stir Processing Schematic

9
2.3.1 FSP in Stainless Steel
In SS, FSP is known to allow for recrystallization due to the nature of the processing. The
tool's movement through the material tears apart existing grains resulting in much smaller
average grain size in the stir zone. However, if the metal is left at elevated temperatures long
enough, significant amounts of recrystallization can occur forming new phases, such as sigma
phase (Park et al., 2003). Sigma phase, in high enough abundance, can be detrimental to the
overall mechanical properties of the SS due to its increased hardness and decreased ductility in
relation to the base material.
2.3.2 Tooling
Due to the much higher strength of SS alloys – in comparison to softer materials such as
copper, aluminum, and magnesium that have been extensively studied in FSP applications
(Apelian, 2011; Feng, Liu, & Suresh Babu, 2011; Karami, Jafarian, Eivani, & Kheirandish,
2016; Tsai & Kao, 2012) – a much harder tool is required to successfully FS process it. Some
study has been done using Si3N4 as a tool material (Ahn, Choi, Kim, & Jung, 2012) though
harder, more wear-resistant materials exist. One of the hardest materials available for such a tool
is polycrystalline cubic boron nitride (PCBN). However, due to its extreme hardness and lack of
ductility, it is prone to catastrophic failure after a limited number of uses. To counter this, the
addition of other binding elements is used to bring the ductility up while still maintaining much
of the original hardness of PCBN. In the case of this study, that binder is tungsten-rhenium (W-
Re) and accounts for 30% by weight of the tool, PCBN making up the other 70%. We call this
tool, "Q70," as it is designated by its manufacturer, MegaStir Technologies.

10
The tool is also threaded which allows for the design to have a convex shoulder (see
Figure 2-2). The previously more popular design of FSP tools used a concave shoulder and
unthreaded pin. Threading does the work of constantly pulling material toward the center of the
tool's rotation, thus helping to maintain consolidation (a lack of voids) in the stir zone.
Figure 2-2: Q70 Friction Stir Processing Tool with 8 mm-long, Threaded Conical Pin and 25 mm Diameter Convex Shoulder. 2.3.3 Post-Processing Microstructure
Extensive study has been performed on the post-processing microstructure of materials
processed by FSP. In many cases, FSP has been determined to produce favorable material
properties in metal alloys (Apelian, 2011; Feng et al., 2011; Liu & Ma, 2010; Mishra & Ma,
2005; Park et al., 2005; Tsai & Kao, 2012), most of which have been in aluminum alloys. FSP
has also been used to regain desirable material properties when used on an existing arc weld
(Sterling, 2004). Work has also been done to model material flow during processing to better
understand heat transfer and recrystallization of the microstructure of SS (Liu & Nelson, 2016;
Reilly, Shercliff, Chen, & Prangnell, 2015).

11
3 METHODOLOGY
3.1 Processing Parameters Validation
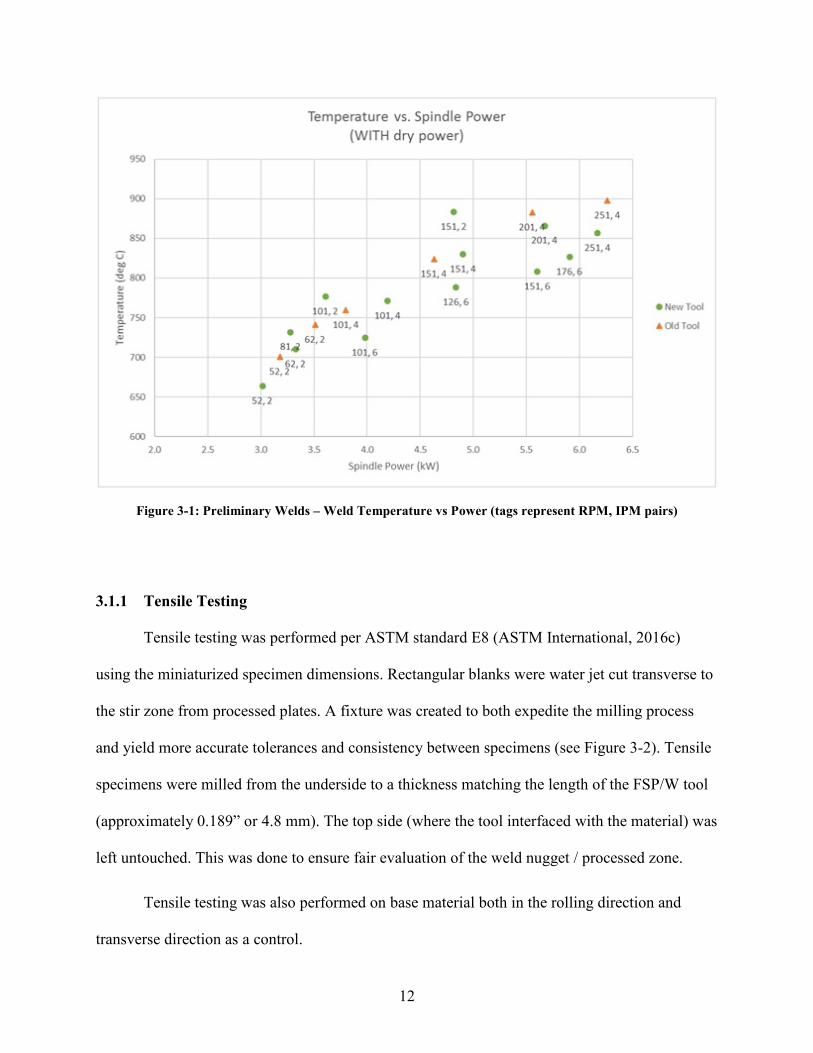
One of the key goals of this research is to lay the foundation for future work. It was
necessary to test several weld parameters to determine which ones resulted in a desired weld.
This was done by performing several bead-on-plate welds and analyzing the resulting data (i.e.:
tool temp and spindle power). From these preliminary welds, a graph was created (see Figure
3-1) and points were selected from areas of high, medium, and low power input. The parameters
chosen were 2 IPM-80 RPM, 2 IPM-150 RPM, 4 IPM-150 RPM, 4 IPM-250 RPM, 6 IPM-125
RPM, and 6 IPM-175 RPM. These chosen parameter sets were the basis for all following
material characterization that took place.
Specimens from the FSP runs of these varied parameter sets were subjected to tensile
testing, microscopic examination, and micro-hardness mapping. To eliminate other variables,
they all came from the same cut of SS.
12
Figure 3-1: Preliminary Welds – Weld Temperature vs Power (tags represent RPM, IPM pairs) 3.1.1 Tensile Testing
Tensile testing was performed per ASTM standard E8 (ASTM International, 2016c)
using the miniaturized specimen dimensions. Rectangular blanks were water jet cut transverse to
the stir zone from processed plates. A fixture was created to both expedite the milling process
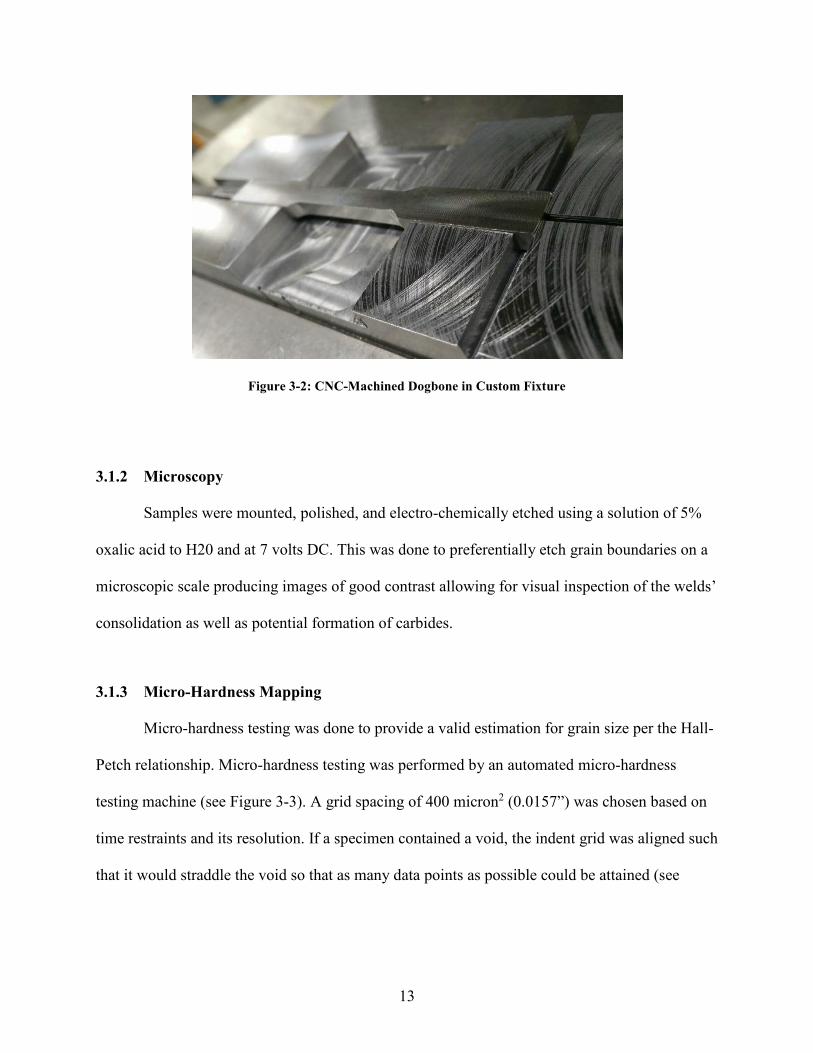
and yield more accurate tolerances and consistency between specimens (see Figure 3-2). Tensile
specimens were milled from the underside to a thickness matching the length of the FSP/W tool
(approximately 0.189” or 4.8 mm). The top side (where the tool interfaced with the material) was
left untouched. This was done to ensure fair evaluation of the weld nugget / processed zone.
Tensile testing was also performed on base material both in the rolling direction and
transverse direction as a control.
13
Figure 3-2: CNC-Machined Dogbone in Custom Fixture 3.1.2 Microscopy
Samples were mounted, polished, and electro-chemically etched using a solution of 5%
oxalic acid to H20 and at 7 volts DC. This was done to preferentially etch grain boundaries on a
microscopic scale producing images of good contrast allowing for visual inspection of the welds’
consolidation as well as potential formation of carbides.
3.1.3 Micro-Hardness Mapping
Micro-hardness testing was done to provide a valid estimation for grain size per the Hall-
Petch relationship. Micro-hardness testing was performed by an automated micro-hardness
testing machine (see Figure 3-3). A grid spacing of 400 micron2 (0.0157”) was chosen based on
time restraints and its resolution. If a specimen contained a void, the indent grid was aligned such
that it would straddle the void so that as many data points as possible could be attained (see

14
Figure 3-4). The indentations and measurements were made autonomously and were verified
prior to removing from specimens from the machine.
Figure 3-3: Micro-Hardness Testing Machine
Figure 3-4: Micro-Hardness Testing: Indent Grid
3.2 H1: Simulated Crack Healing
Two experiments were designed to determine a baseline understanding of FSP/W’s
ability to heal cracks. The first simulated crack healing experiment (designated as SCH1) was
designed using a random placement of varying crack widths along the length of the projected stir
zone. These crack widths being, in order of welding, 3.0 mm, 0.5 mm, 2.0 mm, 2.5 mm, 1.5 mm,
15
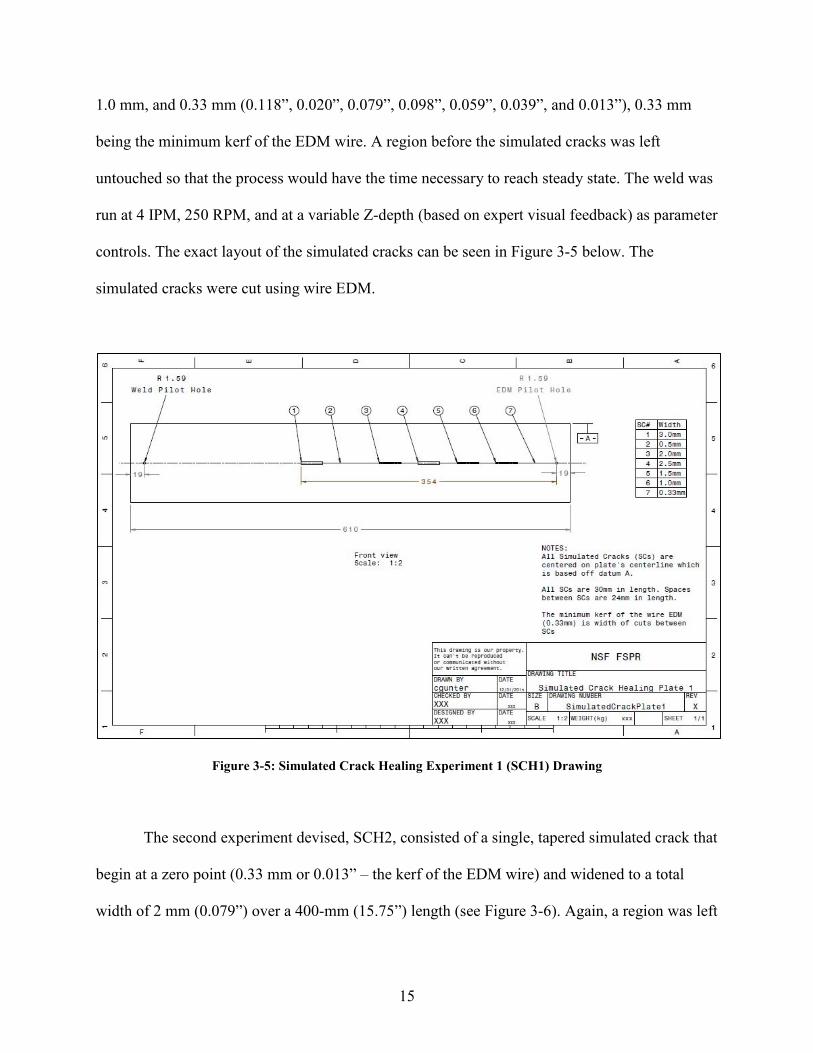
1.0 mm, and 0.33 mm (0.118”, 0.020”, 0.079”, 0.098”, 0.059”, 0.039”, and 0.013”), 0.33 mm
being the minimum kerf of the EDM wire. A region before the simulated cracks was left
untouched so that the process would have the time necessary to reach steady state. The weld was
run at 4 IPM, 250 RPM, and at a variable Z-depth (based on expert visual feedback) as parameter
controls. The exact layout of the simulated cracks can be seen in Figure 3-5 below. The
simulated cracks were cut using wire EDM.
Figure 3-5: Simulated Crack Healing Experiment 1 (SCH1) Drawing
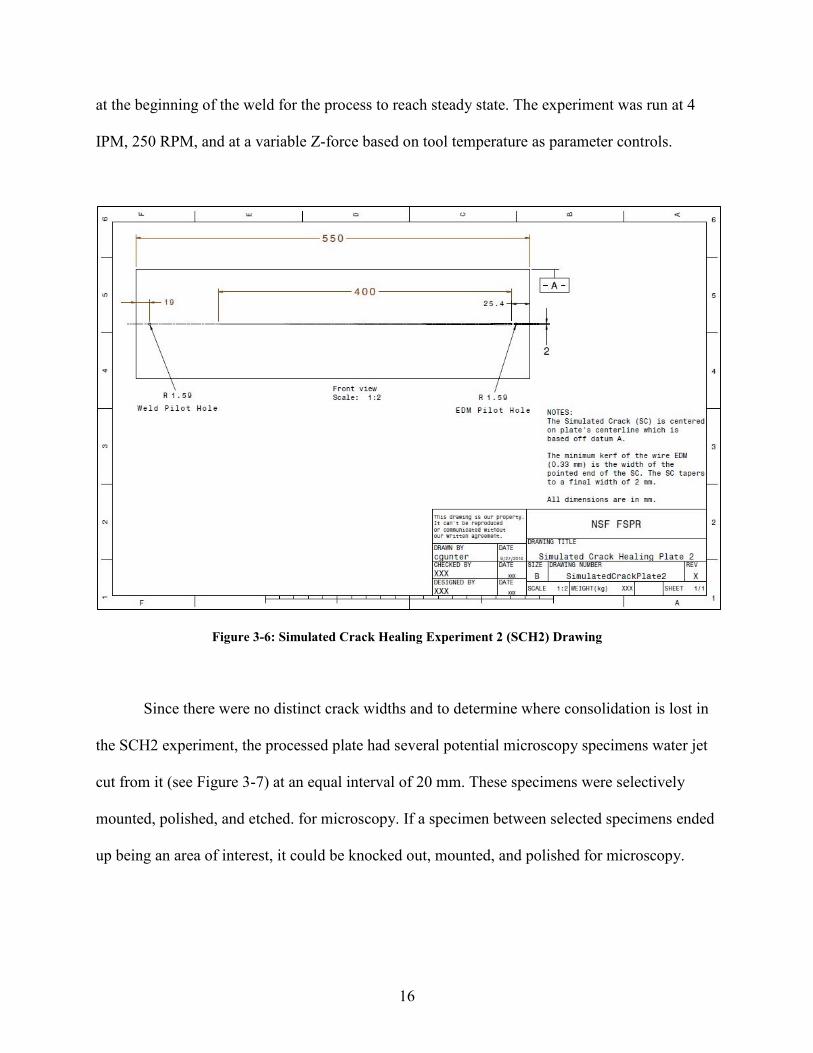
The second experiment devised, SCH2, consisted of a single, tapered simulated crack that
begin at a zero point (0.33 mm or 0.013” – the kerf of the EDM wire) and widened to a total
width of 2 mm (0.079”) over a 400-mm (15.75”) length (see Figure 3-6). Again, a region was left
16
at the beginning of the weld for the process to reach steady state. The experiment was run at 4
IPM, 250 RPM, and at a variable Z-force based on tool temperature as parameter controls.
Figure 3-6: Simulated Crack Healing Experiment 2 (SCH2) Drawing
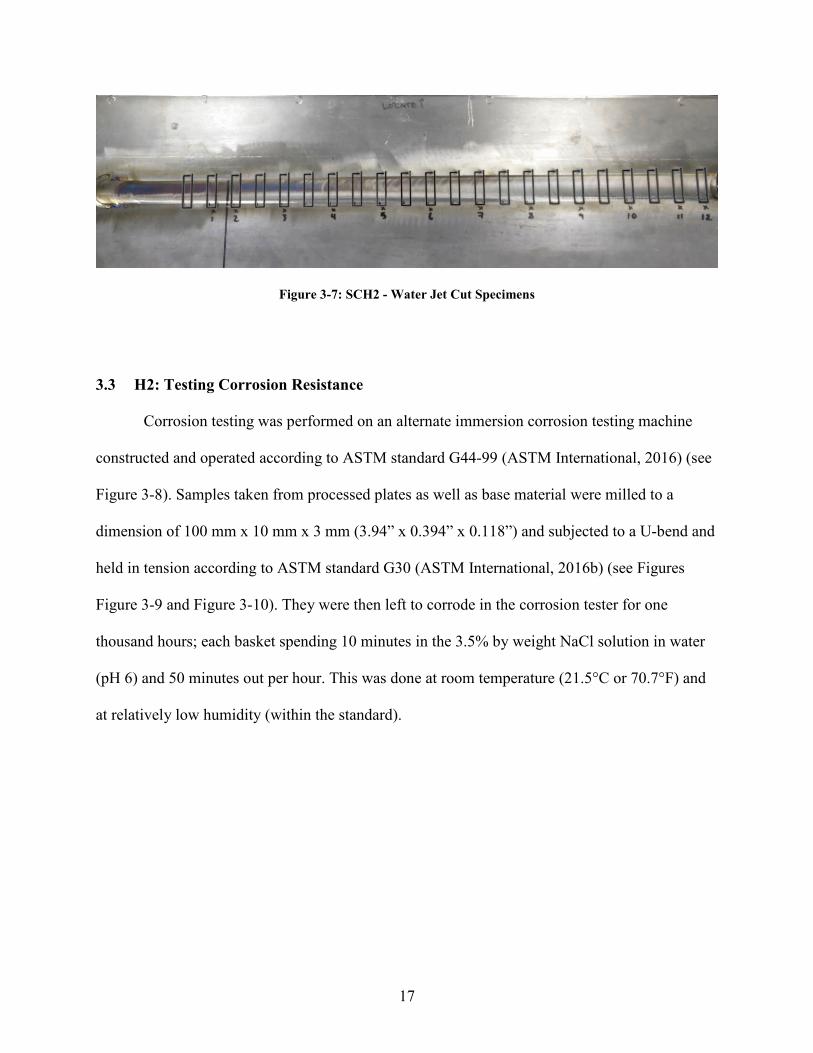
Since there were no distinct crack widths and to determine where consolidation is lost in
the SCH2 experiment, the processed plate had several potential microscopy specimens water jet
cut from it (see Figure 3-7) at an equal interval of 20 mm. These specimens were selectively
mounted, polished, and etched. for microscopy. If a specimen between selected specimens ended
up being an area of interest, it could be knocked out, mounted, and polished for microscopy.
17
Figure 3-7: SCH2 - Water Jet Cut Specimens 3.3 H2: Testing Corrosion Resistance
Corrosion testing was performed on an alternate immersion corrosion testing machine
constructed and operated according to ASTM standard G44-99 (ASTM International, 2016) (see
Figure 3-8). Samples taken from processed plates as well as base material were milled to a
dimension of 100 mm x 10 mm x 3 mm (3.94” x 0.394” x 0.118”) and subjected to a U-bend and
held in tension according to ASTM standard G30 (ASTM International, 2016b) (see Figures
Figure 3-9 and Figure 3-10). They were then left to corrode in the corrosion tester for one
thousand hours; each basket spending 10 minutes in the 3.5% by weight NaCl solution in water
(pH 6) and 50 minutes out per hour. This was done at room temperature (21.5°C or 70.7°F) and
at relatively low humidity (within the standard).

18
Figure 3-8: Alternate Immersion Corrosion Tester
Figure 3-9: U-Bending Die
Three specimens from each Z-force controlled, varied parameter set were used in the
tester. In addition to the processed specimens, three strained (read: U-bend) and three unstrained
samples of SS 304L base material were used as controls for the experiment. All specimens were
sanded to a grit of 1200 on the face of interest and randomly placed in baskets with face up (see
Figure 3-10).

19
Figure 3-10: Corrosion Testing Specimens in Basket

20
4 RESULTS AND DISCUSSION
4.1 Processing Parameters Validation
The first set of experiments using the varied parameter sets were performed at MegaStir.
To save on tool wear and material costs, the parameter sets were paired with each other based on
their projected steady state temperatures (see Table 4-1). The tool was plunged at the start of the
plate and traversed slowly over the first couple inches until the tool reached within 50-100°C
(90-180°F). At which point, the desired IPM and RPM were set and the tool quickly reached
steady state. The weld nugget was also observed to maintain approximately 80% of the tool
shoulder engaged. If adjustments were necessary, they were made by changing the applied Z-
force.
After completing the material characterization tests (tensile, microscopy, and micro-
hardness), we saw a trend that occurred in the data between plates that were run. The trend was
apparent in the resulting micro-hardness maps (see Section 4.1.3). It was observed that welds run
at higher temperatures required subsequently lower Z-forces to maintain a consolidated weld
nugget and to keep the tool shoulder from plunging into the material. The lower temperature
inputs resulted in higher hardness values in the stir zones.

21
Table 4-1: MegaStir Varied Parameter Sets Plate Organization
Plate 1: ~730 – 780°C 2I-80R 6I-125R
Plate 2: ~850 – 880°C 2I-150R 4I-250R
Plate 3: ~825 – 830°C 4I-150R 6I-175R
Because of the trend seen above and for further weld parameter validation, we chose to
perform a second experiment to test the varied parameter sets. This time, each parameter set was
run on its own plate. To further remove the human element from the equation, the welds were all
performed at the same Z-depth and not based on Z-force which was changed in the first
experiment in response to visual signs of weld consolidation. This second experiment was
performed on BYU’s friction stir welder.
From here on, data from the two experiments performed at MegaStir and BYU will be
referred to as “Z-force control” and “Z-depth control,” respectively. A quick summary of the
data is found below in Table 4-2 and Table 4-3. The following sections will refer to these two
tables.
Table 4-2: Z-Force Control Welds Summary
IPM RPMZ-Force
(lb)
ToolTemp.
(F)
SpindlePower(KW)
ProcessedDepth (in)
Min MaxAverage
in SZAverageUTS (psi)
AverageStrain
(%)
Locationof Break
RS M AS Average
2 80 15,500 1422 3.4 0.201 186 318 255 100967 49% AS, BM 2.72 2.91 2.77 2.802 150 13,000 1634 4.6 0.213 184 246 209 99163 59% AS, BM 7.97 9.03 9.32 8.774 150 14,500 1634 5.0 0.209 188 272 218 99296 62% AS, BM 5.63 6.47 5.51 5.874 250 13,000 1675 5.9 0.213 184 265 211 62270 27% AS, Pin 9.25 9.7 11.35 10.106 125 15,500 1393 4.2 0.189 180 340 250 97918 39% AS, Pin 2.04 2.63 2.43 2.376 175 14,500 1587 5.6 0.197 182 302 225 87818 22% AS, Pin 4.73 5.61 5.63 5.32
Grain Size (μm)Tensile Testingμ-Hardness (HV)

22
Table 4-3: Z-Depth Control Welds Summary
Samples were cut from the plates using a water jet. Each batch of samples included three
blanks to be milled into dogbones for use in tensile testing, a 2-inch sample for micro-hardness
testing (to capture adequate base material on either side of the SZ), a 1-inch sample for general
microscopy and electron backscatter diffraction (EBSD) on a scanning electron microscope
(SEM), and three blanks to be milled down for U-bend specimens in corrosion testing (see
Figure 4-1).
Figure 4-1: Weld Parameter Validation – Water Jet-Cut Specimens
IPM RPMZ-Force
(lb)
ToolTemp.
(F)
SpindlePower(KW)
ProcessedDepth (in)
Min MaxAverage
in SZAverageUTS (psi)
AverageStrain
(%)
Locationof Break
2 80 11,766 1074 2.1 0.195 187 343 284 102155 55% AS, BM 1.722 150 11,401 1263 2.7 0.207 185 277 234 101802 62% AS, BM 5.444 150 11,781 1225 2.9 0.195 185 306 242 102816 57% AS, HAZ 4.454 250 10,258 1360 3.5 0.201 188 313 220 79797 13% AS, Pin 7.856 125 11,911 1207 2.9 0.189 185 348 260 86698 19% AS, Pin 2.916 175 11,117 1247 3.2 0.191 176 313 241 95129 25% AS, Pin 4.56
EstimatedAverage
Grain Size(μm)
Tensile Testingμ-Hardness (HV)

23
Strong correlations were found between tool temperature and micro-hardness results (see
Figure 4-2) (see Figure 4-12 for more on how average micro-hardness values were determined).
In theory, it would normally be the case that spindle power is your best predictor of processed
material properties. The reason for this discrepancy is most likely due to all the other abundant
factors that come into play during FSP. See the much lower correlation values of hardness vs
spindle power in Figure 4-3.
Figure 4-2: Hardness vs Tool Temperature
y = -0.161x + 478.74R² = 0.9474
180
200
220
240
260
1300 1400 1500 1600 1700
Mic
ro-H
ardn
ess
(HV)
Tool Temp. (F)
Hardness v Tool Temp: Z-Force Control
y = -0.2336x + 534.03R² = 0.9439
200
220
240
260
280
300
1000 1100 1200 1300 1400
Mic
ro-H
ardn
ess
(HV)
Tool Temp. (F)
Hardness v Tool Temp: Z-Depth Control
24
Figure 4-3: Hardness vs Spindle Power
4.1.1 Tensile Testing
The base material specimens tested in the rolling (or longitudinal) and transverse
directions were statistically equal in strength (within 0.26%), both sets failing at the expected
ultimate tensile strength (UTS) of SS 304L (approximately 85-90 ksi [586-620 MPa]) (see
Figure 4-4 and Figure 4-5). Their use as a control group in our tests was validated by this result.
y = -16.548x + 307.15R² = 0.5899
180
200
220
240
260
3.0 3.5 4.0 4.5 5.0 5.5 6.0 6.5Mic
ro-H
ardn
ess
(HV)
Spindle Power (KW)
Hardness v Power: Z-Force Control
y = -38.917x + 358.75R² = 0.6913
180
230
280
330
2.0 2.5 3.0 3.5 4.0Mic
ro-H
ardn
ess
(HV)
Spindle Power (KW)
Hardness v Power: Z-Depth Control
25
Figure 4-4: Stress v Strain – SS 304L Base Metal – Longitudinal
Figure 4-5: Stress v Strain – SS 304L Base Metal – Transverse
Tensile specimens of the varied parameter sets were rated per their UTS, total elongation,
and failure location. Those that broke in the SZ and did not sustain a UTS equal to or greater
than the UTS of the base material tested were considered failures (i.e.: undesired parameters and
0
10000
20000
30000
40000
50000
60000
70000
80000
90000
100000
0 0.1 0.2 0.3 0.4 0.5 0.6 0.7 0.8 0.9
Stre
ss σ
(psi)
Strain ε (%)
Stress v Strain - SS 304L - Longitudinal
Sample 1
Sample 2
Sample 3
0
10000
20000
30000
40000
50000
60000
70000
80000
90000
100000
0 0.1 0.2 0.3 0.4 0.5 0.6 0.7 0.8 0.9
Stre
ss σ
(psi)
Strain ε (%)
Stress v Strain - SS 304L - Transverse
Sample 1
Sample 2
Sample 3

26
conditions). Many specimens greatly exceeded the base material’s UTS meaning that FSP added
strength to this material (see Table 4-2 and Table 4-3).
It was also observed that weld consolidation was imperatively more critical than welding
temperature or material hardness in the success or failure of a sample. One of the biggest factors
in weld consolidation was adequate Z-force. Beyond weld consolidation, what further yielded a
greater-than-base-material UTS was low energy input (e.g.: 2IPM-80RPM and -150RPM). One
final observation was that higher IPM and RPM welds tend to require even higher Z-forces to
maintain consolidation. Thus, the Z-depth control specimens of higher IPM and RPM (the last
three rows in Table 4-3 on page 22) broke extremely prematurely. In the case of Z-depth control
specimen 4IPM-250RPM, there was very little elongation due to very little coherence between
the advancing side of the SZ and HAZ (see Figure 4-6). By contrast, successful specimens broke
outside the SZ and often outside the HAZ on the advancing side (see Figure 4-7).
Figure 4-6: Tensile Failure of Z-Depth Control Specimen 4I-250R
27
Figure 4-7: Tensile Failure of Z-Force Control Specimen 2I-150R
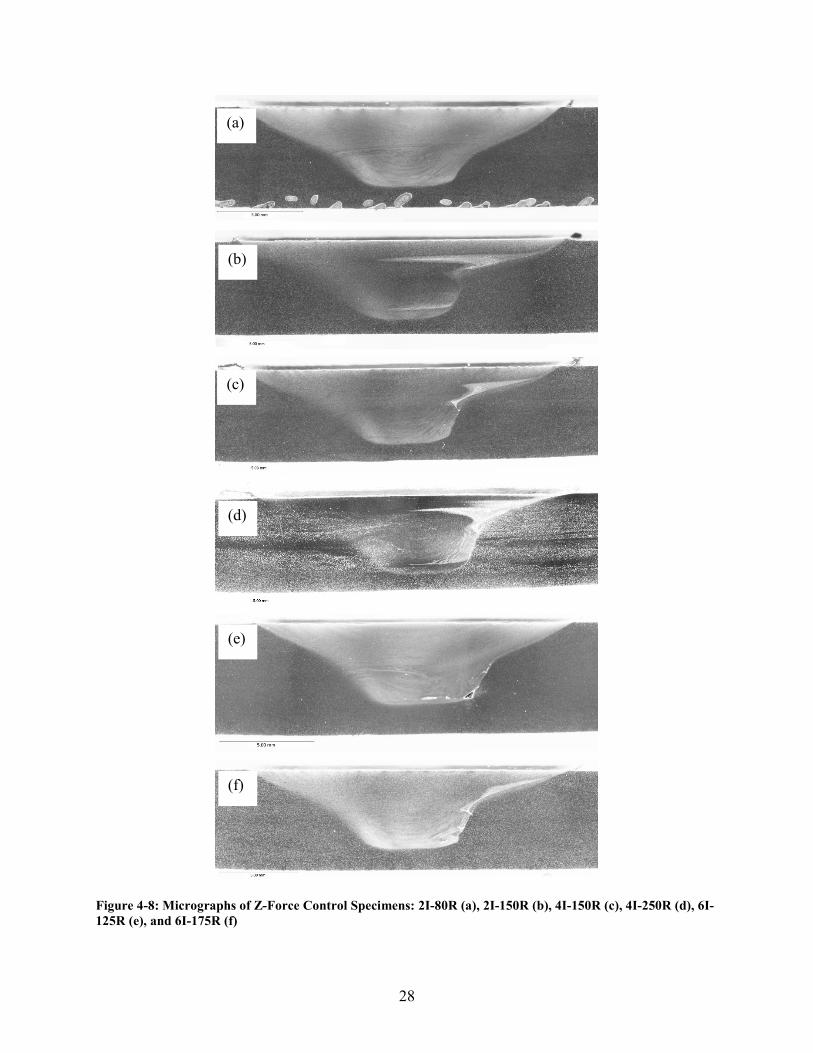
4.1.2 Microscopy
Microscopic study of the specimens easily reveals the size and profile of the HAZ,
substantial void defects, and in some cases, the SZ-HAZ interface. The void defects have been
observed to occur at the base of the advancing side of the pin (see Figure 4-8-e and Figure 4-9-
a,e and f) or anywhere along the advancing side of the shoulder (see Figure 4-9-d), the former
designated as a pin hole defect and the latter being referred to as a tunnel defect or surface void.
In general, the observation made has been higher IPM and RPM result in a higher chance of
forming a void defect. This can be combatted in some cases by applying a higher Z-force.
As seen in the tensile testing results, the existence of a void guarantees premature and
localized failure. It is, thus, imperative that there be complete consolidation of the SZ and HAZ
to prevent premature failure.
28
Figure 4-8: Micrographs of Z-Force Control Specimens: 2I-80R (a), 2I-150R (b), 4I-150R (c), 4I-250R (d), 6I-125R (e), and 6I-175R (f)
(a)
(b)
(c)
(d)
(e)
(f)

29
Figure 4-9: Micrographs of Z-Depth Control Specimens: 2I-80R (a), 2I-150R (b), 4I-150R (c), 4I-250R (d), 6I-125R (e), and 6I-175R (f)
(a)
(b)
(c)
(d)
(e)
(f)
30
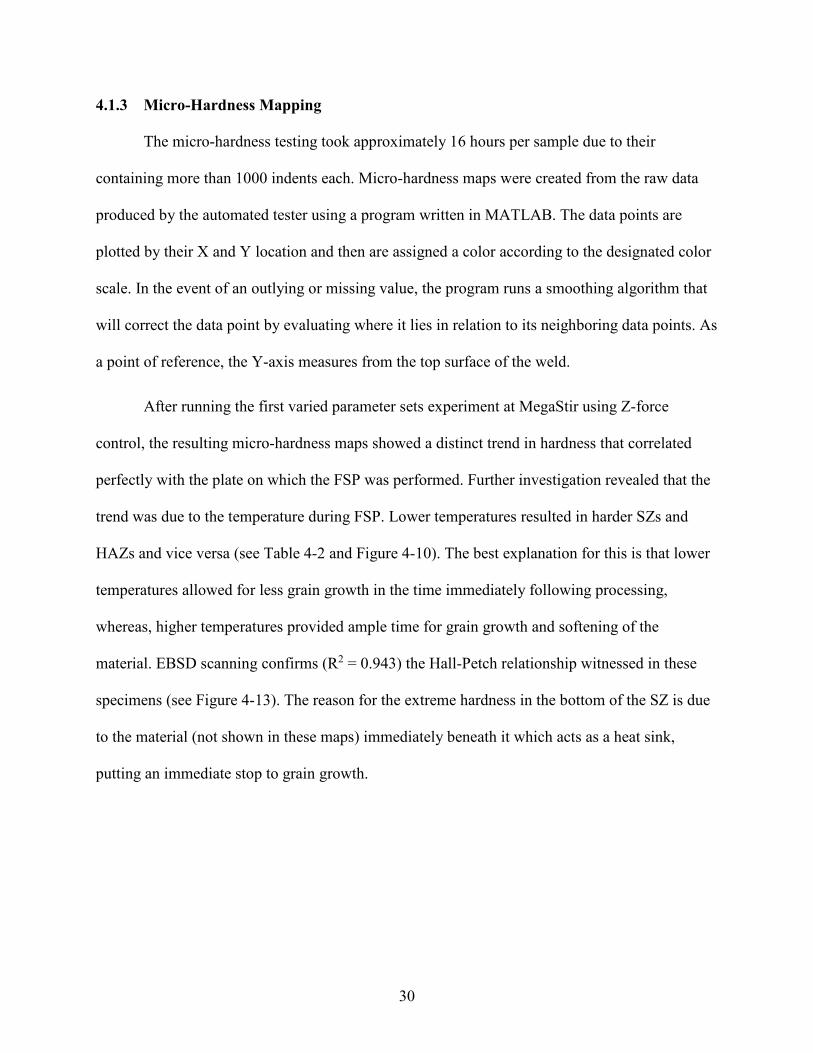
4.1.3 Micro-Hardness Mapping
The micro-hardness testing took approximately 16 hours per sample due to their
containing more than 1000 indents each. Micro-hardness maps were created from the raw data
produced by the automated tester using a program written in MATLAB. The data points are
plotted by their X and Y location and then are assigned a color according to the designated color
scale. In the event of an outlying or missing value, the program runs a smoothing algorithm that
will correct the data point by evaluating where it lies in relation to its neighboring data points. As
a point of reference, the Y-axis measures from the top surface of the weld.
After running the first varied parameter sets experiment at MegaStir using Z-force
control, the resulting micro-hardness maps showed a distinct trend in hardness that correlated
perfectly with the plate on which the FSP was performed. Further investigation revealed that the
trend was due to the temperature during FSP. Lower temperatures resulted in harder SZs and
HAZs and vice versa (see Table 4-2 and Figure 4-10). The best explanation for this is that lower
temperatures allowed for less grain growth in the time immediately following processing,
whereas, higher temperatures provided ample time for grain growth and softening of the
material. EBSD scanning confirms (R2 = 0.943) the Hall-Petch relationship witnessed in these
specimens (see Figure 4-13). The reason for the extreme hardness in the bottom of the SZ is due
to the material (not shown in these maps) immediately beneath it which acts as a heat sink,
putting an immediate stop to grain growth.
31
Figure 4-10: Micro-Hardness Results – Z-Force Control: 2I-80R (a), 2I-150R (b), 4I-150R (c), 4I-250R (d), 6I-125R (e), and 6I-175R (f)

32
Figure 4-11: Micro-Hardness Results – Z-Depth Control: 2I-80R (a), 2I-150R (b), 4I-150R (c), 4I-250R (d), 6I-125R (e), and 6I-175R (f)
33
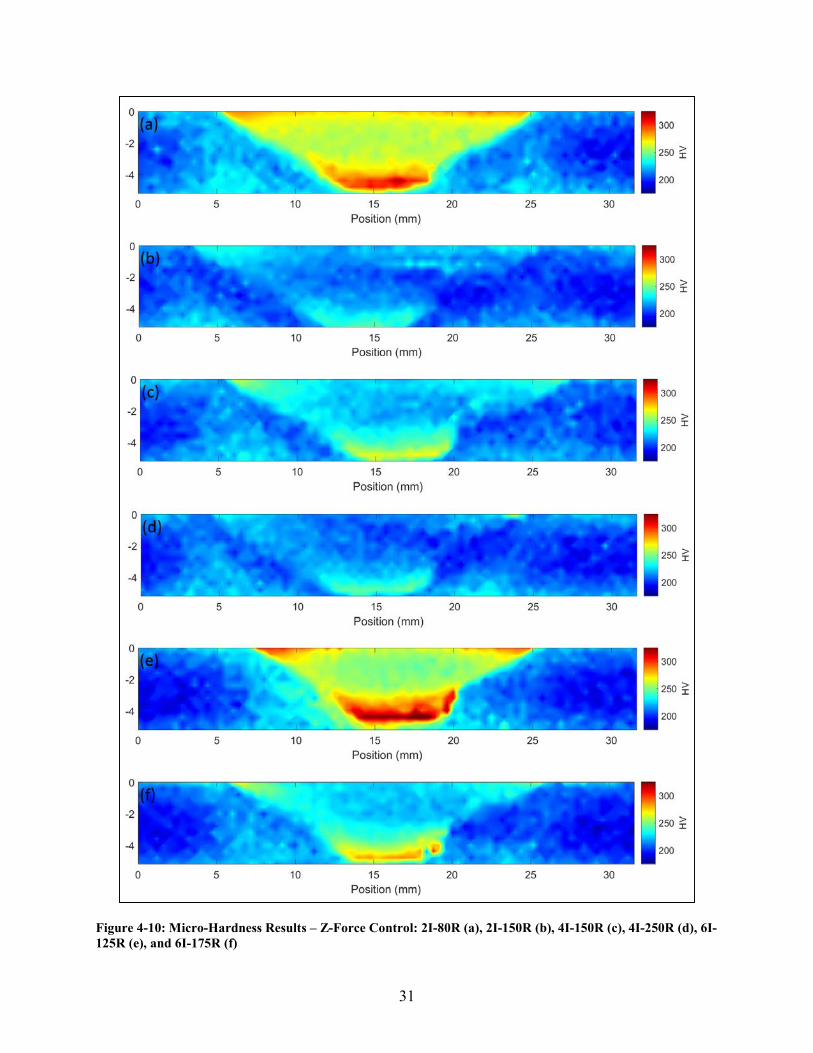
The average hardness values pulled from these hardness maps and seen in Table 4-2 and
Table 4-3 were obtained by evaluating the area of the SZ 2 mm (0.079”) below the surface (see
Figure 4-12). The width of the SZ was determined by evaluating where the hardness values made
a significant change from base material and HAZ to the harder SZ material. If the difference was
not very significant, micrographs of the samples were consulted.
Figure 4-12: Evaluated Area for SZ Hardness Averages
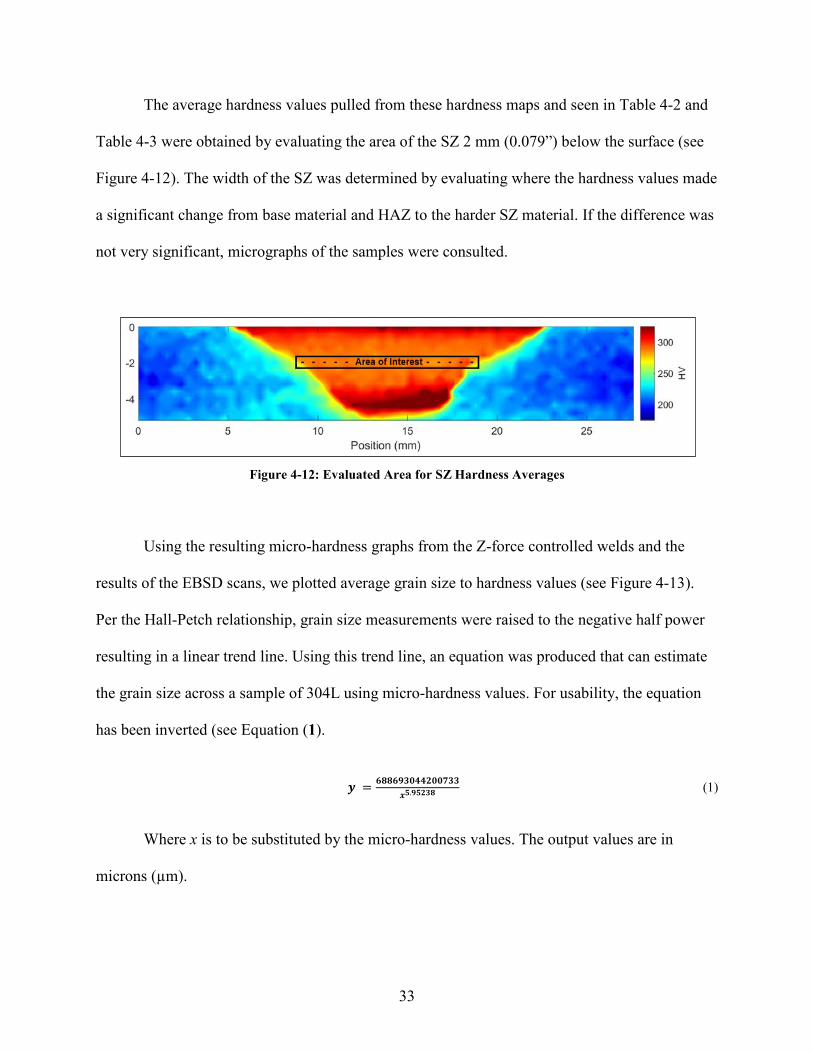
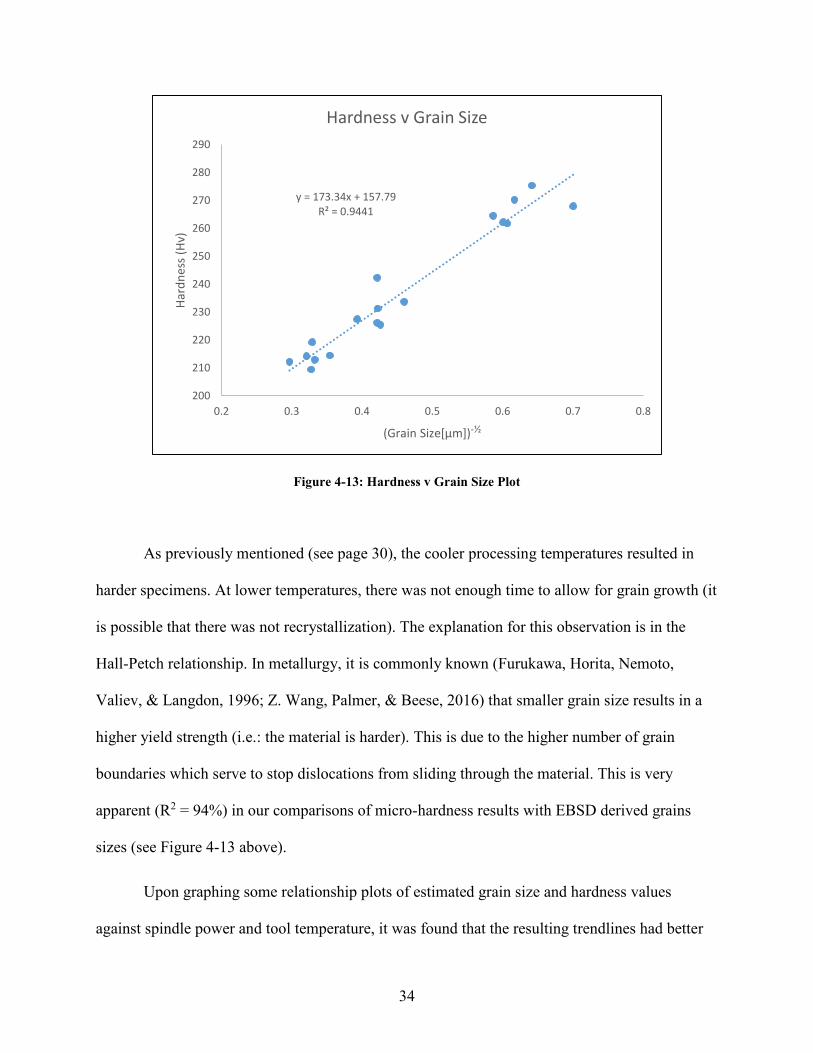
Using the resulting micro-hardness graphs from the Z-force controlled welds and the
results of the EBSD scans, we plotted average grain size to hardness values (see Figure 4-13).
Per the Hall-Petch relationship, grain size measurements were raised to the negative half power
resulting in a linear trend line. Using this trend line, an equation was produced that can estimate
the grain size across a sample of 304L using micro-hardness values. For usability, the equation
has been inverted (see Equation (1).
𝒚𝒚 = 𝟔𝟔𝟔𝟔𝟔𝟔𝟔𝟔𝟔𝟔𝟔𝟔𝟔𝟔𝟔𝟔𝟔𝟔𝟔𝟔𝟔𝟔𝟔𝟔𝟔𝟔𝟔𝟔𝟔𝟔
𝒙𝒙𝟓𝟓.𝟔𝟔𝟓𝟓𝟔𝟔𝟔𝟔𝟔𝟔 (1)
Where x is to be substituted by the micro-hardness values. The output values are in
microns (µm).
34
Figure 4-13: Hardness v Grain Size Plot
As previously mentioned (see page 30), the cooler processing temperatures resulted in
harder specimens. At lower temperatures, there was not enough time to allow for grain growth (it
is possible that there was not recrystallization). The explanation for this observation is in the
Hall-Petch relationship. In metallurgy, it is commonly known (Furukawa, Horita, Nemoto,
Valiev, & Langdon, 1996; Z. Wang, Palmer, & Beese, 2016) that smaller grain size results in a
higher yield strength (i.e.: the material is harder). This is due to the higher number of grain
boundaries which serve to stop dislocations from sliding through the material. This is very
apparent (R2 = 94%) in our comparisons of micro-hardness results with EBSD derived grains
sizes (see Figure 4-13 above).
Upon graphing some relationship plots of estimated grain size and hardness values
against spindle power and tool temperature, it was found that the resulting trendlines had better
y = 173.34x + 157.79R² = 0.9441
200
210
220
230
240
250
260
270
280
290
0.2 0.3 0.4 0.5 0.6 0.7 0.8
Hard
ness
(Hv)
(Grain Size[µm])-½
Hardness v Grain Size
35
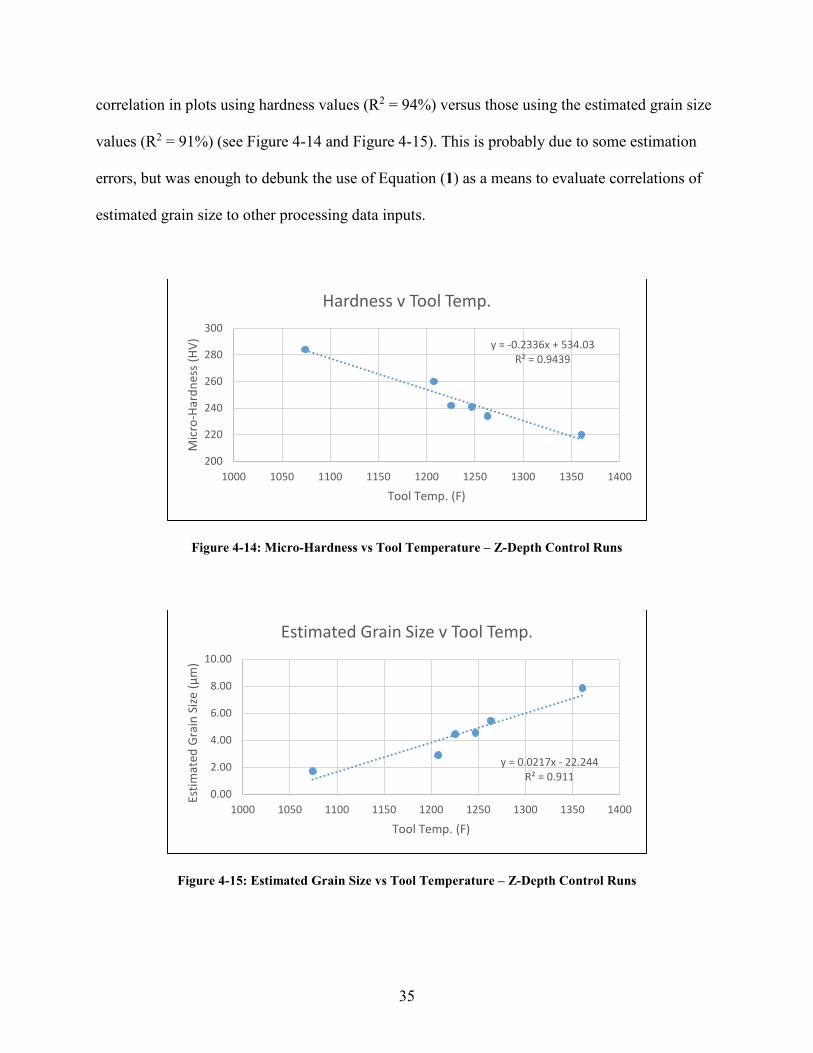
correlation in plots using hardness values (R2 = 94%) versus those using the estimated grain size
values (R2 = 91%) (see Figure 4-14 and Figure 4-15). This is probably due to some estimation
errors, but was enough to debunk the use of Equation (1) as a means to evaluate correlations of
estimated grain size to other processing data inputs.
Figure 4-14: Micro-Hardness vs Tool Temperature – Z-Depth Control Runs
Figure 4-15: Estimated Grain Size vs Tool Temperature – Z-Depth Control Runs
y = -0.2336x + 534.03R² = 0.9439
200
220
240
260
280
300
1000 1050 1100 1150 1200 1250 1300 1350 1400
Mic
ro-H
ardn
ess
(HV)
Tool Temp. (F)
Hardness v Tool Temp.
y = 0.0217x - 22.244R² = 0.911
0.00
2.00
4.00
6.00
8.00
10.00
1000 1050 1100 1150 1200 1250 1300 1350 1400
Estim
ated
Gra
in S
ize (μ
m)
Tool Temp. (F)
Estimated Grain Size v Tool Temp.
36
4.2 H1: Simulated Crack Healing
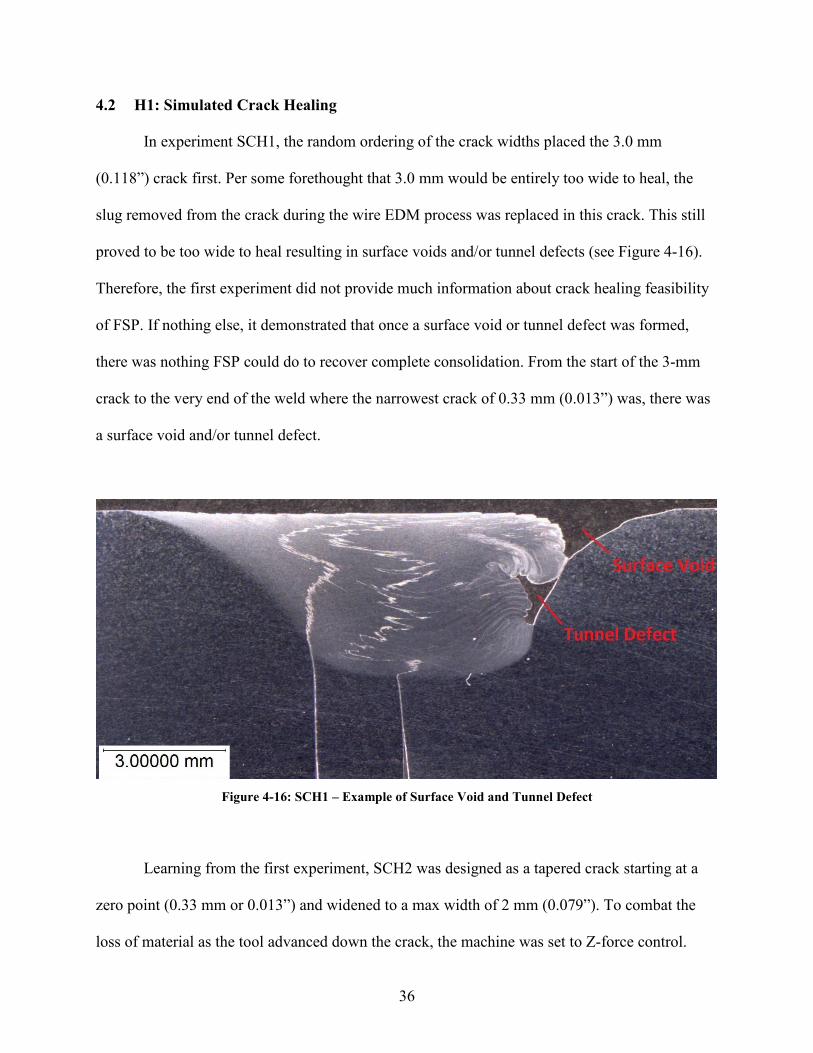
In experiment SCH1, the random ordering of the crack widths placed the 3.0 mm
(0.118”) crack first. Per some forethought that 3.0 mm would be entirely too wide to heal, the
slug removed from the crack during the wire EDM process was replaced in this crack. This still
proved to be too wide to heal resulting in surface voids and/or tunnel defects (see Figure 4-16).
Therefore, the first experiment did not provide much information about crack healing feasibility
of FSP. If nothing else, it demonstrated that once a surface void or tunnel defect was formed,
there was nothing FSP could do to recover complete consolidation. From the start of the 3-mm
crack to the very end of the weld where the narrowest crack of 0.33 mm (0.013”) was, there was
a surface void and/or tunnel defect.
Figure 4-16: SCH1 – Example of Surface Void and Tunnel Defect
Learning from the first experiment, SCH2 was designed as a tapered crack starting at a
zero point (0.33 mm or 0.013”) and widened to a max width of 2 mm (0.079”). To combat the
loss of material as the tool advanced down the crack, the machine was set to Z-force control.
37
This way, the tool would appropriately change its depth as the crack widened. There was,
however, a safety built in that kept the welder from plunging past a nominal 0.5 inches from its
starting depth. Just before the end of the weld, the Z-depth limit was reached and a resulting loss
of Z-force began to show (dropped below 13,000 lb. force or 58,000 N). Because of this, the last
couple inches of the crack begin to show signs of surface voids. Microscopy further revealed a
very small tunnel defect in the final sample evaluated (see Figure 4-17-d).
The Z-force was also being modified during processing to maintain a tool temperature
between 800 and 880°C (1470 and 1616°F). This was done to keep the tool shoulder engaged at
approximately 80% (evaluated by observing the resulting SZ surface behind the tool). If the
temperature was too elevated, the material beneath the tool was softer and the tool would plunge
further than desired. The opposite would occur if the tool temperature was too low – not enough
of the tool would be engaged to be approximately 80% of the shoulder. Hence, throughout the
weld, the resulting Z-force ranges from 13,000 to 15,000 lb. force (58,000 to 66,700N).
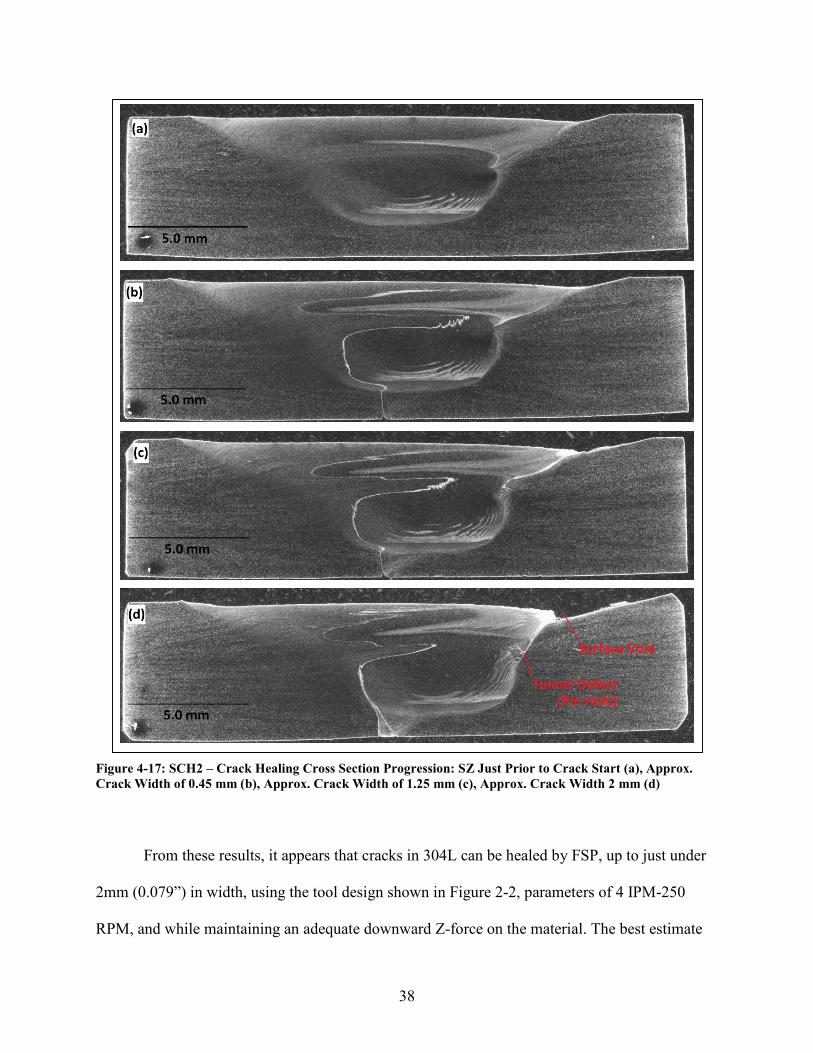
Figure 4-17 show a sequence of cross-sections of the healed crack. The oxide layer at the
joint interface is clearly seen in each cross-section (after the first which fell before the crack
began). The stir zone shows adequate healing of the crack until the very end when the Z-force
dropped from the specified 13,000 lbf. to 12,000 lbf. (53,300N) and the amount of material
available was inadequate to fill the crack or resulting surface void.
38
Figure 4-17: SCH2 – Crack Healing Cross Section Progression: SZ Just Prior to Crack Start (a), Approx. Crack Width of 0.45 mm (b), Approx. Crack Width of 1.25 mm (c), Approx. Crack Width 2 mm (d)
From these results, it appears that cracks in 304L can be healed by FSP, up to just under
2mm (0.079”) in width, using the tool design shown in Figure 2-2, parameters of 4 IPM-250
RPM, and while maintaining an adequate downward Z-force on the material. The best estimate
39
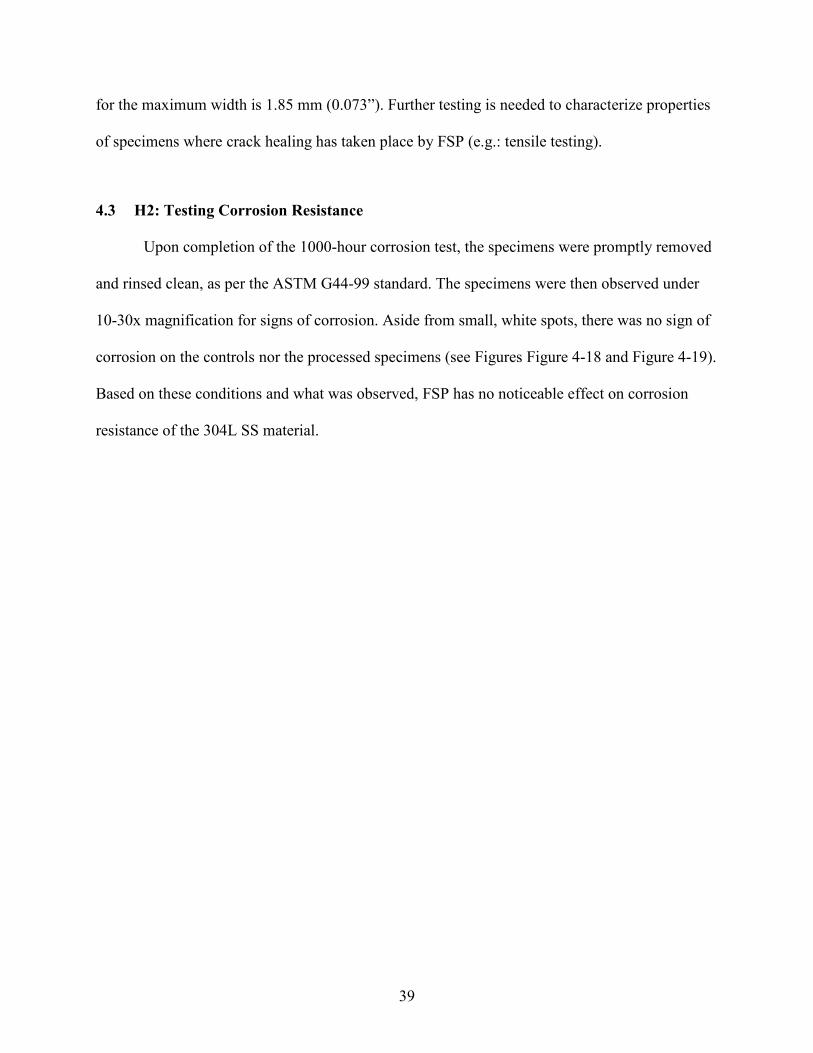
for the maximum width is 1.85 mm (0.073”). Further testing is needed to characterize properties
of specimens where crack healing has taken place by FSP (e.g.: tensile testing).
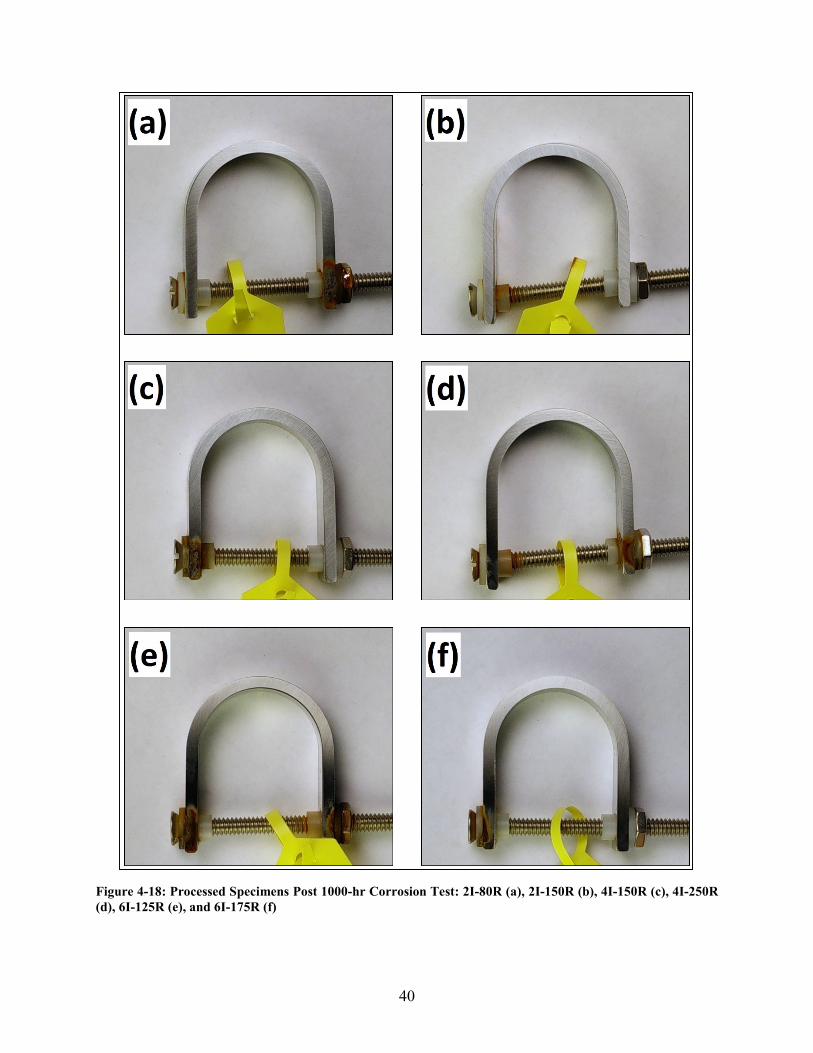
4.3 H2: Testing Corrosion Resistance
Upon completion of the 1000-hour corrosion test, the specimens were promptly removed
and rinsed clean, as per the ASTM G44-99 standard. The specimens were then observed under
10-30x magnification for signs of corrosion. Aside from small, white spots, there was no sign of
corrosion on the controls nor the processed specimens (see Figures Figure 4-18 and Figure 4-19).
Based on these conditions and what was observed, FSP has no noticeable effect on corrosion
resistance of the 304L SS material.
40
Figure 4-18: Processed Specimens Post 1000-hr Corrosion Test: 2I-80R (a), 2I-150R (b), 4I-150R (c), 4I-250R (d), 6I-125R (e), and 6I-175R (f)
41
Figure 4-19: Unprocessed Specimens Post 1000-hr Corrosion Test: Strained (a) and Unstrained (b)

42
5 CONCLUSIONS AND RECOMMENDATIONS
5.1 H1: Simulated Crack Healing
Experiment SCH1 used a DOE-style random ordering to determine the placement of 7
simulated cracks of distinct widths, the widest of which was placed at the beginning. This width
immediately proved to be too much for FSP to completely heal. It was also observed that FSP
was unable to regain consolidation after a void of any kind was present in the weld. This was
made apparent in this experiment when, from the time the tool passed over a crack too wide to
heal, it never did fully consolidate the weld again. Thus, to successfully heal a crack, there needs
to be adequate material from the beginning of the crack repair. Beginning with a crack or other
material deficit will result in a failure to obtain complete consolidation of the welded material.
Further investigation (including using different parameter sets) is recommended.
Experiment SCH2 healed a tapered crack that started at a zero point and widened to 2
mm (0.079”). It demonstrated that FSP is very capable of maintaining consolidation if the crack
width is very small from the start and if adequate material is available and Z-force is maintained
throughout the length of the weld. It also demonstrated that, given adequate material from the
start as in the example of the tapered crack experiment, FSP is capable of healing a crack up to
approximately 1.85mm (0.073”) in width. Further investigation could consider the addition of
filler material in large gaps and other welding parameters. It may also be beneficial to determine
the exact Z-force required for any given parameter set to obtain and maintain full consolidation.
43
Future experiments should also test crack placement in terms of SZ location and various
angles and geometries of simulated cracks.
5.2 H2: Testing Corrosion Resistance
Alternate immersion corrosion testing was performed on both processed and unprocessed
specimens for 1000 hours at room temperature. The resulting examination and micrographs of
the specimens showed no apparent difference in the amount of corrosion between processed
material and base material, strained or unstrained. Thus, FSP has no apparent effect on the
corrosion resistance of 304L SS. Further testing should include elevated solution temperature
and perhaps longer test periods.
5.3 Processing Parameters Validation
A series of preliminary welds were run at various feeds and speeds. Data was gathered
and a chart was made correlating tool temperature to spindle power. From the data produced by
these preliminary welds, high, medium, and low power inputs were identified and six parameter
sets were chosen for parameter testing and validation: 2 IPM-80 RPM, 2 IPM-150 RPM, 4 IPM-
150 RPM, 6 IPM-125 RPM, and 6 IPM-175 RPM.
To save on material and tool wear, the six parameter sets being tested were split into pairs
and run on three different plates. These welds were run at MegaStir using the selected feeds and
speeds and Z-force as machine controls.
Though there’s no clear proof of this adversely affecting the data gathered, it would be
wise to perform each parameter set on its own plate. It is equally important to standardize the
start sequence of the welds so that those variables are minimized.

44
The second set of plates were run at BYU and used Z-depth as machine control. This was
done to better validate a parallel simulation effort which also ran at a constant Z-depth. Each
parameter set was also run on its own plate and with a standardized start sequence to eliminate
any potential interactions that could have been present on the first set of welds.
Based on the data gathered in during this research, it can be concluded that low rotational
speed and low feed rates yield better-than-base-material properties assuming complete weld
consolidation. As a positive byproduct, these parameters also put less wear on FSP tooling which
can result in longer tool life.
Analysis also showed a stronger correlation between hardness and tool temperature than
hardness and spindle power. Based on the results of this study, monitoring tool temperature
during FSP is a better predictor of processed material properties than monitoring spindle power.
Though the second set of welds were more easily controlled, performing FSP based on Z-
force control could yield better weld properties (especially in the case of crack healing). Further
testing should look to standardize a weld sequence that can make use of Z-force as a machine
control. This is not as simple as it seems since the required Z-force to maintain a consistent bead
width that indicates about 80% of the tool shoulder’s engagement is variable based on the current
temperature of the weld. Since each parameter set yielded a different steady state temperature,
this prevents the use of a standardized weld sequence.
5.3.1 Tensile Testing
Three specimens were cut from a steady state section of each parameter set-processed
plate to be used as dogbones. They were pulled and their UTSs were compared against those of
the base material. The location of the break was also recorded. Breaks that happened lower than
45
the base material UTS typically occurred in the SZ and because of a void in the material. Internal
voids prove to be more catastrophic to the overall strength of the weld than any other factor.
Future testing should make use of a milling fixture and a CNC mill for the dogbone
preparation. This drastically speeds up the process and ensures more dimensionally accurate
tensile specimens. It would also be interesting to explore what affect the additional base material
beneath the SZ would have (if any) to the overall performance of each tensile specimen since any
additional base material in our testing was milled off prior to pulling.
Future work could also investigate why most samples broke on the AS of the bead
seemingly just outside of the HAZ. It begs the questions, “why and how has base material been
affected outside the HAZ? What softening mechanism is at play?”
5.3.2 Microscopy
Microscope samples were prepared for microscopy using an oxalic acid electro-chemical
etch that could reveal grain boundaries and SZ and HAZ geometry. Microscopy revealed internal
voids, pin holes, and tunnel defects which each serve to severely weaken the overall weld
strength. In general, it was observed that higher IPM and RPM values resulted in internal void
defects.
5.3.3 Micro-Hardness Mapping
Micro-hardness testing was done to provide a valid estimation for grain size per the Hall-
Petch relationship. Using data gathered by it along with EBSD scanning, an equation was
derived that can allow for the prediction of grain size using hardness values or a micro-hardness
map. Analysis of the micro-hardness maps also gave insight to the hardening mechanism of
46
304L SS. It revealed where temperatures remained low enough to prevent grain growth and
subsequent softening.
It is recommended that some tweaking of control parameters be explored for the higher
RPM values since, in the case of 4 IPM-250 RPM, micro hardness testing resulted in SZ values
matching closely those of the base material. It is anticipated that, without the presence of void
defects, this parameter set would yield the best performance of any tested in this study.

47
REFERENCES
Ahn, B. W., Choi, D. H., Kim, D. J., & Jung, S. B. (2012). Microstructures and properties of
friction stir welded 409L stainless steel using a Si 3N 4 tool. Materials Science and Engineering A, 532, 476–479. http://doi.org/10.1016/j.msea.2011.10.109
Apelian, D. (2011). Friction Stir Processing of Aluminum Cast Alloys for High Performance Applications. JOM, (November).
Asano, K., Nishimura, S., Saito, Y., Sakamoto, H., Yamada, Y., Kato, T., & Hashimoto, T. (1999). Weldability of neutron irradiated austenitic stainless steels. Journal of Nuclear Materials, 264(1–2), 1–9. http://doi.org/10.1016/S0022-3115(98)00491-7
ASM International. (2000). Introduction to Stainless. Alloy Digest Sourcebook: Stainless Steels, 1.
ASM International. (2008). Austenitic Stainless Steels. Stainless Steels for Design Engineers, 69–78. http://doi.org/http://dx.doi.org/10.1016/B0-08-043152-6/00081-4
ASTM International. (2016a). Standard Practice for Exposure of Metals and Alloys by Alternate Immersion in Neutral 3.5 % Sodium Chloride Solution. ASTM Standards, 11(Reapproved 2013), 5–8. http://doi.org/10.1520/G0044-99R13.Copyright
ASTM International. (2016b). Standard Practice for Making and Using U-Bend Stress-Corrosion Test, 3(Reapproved), 1–7. http://doi.org/10.1520/G0030-97R09.2
ASTM International. (2016c). Standard Test Methods for Tension Testing of Metallic Materials 1, 1–29. http://doi.org/10.1520/E0008
Feng, X., Liu, H., & Suresh Babu, S. (2011). Effect of grain size refinement and precipitation reactions on strengthening in friction stir processed Al-Cu alloys. Scripta Materialia, 65(12), 1057–1060. http://doi.org/10.1016/j.scriptamat.2011.09.009
Furukawa, M., Horita, Z., Nemoto, M., Valiev, R. Z., & Langdon, T. G. (1996). Microhardness measurements and the hall-petch relationship in an Al-Mg alloy with submicrometer grain size. Acta Materialia, 44(11), 4619–4629. http://doi.org/10.1016/1359-6454(96)00105-X
Kanne, W. R., Lohmeier, D. A., Dunn, K. A., & Tosten, M. H. (1993). Metallographic analysis of helium-embrittlement cracking of repair welds in nuclear reactor tanks. Materials Characterization, 30(1), 23–34. http://doi.org/10.1016/1044-5803(93)90005-G
Kanne, W. R., Louthan, M. R., Rankin, D. T., & Tosten, M. H. (1999). Weld repair of irradiated materials. Materials Characterization, 43(2), 203–214. http://doi.org/10.1016/S1044-5803(99)00032-7

48
Karami, S., Jafarian, H., Eivani, A. R., & Kheirandish, S. (2016). Engineering tensile properties by controlling welding parameters and microstructure in a mild steel processed by friction stir welding. Materials Science and Engineering A, 670, 68–74. http://doi.org/10.1016/j.msea.2016.06.008
Li, S., Grossbeck, M. L., Zhang, Z., Shen, W., & Chin, B. A. (2011). The Effect of Helium on Welding Irradiated Materials. Welding Journal, (January), 19–27.
Liu, F. C., & Ma, Z. Y. (2010). Contribution of grain boundary sliding in low-temperature superplasticity of ultrafine-grained aluminum alloys. Scripta Materialia, 62(3), 125–128. http://doi.org/10.1016/j.scriptamat.2009.10.010
Liu, F. C., & Nelson, T. W. (2016). In-situ material flow pattern around probe during friction stir welding of austenitic stainless steel. Materials & Design, 110, 354–364. http://doi.org/10.1016/j.matdes.2016.07.147
Lu, B.-T., Chen, Z.-K., Luo, J.-L., Patchett, B. M., & Xu, Z.-H. (2003). Stress corrosion crack initiation and propagation in longitudinally welded 304 austenitic stainless steel. Corrosion Engineering, Science and Technology, 38(1), 69–75. http://doi.org/10.1179/147842203225001478
Mishra, R. S., & Ma, Z. Y. (2005). Friction stir welding and processing. Materials Science and Engineering R: Reports, 50(1–2), 1–78. http://doi.org/10.1016/j.mser.2005.07.001
Park, S. H. C., Sato, Y. S., Kokawa, H., Okamoto, K., Hirano, S., & Inagaki, M. (2003). Rapid formation of the sigma phase in 304 stainless steel during friction stir welding. Scripta Materialia, 49(12), 1175–1180. http://doi.org/10.1016/j.scriptamat.2003.08.022
Park, S. H. C., Sato, Y. S., Kokawa, H., Okamoto, K., Hirano, S., & Inagaki, M. (2005). Microstructural characterisation of stir zone containing residual ferrite in friction stir welded 304 austenitic stainless steel. Science and Technology of Welding and Joining, 10(5), 550–556. http://doi.org/10.1179/174329305X46691
Reilly, A., Shercliff, H., Chen, Y., & Prangnell, P. (2015). Modelling and visualisation of material flow in friction stir spot welding. Journal of Materials Processing Technology, 225, 473–484. http://doi.org/10.1016/j.jmatprotec.2015.06.021
Sterling, C. J. (2004). Effects of Friction Stir Processing on the Microstructure and Mechanical Properties of Fusion Welded 304L Stainless Steel. Research Report.
Tsai, F. Y., & Kao, P. W. (2012). Improvement of mechanical properties of a cast Al-Si base alloy by friction stir processing. Materials Letters, 80, 40–42. http://doi.org/10.1016/j.matlet.2012.04.073
Tsuchiya, K., Kawamura, H., & Kalinin, G. (2000). Re-weldability tests of irradiated austenitic stainless steel by a TIG welding method. Journal of Nuclear Materials, 283–287, 1210–1214. http://doi.org/10.1016/S0022-3115(00)00153-7
Wang, C. A., Grossbeck, M. L., Aglan, H., & Chin, B. A. (1996). The effect of an applied stress on the welding of irradiated steels. Journal of Nuclear Materials, 239(1–3), 85–89. http://doi.org/10.1016/S0022-3115(96)00490-4

49
Wang, C. A., Grossbeck, M. L., Potluri, N. B., & Chin, B. A. (1996). Welding of irradiated stainless steel. Journal of Nuclear Materials, 233–237(PART 1), 213–217. http://doi.org/10.1016/S0022-3115(96)00203-6
Wang, Z., Palmer, T. A., & Beese, A. M. (2016). Effect of processing parameters on microstructure and tensile properties of austenitic stainless steel 304L made by directed energy deposition additive manufacturing. Acta Materialia, 110, 226–235. http://doi.org/10.1016/j.actamat.2016.03.019
Yamada, H., Kawamura, H., Tsuchiya, K., Kalinin, G., Kohno, W., & Morishima, Y. (2002). Re-weldability tests of irradiated 316L ( N ) stainless steel using laser welding technique. Journal of Nuclear Materials, 311, 1584–1589.
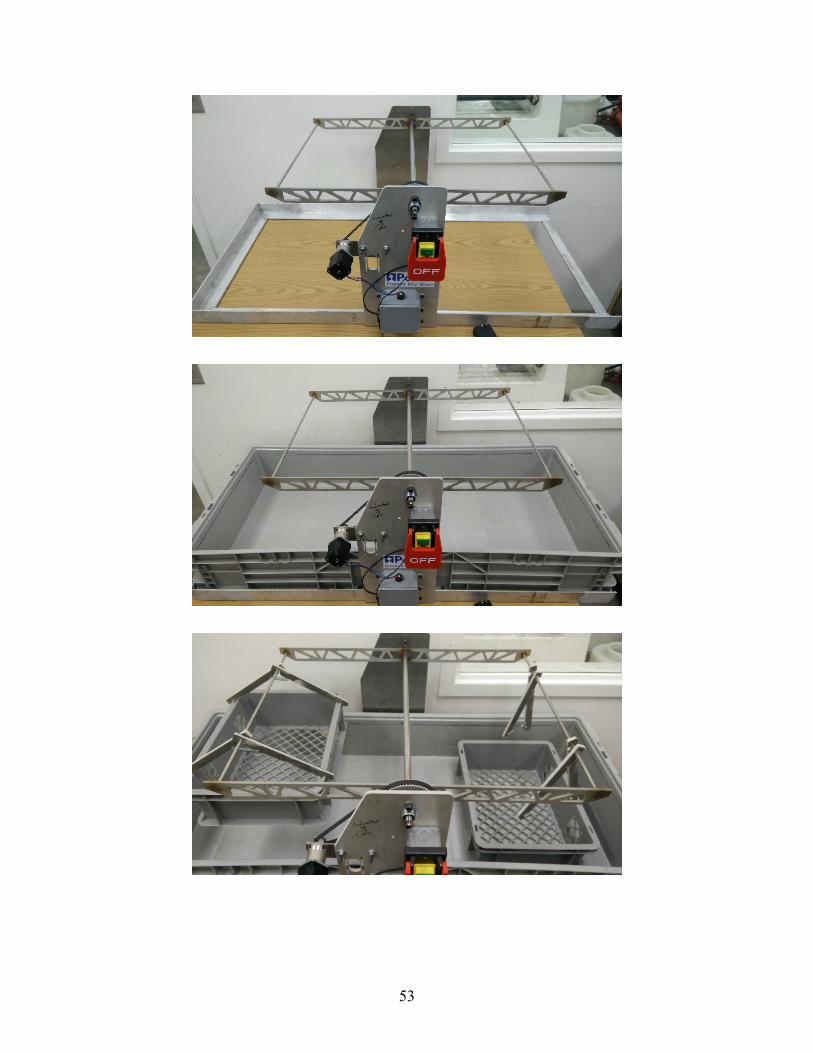
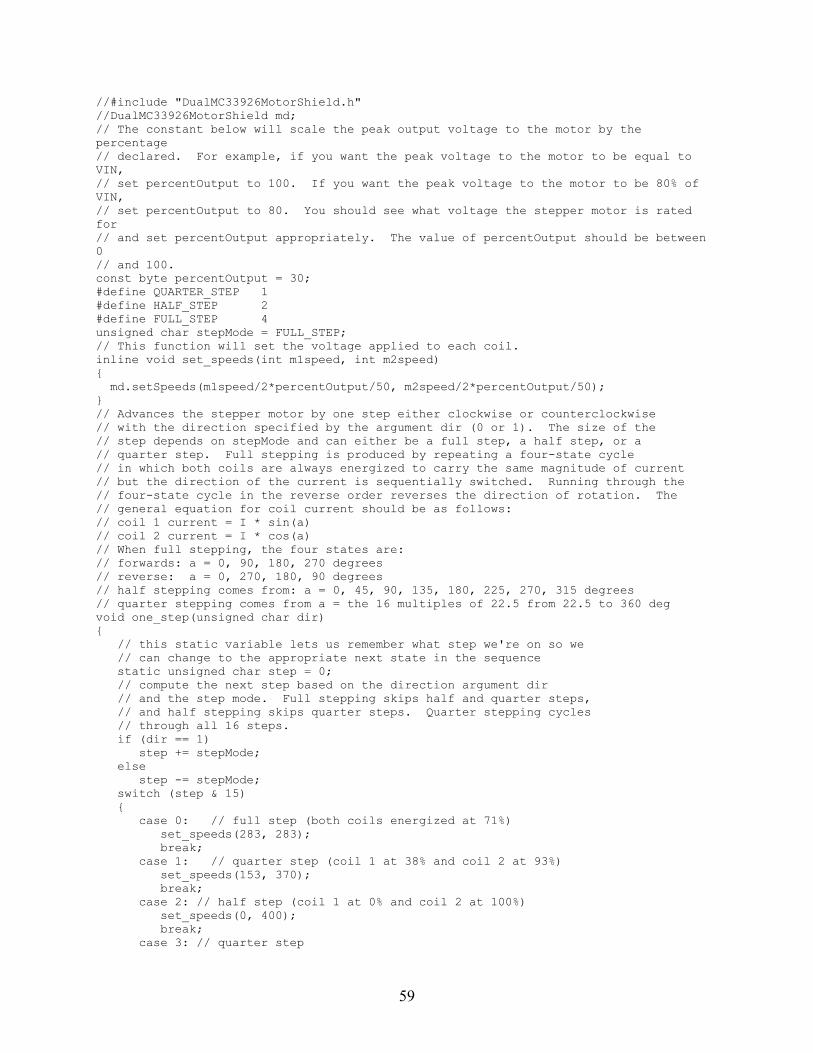
50
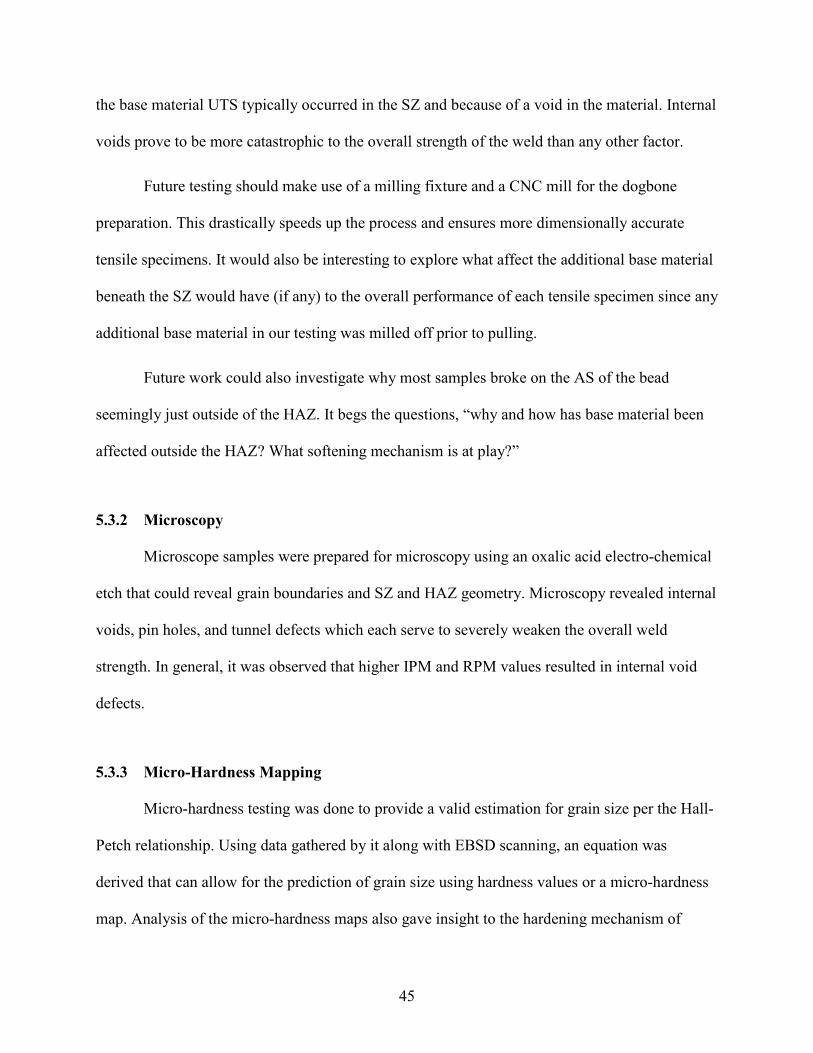
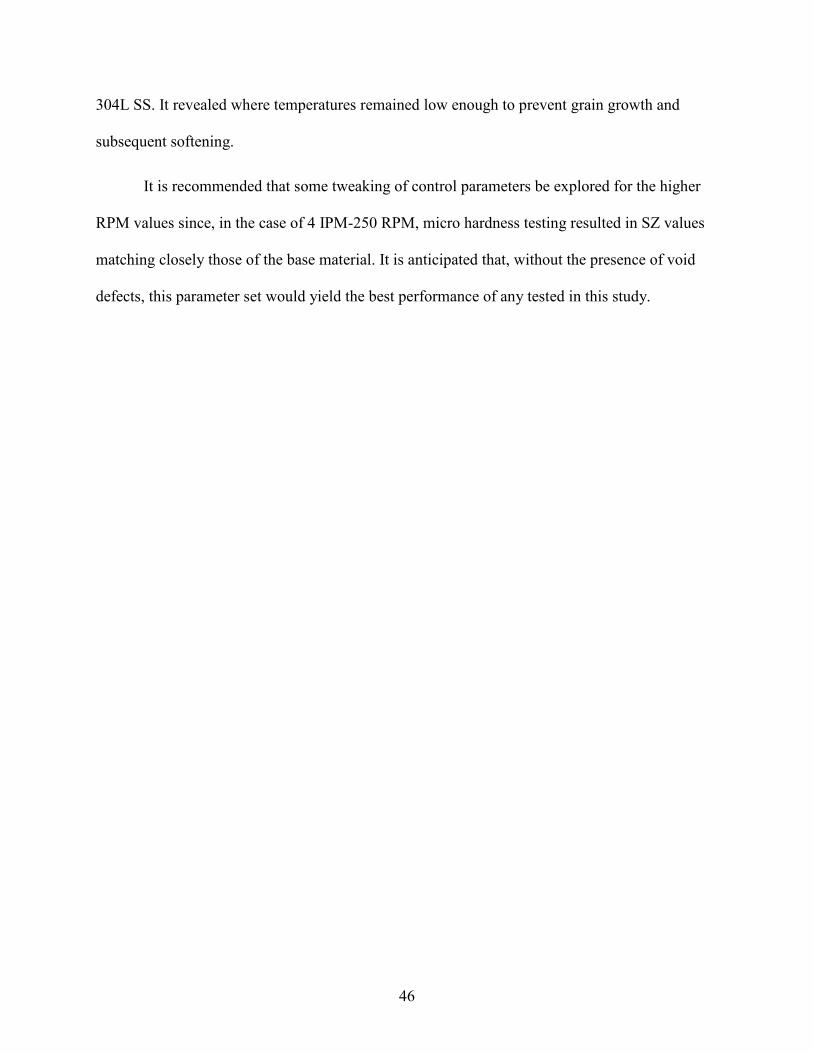
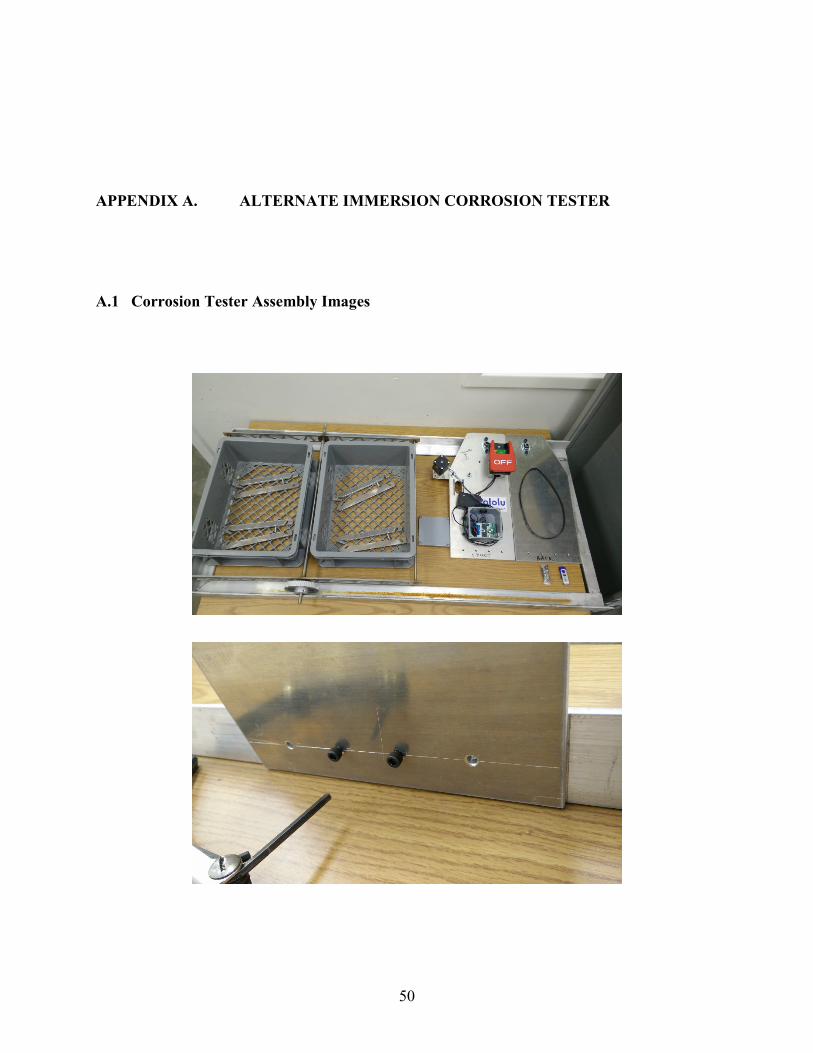
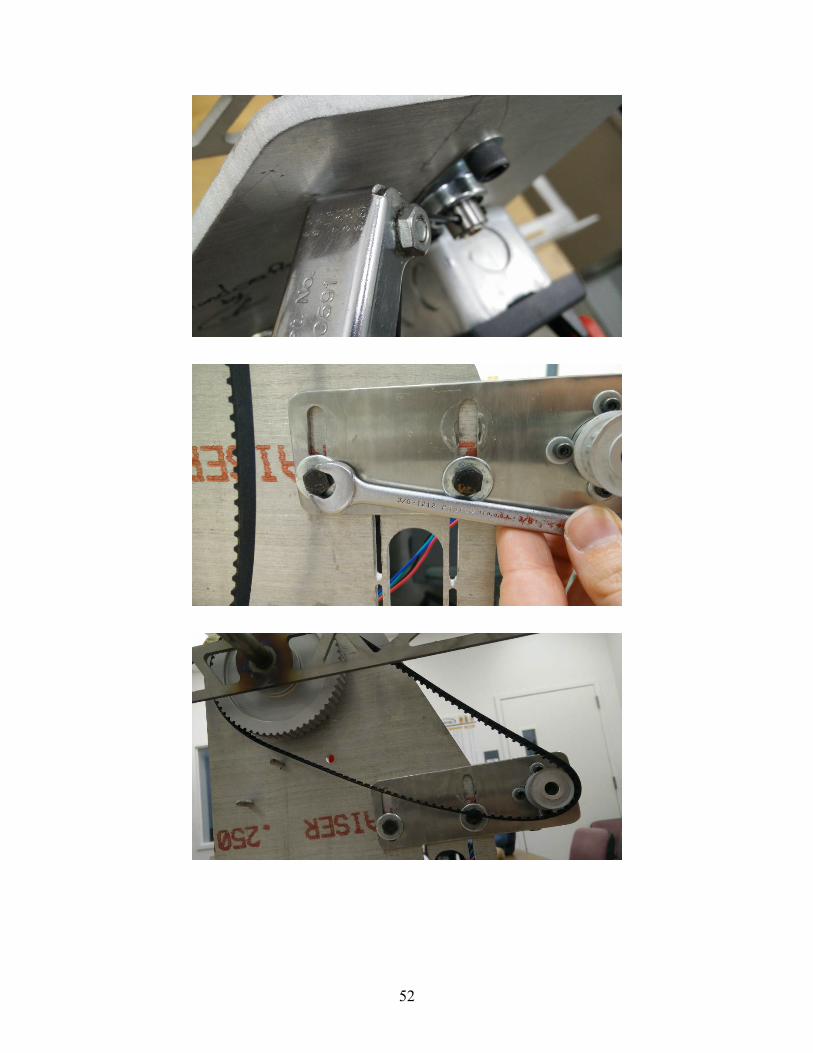
APPENDIX A. ALTERNATE IMMERSION CORROSION TESTER
A.1 Corrosion Tester Assembly Images

51
52
53

54
A.1.1 Assembly and Operation Checklist:
• All screws tightened down (side panels, bearings & water-resistant box)
• Tighten belt by pulling down on motor mount bracket before tightening bolts and
nuts on the bracket
• Arms MUST BE HORIZONTAL AT THE BEGINNING OF OPERATION!
• Center baskets and ensure that mounting arms are well set
• Balance loads in the baskets
• Plug in and ensure power supply will not be interrupted during operation period
o Note: Power switch has magnetic latch that will release in the event of an
interruption in power.
• Check on tester at a minimum 2-3 times per week of operation
• Replace water lost to evaporation (about 1 gallon/day, depending on air
circulation)

55
o Note: Consider potential consequences to raising the relative humidity in
the room where the tester resides
• Replace solution every 7-10 days to keep it fresh and effective
A.2 Arduino Code (can be found in digital format in machine)
The tester is currently hard-programmed to operate in the following sequence:
1. Lower right basket
2. Rest 10 minutes
3. Raise right basket
4. Rest 20 minutes
5. Lower left basket
6. Rest 10 minutes
7. Raise left basket
8. Rest 20 minutes
This takes about one hour for each complete cycle then repeats indefinitely (until power
is interrupted/STOP button pressed). Unless you program it to do otherwise, at the end of your
experiment, it is on you to stop the machine at the right time. The source code is found on the
flash drive stored in the water-resistant box on the front side panel. In the even that that flash
drive is ever missing, the code is also copied below. Libraries necessary in the Arduino
programming space are also included below.

56
Arduino Code
File Name: VNH5019_corrosion_tester.ino
#include "DualVNH5019MotorShield.h" DualVNH5019MotorShield md; // If you want to use the MC33926 Dual Motor Shield instead, comment out the two lines // above and uncomment the two lines below. //#include "DualMC33926MotorShield.h" //DualMC33926MotorShield md; // The constant below will scale the peak output voltage to the motor by the percentage // declared. For example, if you want the peak voltage to the motor to be equal to VIN, // set percentOutput to 100. If you want the peak voltage to the motor to be 80% of VIN, // set percentOutput to 80. You should see what voltage the stepper motor is rated for // and set percentOutput appropriately. The value of percentOutput should be between 0 // and 100. const byte percentOutput = 30; #define QUARTER_STEP 1 #define HALF_STEP 2 #define FULL_STEP 4 unsigned char stepMode = FULL_STEP; // This function will set the voltage applied to each coil. inline void set_speeds(int m1speed, int m2speed) { md.setSpeeds(m1speed/2*percentOutput/50, m2speed/2*percentOutput/50); } // Advances the stepper motor by one step either clockwise or counterclockwise // with the direction specified by the argument dir (0 or 1). The size of the // step depends on stepMode and can either be a full step, a half step, or a // quarter step. Full stepping is produced by repeating a four-state cycle // in which both coils are always energized to carry the same magnitude of current // but the direction of the current is sequentially switched. Running through the // four-state cycle in the reverse order reverses the direction of rotation. The // general equation for coil current should be as follows: // coil 1 current = I * sin(a) // coil 2 current = I * cos(a) // When full stepping, the four states are: // forwards: a = 0, 90, 180, 270 degrees // reverse: a = 0, 270, 180, 90 degrees // half stepping comes from: a = 0, 45, 90, 135, 180, 225, 270, 315 degrees // quarter stepping comes from a = the 16 multiples of 22.5 from 22.5 to 360 deg void one_step(unsigned char dir) { // this static variable lets us remember what step we're on so we // can change to the appropriate next state in the sequence static unsigned char step = 0; // compute the next step based on the direction argument dir // and the step mode. Full stepping skips half and quarter steps, // and half stepping skips quarter steps. Quarter stepping cycles // through all 16 steps. if (dir == 1) step += stepMode; else step -= stepMode; switch (step & 15)

57
{ case 0: // full step (both coils energized at 71%) set_speeds(283, 283); break; case 1: // quarter step (coil 1 at 38% and coil 2 at 93%) set_speeds(153, 370); break; case 2: // half step (coil 1 at 0% and coil 2 at 100%) set_speeds(0, 400); break; case 3: // quarter step set_speeds(-153, 370); break; case 4: // full step set_speeds(-283, 283); break; case 5: // quarter step set_speeds(-370, 153); break; case 6: // half step set_speeds(-400, 0); break; case 7: // quarter step set_speeds(-370, -153); break; case 8: // full step set_speeds(-283, -283); break; case 9: // quarter step set_speeds(-153, -370); break; case 10: // half step set_speeds(0, -400); break; case 11: // quarter step set_speeds(153, -370); break; case 12: // full step set_speeds(283, -283); break; case 13: // quarter step set_speeds(370, -153); break; case 14: // half step set_speeds(400, 0); break; case 15: // quarter step set_speeds(370, 153); break; } } // This is a blocking function that repeatedly takes a single step and then // delays for step_delay_us microseconds. When it finishes, the stepper motor // coils will continued to be energized according to the final step so that // the stepper motor maintains its position and holding torque. void multi_step(int steps, unsigned int step_delay_us) { unsigned char dir = 1; if (steps < 0) { dir = 0; steps = -steps; }

58
while (steps--) { one_step(dir); delayMicroseconds(step_delay_us); } } void setup() { md.init(); } void loop() { // 5370.2479 is the steps to turn the high-torque motor one revolution const int totalRevolution = (5370*.87)/2; // This is the perfect revolutions. DON'T CHANGE! const int Speed = 2600; const float soak_time = 10.0*60.0*1000.0; // 10 minutes. Must use float type. const float dry_time = soak_time*2.0; // Center to right side multi_step(-totalRevolution,Speed); delay(soak_time); // Right side to center multi_step(totalRevolution,Speed); delay(dry_time); // Center to left side multi_step(totalRevolution,Speed); delay(soak_time); // Left side to center multi_step(-totalRevolution,Speed); delay(dry_time); /* Stock code (not useful) if (stepMode == FULL_STEP) stepMode = QUARTER_STEP; else stepMode = FULL_STEP; multi_step(4, 5000000000); delayMicroseconds(500000000); for (byte i = 0; i < 4; i++) { multi_step(4, 5000000000); delayMicroseconds(5000000000); }//*/ }
Libraries
File Name: DuelVNH5019MotorShield.cpp
#include "DualVNH5019MotorShield.h" DualVNH5019MotorShield md; // If you want to use the MC33926 Dual Motor Shield instead, comment out the two lines // above and uncomment the two lines below.
59
//#include "DualMC33926MotorShield.h" //DualMC33926MotorShield md; // The constant below will scale the peak output voltage to the motor by the percentage // declared. For example, if you want the peak voltage to the motor to be equal to VIN, // set percentOutput to 100. If you want the peak voltage to the motor to be 80% of VIN, // set percentOutput to 80. You should see what voltage the stepper motor is rated for // and set percentOutput appropriately. The value of percentOutput should be between 0 // and 100. const byte percentOutput = 30; #define QUARTER_STEP 1 #define HALF_STEP 2 #define FULL_STEP 4 unsigned char stepMode = FULL_STEP; // This function will set the voltage applied to each coil. inline void set_speeds(int m1speed, int m2speed) { md.setSpeeds(m1speed/2*percentOutput/50, m2speed/2*percentOutput/50); } // Advances the stepper motor by one step either clockwise or counterclockwise // with the direction specified by the argument dir (0 or 1). The size of the // step depends on stepMode and can either be a full step, a half step, or a // quarter step. Full stepping is produced by repeating a four-state cycle // in which both coils are always energized to carry the same magnitude of current // but the direction of the current is sequentially switched. Running through the // four-state cycle in the reverse order reverses the direction of rotation. The // general equation for coil current should be as follows: // coil 1 current = I * sin(a) // coil 2 current = I * cos(a) // When full stepping, the four states are: // forwards: a = 0, 90, 180, 270 degrees // reverse: a = 0, 270, 180, 90 degrees // half stepping comes from: a = 0, 45, 90, 135, 180, 225, 270, 315 degrees // quarter stepping comes from a = the 16 multiples of 22.5 from 22.5 to 360 deg void one_step(unsigned char dir) { // this static variable lets us remember what step we're on so we // can change to the appropriate next state in the sequence static unsigned char step = 0; // compute the next step based on the direction argument dir // and the step mode. Full stepping skips half and quarter steps, // and half stepping skips quarter steps. Quarter stepping cycles // through all 16 steps. if (dir == 1) step += stepMode; else step -= stepMode; switch (step & 15) { case 0: // full step (both coils energized at 71%) set_speeds(283, 283); break; case 1: // quarter step (coil 1 at 38% and coil 2 at 93%) set_speeds(153, 370); break; case 2: // half step (coil 1 at 0% and coil 2 at 100%) set_speeds(0, 400); break; case 3: // quarter step
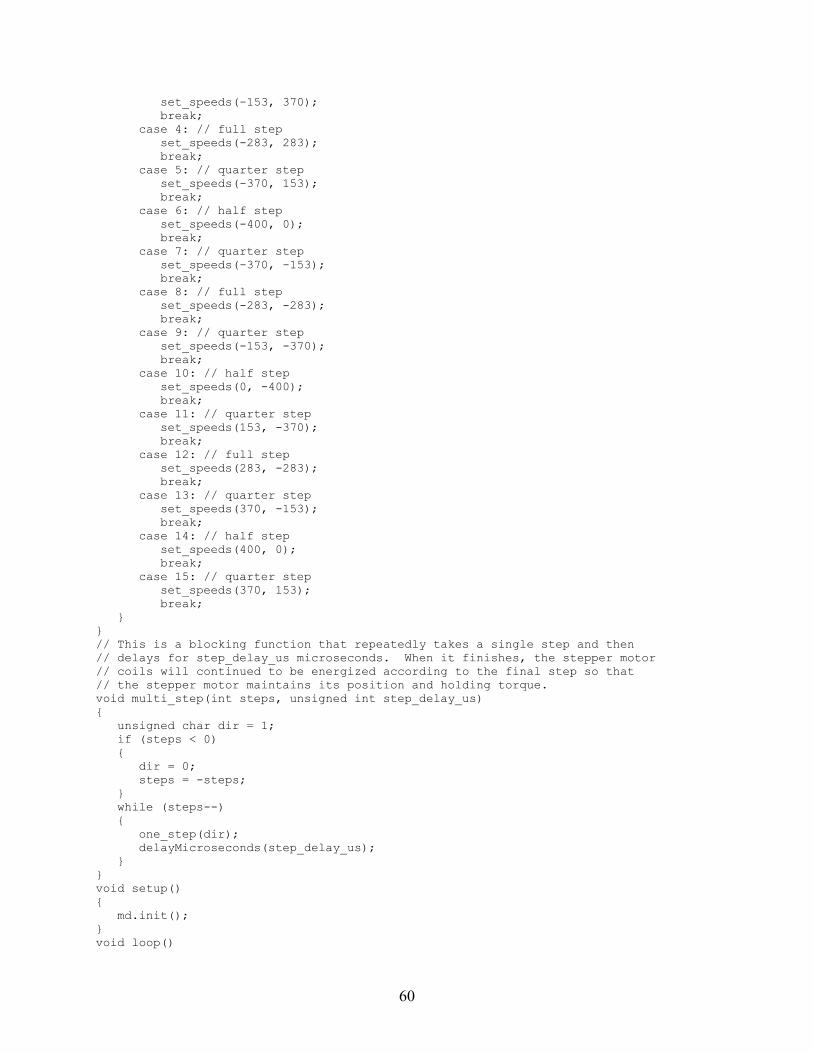
60
set_speeds(-153, 370); break; case 4: // full step set_speeds(-283, 283); break; case 5: // quarter step set_speeds(-370, 153); break; case 6: // half step set_speeds(-400, 0); break; case 7: // quarter step set_speeds(-370, -153); break; case 8: // full step set_speeds(-283, -283); break; case 9: // quarter step set_speeds(-153, -370); break; case 10: // half step set_speeds(0, -400); break; case 11: // quarter step set_speeds(153, -370); break; case 12: // full step set_speeds(283, -283); break; case 13: // quarter step set_speeds(370, -153); break; case 14: // half step set_speeds(400, 0); break; case 15: // quarter step set_speeds(370, 153); break; } } // This is a blocking function that repeatedly takes a single step and then // delays for step_delay_us microseconds. When it finishes, the stepper motor // coils will continued to be energized according to the final step so that // the stepper motor maintains its position and holding torque. void multi_step(int steps, unsigned int step_delay_us) { unsigned char dir = 1; if (steps < 0) { dir = 0; steps = -steps; } while (steps--) { one_step(dir); delayMicroseconds(step_delay_us); } } void setup() { md.init(); } void loop()

61
{ // 5370.2479 is the steps to turn the high-torque motor one revolution const int totalRevolution = (5370*.87)/2; // This is the perfect revolutions. DON'T CHANGE! const int Speed = 2600; const float soak_time = 10.0*60.0*1000.0; // 10 minutes. Must use float type. const float dry_time = soak_time*2.0; // Center to right side multi_step(-totalRevolution,Speed); delay(soak_time); // Right side to center multi_step(totalRevolution,Speed); delay(dry_time); // Center to left side multi_step(totalRevolution,Speed); delay(soak_time); // Left side to center multi_step(-totalRevolution,Speed); delay(dry_time); /* Stock code (not useful) if (stepMode == FULL_STEP) stepMode = QUARTER_STEP; else stepMode = FULL_STEP; multi_step(4, 5000000000); delayMicroseconds(500000000); for (byte i = 0; i < 4; i++) { multi_step(4, 5000000000); delayMicroseconds(5000000000); }//*/ }
File Name: DuelVNH5019MotorShield.h
#ifndef DualVNH5019MotorShield_h #define DualVNH5019MotorShield_h #include <Arduino.h> class DualVNH5019MotorShield { public: // CONSTRUCTORS DualVNH5019MotorShield(); // Default pin selection. DualVNH5019MotorShield(unsigned char INA1, unsigned char INB1, unsigned char EN1DIAG1, unsigned char CS1, unsigned char INA2, unsigned char INB2, unsigned char EN2DIAG2, unsigned char CS2); // User-defined pin selection. // PUBLIC METHODS void init(); // Initialize TIMER 1, set the PWM to 20kHZ. void setM1Speed(int speed); // Set speed for M1.
62
void setM2Speed(int speed); // Set speed for M2. void setSpeeds(int m1Speed, int m2Speed); // Set speed for both M1 and M2. void setM1Brake(int brake); // Brake M1. void setM2Brake(int brake); // Brake M2. void setBrakes(int m1Brake, int m2Brake); // Brake both M1 and M2. unsigned int getM1CurrentMilliamps(); // Get current reading for M1. unsigned int getM2CurrentMilliamps(); // Get current reading for M2. unsigned char getM1Fault(); // Get fault reading from M1. unsigned char getM2Fault(); // Get fault reading from M2. private: unsigned char _INA1; unsigned char _INB1; static const unsigned char _PWM1 = 9; unsigned char _EN1DIAG1; unsigned char _CS1; unsigned char _INA2; unsigned char _INB2; static const unsigned char _PWM2 = 10; unsigned char _EN2DIAG2; unsigned char _CS2; }; #endif
File Name: README.txt
BYU CORROSION TESTER This file discusses the details of the BYU corrosion tester. CREATORS: Cameron Gunter (Lead) - [email protected] Colin Kitchen (Structure) Tyler Mathis (Programming/Electrical) - [email protected] PURPOSE: Corrode metal samples for testing. We corroded 304L SS to test a concept of repairing metal samples using FSW. DEFINITIONS: Operating side - the side with the switch and stepper motor. Right side - right side of tester when standing on the operating side facing the tester. Left side - left side of tester when standing on the operating side facing the tester. HOW IT WORKS: 1. Starting position is with bar horizontal and the baskets level. 2. Stepper motor rotates clockwise to immerse right basket into saline mixture. 3. Soaks for 10 minutes. 4. Stepper motor rotates counter-clockwise to center position with bar horizontal and baskets level. 5. Dries for 20 minutes. 6. Stepper motor rotates counter-clockwise to immerse left basket into saline mixture. 7. Soaks for 10 minutes. 8. Stepper motor rotates clockwise to center position with bar horizontal and baskets level. 9. Dries for 20 minutes. 10.Restart cycle.
63
SUBSYSTEMS: Electrical- Stepper motor: Basic Nema 17 stepper motor with planetary gear system (about 27:1) attached. the gear system chosen to lower torque needed to move baskets which lowers stress on the stepper motor and reduces heat in motor. Arduino: Basic Arduino Uno R3: http://store-usa.arduino.cc/products/a000066. Motor driver/shield: Attached to the top of the arduino. Model is VNH5019 purchased from pololu.com: https://www.pololu.com/product/2507. The shield is needed because the voltage needed to power the stepper motor is higher than the arduino can handle. The shield uses the instructions programmed on the arduino to power the stepper motor. A library is needed to use the shield with the arduino. This library can be found on this flash drive in the directory labelled "library" or on github at https://github.com/pololu/dual-vnh5019-motor-shield. On/off switch: Switches the electrical system on or off. It uses an electric magnetic method to keep it on. This method requires electricity to be running to turn it on. This also means that if a power outage occurs the switch will automatically turn off which will signal to the user that a power outage occurred. EXPLANATION OF CODE: Code is found on CORROSION flash drive and has path name: CORROSION/ArduinoCode/VNH5019_corrosion_tester/VNH5019_corrosion_tester.ino. This code can be opened on the Arduino Programming gui. The library that is needed to run it has pathname: CORROSION/ArduinoCode/library/DualVNH5019MotorShield. Most of the code was written by a Pololu employee. Tyler wrote the main function and the rest function. The code was written to reduce heat to the shield/arduino system and the stepper motor. The main function cycles through the positions listed above in "HOW IT WORKS" with a rest between each step for a specified amount of time depending upon which part of the cycle it is. The rest function releases the stepper motor from work. This will allow the stepper motor and the shield/Arduino system to cool down. If the rest function is not included the stepper motor and shield/Arduino will get very hot and could overheat which would cause the shield to automatically shut-down due to a overheating safegaurd programmed into the shield. The gear ratio of the planetary gear system in the stepper motor is enough to hold the corrosion tester baskets in place.