feasibility of renewable energy based distributed … of renewable energy based distributed...
TRANSCRIPT
Feasibility of Renewable Energy Based
Distributed Generation in Yanbu, KSA
Alaa Alaidroos
Moncef Krarti, PhD, PE, LEED®AP
University of Colorado at Boulder
Building Systems Program
Outline
• Electricity demand in Saudi Arabia
• Impact of electricity price subsidies
• Case study of residential community
• Available renewable energy resources
• Analysis of distribution generation systems
• Selected results
• Conclusions and summary

Energy Demand in Saudi Arabia
• Increase of electricity demand: 46,000 MW to 120,000 MW within 20 years.
• Over 1/4 of the oil production in Saudi Arabia is consumed by the country it self!
Effect of local energy consumption growth:
1. Affect future economy (jeopardize the ability of exporting oil)
2. Increase CO2 emissions
3. Indicate inefficient use of energy

Impacts of Electricity Prices Subsidies
• Average cost of electricity production is 0.10 $/kWh.
• Average cost of electricity for residential users is 0.03 $/kWh.
• Saudi Arabia is the second largest country subsidizing fuel and electricity prices.
• 70% of the oil consumption is subsidized leading
• 30% to electricity use is subsidized
• These subsidies result in cheap energy for users but are costing Saudi Arabia about $188 billions per year (?)
High Electricity Price Subsidies
Preventing RE/EE investments

Case Study Objectives
Investigate the feasibility of utilizing
hybrid renewable energy systems to
partially cover high electricity demand
of residential community and
supplement and/or replace the
traditional power plants
Environmental benefits by reducing
CO2 emissions
Economical benefits by lowering
electricity costs and reducing reliance
on fossil fuel
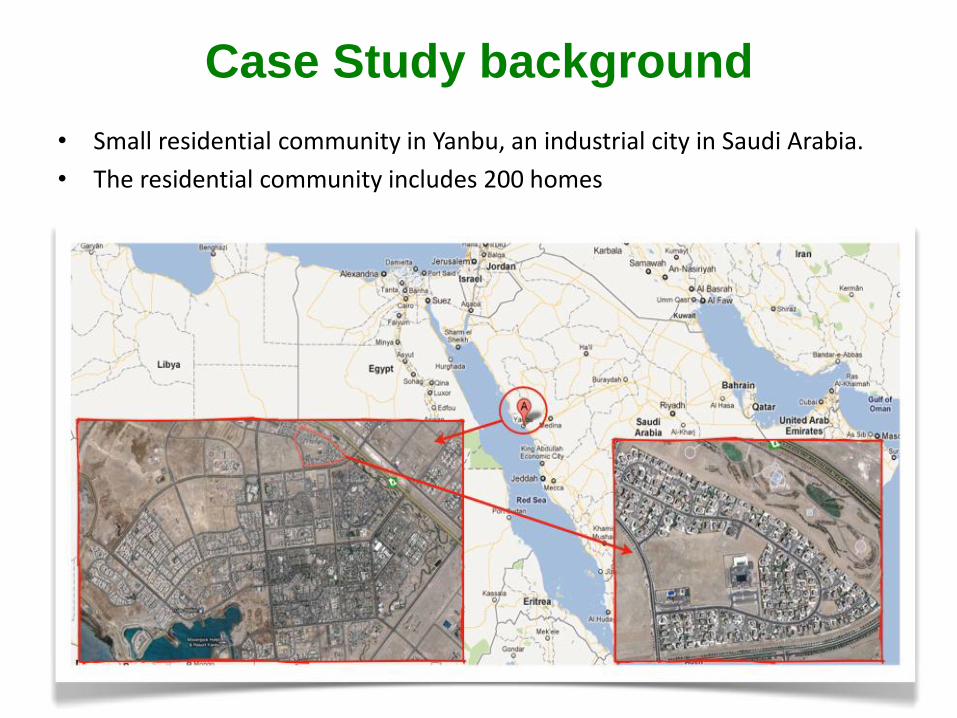
Case Study background
• Small residential community in Yanbu, an industrial city in Saudi Arabia.
• The residential community includes 200 homes

Energy Resources (Wind)
Wind speed profiles match the significant energy demand for space cooling
Monthly Hourly

Energy Resources (Solar)
• Annual solar radiation in Saudi Arabia is about 250 w/m2
• 105 trillion kilowatt hours a day, which is roughly the equivalent of 10 billion barrels of oil

Analysis of DG Systems
HOMER simulation
• PV system sizes: 500 and 1000 kW
• Number of wind turbine: 5, 10, 15, 20 and 25 (150kW Nordex N27 turbines)

Selected Analysis Results
Renewable fraction vs COE
Wind energy provides higher renewable fraction than the PV system at the same cost of energy (COE) level
CO2 emission vs COE
Wind energy can reduce CO2 emissions dramatically compared to PV at the same cost of energy (COE) level
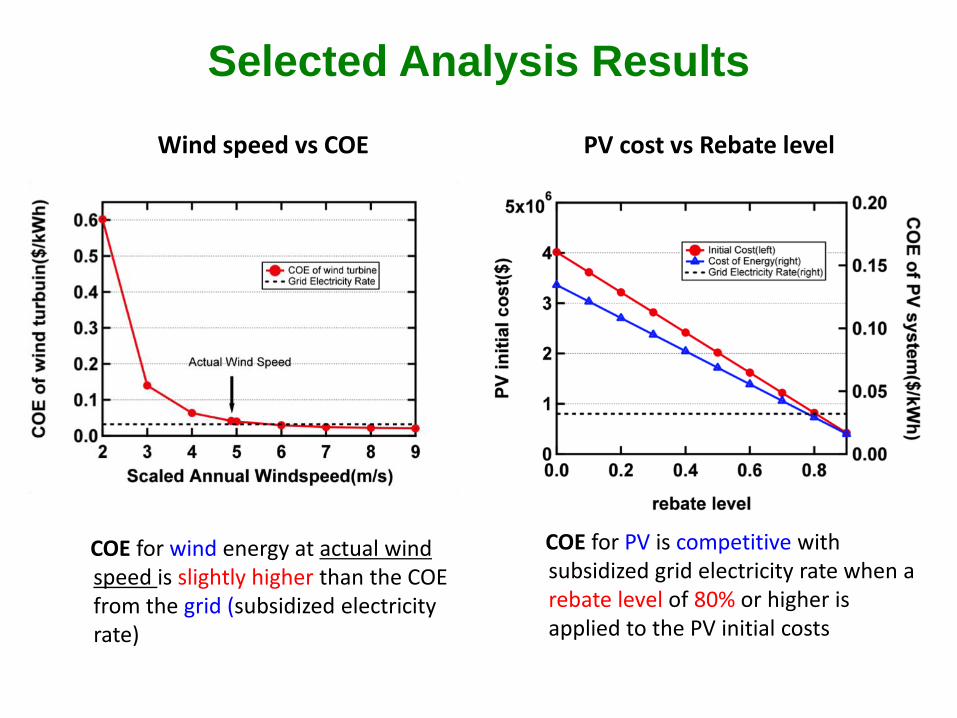
Selected Analysis Results
COE for PV is competitive with subsidized grid electricity rate when a rebate level of 80% or higher is applied to the PV initial costs
COE for wind energy at actual wind speed is slightly higher than the COE from the grid (subsidized electricity rate)
Wind speed vs COE PV cost vs Rebate level

Influence of Subsidies On RE Feasibility
• If subsidies for electricity prices are reduced, distributed generation using
renewable energy systems becomes economically feasible

Summary and Conclusions
• High energy demand growth in KSA is affecting the economy and
significantly increasing CO2 emissions
• Renewable energy can be economically feasible in KSA but high
subsidies (low electricity prices) are preventing investments in
renewable energy generation and efficiency improvements
• Wind energy provide higher renewable fraction and potential for
reduction of CO2 emissions than PV
• PV can be cost effective only if there would high rebate level and
support from the government (similar to the current level applied for
the cost of oil)

Hybrid Distributed Generation Systems in Rural
Alaska
Lindsay Willman
Moncef Krarti, PhD, PE, LEED-AP
Building Systems Program
University of Colorado
Boulder, Colorado
Photo: wind turbines in Unalakleet, Alaska

Over 150
isolated
electrical grids
Coal
Natural
Gas
Hydroelectric
and diesel
Diesel Wind
Majority of
rural areas
rely on diesel

Communities: Mountain Village,
Deering, and Ambler
• Stand-alone electrical grid
• Electricity and heating source: diesel
Community Population
Electricity
Generation
(kWh/yr)
Diesel Fuel
Use (gal/yr)
CO2
Emissions
(t/yr)
Mountain
Village 813 2,799,595 189,184 1,920
Deering 122 711,319 55,145 560
Ambler 258 1,249,161 89,892 912
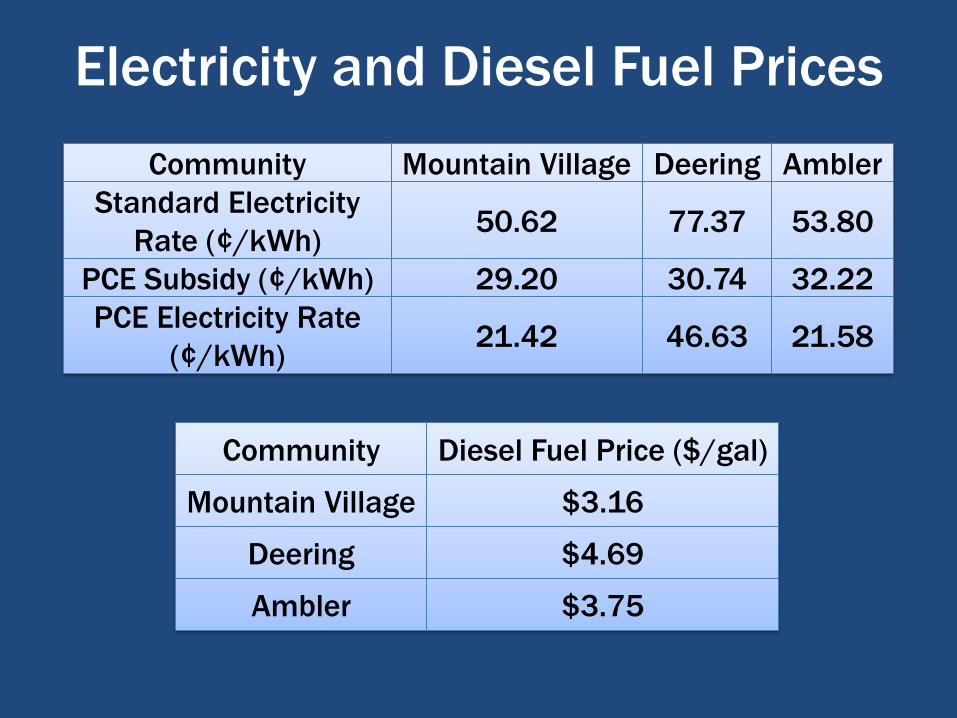
Electricity and Diesel Fuel Prices
Community Diesel Fuel Price ($/gal)
Mountain Village $3.16
Deering $4.69
Ambler $3.75
Community Mountain Village Deering Ambler
Standard Electricity
Rate (¢/kWh) 50.62 77.37 53.80
PCE Subsidy (¢/kWh) 29.20 30.74 32.22
PCE Electricity Rate
(¢/kWh) 21.42 46.63 21.58
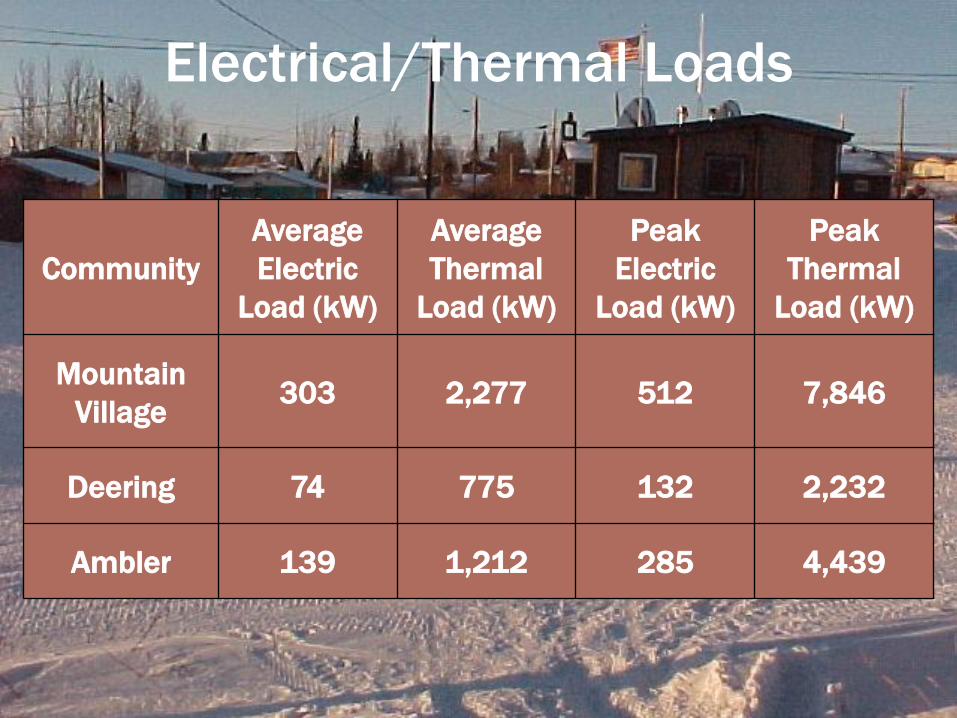
Electrical/Thermal Loads
Community
Average
Electric
Load (kW)
Average
Thermal
Load (kW)
Peak
Electric
Load (kW)
Peak
Thermal
Load (kW)
Mountain
Village 303 2,277 512 7,846
Deering 74 775 132 2,232
Ambler 139 1,212 285 4,439

Mountain
Village:
7.28 m/s
Deering:
5.22 m/s Ambler:
3.60 m/s

Community
Annual Average
Solar Radiation
(kWh/m2/day)
Mountain
Village 2.80
Deering 2.61
Ambler 2.58
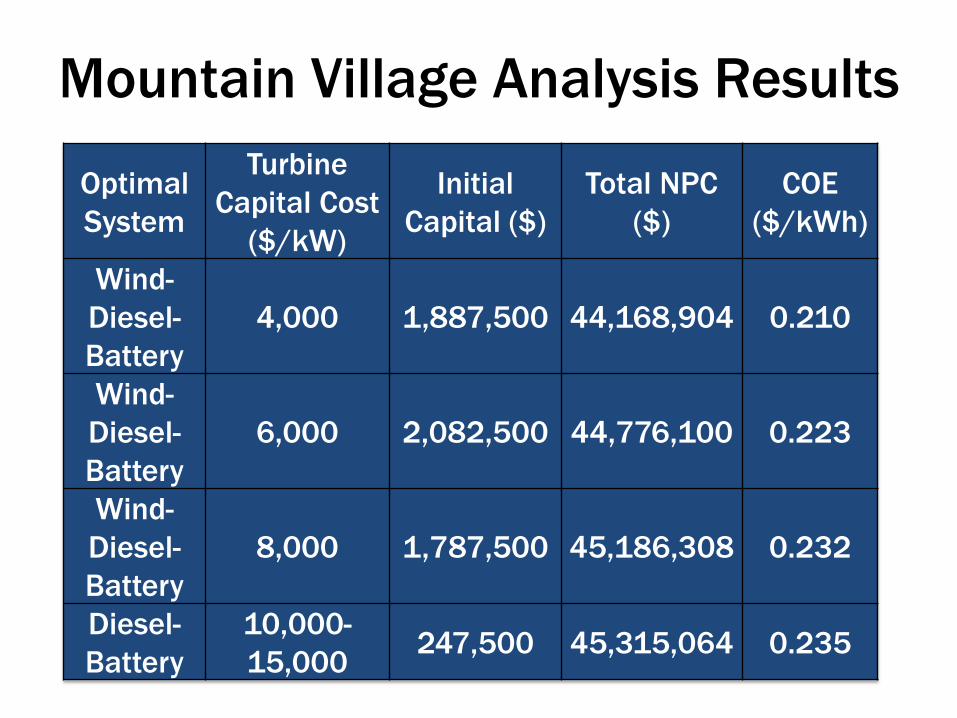
Mountain Village Analysis Results
Optimal
System
Turbine
Capital Cost
($/kW)
Initial
Capital ($)
Total NPC
($)
COE
($/kWh)
Wind-
Diesel-
Battery
4,000 1,887,500 44,168,904 0.210
Wind-
Diesel-
Battery
6,000 2,082,500 44,776,100 0.223
Wind-
Diesel-
Battery
8,000 1,787,500 45,186,308 0.232
Diesel-
Battery
10,000-
15,000 247,500 45,315,064 0.235

Baseline and Hybrid System
Comparison
System
Electricity
Production
from Diesel
(kWh/yr)
Diesel
Fuel Use
(gal/yr)
CO2
Emissions
(t/yr)
Baseline 2,799,595 189,184 1,920
Hybrid 1,748,822 118,164 1,199
Savings 1,050,773 71,020 721
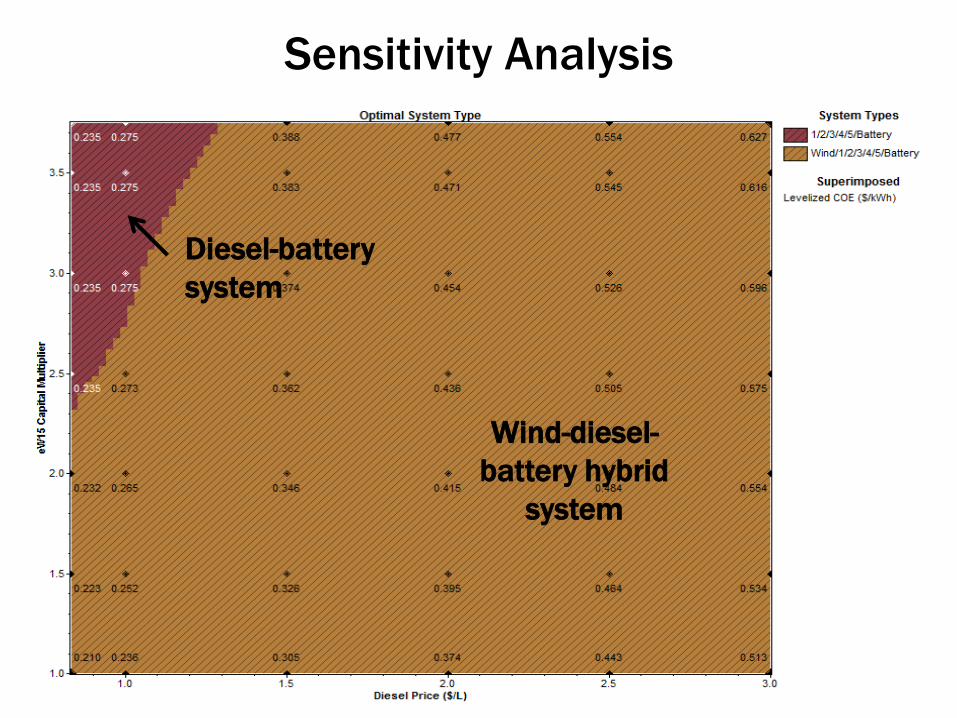
Sensitivity Analysis
Diesel-battery
system
Wind-diesel-
battery hybrid
system

0
0.1
0.2
0.3
0.4
0.5
0.0 10.0 20.0 30.0 40.0 50.0
Lev
eliz
ed C
ost
of
En
ergy (
$/k
Wh
)
Percent Reduction in CO2 Emissions
Wind-diesel-battery hybrid system
COE: $0.23/kWh, REF: 0.5
Percent Reduction: 44.3%
Wind-PV-diesel hybrid system
COE: $0.381/kWh, REF: 0.46
Percent Reduction: 35.6%

Deering Analysis Results
Optimal
System
Turbine
Capital
Cost
($/kW)
Initial
Capital ($) Total NPC ($)
COE
($/kWh)
Wind-
Diesel-
Battery
4,000 513,750 20,786,188 0.288
Wind-
Diesel-
Battery
6,000 708,750 20,981,188 0.305
Diesel 8,000-
15,000 0 20,992,308 0.306

Ambler Analysis Results
Optimal
System
Initial
Capital ($) Total NPC ($)
COE
($/kWh)
Diesel with
heat recovery 0 28,494,520 0.302
Cost of energy for hybrid wind-diesel systems:
$0.311/kWh - $0.876/kWh

Conclusions
• Wind and solar DG systems can
lower the COE for remote
Alaskan communities
• COE highly dependent on wind
turbine capital cost, diesel fuel
price, and site characteristics
• Detailed site analyses needed
to accurately determine capital
costs
Photo: wind
turbines in
Kodiak,
Alaska