feasibility study: economic feasibility technical feasibility operational feasibility organizational...
TRANSCRIPT
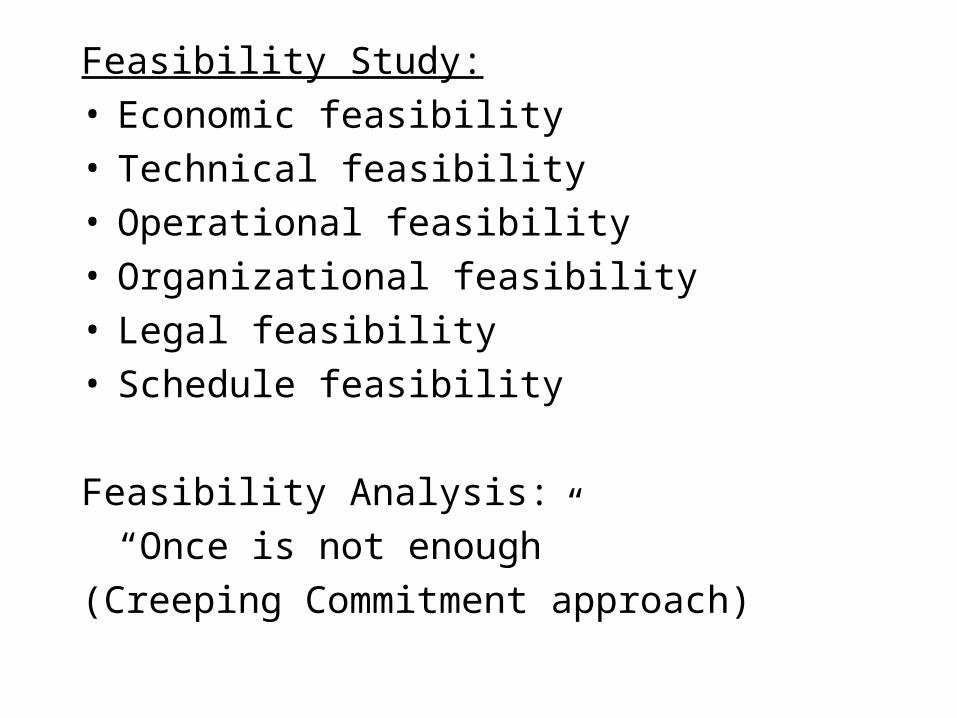
Feasibility Study:• Economic feasibility• Technical feasibility• Operational feasibility• Organizational feasibility• Legal feasibility• Schedule feasibility
Feasibility Analysis:
“Once is not enough”
(Creeping Commitment approach)
Feasibility Study• Economic feasibility
– cost-benefit analysis
• Technical feasibility– ability to construct system - risks– greater returns from riskier projects - manage risks
• fail to attain benefits,
• cost/ time overruns
• inadequate system performance levels
• unable to integrate with existing hardware, software
• Technical risk– larger projects are riskier
• project team size, project duration, number of organizational units involved, programming effort
– structured and easily obtainable requirements less risky
– use of standard technology less risky than novel or non standard technology
• development team familiarity with hardware, software development environment, OS; application area; systems of similar scope
– less risk when user group is familiar with system development process and application area
• Operational feasibility– likelihood of project attaining desired objectives– how new system will affect organizational
structures and processes, – how it fits into current day-to-day operations
• Organizational/political feasibility– how key stakeholders in organization view system– system can affect distribution of information, thus
power
• Schedule feasibility– likelihood that timeframes can be met and that
this is adequate to meet organization’s needs• resource availability to enable schedule
• Legal feasibility• copyrights, anti-trust laws (systems that share data
across organizations), financial reporting requirements, contractual obligations, software ownership, outsourcing arrangements, etc.
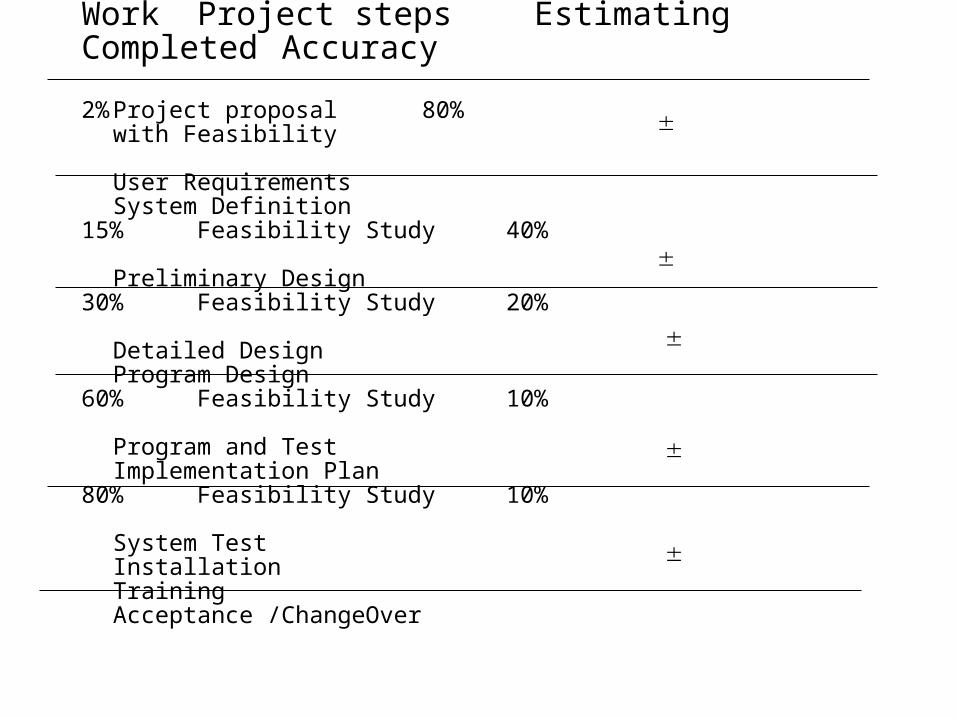
Work Project steps EstimatingCompleted Accuracy
2% Project proposal 80%with Feasibility
User RequirementsSystem Definition
15% Feasibility Study 40%
Preliminary Design30% Feasibility Study 20%
Detailed DesignProgram Design
60% Feasibility Study 10%
Program and TestImplementation Plan
80% Feasibility Study 10%
System TestInstallationTrainingAcceptance /ChangeOver
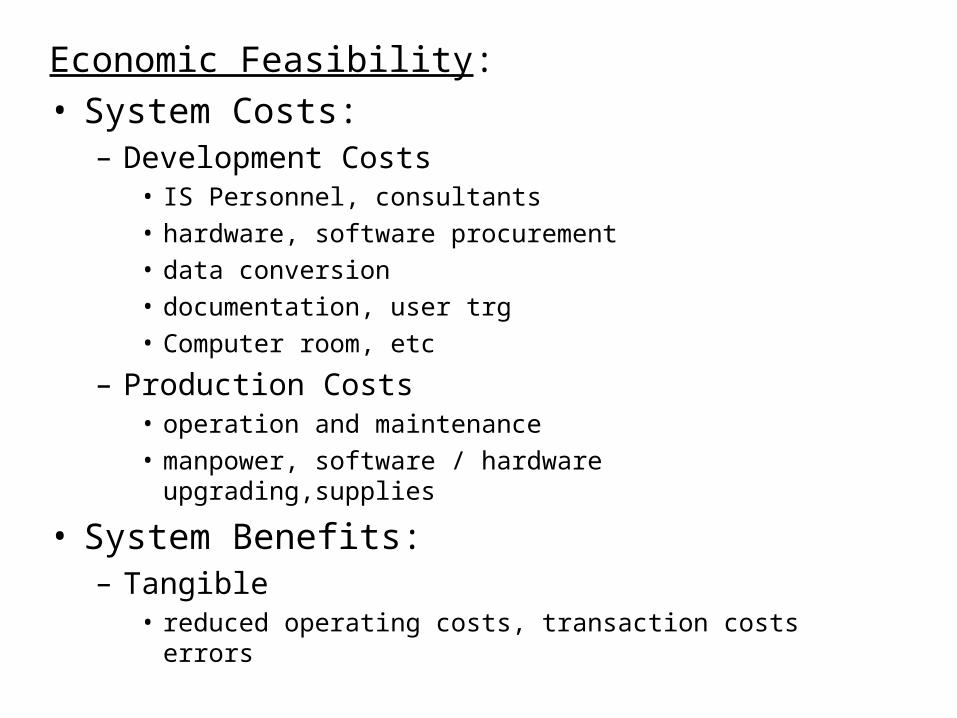
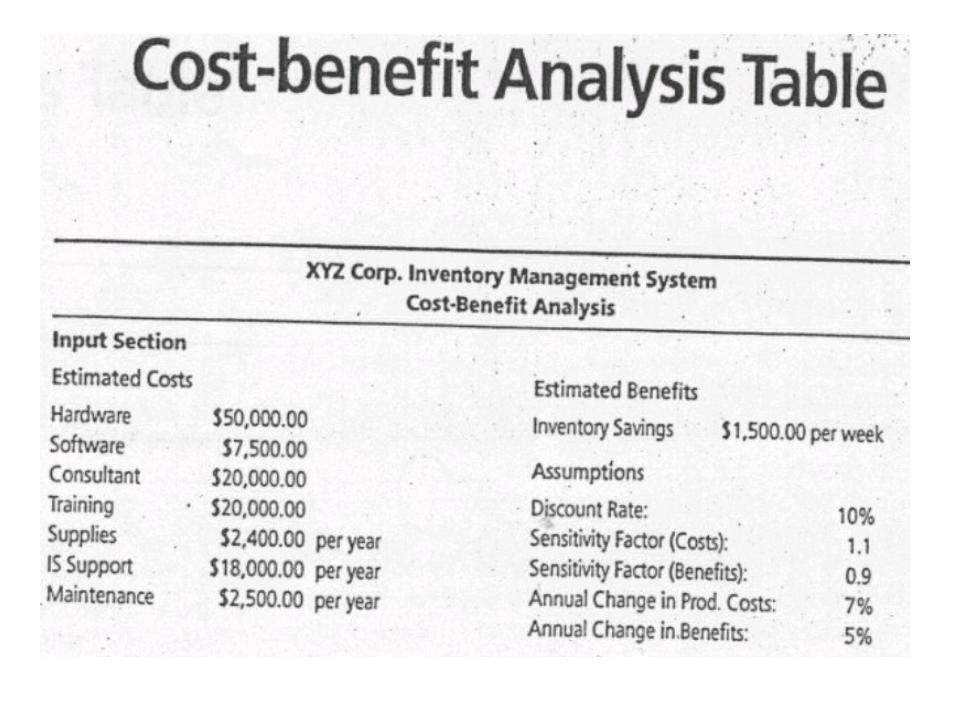
Economic Feasibility:• System Costs:
– Development Costs• IS Personnel, consultants• hardware, software procurement• data conversion• documentation, user trg• Computer room, etc
– Production Costs• operation and maintenance• manpower, software / hardware upgrading,supplies
• System Benefits:– Tangible
• reduced operating costs, transaction costs errors
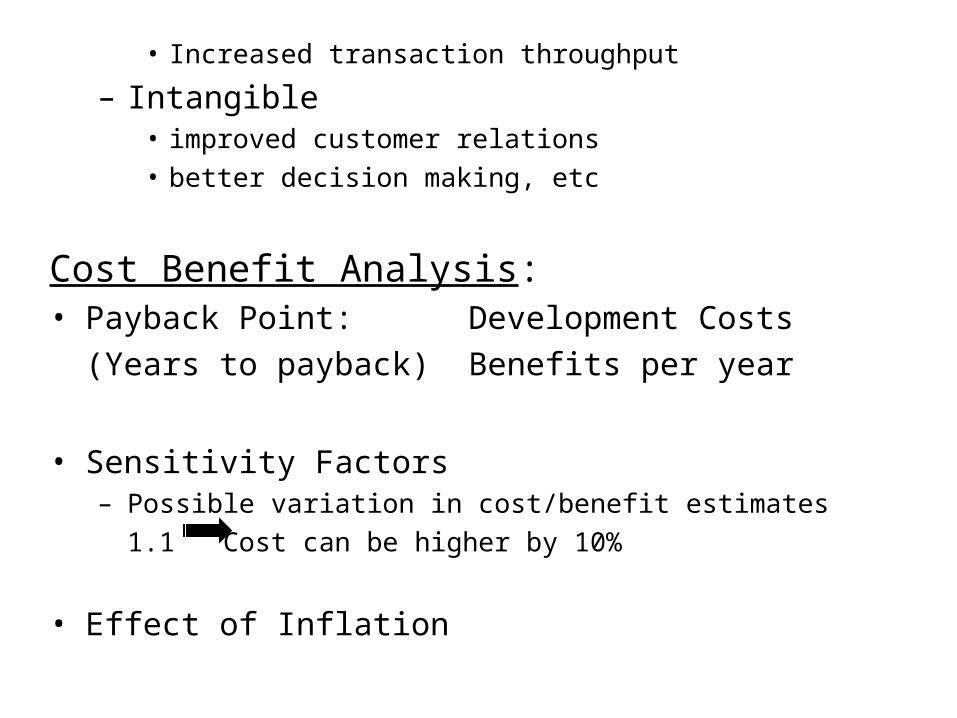
• Increased transaction throughput
– Intangible• improved customer relations• better decision making, etc
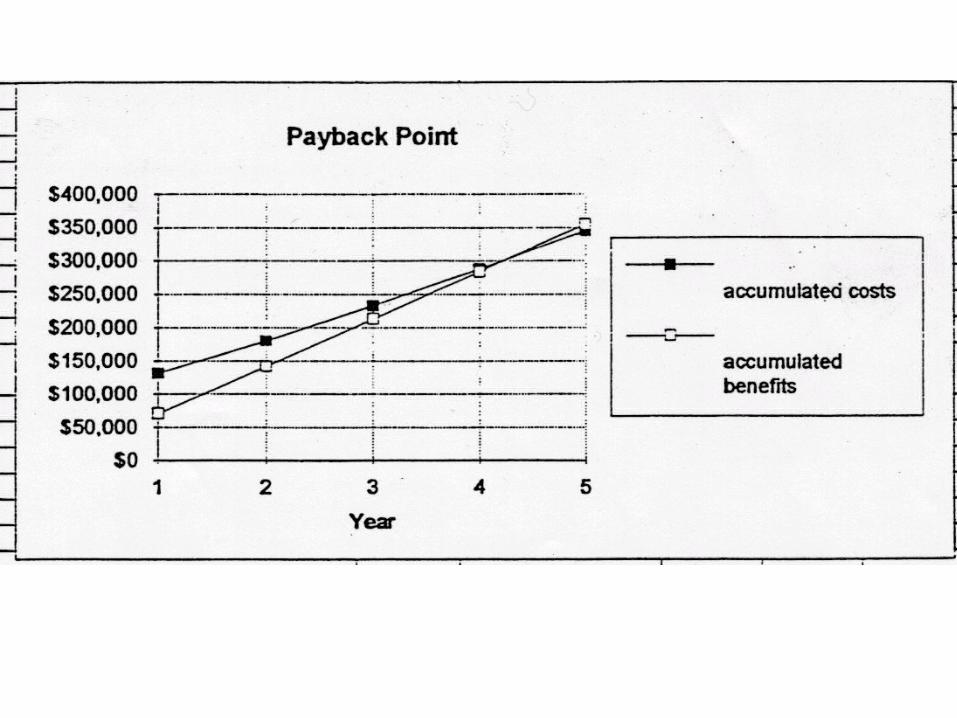
Cost Benefit Analysis:• Payback Point: Development Costs
(Years to payback) Benefits per year
• Sensitivity Factors– Possible variation in cost/benefit estimates
1.1 Cost can be higher by 10%
• Effect of Inflation
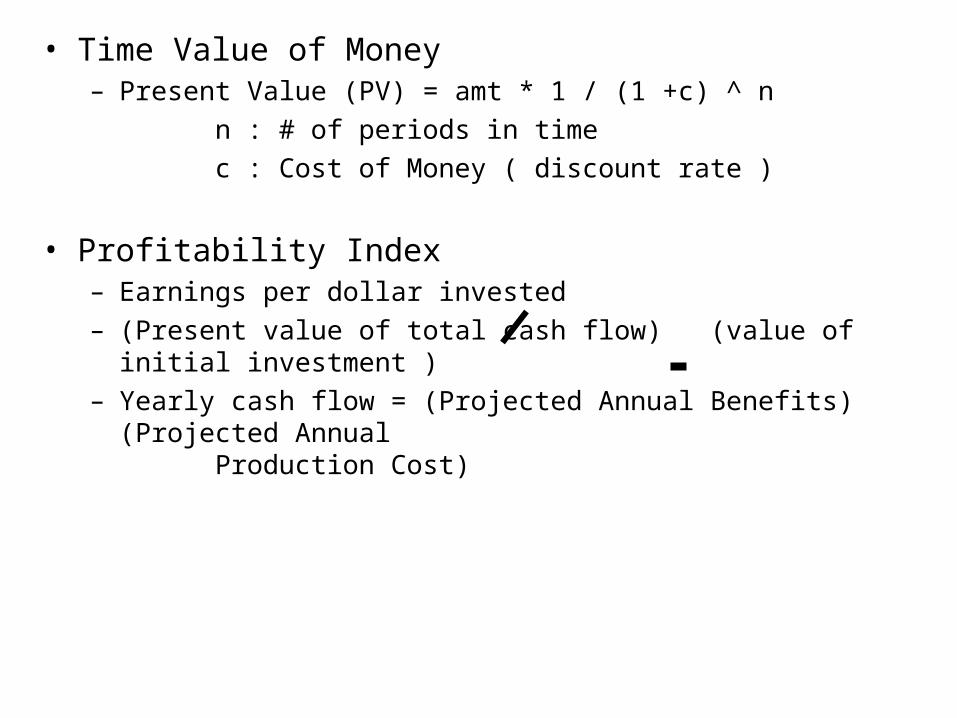
• Time Value of Money– Present Value (PV) = amt * 1 / (1 +c) ^ n
n : # of periods in time
c : Cost of Money ( discount rate )
• Profitability Index– Earnings per dollar invested– (Present value of total cash flow) (value of initial investment )– Yearly cash flow = (Projected Annual Benefits) (Projected Annual
Production Cost)
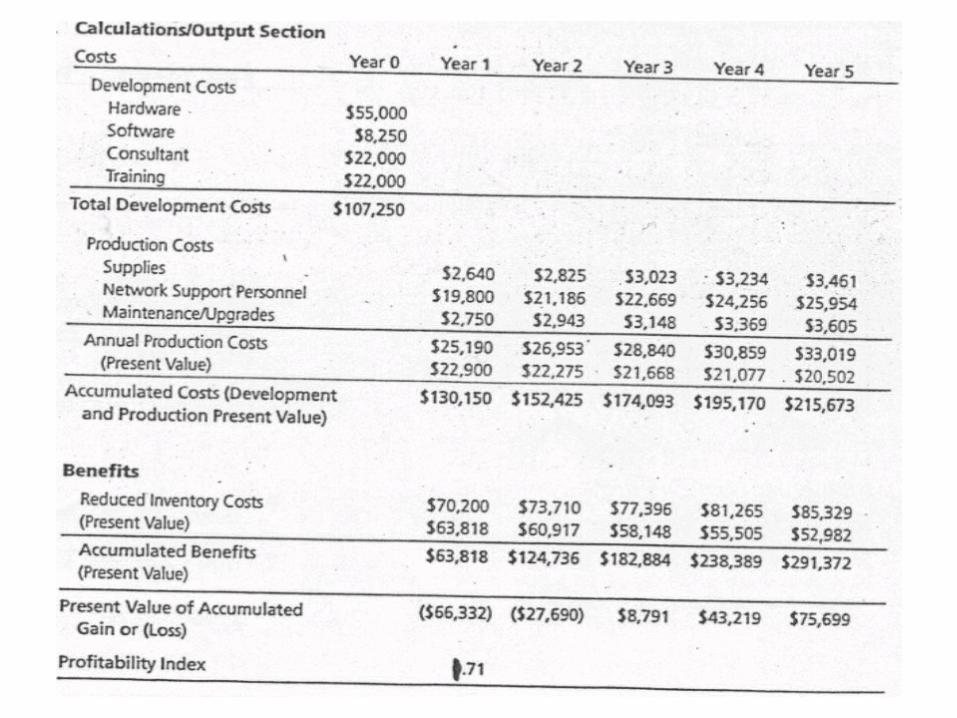
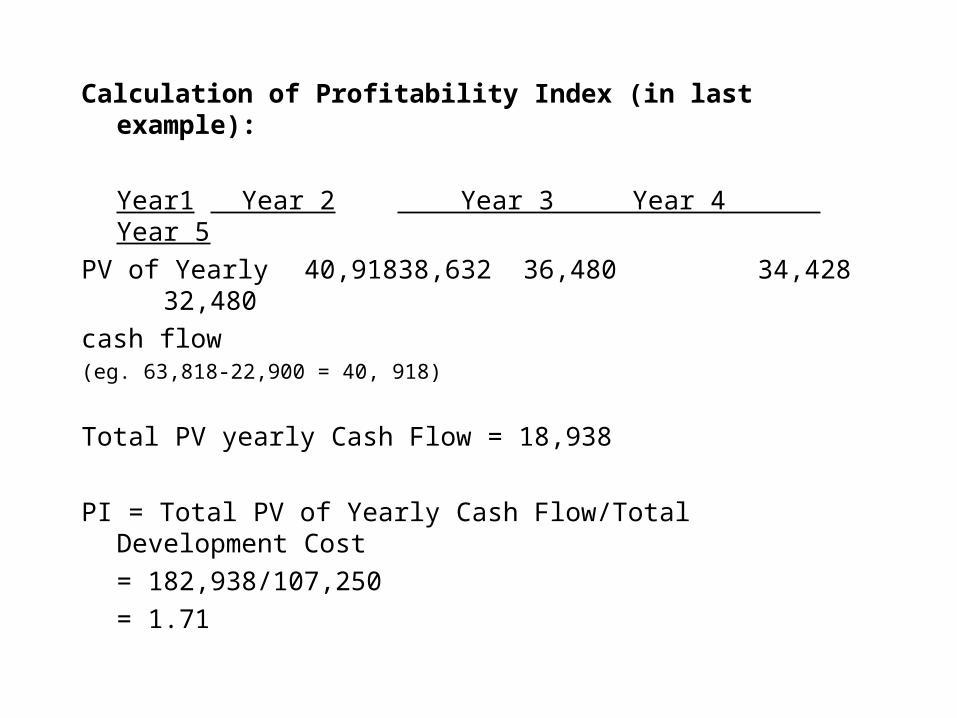
Calculation of Profitability Index (in last example):
Year1 Year 2 Year 3 Year 4 Year 5
PV of Yearly 40,918 38,632 36,480 34,428 32,480
cash flow(eg. 63,818-22,900 = 40, 918)
Total PV yearly Cash Flow = 18,938
PI = Total PV of Yearly Cash Flow/Total Development Cost
= 182,938/107,250
= 1.71
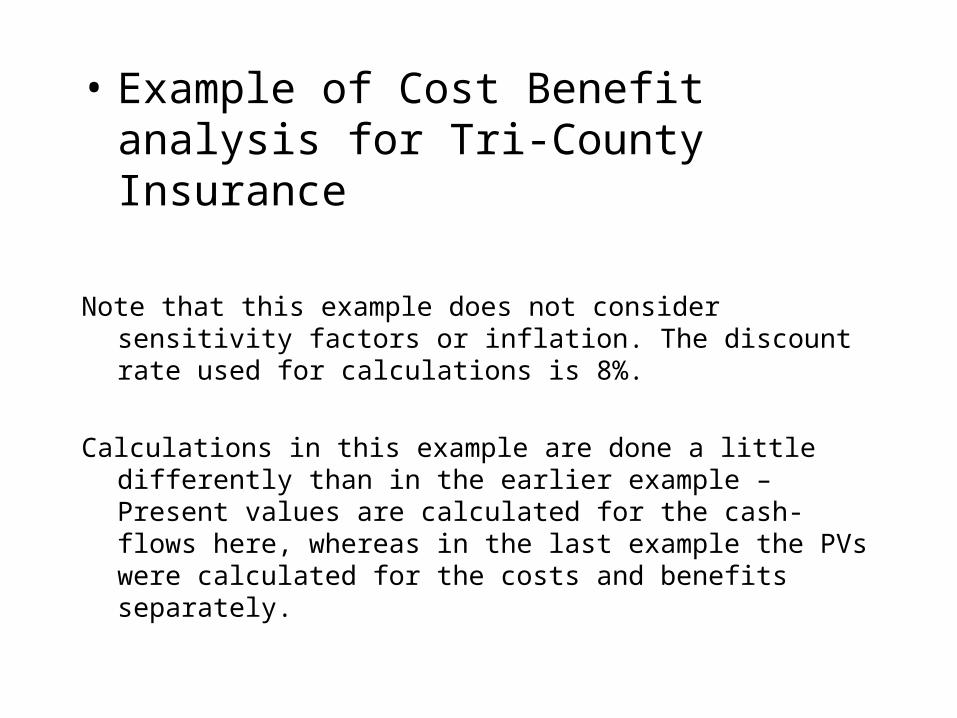
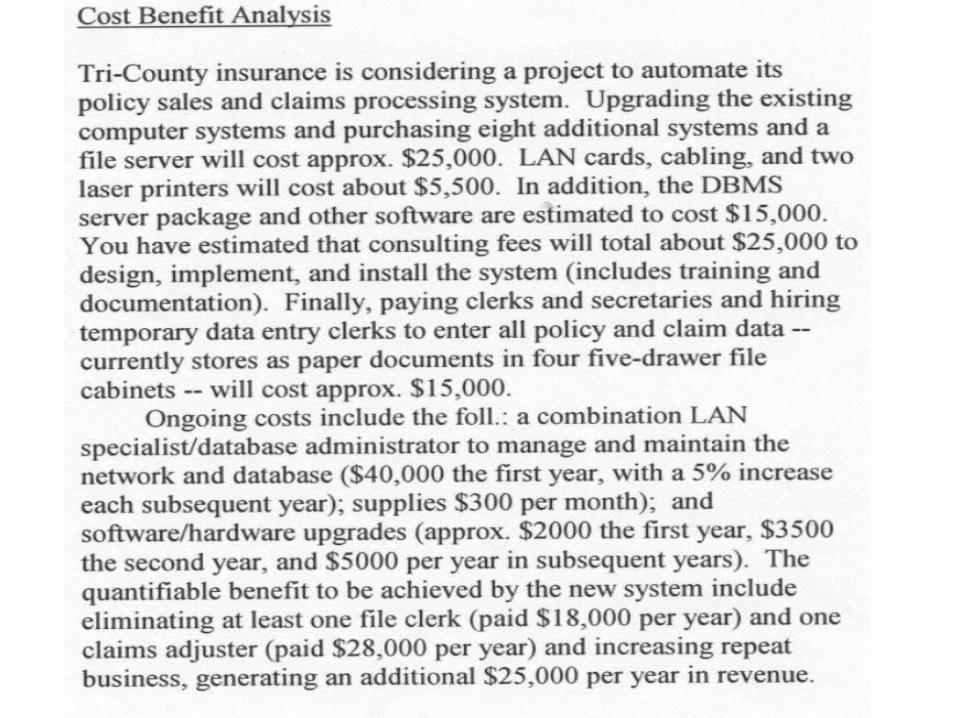
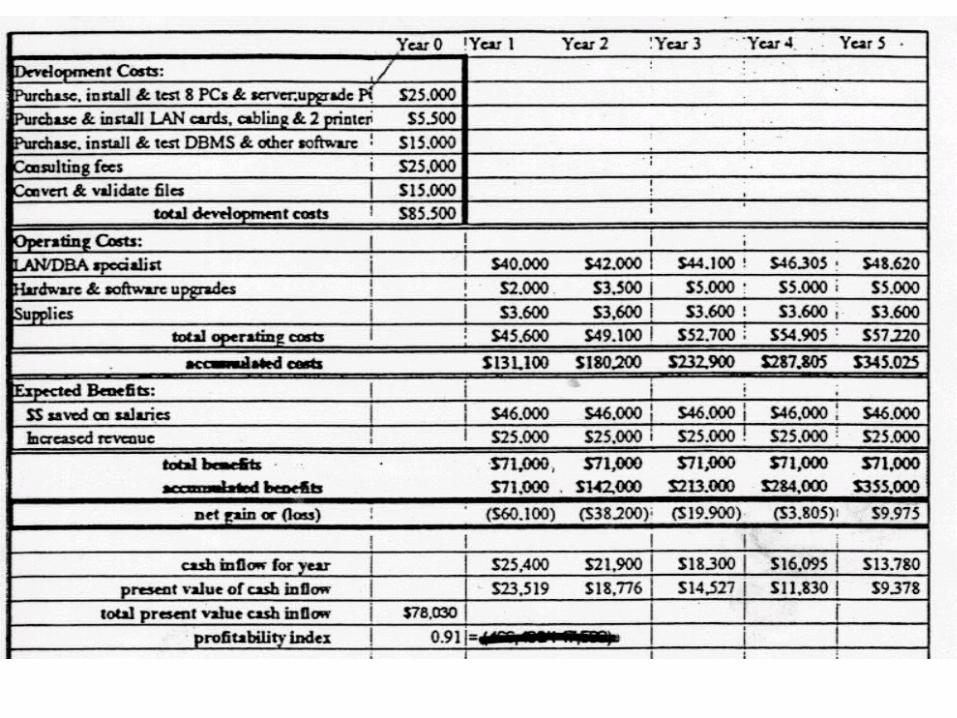
• Example of Cost Benefit analysis for Tri-County Insurance
Note that this example does not consider sensitivity factors or inflation. The discount rate used for calculations is 8%.
Calculations in this example are done a little differently than in the earlier example – Present values are calculated for the cash-flows here, whereas in the last example the PVs were calculated for the costs and benefits separately.