feature selection and the class imbalance problem in - citeseer
TRANSCRIPT
1
Feature Selection and the Class Imbalance Problem in
Predicting Protein Function from Sequence
Ali Al-Shahib1, Rainer Breitling1, 2 and David Gilbert1
1 Bioinformatics Research Centre, Department of Computing Science, University of Glasgow
2 Molecular Plant Science Group, Institute of Biomedical and Life Sciences, University of Glasgow
Abstract
When the standard approach to predict protein function by sequence homology fails,
other alternative methods can be used that require only the amino acid sequence for
predicting function. One such approach uses machine learning to predict protein
function directly from amino acid sequence features. However, there are two issues to
consider before successful functional prediction can take place: identifying
discriminatory features, and overcoming the challenge of large data imbalance in the
training data. In this study we show that by applying feature subset selection followed
by undersampling of the majority class, significantly better Support Vector Machine
(SVM) classifiers are generated compared to standard machine learning approaches. As
well as revealing that the features selected could have the potential to advance our
understanding of the relationship between sequence and function, we also show that
undersampling to produce fully balanced data significantly improves performance. The
best discriminating ability is achieved using SVMs together with feature selection and
full undersampling; this approach strongly outperforms other competitive learning
algorithms. We conclude that this combined approach can generate powerful machine
learning classifiers for predicting protein function directly from sequence.
2
Introduction
Predicting the function of orphan proteins is one of the focal points of functional
genomics research. The number of orphan proteins reach as high as 60% in some
organisms, and an average of 40% in most organisms. The standard bioinformatics
approach for predicting the function of a protein is to use sequence comparison tools
such as PSI-BLAST (Altschul, Madden et al. 1997) that can identify homologous (i.e.
evolutionarily related) proteins. This is based on the assumption that in many cases,
evolutionary divergence is slow enough to permit recognition of homologs that may
have the same or similar structures and (possibly) functions (Whisstock and Lesk 2003).
However, using such a method often fails to detect clear homologs for low sequence
similarity cases (in the so-called “ twilight” or “midnight zone”); the problem of
assigning function becomes significantly more difficult as the similarity between the
protein and its (putative) homologs decreases. Hence, there is a considerable need for
alternative function prediction methods that can overcome such problems, without
relying on phylogenetic assumptions and information. Work by King et al (King,
Karwath et al. 2000) and Jensen et al (Jensen, Gupta et al. 2003) has shown that useful
information about function can be contained in a spectrum of protein sequence features.
Protein function can be predicted based on the discriminative features that map protein
sequence to biological function, using a supervised learning algorithm. Currently, there
are two serious problems affecting the implementation of such methods. The first is
that non-informative sequence features add noise to the classification procedure,
masking the information contained in discriminating features. The second is the ‘curse’
of imbalanced data which is familiar in machine learning (Japkowicz and Stephen 2002;
Drummond and Holte 2003; Estabrooks, Jo et al. 2004). Proteins with certain functions

3
will be far more abundant/diverse in an organism than proteins of other functions, thus
creating a highly imbalanced dataset from which to induce a classifier. The resulting
classifier would then be expected to perform best for classifying the majority class but
fail for the minority class. There are two possible reasons for this. First, since the
ultimate goal of most of the machine learning algorithms is to maximise accuracy. i.e.
the total number of correct predictions, they tend to optimize prediction for the majority
class even if it means accepting poor performance on the minority class (An, Cercone et
al. 2001). Also, performance on imbalanced data may be impaired by the numerical
dominance of outliers in the majority class which tend to “mask” the minority class. It is
important, therefore, that methods for protein function prediction overcome such
problems to achieve accurate machine learning classifiers.
In this study, we show that predicting protein function from sequence can be
significantly improved by (1) performing full (100%) undersampling of the majority
class, (2) using feature selected data, and (3) generating Support Vector Machine
classifiers (SVMs). Combining all of these techniques generates a powerful classifier
that significantly outperforms all other approaches tested in the present study. We have
also statistically shown that performing undersampling with feature selection using
SVMs outperforms other competitive classifiers such as Naïve Bayes (John and Langley
1995) and decision trees (Quinlan 1993) in predicting protein function in an imbalanced
environment. These findings constitute the first necessary step in attempting to achieve
high performance when predicting protein function from sequence.

4
Methodology
Data Collection
For our test case, we have populated a database containing protein sequence information
from the fully sequenced genome of Neisseria gonorrhoea. The beta-proteobacterium
N.gonorrhoeae is the obligate human pathogen that causes the sexually transmitted
disease known as gonorrhea that infects approximately 62 million people each year
(WHO 2001). Finding protein functions for the N.gonorrhoeae proteome is vital for
understanding its pathogenicity mechanisms. Arvidson et al (Arvidson, Powers et al.
1999), for example, have shown that PilA, initially identified as a transcriptional
regulator, is homologous to the GTPase gene FtsY. Thus they concluded that GTPase
activity is necessary for PilA function which is believed to play a part in the evasion of
the host immune system.
The N. gonorrhoeae predicted proteins and their functional annotations were obtained
from the Los Alamos National Laboratory (March 2002)1. Diverse sequence related
features were extracted and calculated, including amino acid composition, amino acid
pair ratios, protein length, molecular weight, isoelectric point, hydropathicity, aliphatic
index. A total of 433 features were used (a full list can be found at the accompanying
website2).
Additional features such as structural and phylogenetic predictions could have been
extracted, but we first wanted to focus our attention on understanding the possible limits
of prediction accuracy when forced to rely on the information available within sequence
1 http://www.stgen.lanl.gov/ 2 http://www.dcs.gla.ac.uk/~alshahib/results_USFS.htm

5
alone. This is particularly important because the original annotation has been derived
from phylogenetic information (high level sequence features) and our reasoning would
become circular if we based it on the same type of information. Further work
considering additional biologically useful features will be carried out in the future.
The entire data set contains 1,151 proteins from 13 different functional classes
represented as 433-dimensional sequence feature vectors. The functional classes were
assigned according to the classification of Riley (Riley 1993). The ‘Unknown’ ,
‘Hypothetical’ , and ‘Unassigned’ classes have been removed for learning purposes.
The description and sample size of each class are shown in Table 1.
Functional Class Sample size Amino acid biosynthesis 112 Biosynthesis of cofactors, prosthetic groups, and carriers 75 Cell envelope 211 Cellular processes 75 Central intermediary metabolism 46 DNA metabolism 114 Energy metabolism 105 Fatty acid and phospholipids metabolism 23 Purines, pyrimidines, nucleosides, and nucleotides 42 Regulatory functions 54 Transcription 40 Translation 118 Transport and binding proteins 136 Total 1151 Table 1 .Functional classification of proteins and their sample size.
In addition, since the original data are very heterogeneously scaled (for example, the
feature corresponding to molecular weights has the order of 104 while features
corresponding to amino acids composition rates only have the order of 10-2) linear
normalisation (standardisation) was performed to rescale each feature by its mean and
6
variance (Bishop 1993). After standardisation, each of the 433 features has a mean of 0
and a standard deviation of 1.
Data Pre-Processing
The full data set was randomly divided into training (1034 proteins) and test data (117
proteins). For each functional class, training data were converted into a binary class
classification (“one-against-all” approach). For evaluation, we performed 20 bootstraps
on the test data to assess the variability of the results for each classifier.
As a word of caution, one must make sure that the predictions made are not based on
homology of proteins in the training and test sets but rather on non-homologous
proteins. In our example, however, this is not much of an issue as bacterial genomes
contain a much smaller number of duplicate genes (7-16%) than eukaryotic organisms
(Coissac, Maillier et al. 1997) and the families of homologous are significantly smaller,
as is the number of highly conserved homologous pairs.
Classifiers
Three different machine learning algorithms were examined in this study: State-of-the-
art Support Vector Machines (Vapnik 1998), implemented using the Sequential
Minimization Optimization (SMO) algorithm (Platt 1999), C4.5 decision trees (Quinlan
1993) and Naïve Bayes (John and Langley 1995). In addition to the state-of-the-art
support vector machines, we chose decision trees because they have high explanatory
power, i.e. they present the justification for their classification in human-readable form.
Furthermore, Naïve Bayes classifiers are a good representative of probabilistic learning
algorithms and one which provides an insight into the performance of a classifier that

7
takes class distribution into consideration when learning so that it should not be affected
by the imbalance problem. A polynomial kernel with order 3 was used for SVMs. This
was chosen based on previous work (unpublished results) on a different protein dataset
where it produced the most accurate classifiers. Other parameters were used in default
settings (Complexity Constant =1, size of the kernel cache = 1000003, tolerance
parameter = 1.03 e-03) to avoid introducing bias by fine tuning to the present data. The
WEKA machine learning package3 (Witten and Frank 2000) was used to generate SVM,
C4.5 and Naïve Bayes classifiers.
Feature Subset Selection - The Wrapper approach
In the feature subset selection problem, a learning algorithm must select some subset of
features upon which to focus its attention, while ignoring the rest. Generally speaking,
there are two major components in the feature selection algorithm: generation procedure
and the evaluation function (Dash and Liu 1997). After the starting point in the feature
space has been determined, the former performs a search procedure that generates
subsets of features for evaluation. Depending on the feature selection search algorithm,
the generation procedure can start with no features, with all features or with a random
subset of features. If the starting point is chosen with no features then the algorithm
successively adds features from this starting point. This is known as forward selection.
If however, a starting point with all features is chosen the algorithm successively
removes what are considered irrelevant features; this is known as backward elimination.
In addition, it is possible to choose a random starting point, and then features are
3 http://www.cs.waikato.ac.nz/ml/weka/
8
iteratively added or removed or produced randomly thereafter. All these procedures are
based on heuristic search algorithms.
After generating the subset of features, an evaluation function measures the goodness of
the subset, and this value is compared with the previous best (Dash and Liu 1997).
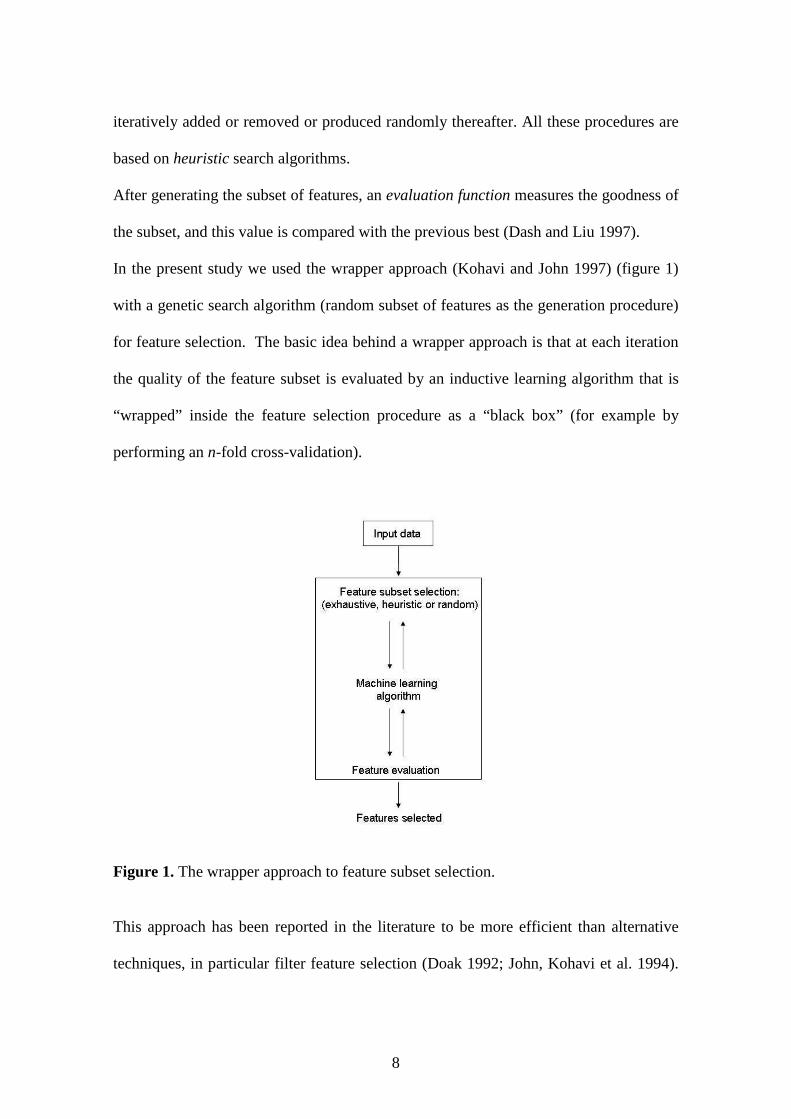
In the present study we used the wrapper approach (Kohavi and John 1997) (figure 1)
with a genetic search algorithm (random subset of features as the generation procedure)
for feature selection. The basic idea behind a wrapper approach is that at each iteration
the quality of the feature subset is evaluated by an inductive learning algorithm that is
“wrapped” inside the feature selection procedure as a “black box” (for example by
performing an n-fold cross-validation).
Figure 1. The wrapper approach to feature subset selection.
This approach has been reported in the literature to be more efficient than alternative
techniques, in particular filter feature selection (Doak 1992; John, Kohavi et al. 1994).
9
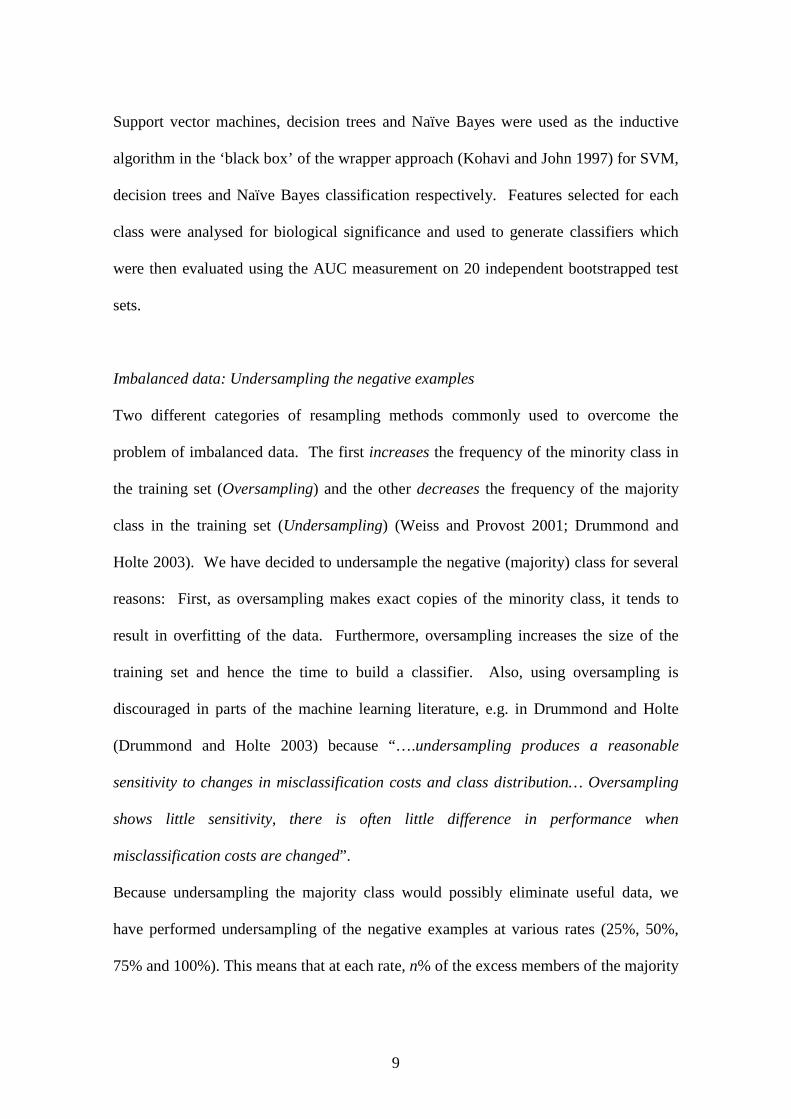
Support vector machines, decision trees and Naïve Bayes were used as the inductive
algorithm in the ‘black box’ of the wrapper approach (Kohavi and John 1997) for SVM,
decision trees and Naïve Bayes classification respectively. Features selected for each
class were analysed for biological significance and used to generate classifiers which
were then evaluated using the AUC measurement on 20 independent bootstrapped test
sets.
Imbalanced data: Undersampling the negative examples
Two different categories of resampling methods commonly used to overcome the
problem of imbalanced data. The first increases the frequency of the minority class in
the training set (Oversampling) and the other decreases the frequency of the majority
class in the training set (Undersampling) (Weiss and Provost 2001; Drummond and
Holte 2003). We have decided to undersample the negative (majority) class for several
reasons: First, as oversampling makes exact copies of the minority class, it tends to
result in overfitting of the data. Furthermore, oversampling increases the size of the
training set and hence the time to build a classifier. Also, using oversampling is
discouraged in parts of the machine learning literature, e.g. in Drummond and Holte
(Drummond and Holte 2003) because “….undersampling produces a reasonable
sensitivity to changes in misclassification costs and class distribution… Oversampling
shows little sensitivity, there is often little difference in performance when
misclassification costs are changed” .
Because undersampling the majority class would possibly eliminate useful data, we
have performed undersampling of the negative examples at various rates (25%, 50%,
75% and 100%). This means that at each rate, n% of the excess members of the majority
10
class were randomly removed. For example, if the minority class contains 100
members, and the majority class has 500 members, then undersampling at 50% removes
200 ((500-100)*50%) random members of the majority class from the dataset.
Therefore, an undersampling rate of 0% means the full data set without undersampling
and 100% implies fully balanced data.
Feature Selection with Undersampling using SVM and decision trees
Building on our previous performance analysis of feature selection (Al-Shahib, He et al.
2004) we also tested the effect of combining undersampling and feature selection on
SVMs and C4.5. Naïve Bayes classifiers were not generated in this case as the
classifier does take class distribution into consideration when learning, and thus should
not be affected by undersampling.
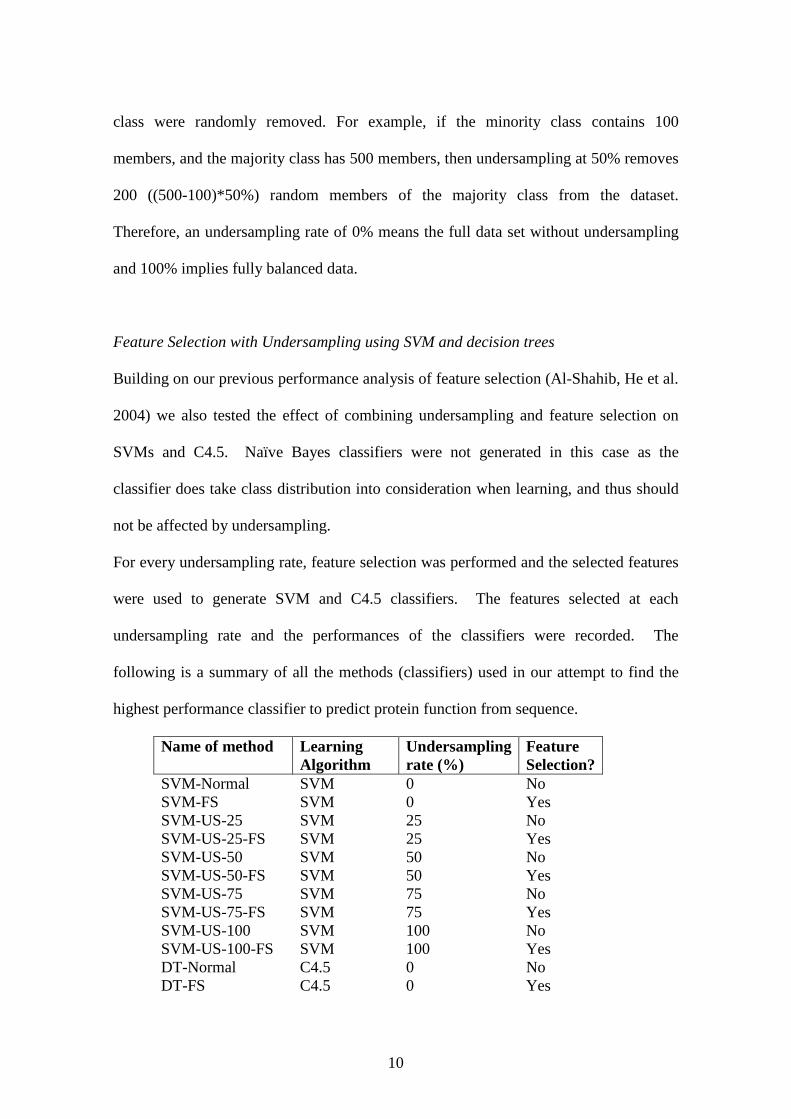
For every undersampling rate, feature selection was performed and the selected features
were used to generate SVM and C4.5 classifiers. The features selected at each
undersampling rate and the performances of the classifiers were recorded. The
following is a summary of all the methods (classifiers) used in our attempt to find the
highest performance classifier to predict protein function from sequence.
Name of method Learning Algorithm
Undersampling rate (%)
Feature Selection?
SVM-Normal SVM 0 No SVM-FS SVM 0 Yes SVM-US-25 SVM 25 No SVM-US-25-FS SVM 25 Yes SVM-US-50 SVM 50 No SVM-US-50-FS SVM 50 Yes SVM-US-75 SVM 75 No SVM-US-75-FS SVM 75 Yes SVM-US-100 SVM 100 No SVM-US-100-FS SVM 100 Yes DT-Normal C4.5 0 No DT-FS C4.5 0 Yes
11
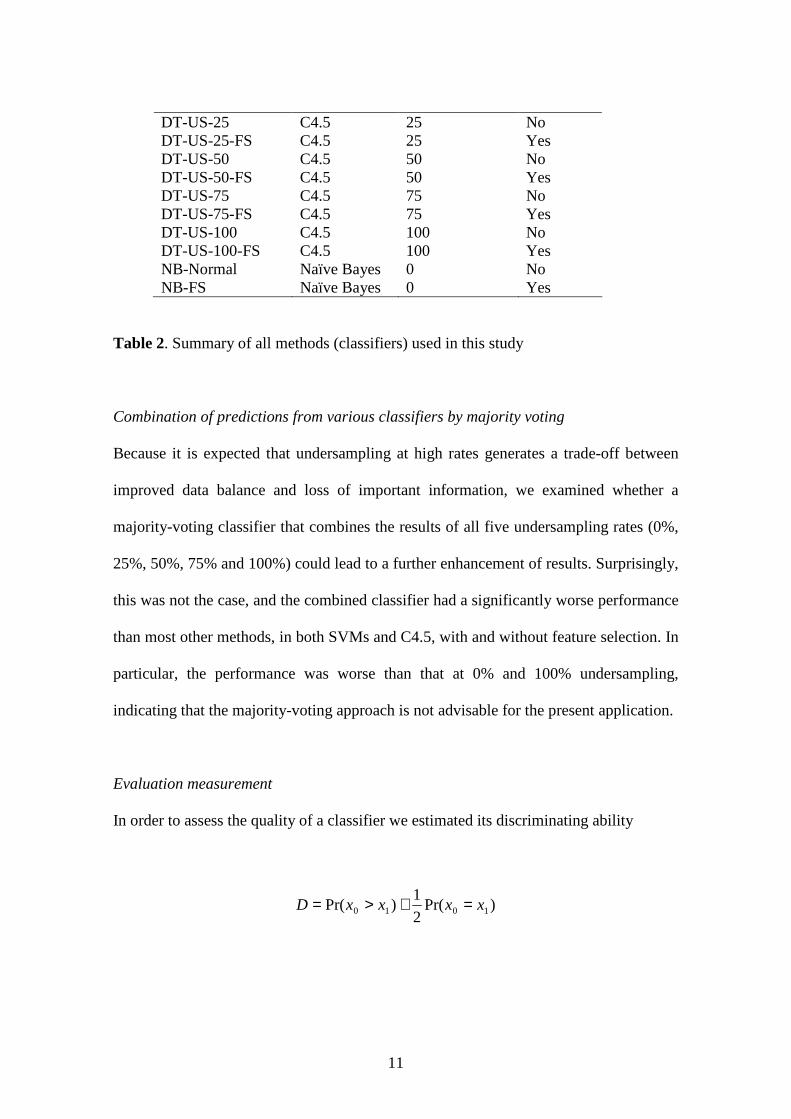
DT-US-25 C4.5 25 No DT-US-25-FS C4.5 25 Yes DT-US-50 C4.5 50 No DT-US-50-FS C4.5 50 Yes DT-US-75 C4.5 75 No DT-US-75-FS C4.5 75 Yes DT-US-100 C4.5 100 No DT-US-100-FS C4.5 100 Yes NB-Normal Naïve Bayes 0 No NB-FS Naïve Bayes 0 Yes
Table 2. Summary of all methods (classifiers) used in this study
Combination of predictions from various classifiers by majority voting
Because it is expected that undersampling at high rates generates a trade-off between
improved data balance and loss of important information, we examined whether a
majority-voting classifier that combines the results of all five undersampling rates (0%,
25%, 50%, 75% and 100%) could lead to a further enhancement of results. Surprisingly,
this was not the case, and the combined classifier had a significantly worse performance
than most other methods, in both SVMs and C4.5, with and without feature selection. In
particular, the performance was worse than that at 0% and 100% undersampling,
indicating that the majority-voting approach is not advisable for the present application.
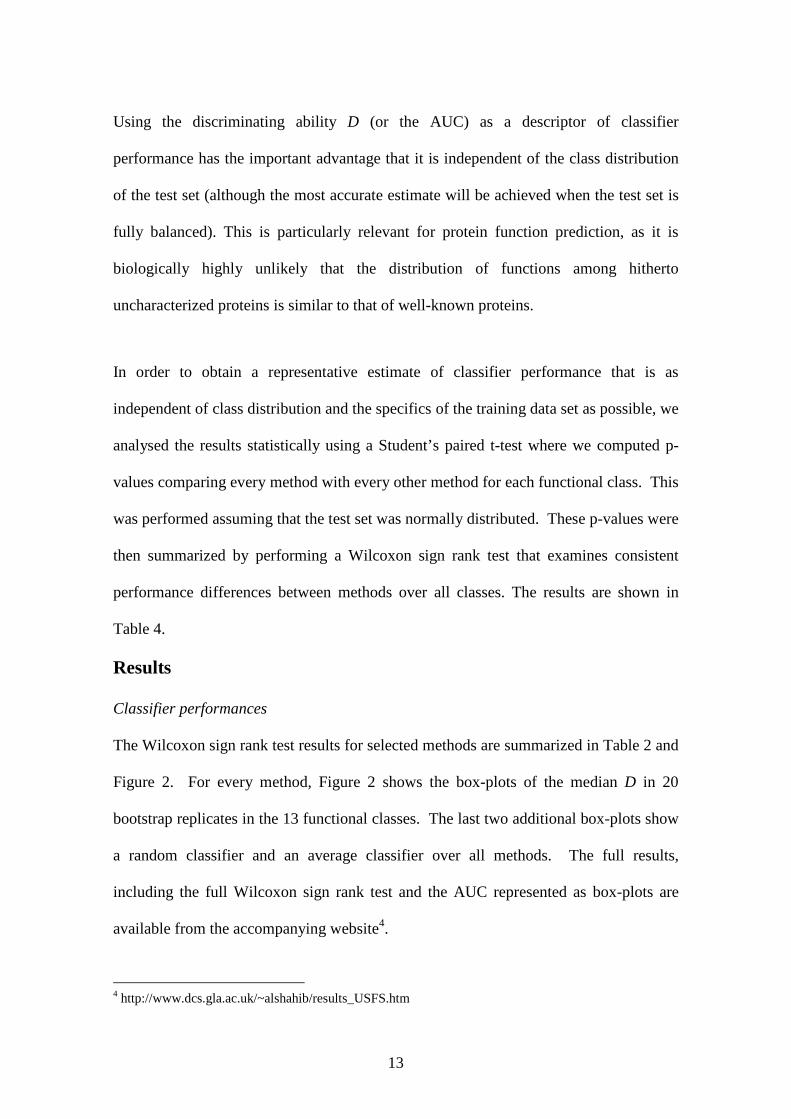
Evaluation measurement
In order to assess the quality of a classifier we estimated its discriminating ability
)Pr(2
1)Pr( 1010 xxxxD =+>=

12
where x0 is the test score of a random class member and x1 the score of random non-
class member. D is the probability that the classifier is able to make the correct
assignment when presented with a random member and a random non-member of the
class. In the case of a binary classifier with scores { 0,1} D can be simply estimated as
TNRTPRFNRTNRFPRTPRTNRTPRD2
1
2
1)(
2
1ˆ +×+×+×=
where TPR is the true positive rate TP/(TP+FN) and TNR is the true negative rate
TN/(TN+FP), and correspondingly for the false positive and false negative rate.
For a classifier which produces continuous scores for each decision, a non-parametric
estimate of D is provided by the Area Under the Receiver Operating Characteristic
(ROC) curve (Bamber 1975; Gribskov and Robinson 1996):
�∞
∞−
≥=== )Pr()()(ˆ1010 xxxdFxFAUCD
where F0 is the distribution function of test scores in the class members, and F1 the
distribution for non-class members. Incidentally, this corresponds to the relative
treatment effect that is also estimated by the Wilcoxon rank sum or Mann-Whitney-U
statistic, which yields a summary index of the accuracy of a diagnostic (i.e.
classificatory) test.
13
Using the discriminating ability D (or the AUC) as a descriptor of classifier
performance has the important advantage that it is independent of the class distribution
of the test set (although the most accurate estimate will be achieved when the test set is
fully balanced). This is particularly relevant for protein function prediction, as it is
biologically highly unlikely that the distribution of functions among hitherto
uncharacterized proteins is similar to that of well-known proteins.
In order to obtain a representative estimate of classifier performance that is as
independent of class distribution and the specifics of the training data set as possible, we
analysed the results statistically using a Student’s paired t-test where we computed p-
values comparing every method with every other method for each functional class. This
was performed assuming that the test set was normally distributed. These p-values were
then summarized by performing a Wilcoxon sign rank test that examines consistent
performance differences between methods over all classes. The results are shown in
Table 4.
Results
Classifier performances
The Wilcoxon sign rank test results for selected methods are summarized in Table 2 and
Figure 2. For every method, Figure 2 shows the box-plots of the median D in 20
bootstrap replicates in the 13 functional classes. The last two additional box-plots show
a random classifier and an average classifier over all methods. The full results,
including the full Wilcoxon sign rank test and the AUC represented as box-plots are
available from the accompanying website4.
4 http://www.dcs.gla.ac.uk/~alshahib/results_USFS.htm
14
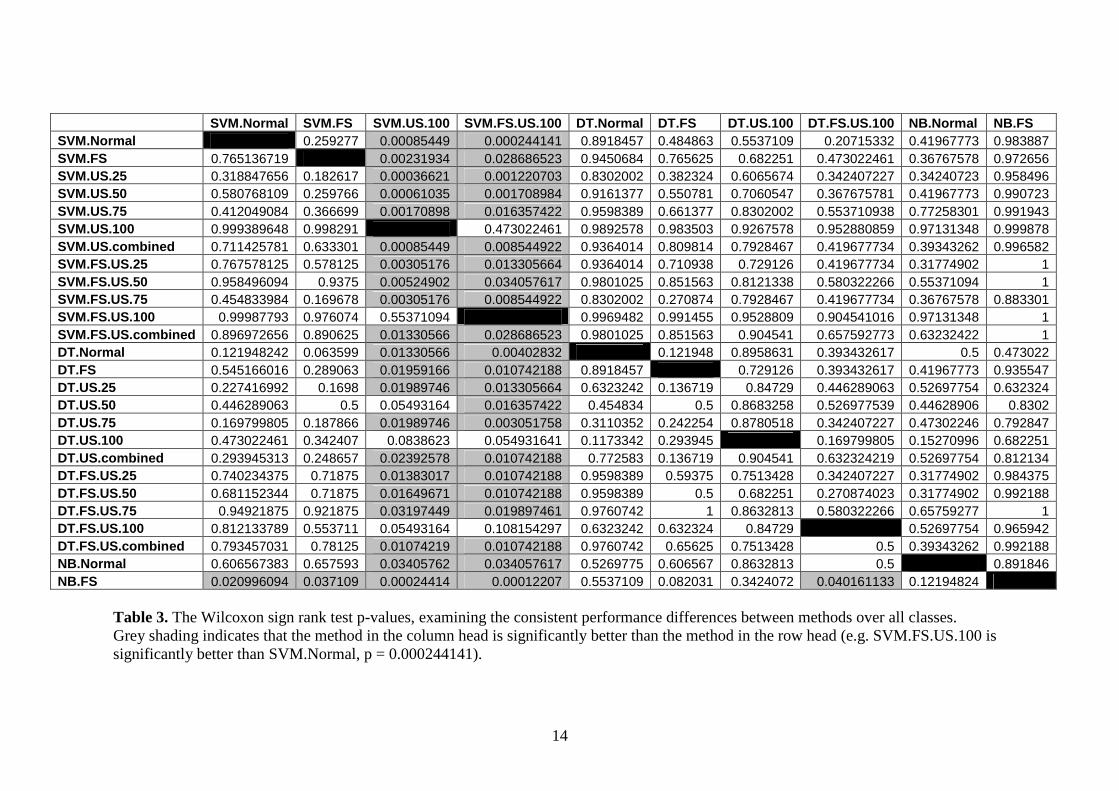
SVM.Normal SVM.FS SVM.US.100 SVM.FS.US.100 DT.Normal DT.FS DT.US.100 DT.FS.US.100 NB.Normal NB.FS SVM.Normal 0.259277 0.00085449 0.000244141 0.8918457 0.484863 0.5537109 0.20715332 0.41967773 0.983887 SVM.FS 0.765136719 0.00231934 0.028686523 0.9450684 0.765625 0.682251 0.473022461 0.36767578 0.972656 SVM.US.25 0.318847656 0.182617 0.00036621 0.001220703 0.8302002 0.382324 0.6065674 0.342407227 0.34240723 0.958496 SVM.US.50 0.580768109 0.259766 0.00061035 0.001708984 0.9161377 0.550781 0.7060547 0.367675781 0.41967773 0.990723 SVM.US.75 0.412049084 0.366699 0.00170898 0.016357422 0.9598389 0.661377 0.8302002 0.553710938 0.77258301 0.991943 SVM.US.100 0.999389648 0.998291 0.473022461 0.9892578 0.983503 0.9267578 0.952880859 0.97131348 0.999878 SVM.US.combined 0.711425781 0.633301 0.00085449 0.008544922 0.9364014 0.809814 0.7928467 0.419677734 0.39343262 0.996582 SVM.FS.US.25 0.767578125 0.578125 0.00305176 0.013305664 0.9364014 0.710938 0.729126 0.419677734 0.31774902 1 SVM.FS.US.50 0.958496094 0.9375 0.00524902 0.034057617 0.9801025 0.851563 0.8121338 0.580322266 0.55371094 1 SVM.FS.US.75 0.454833984 0.169678 0.00305176 0.008544922 0.8302002 0.270874 0.7928467 0.419677734 0.36767578 0.883301 SVM.FS.US.100 0.99987793 0.976074 0.55371094 0.9969482 0.991455 0.9528809 0.904541016 0.97131348 1 SVM.FS.US.combined 0.896972656 0.890625 0.01330566 0.028686523 0.9801025 0.851563 0.904541 0.657592773 0.63232422 1 DT.Normal 0.121948242 0.063599 0.01330566 0.00402832 0.121948 0.8958631 0.393432617 0.5 0.473022 DT.FS 0.545166016 0.289063 0.01959166 0.010742188 0.8918457 0.729126 0.393432617 0.41967773 0.935547 DT.US.25 0.227416992 0.1698 0.01989746 0.013305664 0.6323242 0.136719 0.84729 0.446289063 0.52697754 0.632324 DT.US.50 0.446289063 0.5 0.05493164 0.016357422 0.454834 0.5 0.8683258 0.526977539 0.44628906 0.8302 DT.US.75 0.169799805 0.187866 0.01989746 0.003051758 0.3110352 0.242254 0.8780518 0.342407227 0.47302246 0.792847 DT.US.100 0.473022461 0.342407 0.0838623 0.054931641 0.1173342 0.293945 0.169799805 0.15270996 0.682251 DT.US.combined 0.293945313 0.248657 0.02392578 0.010742188 0.772583 0.136719 0.904541 0.632324219 0.52697754 0.812134 DT.FS.US.25 0.740234375 0.71875 0.01383017 0.010742188 0.9598389 0.59375 0.7513428 0.342407227 0.31774902 0.984375 DT.FS.US.50 0.681152344 0.71875 0.01649671 0.010742188 0.9598389 0.5 0.682251 0.270874023 0.31774902 0.992188 DT.FS.US.75 0.94921875 0.921875 0.03197449 0.019897461 0.9760742 1 0.8632813 0.580322266 0.65759277 1 DT.FS.US.100 0.812133789 0.553711 0.05493164 0.108154297 0.6323242 0.632324 0.84729 0.52697754 0.965942 DT.FS.US.combined 0.793457031 0.78125 0.01074219 0.010742188 0.9760742 0.65625 0.7513428 0.5 0.39343262 0.992188 NB.Normal 0.606567383 0.657593 0.03405762 0.034057617 0.5269775 0.606567 0.8632813 0.5 0.891846 NB.FS 0.020996094 0.037109 0.00024414 0.00012207 0.5537109 0.082031 0.3424072 0.040161133 0.12194824
Table 3. The Wilcoxon sign rank test p-values, examining the consistent performance differences between methods over all classes. Grey shading indicates that the method in the column head is significantly better than the method in the row head (e.g. SVM.FS.US.100 is significantly better than SVM.Normal, p = 0.000244141).

15
SVM.NormalSVM.FS
SVM.US.100SVM.FS.US.100
DT.NormalDT.FS
DT.US.100DT.FS.US.100
NB.NormalNB.FS
AverageRandom
0.0
0.2
0.4
0.6
0.8
1.0
methods
AUC
**
Figure 2. Box-plots showing the performance of methods based on the AUC. Refer to
table 2 for method definition. Each box-plot shows 13 median points, each median
calculated from 20 bootstrap AUCs of each functional class. The stars indicate that the
method is significantly better than the average of all the methods.
Class.1 Class.2 Class.3 Class.4 Class.5 Class.6 Class.7 Class.8 Class.9 Class.10 Class.11 Class.12 Class.13
0.0
0.2
0.4
0.6
0.8
1.0
methods
AU
C
****
** ** ** ** * ** * ** **
Figure 3. Box-plots showing the performance of each functional class in 20 bootstrap
replicates for SVM classifiers based on the AUC generated from fully balanced and
feature selected data (SVM-US-100-FS). The two stars and one star indicate that the
method is significantly better than a random classifier with p < 0.001, and p< 0.01
respectively.

16
The first interesting observation is the very similar performance of SVM, decision trees
and Naïve Bayes classifiers when the data is imbalanced and uses the full feature set,
suggesting that for the original data set multiple learning algorithms generate very
similar accuracy of classifiers. Feature selection leads to a slight improvement for both
SVMs and decision trees, but has a negative effect on the Naïve Bayes classifiers.
However, while the effect of feature selection is noticeable, but of marginal statistical
significance, undersampling leads to a dramatic improvement of SVM performance.
The improvement upon undersampling was, however, only obtained once the data set
was fully balanced, not for partial undersampling. The best performance was obtained
for SVM classifiers with fully balanced feature-selected data. As shown in Figure 2 and
table 3, these accurate classifiers do better than all other methods tested as well as being
the classifiers that significantly outperforms the average classifier over all methods.
This high performance of SVM classifiers with fully balanced feature-selected data has
also been shown throughout 11 of the 13 binary functional class classifiers (figure 3).
Features Selected and De-selected – Biological analysis
Five wrapper feature selections were performed for each class (at 0%, 25%, 50%, 75%
and 100% undersampling rates). At every feature selection stage, the features selected
and de-selected by the wrapper approach were recorded and analysed. On average
about 200 features were maintained at each selection stage, including about half of the
400 amino acid pair ratios, which were initially expected to be relatively uninformative.
The dipeptides phenylalanine-cysteine (FC) and glycine-aspartic acid (GD) were
frequently selected by the wrapper approach. It is difficult to biologically explain the
dipeptide features selected in each case. It is possible that specific dipeptides are a

17
molecular signal related to a particular function or targeting mechanism, and the feature
selection algorithm has chosen this feature indicating this signal.
From the composition of the 20 amino acids, we also observed 45-50% being selected,
and again the biological reason for this is unclear. In addition, a number of the
remaining features, which have traditionally been used for functional analysis, were also
selected in many cases, but without a clear trend towards biologically “more
informative” , i.e. traditional features. This indicates that our biological and biophysical
understanding of the relationship between protein sequence and function is still in its
infancy – making the use of powerful machine learning techniques even more
important.
Discussion
In this study, we show that undersampling of the majority class and feature selection in
combination with generating SVM classifiers is an important step towards predicting
protein function from sequence. This finding was made as a result of our curiosity
concerning two obstacles encountered when predicting protein function from sequence
using machine learning. Firstly, the possible number of features that can be extracted
from a protein sequence is almost unlimited, but most of them will be uninformative
and only contribute noise - finding discriminatory chemical and/or physical features that
map protein sequence to biological function thus is vital for achieving highly accurate
classifiers. Secondly, protein function prediction has to work in a highly imbalanced
environment, which creates a well-known machine learning challenge, namely that
classifiers tend to become biased towards the majority class (Weiss and Provost 2001).

18
Some protein classes are more abundant and perform a more frequent role in the cell
than others. For example, transport and binding proteins are quite diverse in the cell as
they have to transport a multitude of diverse substances into and out of the cell, whereas
proteins involved in fatty acid and phospholipids metabolism have well-delimited
functions, act on a small, circumscribed set of substrates, and are far less diverse. In
addition, the problem is aggravated by the incomplete annotation, which tends to be
biased towards specific protein types.
To address these two problems we performed feature selection and undersampling in
combination with various learning approaches. To lessen the possibility of removing
informative examples from our training set, we performed undersampling at different
rates, ranging from 0% (imbalanced) to 100 % (balanced). The following discussion
summarizes some of the main findings of this study:
1. There are no significant differences between SVM, C4.5, and Naïve Bayes when
used with imbalanced data and full feature sets. This confirms the observation
of Huang J et al (Huang, Jingjing et al. 2003) that the average predictive AUC
values for Naïve Bayes, decision trees and SVM are very similar. Also, none of
these classifiers performs consistently better than a random predictor.
2. SVM classifiers with selected feature sets are better than SVM classifiers with
full feature set. When predicting protein function from sequence features, the
learning algorithm finds discriminatory features that would optimally separate
between any two types of functional classes. Thus obtaining discriminatory
features is essential for accurately predicting protein function from sequence.
Performing feature selection has two further advantages. First, by achieving

19
good or even better classifier performances with a selected feature subset, one
can reduce the computational costs for classifier generation as well as avoiding
the dimensional curse generally faced by machine learning algorithm. Secondly,
it helps the human expert to focus in a relevant subset of features, hence
providing useful biological knowledge (Guyon and Gupta 2003; Saeys,
Degroeve et al. 2003).
3. Generally, using SVM classifiers improves performance compared to decision
trees classifiers and Naïve Bayes classifiers. The reason for this may be two-
fold. Firstly, if decision trees learn in non-rectangular regions then they tend to
split the classes by generating a hyperplane that is orthogonal to the axis of the
tested feature and parallel to all other axes (hyper-rectangle). A problem arises
when the distribution of the instances is such that the class regions are not
hyper-rectangularly represented in the feature space (Weiss 2003; Tan 2004).
Secondly, the so-called small disjunct problem arises when decision tree
classifiers consist of several small disjuncts, each of which is a conjunctive
hypothesis of sub-functions of the original true function, thus not representing a
conjunctive of several features that correctly approximate the target function
(Weiss 2003; Tan 2004).
Furthermore, as we have a high dimensional feature space (433) one would
expect that a well established Bayesian method such as Naïve Bayes that
assumes independence of features to perform well. However, because of the
nature of features in the protein function prediction task this is not the case. Our
features show clear dependencies to each other, and as our results show using
Naïve Bayes in this application may not be appropriate.

20
Most importantly, however, the performance of DT and NB in this task does not
improve upon undersampling and/or feature selection. This gives SVMs a
distinct advantage for this application, where imbalance and high dimensionality
of the feature set cause important problems.
4. Undersampling at rates below 100% (fully balanced data) does not result in an
improvement. The reason for this may be that at the 25, 50 and 75%
undersampling rates, the ratio of positive: negative examples (|E+|:|E-|) is still
high (e.g. in 75% undersampling the ratio of |E+|:|E-| in most cases was
approximately 1:3). Therefore the data may still be too imbalanced for good
classifier performance.
5. SVM classifiers with fully balanced data outperform all other methods by a
large margin. As seen in Table 3, the methods SVM-FS-US-100 and SVM-US-
100 are significantly better than all other techniques tested in our study. In
particular, they perform significantly better than using either full feature sets
with no undersampling (SVM-Normal, DT-Normal and NB-Normal) or feature
selection alone (SVM-FS, NB-FS and DT-FS).
Considering all these interesting machine learning points, there is still room for further
improvement and future work. This includes incorporating additional sequence
features, such as secondary structure predictions and phylogenetic relationships, and to
use other biological datasets to refine protein function predictions. Performance may
also be improved by combining the various class-specific binary classifiers into a multi-
class predictor. We believe that the work presented here represents an important step
towards developing machine learning methods that are able to accurately predict protein

21
function in the twilight zone and thus realistically annotate the thousands of “unknown”
proteins generated by large-scale sequencing projects.
Acknowledgements
We thank Mark Girolami, Aik Choon Tan and Simon Rogers for their comments and
feedback throughout this research. Ali Al-Shahib is funded by The University of
Glasgow and Rainer Breitling is supported by a BBSRC grant (17/GG17989).
References
Al-Shahib, A., C. He, et al. (2004). An Assessment of Feature Relevance in Predicting Protein Function from Sequence. Proceedings of the Fifth International Conference on Intelligent Data Engineering and Automated Learning (IDEAL'04). Lecture Notes in Computer Science 3177: 52-57, Springer-Verlag.
Altschul, S. F., T. L. Madden, et al. (1997). "Gapped BLAST and PSI-BLAST: a new generation of protein database search programs." Nucleic Acids Research 25: 3389-3402.
An, A., N. Cercone, et al. (2001). "A Case Study for Learning from Imbalanced Data Sets." Advances in Artificial Intelligence: Proceedings of the 14th Conference of the Canadian Society for Computational Studies of Intelligence: 1-15.
Arvidson, C. G., T. Powers, et al. (1999). "Neisseria gonorrhoeae PilA is an FtsY homolog." J Bacteriol 181: 731-739.
Bamber, D. (1975). "The Area above the Ordinal Dominance Graph and the Area below the Receiver Operating Characteristic Graph." Journal of Mathematical Psychology 12: 387-415.
Bishop, C. M. (1993). "Neural Networks for Pattern Recognition." Oxford University Press.
Coissac, E., E. Maillier, et al. (1997). "A comparative study of duplications in bacteria and eukaryotes: the importance of telomeres." Mol Biol Evol. 14(10): 1062-74.
Dash, M. and H. Liu (1997). "Feature selection for classification." Intelligent Data Analysis 1(3): 131-156.
Doak, J. (1992). "An evaluation of feature-selection methods and their application to computer security." Tech. Rept, CSE-92-18, Department of Computing Science, University of California at Davis.
Drummond, C. and R. C. Holte (2003). C4.5, class imbalance, and cost sensitivity: why under-sampling beats over-sampling. Workshop on Learning from Imbalanced Datasets II.
Estabrooks, A., T. Jo, et al. (2004). "A multiple resampling method for learning from imbalanced data sets." Computational Intelligence 20(1): 18-36.
22
Gribskov, M. and N. L. Robinson (1996). "Use of receiver operating chracteristic (ROC) analysis to evaluate sequence mathcing." Computer and Chemistry 20: 25-33.
Guyon, I. and H. Gupta (2003). "An introduction to variable and feature selection." Journal of Machine Learning Research 3: 1157-1182.
Huang, J., L. Jingjing, et al. (2003). "Comparing Naive Bayes, Decision Trees, and SVM with AUC and Accuracy." ICDM: 553-556.
Japkowicz, N. and S. Stephen (2002). "The class imbalance problem: a systematic study." Intelligent Data Analysis 6(5): 429-449.
Jensen, R., H. Gupta, et al. (2003). "Prediction of human protein function according to Gene Ontology categories." Bioinformatics 19: 635-642.
John, G. H., R. Kohavi, et al. (1994). "Irrelevant features and the subset selection problem." Proceedings 11th International Conference on Machine Learning, New Brunswick, NJ (Morgan Kaufmann, San Mateo, CA): 121-129.
John, G. H. and P. Langley (1995). "Estimating continuous distributions in Bayesian classifier." Proceedings of the Eleventh Conference on Uncertainty in Artificial Intelligence. Montreal, Quebec: Morgan Kaufmann.: 399-406.
King, R. D., A. Karwath, et al. (2000). "Accurate prediction of protein functional class in the M.tuberculosis and E.coli genomes using data mining." Yeast (Comparitive and Functional Genomics 17: 283-293.
Kohavi, R. and G. H. John (1997). "Wrappers for Feature Subset Selection." Artificial Intelligence journal special issue on relevance 97(1-2): 273-324.
Platt, J. C. (1999). Fast training of support vector machines using sequential minimal optimisation. Advances in Kernal Methods - Support Vector Learning. B. Scholkopf, C. Burges and A. Smola, MIT Press: 185-208.
Quinlan, J. R. (1993). C4.5: Programs for Machine Learning, Morgan Kaufmann. Riley, M. (1993). "Functions of the gene products of Escherichia coli." Microbiol Rev
57: 862-952. Saeys, Y., S. Degroeve, et al. (2003). "Fast feature selection using a simple estimation
of distribution algorithm: a case study on splice site prediction." Bioinformatics 19: 179ii-188ii.
Tan, A. C. (2004). "Applications of ensemble machine learning to Bioinformatics." PhD thesis, Department of Computing Science, University of Glasgow.
Vapnik, V. (1998). Statistical Learning Theory, John Wiley & Sons, Inc. Weiss, G. M. (2003). The Effect of Class Disjuncts and Class Distribution on Decision
Tree Learning. Rutgers, The State University of New Jersey. Weiss, G. M. and F. Provost (2001). The effect of class distribution on classifier
learning: an empirical study. Technical Report ML-TR-44, Department of Computer Science, Rutgers University.
Whisstock, J. C. and A. M. Lesk (2003). "Prediction of protein function from protein sequence and structure." Q Rev Biophys 36(3): 307-340.
WHO (2001). Global prevalence and incidence of selected curable sexually transmitted infections, overview and estimates. Geneva, World Health Organization.
Witten, I. H. and E. Frank (2000). Data Mining: Practical machine learning tools and techniques with java implementations, Morgan Kaufmann.