features of 5-splice-site efficiency derived from disease-causing
TRANSCRIPT
Features of 5�-splice-site efficiency derived fromdisease-causing mutations and comparative genomicsXavier Roca,1 Andrew J. Olson,1 A.R. Rao,1,6 Espen Enerly,2,3 Vessela N. Kristensen,2,3
Anne-Lise Børresen-Dale,2,3 Brage S. Andresen,4,5 Adrian R. Krainer,1 andRavi Sachidanandam1,7
1Cold Spring Harbor Laboratory, Cold Spring Harbor, New York 11724, USA; 2Department of Genetics, Institute for CancerResearch, Rikshospitalet-Radiumhospitalet Medical Centre, Montebello 0310, Oslo, Norway; 3Faculty of Medicine, Universityof Oslo, Norway; 4Department of Human Genetics, Aarhus University, Aarhus 8000C, Denmark; 5Aarhus University Hospital,Sygehus 8000N, Denmark
Many human diseases, including Fanconi anemia, hemophilia B, neurofibromatosis, and phenylketonuria, can becaused by 5�-splice-site (5�ss) mutations that are not predicted to disrupt splicing, according to position weightmatrices. By using comparative genomics, we identify pairwise dependencies between 5�ss nucleotides as a conservedfeature of the entire set of 5�ss. These dependencies are also conserved in human–mouse pairs of orthologous 5�ss.Many disease-associated 5�ss mutations disrupt these dependencies, as can some human SNPs that appear to altersplicing. The consistency of the evidence signifies the relevance of this approach and suggests that 5�ss SNPs play arole in complex diseases.
[Supplemental material is available online at www.genome.org.]
The sequenced genomes of a wide range of organisms allow glo-bal, comparative analyses of regulatory sequences. The genomicset of splice-site sequences corresponds to a large-scale splicingexperiment performed by nature under evolutionary constraints.Here we focus on 5�-splice-site (5�ss) sequences of the U2-typeGT-AG class, which comprise over 98% of all splice sites, and usedisease-causing mutations, human single nucleotide polymor-phisms (SNPs), and variations in natural splice sites in the ge-nome (within and between species) to infer properties inherentto 5�ss, with important implications for human genetics.
Splice sites are conserved sequences at both ends of an in-tron that are recognized during the initial steps of splicing (Hast-ings and Krainer 2001; Brow 2002; Jurica and Moore 2003). Boththe 5�ss and the 3� splice site (3�ss) conform to degenerate motifsthat are recognized by specific splicing factors. The U2-type GT-AG 5�ss, spanning 3 nucleotides (nt) at the 3� end of the exon and6 nt at the 5� end of the intron, is initially recognized via basepairing to the 5� end of the U1 snRNA (Fig. 1; Zhuang and Weiner1986; Séraphin et al. 1988; Siliciano and Guthrie 1988). Later inthe reaction, U5 and U6 snRNAs base pair to exonic or intronic5�ss positions, respectively (Newman and Norman 1992; Wassar-man and Steitz 1992; Kandels-Lewis and Séraphin 1993; Lesserand Guthrie 1993; Crotti et al. 2007). Additional elements influ-ence splice-site selection, such as exonic or intronic splicing en-hancers (ESE, ISE) or silencers (ESS, ISS) (Cartegni et al. 2002;Ladd and Cooper 2002).
Even though the mammalian 5�ss consensus sequence(CAG|GTAAGT) is perfectly complementary to the 5� end of U1snRNA, individual 5�ss exhibit considerable variation at different
positions, indicating a tolerance for mismatches in U1 base pair-ing. The free energy of the 5�ss/U1 base pairing is not always agood predictor of 5�ss efficiency (Roca et al. 2005), suggesting theexistence of other factors that influence 5�ss selection. It isknown that proteins such as the U1-C polypeptide (Du and Ros-bash 2002), which is a component of the U1 snRNP, PRPF8 (alsoknown as PRP8) (Maroney et al. 2000), and members of the SRand hnRNP protein families (Mayeda and Krainer 1992; Cácereset al. 1994; Buratti et al. 2004) are also involved in 5�ss selection.Most methods for estimating 5�ss efficiency are based on positionweight matrices (PWMs) that are calculated from collections ofsplice sites (for a depiction of a PWM, see Methods and Fig. 1)(Shapiro and Senapathy 1987; Senapathy et al. 1990). Comparedwith PWMs, which assume independence between positionswithin the 5�ss, methods that have considered the dependenciesbetween these positions (Brunak et al. 1991; Yeo and Burge 2004)have provided some improvements in predicting 5�ss efficiency(Roca et al. 2003, 2005; Buratti et al. 2007). Such analyses havebeen previously carried out on smaller data sets (Burge and Karlin1997; Carmel et al. 2004) or implicitly considered in various 5�ssscoring algorithms (Brunak et al. 1991; Yeo and Burge 2004;Krawczak et al. 2007).
Mutations at 5�ss are frequent among mutations that causehuman disease, from genetic disorders to cancer (Krawczak et al.1992; Nakai and Sakamoto 1994; Teraoka et al. 1999; Stenson etal. 2003; Buratti et al. 2007). In many cases, the mutations causeaberrant splicing by affecting the invariant GT dinucleotide atpositions +1 and +2 of the 5�ss. However, the effects of otherdisease-causing 5�ss mutations are less clear-cut: Nucleotide sub-stitutions affecting the less conserved positions can cause splic-ing defects in some but not all 5�ss, suggesting that the remaining5�ss positions and/or the overall context dictate the extent towhich splicing is disrupted.
We present a comprehensive analysis of the pairwise asso-ciations between nucleotides at different 5�ss positions, using the
6Present address: IASRI, New Delhi 110012, India.7Corresponding author.E-mail [email protected]; fax (516) 367-8389.Article published online before print. Article and publication date are at http://www.genome.org/cgi/doi/10.1101/gr.6859308. Freely available onlinethrough the Genome Research Open Access option.
Letter
18:000–000 ©2008 by Cold Spring Harbor Laboratory Press; ISSN 1088-9051/08; www.genome.org Genome Research 1www.genome.org
Cold Spring Harbor Laboratory Press on January 30, 2018 - Published by genome.cshlp.orgDownloaded from

splice-site compilation from SpliceRack (Sheth et al. 2006), whichis a collection of more than 500,000 splice sites from five ge-nomes. We explicitly and exhaustively identify combinationsthat appear to be significant. We show that there are constraintson combinations of nucleotides at different positions of the 5�ss.We further show that these constraints are indeed operational inthe evolutionary process using four data sets: disease-causing mu-tations at 5�ss, orthologous pairs of 5�ss between mouse and hu-man, SNPs at 5�ss, and simulated SNPs. It is remarkable that allthese disparate sources of information seem to be consistent witha single explanation: that the pairwise associations between po-sitions of the 5�ss are a determinant of 5�ss efficiency.
Results
The primary determinant of the efficiency of a 5�ss is its match tothe PWM (Zhuang and Weiner 1986; Séraphin et al. 1988; Sili-ciano and Guthrie 1988) given by the log-odds score (Methods),which reflects, at least in part, the stability of base pairing to theU1 snRNA 5� end (Fig. 1). However, many 5�ss with similar PWMscores show differences in splicing efficiency, suggesting second-ary effects that are ignored by the PWM. To study additionaldeterminants of 5�ss efficiency, we have analyzed the associa-tions between pairs of nucleotides at different positions of theU2-type GT-AG 5�ss in five species: Homo sapiens, Mus musculus,Drosophila melanogaster, Caenorhabditis elegans, and Arabidopsisthaliana.
Two-nucleotide associations
PWMs for each of the five species can be calculated from thegenomic 5�ss data in SpliceRack (Sheth et al. 2006), consisting of
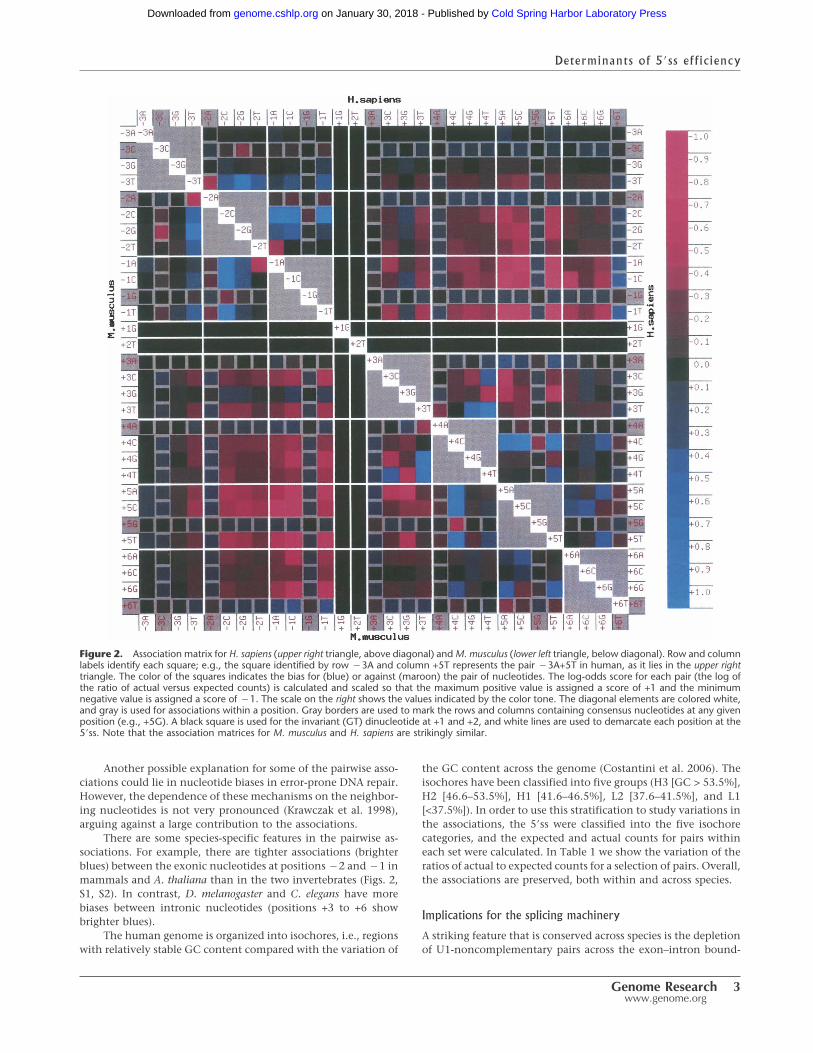
183,678 H. sapiens 5�ss, 174,671 M. musculus 5�ss, 40,367 D. me-lanogaster 5�ss, 93,699 C. elegans 5�ss, and 111,351 A. thaliana5�ss. The PWMs are calculated by counting the occurrences ofnucleotides at each position within the 5�ss. The expected occur-rence of pairs of nucleotides at two positions, e.g., A at +4 and Gat +5, can be calculated from the PWM frequencies by assumingindependence between the two positions (for nomenclature ofpositions in 5�ss, see Fig. 1). The actual frequency of occurrencefor such pairs can be measured from the genomic data, by count-ing the occurrence of pairs of nucleotides (16 possible combina-tions) at all possible combinations of positions (21 unique com-binations, if the +1 and +2 invariant positions are excluded). Thedeviations of the actual count from the expected count are mea-sured using a log-odds scoring scheme (see Methods), and forvisualization, the results are scaled and shown on a colored ma-trix. A combined matrix showing data from M. musculus and H.sapiens is depicted in Figure 2; a matrix for C. elegans and A.thaliana is shown in Supplemental Figure S1; and the D. melano-gaster matrix is shown in Supplemental Figure S2.
The surprising observation is that the pattern of deviationsof the actual counts from the expected counts is, to a great ex-tent, conserved between species. This suggests that these patternsof deviation are a result of the mechanisms of 5�ss recognition bythe splicing machinery (e.g., cf. upper and lower triangles in Fig.2 as well as Supplemental Figs. S1, S2). The mouse and humanpatterns show remarkably close similarity. We show the variabil-ity for a few pairs within the human genome and across genomesin Table 1. There are some differences, but the overall patterns ofdeviation are clearly preserved and presumably reflect the pres-sures that arise from the conservation of the splicing machinery.
The depletion (maroon coloration) in the parts of the matrixthat connect the exonic and intronic portions of the 5�ss is astriking feature in all species (Figs. 2, S1, S2; see associations be-tween positions �2 or �1 and positions +3, +4, +5, or +6). Thisimplies that having a nonconsensus nucleotide on the exonicside causes a depletion of nonconsensus nucleotides on the in-tronic side, and vice versa, which is consistent with the proposalof a seesaw linkage pattern (Burge and Karlin 1997; Carmel et al.2004). Some combinations are surprising in the distance theyspan, such as the enhancement of the pair �1T+6T. The pair�1C+3C shows a strong depletion in all species, for reasons un-known to us. Another striking pattern is the association betweenpositions �1 and +5 wherein a G (consensus) at �1 allows anynucleotide at position +5; similarly, +5G (consensus) allows anynucleotide at �1. We show some of the conserved pairwise as-sociations in Table 1.
Some features in the pairwise association matrix might bethe result of constraints other than the splicing mechanism. Forexample, the combinations �3T�2A and �2T�1A are severelydepleted in the five species, probably because these combinationscan be part of two of the three stop codons (TAG and TAA). Thecombination +5C+6C is enriched, probably reflecting the gradualconversion of U12-type GT-AG introns into U2-type GT-AG in-trons (Burge et al. 1998; Sheth et al. 2006). From the pairwiseassociation matrix, it can be seen that the CpG dinucleotide isdepleted in higher species, whereas D. melanogaster and C. elegansdo not show such depletion, consistent with the fact that inhigher organisms CpG is underrepresented, due to methylationof the C followed by de-amination (Tweedie et al. 1997). Thespliceosome could have evolved to use patterns that might bespecies-specific, even though the drive to maintain the patternsmight come from other processes.
Figure 1. Features of the 5� splice site (5�ss). (A) Base pairing betweenthe 5� end of the U1 snRNA and the consensus 5�ss sequence. � denotespseudo-uridine, which is a modified uridine nucleotide capable of basepairing to both A and G nucleotides. The conventional numbering ofpositions relative to the exon–intron boundary is indicated. For example,in the text �1G refers to nucleotide G at position �1. (B) A pictorialrepresentation of the position weight matrix (PWM) of the human U2-type GT-AG 5�ss; the bars represent the percentages of nucleotides ateach position of the 5�ss. The actual percentages are shown below therepresentation.
Roca et al.
2 Genome Researchwww.genome.org
Cold Spring Harbor Laboratory Press on January 30, 2018 - Published by genome.cshlp.orgDownloaded from
Another possible explanation for some of the pairwise asso-ciations could lie in nucleotide biases in error-prone DNA repair.However, the dependence of these mechanisms on the neighbor-ing nucleotides is not very pronounced (Krawczak et al. 1998),arguing against a large contribution to the associations.
There are some species-specific features in the pairwise as-sociations. For example, there are tighter associations (brighterblues) between the exonic nucleotides at positions �2 and �1 inmammals and A. thaliana than in the two invertebrates (Figs. 2,S1, S2). In contrast, D. melanogaster and C. elegans have morebiases between intronic nucleotides (positions +3 to +6 showbrighter blues).
The human genome is organized into isochores, i.e., regionswith relatively stable GC content compared with the variation of
the GC content across the genome (Costantini et al. 2006). Theisochores have been classified into five groups (H3 [GC > 53.5%],H2 [46.6–53.5%], H1 [41.6–46.5%], L2 [37.6–41.5%], and L1[<37.5%]). In order to use this stratification to study variations inthe associations, the 5�ss were classified into the five isochorecategories, and the expected and actual counts for pairs withineach set were calculated. In Table 1 we show the variation of theratios of actual to expected counts for a selection of pairs. Overall,the associations are preserved, both within and across species.
Implications for the splicing machinery
A striking feature that is conserved across species is the depletionof U1-noncomplementary pairs across the exon–intron bound-
Figure 2. Association matrix for H. sapiens (upper right triangle, above diagonal) and M. musculus (lower left triangle, below diagonal). Row and columnlabels identify each square; e.g., the square identified by row �3A and column +5T represents the pair �3A+5T in human, as it lies in the upper righttriangle. The color of the squares indicates the bias for (blue) or against (maroon) the pair of nucleotides. The log-odds score for each pair (the log ofthe ratio of actual versus expected counts) is calculated and scaled so that the maximum positive value is assigned a score of +1 and the minimumnegative value is assigned a score of �1. The scale on the right shows the values indicated by the color tone. The diagonal elements are colored white,and gray is used for associations within a position. Gray borders are used to mark the rows and columns containing consensus nucleotides at any givenposition (e.g., +5G). A black square is used for the invariant (GT) dinucleotide at +1 and +2, and white lines are used to demarcate each position at the5�ss. Note that the association matrices for M. musculus and H. sapiens are strikingly similar.
Determinants of 5�ss efficiency
Genome Research 3www.genome.org
Cold Spring Harbor Laboratory Press on January 30, 2018 - Published by genome.cshlp.orgDownloaded from
ary (e.g., �1C and +5T in Fig. 2). This implies that U1 snRNArequires complementarity on at least one side of the invari-ant GT.
After U1 snRNA is displaced from the 5�ss, U5 snRNA bindsto the exonic 5�ss positions via a U-rich sequence in the invariantloop 1 (Newman and Norman 1992). However, we found thatcombinations of A nucleotides at exonic positions are not en-hanced, consistent with the finding that the U5 loop 1 is dis-pensable in vivo in yeast (O’Keefe et al. 1996).
We observed that the pair +3C+4T is enhanced in the fivespecies. This association likely reflects base pairing to the U6ACAGAG box (the nucleotides involved in base pairing to posi-tions +3 and +4 are in italics) (Wassarman and Steitz 1992; Kan-dels-Lewis and Séraphin 1993; Lesser and Guthrie 1993). Theremaining nucleotides that would base pair to U6 but not to U1do not show an association that is phylogenetically conserved.
There are a number of biased combinations that cannot beexplained by base pairing to any of these snRNAs, such as anenhancement of +4C+5C in all species, or �2C�1T in the ver-tebrates. Most importantly, these tend to be less conserved thanthe previous associations. It is possible that these combinationsare part of binding sites for proteins that influence 5�ss selection,such as U1-C, PRPF8, SR proteins, or hnRNP proteins (Mayedaand Krainer 1992; Cáceres et al. 1994; Maroney et al. 2000; Duand Rosbash 2002; Buratti et al. 2004). Whether these dinucleo-tide associations reflect a portion of a protein binding site andwhether the binding specificity of some of these proteins isslightly different between species remain to be elucidated.
Scoring the pairwise associations within 5�ss
We used the pairwise association matrix and a log-odds scoringscheme to score 5�ss for the level of association (see Methods).This allowed us to quantify the effect of 5�ss changes on splicingefficiency. We used the data sets from disease-causing mutations,SNPs at 5�ss, orthologous mouse–human 5�ss pairs, and simu-lated SNPs at 5�ss to estimate the magnitude of change in asso-ciations that can significantly alter splice-site efficiency, and
then to predict SNPs at 5�ss that can affect splicing (see below).On the Web site accompanying this article (the URL is listed atthe end of the article), we present an interactive picture thatallows exploration of this pairwise-association matrix, which canbe used to study novel SNPs and mutations at 5�ss for their pre-dicted effects on splicing.
In Table 1 we show the variations for a few pairs acrossisochores within the human genome. This establishes that, over-all, the compositional variations can change the ratios, but thetrend remains the same; depleted (enhanced) pairs are depleted(enhanced) in all sets, irrespective of the origin of the 5�ss. Mostpatterns are maintained across species, with the CpG motifs be-ing prominent exceptions. The justification for the scoringscheme lies in the conserved nature of these depletions and en-hancements and in the fact that the scoring scheme is an indi-cator of the effects of disrupting the pairwise association pat-terns.
Disease-causing mutations at 5�ss
We expected disease-causing mutations at 5�ss to be disruptive ofthe PWM scores as well as the pairwise-association scores. For thisstudy, we used 595 disease-causing 5�ss mutations from theHGMD database (Stenson et al. 2003) plus another independentset (Madsen et al. 2006), excluding mutations that affect thenearly invariant +1 and +2 positions.
The reduction in PWM scores caused by many of the muta-tions cannot, by itself, explain the severe effects on splicing, be-cause there are other pairs of functional 5�ss in the humangenome that have the same nucleotide change. Indeed, we ob-served that the natural 5�ss tend to have better pairwise-association scores than the mutant 5�ss (Fig. 3).
We picked a well-studied set among disease-causing 5�ss mu-tations, i.e., a subclass that consists of A-to-G transitions at po-sition +3, for further theoretical and experimental analyses. A(59%) and G (35%) are both conserved at position +3 (Sheth et al.2006), probably because both can base pair to a pseudo-uridinenucleotide (�), a post-transcriptionally modified uridine isomer
Table 1. A selection of pairwise associations in 5�ss and their variations within and across genomes
Pair Actual/expected (H) Ratio (C.I.) (H) Ratio (isochores) Ratio (C,D,A,M)
�3C�2G 3637/7758 0.47 (0.46–0.48) 0.341–0.578 0.714,0.813,0.700,0.437�2C�1G 9744/15,998 0.61 (0.60–0.62) 0.403–0.779 0.935,0.921,0.743,0.592�2T�1A 1095/2598 0.42 (0.405–0.443) 0.334–0.448 0.434,0.376,0.419,0.401�1C+3C 12/129 0.09 (0.051–0.135) 0.002–0.020 0.569,0.139,0.099,0.082�1C+5T 9/371 0.024 (0.01–0.04) 0.000–0.008 0.391,0.234,0.266,0.038�1G+5A 15,887/13,233 1.20 (1.196–1.202) 1.158–1.265 1.375,1.285,1.166,1.194+3T+4T 1484/538 2.758 (2.684–2.872) 1.544–3.265 2.099,2.440,1.447,2.499+3T+5T 129/352 0.366 (0.326–0.429) 0.012–0.134 0.876,0.309,0.894,0.276+3C+4T 816/556 1.467 (1.407–1.561) 1.036–2.844 0.384,1,1.436,1.679+3C+5T 111/371 0.299 (0.267–0.364) 0.005–0.255 0.327,0.120,0.819,0.261+3C+5A 74/445 0.166 (0.153–0.219) 0.041–0.204 0.159,0.162,0.635,0.181+3A+5G 75,891/86,526 0.877 (0.875–0.878) 0.858–0.933 0.896,0.932,0.883,0.892+3G+5A 1856/5753 0.322 (0.311–0.333) 0.273–0.385 0.605,0.379,0.676,0.319+4C+5C 2431/705 3.448 (3.275–3.460) 1.443–2.246 0.666,0.354,1.094,3.326+5C+6G 1206/1948 0.619 (0.595–0.649) 0.485–0.883 0.940,1.117,0.679,0.616
The confidence interval (C.I.) was established by using bootstrapping. The second and third columns show data for human splice sites, and the ratiosrefer to actual count/expected count. We also used the five types of isochores in the human genome (H) (Costantini et al. 2006) to establish the variationin the ratio of actual to expected counts (since random sampling may hide the stratification in the data). The isochores have an effect on adjacent pairsthat are CpG and on pairs that do not occur often, but the bias is always in the direction seen with the full genomic data set, confirming that thedepletion or elevation of pairs is under some selection pressure. The isochore numbers and the numbers for the species (C. elegans [C], D. melanogaster[D], A. thaliana [A], M. musculus [M]) other than H. sapiens (H) correspond to the full data set, and the confidence intervals were not determined. Notall splice sites map to isochores, and in addition, only sites that map uniquely were used in this calculation. They are shown to indicate the variabilityof the ratios across the data sets.
Roca et al.
4 Genome Researchwww.genome.org
Cold Spring Harbor Laboratory Press on January 30, 2018 - Published by genome.cshlp.orgDownloaded from

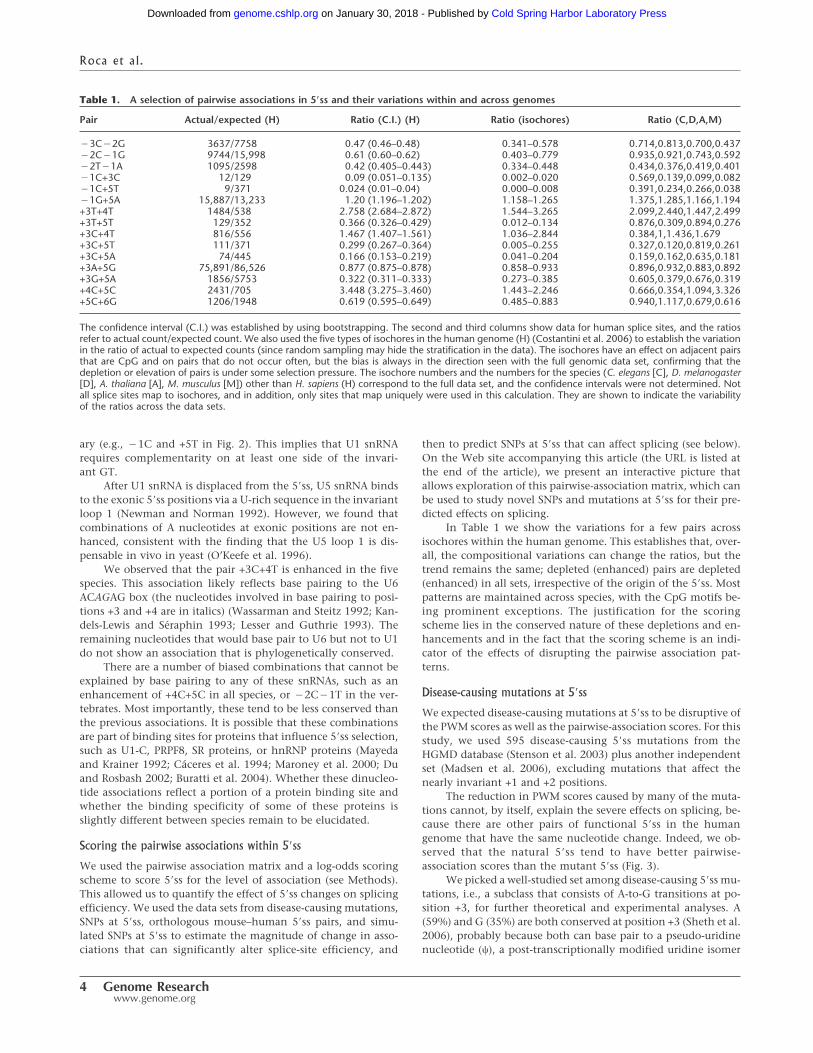
(Reddy et al. 1981) in the 5� arm of the U1 snRNA (Fig. 1). Thus,it is not obvious why the A to G mutations at +3 in genes such asACADSB (also named SBCAD), BRCA1, APC, and NF1 can causegenetic diseases (Madsen et al. 2006). It has been shown that 5�sswith disease-causing +3 A-to-G mutations exhibit two distinctfeatures: (1) They are intrinsically weak (Madsen et al. 2006); and(2) they frequently have nonconsensus nucleotides at positions+4 and +5 (for confirmation, see Fig. 4; Ohno et al. 1999; Madsenet al. 2006). Figure 4 also shows that 5�ss with G at position +3and SNPs with A/G alleles at position +3 prefer consensus nucleo-tides at +4 and +5, in agreement with the second observation.
These observations can be explained by the dependenciesbetween position +3 (A/G) and the nucleotides at positions +4and +5 (Fig. 2). The association of +3A to nonconsensus nucleo-tides at +4 (C, G, T) and +5 (A, C, T) is blue (enhanced), whereasthe association of +3G to nonconsensus nucleotides at +4 and +5is maroon (depleted). An interesting prediction is that if both +4and +5 are nonconsensus, then the splicing defect in the mutantcan be fixed by converting either +4 or +5 independently to theconsensus (see below).
Experimental tests of the associations
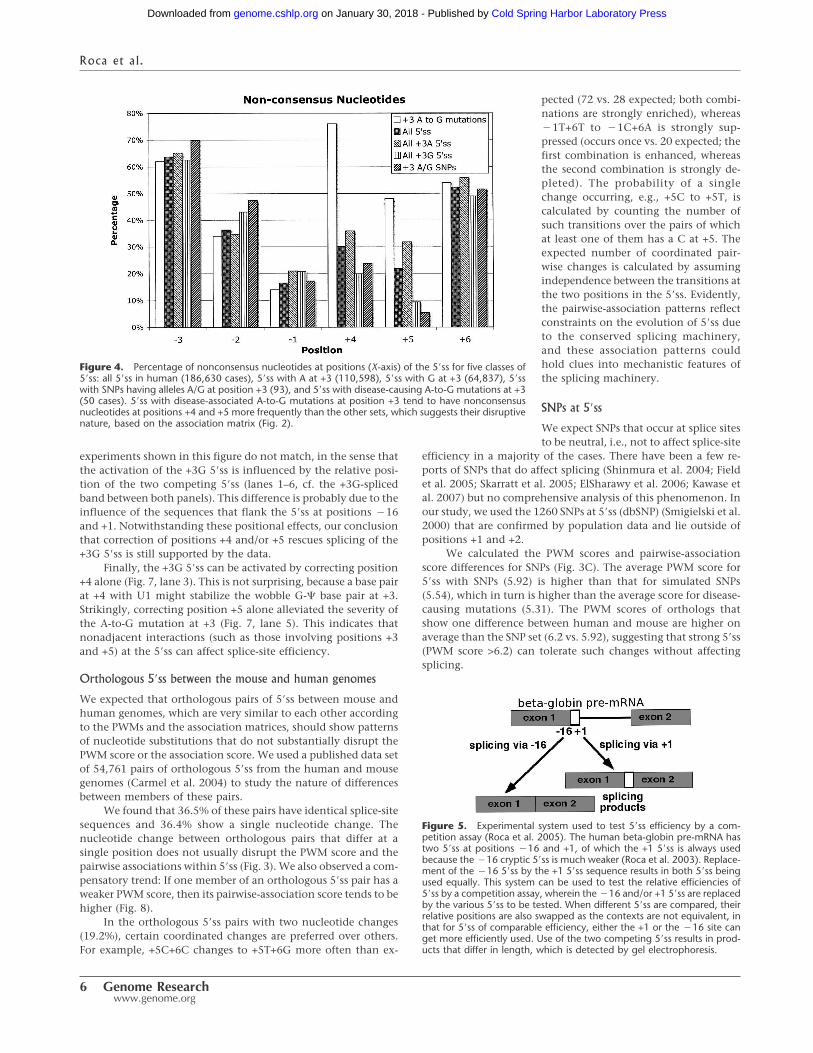
We carried out in vitro splicing experiments in order to confirmour prediction for the +3 A-to-G mutations. We used a 5�ss-competition assay described in Figure 5. We inserted variants of
the 5�ss (GGG/GUACAU) from exon 3 of the ACADSB gene intoa beta-globin (HBB) minigene, which allows direct comparison ofthe efficiencies of any two 5�ss (Roca et al. 2005). An A-to-Gmutation at position +3 of this 5�ss causes a rare metabolic dis-ease, ACADSB deficiency (Madsen et al. 2006).
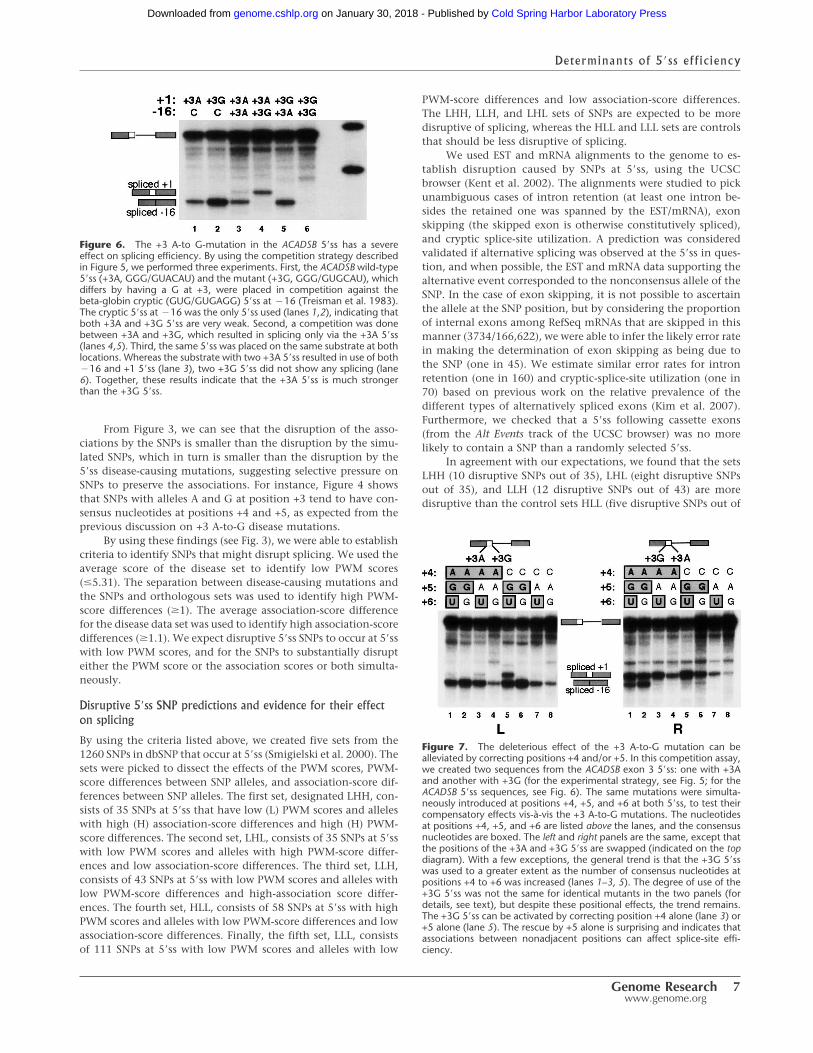
First, we found that the +3 A-to-G mutation in the ACADSB5�ss severely reduces the 5�ss strength (Fig. 6). When the ACADSBwild-type 5�ss (+3A) or its +3 A-to-G mutant version (+3G) weretested in competition against the beta-globin cryptic 5�ss at �16(Treisman et al. 1983), only the cryptic 5�ss was used (lanes 1, 2).Since the cryptic 5�ss is already a suboptimal 5�ss (Roca et al. 2003),we conclude that both the +3A and +3G 5�ss are weak. When the+3A and +3G 5�ss were competing against each other, splicingoccurred only via the +3A 5�ss (lanes 4, 5). This finding indicatesthat the +3A 5�ss is much stronger than its +3G counterpart.
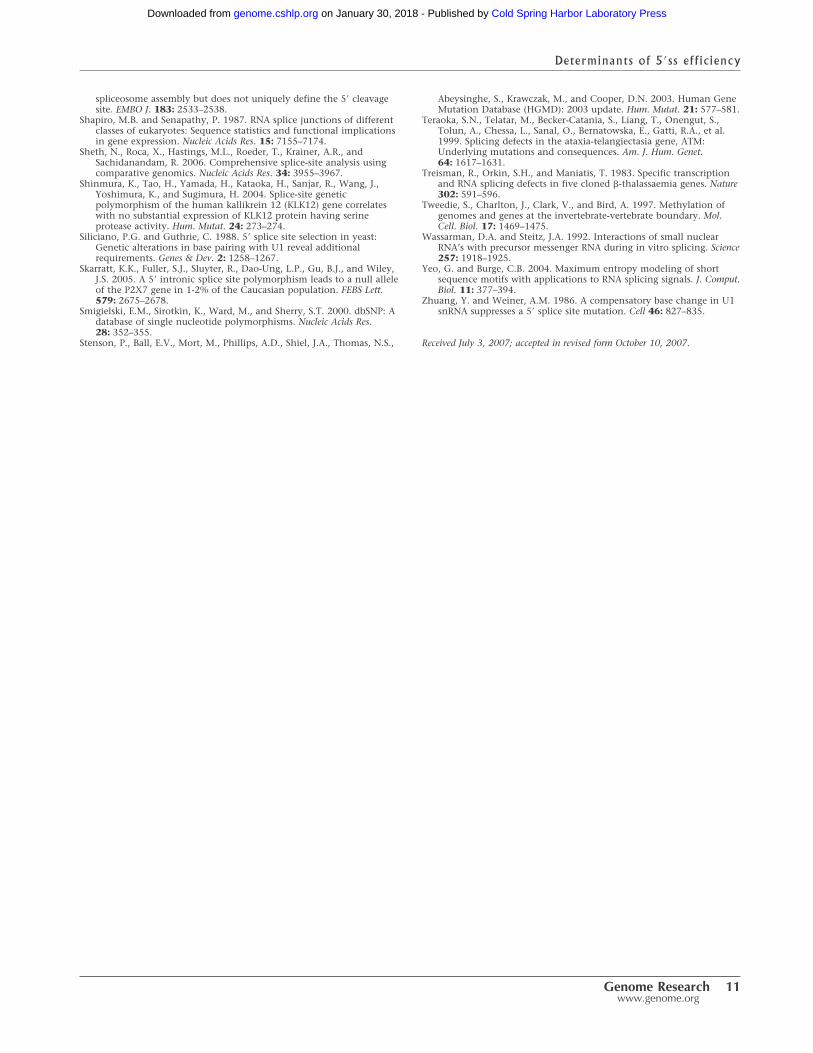
Second, we found that correcting positions +4 and/or +5 tomatch the consensus can alleviate the effects of the +3 A-to-Gmutation, which is in concordance with our above-mentionedprediction derived from the pairwise associations. To test for therescue of splicing by correcting these positions, we compared twoACADSB 5�ss with the same combination of nucleotides at posi-tions +4, +5, and +6, but one having A at +3 and the other one Gat +3 (Fig. 7). In general, we found that +3G 5�ss use was posi-tively correlated with the number of consensus nucleotides atpositions +4 to +6 (lanes 1–3, 5). However, the two reciprocal
Figure 3. Scatter plots showing combinations of PWM scores (X-axis) and association-score differences (Y-axis) for 5�ss from four data sets. The fourdata sets are disease-causing mutations (A, 595 cases), orthologous mouse–human pairs of 5�ss (B, 19,940 pairs), SNPs at 5�ss (C, 1260 SNPs), andsimulated SNPs at 5�ss (D, 8074 cases). Each spot in the data set corresponds to a 5�ss and a single-nucleotide change to the 5�ss. In each data set, alongthe X-axis, we plotted the original 5�ss PWM score; in the case of SNPs and orthologous 5�ss, the 5�ss with the higher score is considered the original5�ss. Along the Y-axis, we plotted the difference in association scores due to the change (score of original pair � score of new pair). A change to a pairwith reduced association score will give a positive score difference, and an increase in association score will give a negative value. The solid lines showthe averages along the X- and Y-axes, whereas the dashed lines show the confidence intervals for the means (calculated by a bootstrap method). Thenumbers are also given as text within the plots, with the confidence interval shown in parentheses. The disease panel is clearly biased toward low PWMscores and greater disruption of associations, compared with the other data sets. The averages for the four data sets are well separated on the basis ofthe confidence intervals.
Determinants of 5�ss efficiency
Genome Research 5www.genome.org
Cold Spring Harbor Laboratory Press on January 30, 2018 - Published by genome.cshlp.orgDownloaded from
experiments shown in this figure do not match, in the sense thatthe activation of the +3G 5�ss is influenced by the relative posi-tion of the two competing 5�ss (lanes 1–6, cf. the +3G-splicedband between both panels). This difference is probably due to theinfluence of the sequences that flank the 5�ss at positions �16and +1. Notwithstanding these positional effects, our conclusionthat correction of positions +4 and/or +5 rescues splicing of the+3G 5�ss is still supported by the data.
Finally, the +3G 5�ss can be activated by correcting position+4 alone (Fig. 7, lane 3). This is not surprising, because a base pairat +4 with U1 might stabilize the wobble G-� base pair at +3.Strikingly, correcting position +5 alone alleviated the severity ofthe A-to-G mutation at +3 (Fig. 7, lane 5). This indicates thatnonadjacent interactions (such as those involving positions +3and +5) at the 5�ss can affect splice-site efficiency.
Orthologous 5�ss between the mouse and human genomes
We expected that orthologous pairs of 5�ss between mouse andhuman genomes, which are very similar to each other accordingto the PWMs and the association matrices, should show patternsof nucleotide substitutions that do not substantially disrupt thePWM score or the association score. We used a published data setof 54,761 pairs of orthologous 5�ss from the human and mousegenomes (Carmel et al. 2004) to study the nature of differencesbetween members of these pairs.
We found that 36.5% of these pairs have identical splice-sitesequences and 36.4% show a single nucleotide change. Thenucleotide change between orthologous pairs that differ at asingle position does not usually disrupt the PWM score and thepairwise associations within 5�ss (Fig. 3). We also observed a com-pensatory trend: If one member of an orthologous 5�ss pair has aweaker PWM score, then its pairwise-association score tends to behigher (Fig. 8).
In the orthologous 5�ss pairs with two nucleotide changes(19.2%), certain coordinated changes are preferred over others.For example, +5C+6C changes to +5T+6G more often than ex-
pected (72 vs. 28 expected; both combi-nations are strongly enriched), whereas�1T+6T to �1C+6A is strongly sup-pressed (occurs once vs. 20 expected; thefirst combination is enhanced, whereasthe second combination is strongly de-pleted). The probability of a singlechange occurring, e.g., +5C to +5T, iscalculated by counting the number ofsuch transitions over the pairs of whichat least one of them has a C at +5. Theexpected number of coordinated pair-wise changes is calculated by assumingindependence between the transitions atthe two positions in the 5�ss. Evidently,the pairwise-association patterns reflectconstraints on the evolution of 5�ss dueto the conserved splicing machinery,and these association patterns couldhold clues into mechanistic features ofthe splicing machinery.
SNPs at 5�ss
We expect SNPs that occur at splice sitesto be neutral, i.e., not to affect splice-site
efficiency in a majority of the cases. There have been a few re-ports of SNPs that do affect splicing (Shinmura et al. 2004; Fieldet al. 2005; Skarratt et al. 2005; ElSharawy et al. 2006; Kawase etal. 2007) but no comprehensive analysis of this phenomenon. Inour study, we used the 1260 SNPs at 5�ss (dbSNP) (Smigielski et al.2000) that are confirmed by population data and lie outside ofpositions +1 and +2.
We calculated the PWM scores and pairwise-associationscore differences for SNPs (Fig. 3C). The average PWM score for5�ss with SNPs (5.92) is higher than that for simulated SNPs(5.54), which in turn is higher than the average score for disease-causing mutations (5.31). The PWM scores of orthologs thatshow one difference between human and mouse are higher onaverage than the SNP set (6.2 vs. 5.92), suggesting that strong 5�ss(PWM score >6.2) can tolerate such changes without affectingsplicing.
Figure 4. Percentage of nonconsensus nucleotides at positions (X-axis) of the 5�ss for five classes of5�ss: all 5�ss in human (186,630 cases), 5�ss with A at +3 (110,598), 5�ss with G at +3 (64,837), 5�sswith SNPs having alleles A/G at position +3 (93), and 5�ss with disease-causing A-to-G mutations at +3(50 cases). 5�ss with disease-associated A-to-G mutations at position +3 tend to have nonconsensusnucleotides at positions +4 and +5 more frequently than the other sets, which suggests their disruptivenature, based on the association matrix (Fig. 2).
Figure 5. Experimental system used to test 5�ss efficiency by a com-petition assay (Roca et al. 2005). The human beta-globin pre-mRNA hastwo 5�ss at positions �16 and +1, of which the +1 5�ss is always usedbecause the �16 cryptic 5�ss is much weaker (Roca et al. 2003). Replace-ment of the �16 5�ss by the +1 5�ss sequence results in both 5�ss beingused equally. This system can be used to test the relative efficiencies of5�ss by a competition assay, wherein the �16 and/or +1 5�ss are replacedby the various 5�ss to be tested. When different 5�ss are compared, theirrelative positions are also swapped as the contexts are not equivalent, inthat for 5�ss of comparable efficiency, either the +1 or the �16 site canget more efficiently used. Use of the two competing 5�ss results in prod-ucts that differ in length, which is detected by gel electrophoresis.
Roca et al.
6 Genome Researchwww.genome.org
Cold Spring Harbor Laboratory Press on January 30, 2018 - Published by genome.cshlp.orgDownloaded from
From Figure 3, we can see that the disruption of the asso-ciations by the SNPs is smaller than the disruption by the simu-lated SNPs, which in turn is smaller than the disruption by the5�ss disease-causing mutations, suggesting selective pressure onSNPs to preserve the associations. For instance, Figure 4 showsthat SNPs with alleles A and G at position +3 tend to have con-sensus nucleotides at positions +4 and +5, as expected from theprevious discussion on +3 A-to-G disease mutations.
By using these findings (see Fig. 3), we were able to establishcriteria to identify SNPs that might disrupt splicing. We used theaverage score of the disease set to identify low PWM scores(�5.31). The separation between disease-causing mutations andthe SNPs and orthologous sets was used to identify high PWM-score differences (�1). The average association-score differencefor the disease data set was used to identify high association-scoredifferences (�1.1). We expect disruptive 5�ss SNPs to occur at 5�sswith low PWM scores, and for the SNPs to substantially disrupteither the PWM score or the association scores or both simulta-neously.
Disruptive 5�ss SNP predictions and evidence for their effecton splicing
By using the criteria listed above, we created five sets from the1260 SNPs in dbSNP that occur at 5�ss (Smigielski et al. 2000). Thesets were picked to dissect the effects of the PWM scores, PWM-score differences between SNP alleles, and association-score dif-ferences between SNP alleles. The first set, designated LHH, con-sists of 35 SNPs at 5�ss that have low (L) PWM scores and alleleswith high (H) association-score differences and high (H) PWM-score differences. The second set, LHL, consists of 35 SNPs at 5�sswith low PWM scores and alleles with high PWM-score differ-ences and low association-score differences. The third set, LLH,consists of 43 SNPs at 5�ss with low PWM scores and alleles withlow PWM-score differences and high-association score differ-ences. The fourth set, HLL, consists of 58 SNPs at 5�ss with highPWM scores and alleles with low PWM-score differences and lowassociation-score differences. Finally, the fifth set, LLL, consistsof 111 SNPs at 5�ss with low PWM scores and alleles with low
PWM-score differences and low association-score differences.The LHH, LLH, and LHL sets of SNPs are expected to be moredisruptive of splicing, whereas the HLL and LLL sets are controlsthat should be less disruptive of splicing.
We used EST and mRNA alignments to the genome to es-tablish disruption caused by SNPs at 5�ss, using the UCSCbrowser (Kent et al. 2002). The alignments were studied to pickunambiguous cases of intron retention (at least one intron be-sides the retained one was spanned by the EST/mRNA), exonskipping (the skipped exon is otherwise constitutively spliced),and cryptic splice-site utilization. A prediction was consideredvalidated if alternative splicing was observed at the 5�ss in ques-tion, and when possible, the EST and mRNA data supporting thealternative event corresponded to the nonconsensus allele of theSNP. In the case of exon skipping, it is not possible to ascertainthe allele at the SNP position, but by considering the proportionof internal exons among RefSeq mRNAs that are skipped in thismanner (3734/166,622), we were able to infer the likely error ratein making the determination of exon skipping as being due tothe SNP (one in 45). We estimate similar error rates for intronretention (one in 160) and cryptic-splice-site utilization (one in70) based on previous work on the relative prevalence of thedifferent types of alternatively spliced exons (Kim et al. 2007).Furthermore, we checked that a 5�ss following cassette exons(from the Alt Events track of the UCSC browser) was no morelikely to contain a SNP than a randomly selected 5�ss.
In agreement with our expectations, we found that the setsLHH (10 disruptive SNPs out of 35), LHL (eight disruptive SNPsout of 35), and LLH (12 disruptive SNPs out of 43) are moredisruptive than the control sets HLL (five disruptive SNPs out of
Figure 7. The deleterious effect of the +3 A-to-G mutation can bealleviated by correcting positions +4 and/or +5. In this competition assay,we created two sequences from the ACADSB exon 3 5�ss: one with +3Aand another with +3G (for the experimental strategy, see Fig. 5; for theACADSB 5�ss sequences, see Fig. 6). The same mutations were simulta-neously introduced at positions +4, +5, and +6 at both 5�ss, to test theircompensatory effects vis-à-vis the +3 A-to-G mutations. The nucleotidesat positions +4, +5, and +6 are listed above the lanes, and the consensusnucleotides are boxed. The left and right panels are the same, except thatthe positions of the +3A and +3G 5�ss are swapped (indicated on the topdiagram). With a few exceptions, the general trend is that the +3G 5�sswas used to a greater extent as the number of consensus nucleotides atpositions +4 to +6 was increased (lanes 1–3, 5). The degree of use of the+3G 5�ss was not the same for identical mutants in the two panels (fordetails, see text), but despite these positional effects, the trend remains.The +3G 5�ss can be activated by correcting position +4 alone (lane 3) or+5 alone (lane 5). The rescue by +5 alone is surprising and indicates thatassociations between nonadjacent positions can affect splice-site effi-ciency.
Figure 6. The +3 A-to G-mutation in the ACADSB 5�ss has a severeeffect on splicing efficiency. By using the competition strategy describedin Figure 5, we performed three experiments. First, the ACADSB wild-type5�ss (+3A, GGG/GUACAU) and the mutant (+3G, GGG/GUGCAU), whichdiffers by having a G at +3, were placed in competition against thebeta-globin cryptic (GUG/GUGAGG) 5�ss at �16 (Treisman et al. 1983).The cryptic 5�ss at �16 was the only 5�ss used (lanes 1,2), indicating thatboth +3A and +3G 5�ss are very weak. Second, a competition was donebetween +3A and +3G, which resulted in splicing only via the +3A 5�ss(lanes 4,5). Third, the same 5�ss was placed on the same substrate at bothlocations. Whereas the substrate with two +3A 5�ss resulted in use of both�16 and +1 5�ss (lane 3), two +3G 5�ss did not show any splicing (lane6). Together, these results indicate that the +3A 5�ss is much strongerthan the +3G 5�ss.
Determinants of 5�ss efficiency
Genome Research 7www.genome.org
Cold Spring Harbor Laboratory Press on January 30, 2018 - Published by genome.cshlp.orgDownloaded from

58) and LLL (19 disruptive SNPs out 111). By using bootstrappingto estimate the variance of these numbers, we found that the LLLand LLH sets are significantly different from each other (P-valueof 0.0003 using an unpaired t-test). The stronger disruptionshown by the LLH set compared with the LLL set confirms thepredictive nature of the association scores. A sampling of SNPsfrom these sets is given in Table 2.
This analysis is confounded by the fact that the ESTs mightnot have sampled the SNP alleles of interest, due to the genotypeof the source. The intronic SNPs are also not likely to be sampledin the ESTs. In addition, some of the alternative spliced productsmight be degraded by NMD, due to the presence of a prematurestop codon and thus would not be observed (Lejeune and Maquat2005). In light of these limitations, it is encouraging that we stillfind such a high confirmation rate.
We expected the genotypes to show a preference for allelesof SNPs at 5�ss that do not disrupt splicing, but we did not detecta strong signal in the distribution of genotypes. The effect ofSNPs at 5�ss might be alleviated by the sequence context. Forexample, in the ACADM (also called MCAD) gene (Nielsen et al.2007), one allele of a SNP creates an ESS, and a mutation thatdisrupts a nearby ESE causes exon skipping only in individualswith the ESS-creating allele. Even if splicing is affected, theremight be no phenotypic effects due to the following: (1) a smallreduction in the correct mRNA levels; (2) compensation in thegenetic network; (3) the function of the disrupted gene is re-quired only under certain conditions; or (4) the alternate productdue to the disruption of the particular 5�ss is also functional.Nevertheless, such SNPs can offer a window into the investiga-tion of the genetic network. This analysis will allow investigationof disruptive SNPs and their role in complex diseases.
Discussion
We have shown that the effects of disease-causing mutations areoften a result of the disruption of conserved patterns in associa-
tions between nucleotides at differentpositions within the 5�ss, and SNPs thatdisrupt these pairwise associations tendto affect splicing. A majority of SNPs re-spect the associations, as expected fromSNP neutrality. In addition, we haveshown that orthologous 5�ss mouse–human pairs show changes that likewiserespect the associations, which suggeststhe existence of selective pressure tomaintain them. A set of simulated SNPsis more disruptive of associations thanneutral SNPs but is better than the dis-ease-causing mutations in this respect.This is expected from the lack of selec-tion pressure on the simulated SNPs.
The conservation of the associa-tions is indicative of selective pressuresreflecting functional features of thesplicing machinery, and allows infer-ences to be made about the underlyingmechanisms. The pairwise associationsconfirm many known effects, but alsosuggest new areas for exploration. Wefound pairwise associations probably re-lated to U1 base pairing, such as specific
patterns involving consensus and nonconsensus nucleotidesacross the exon–intron boundary. We found one associationprobably related to base pairing to U6, but none related to U5.The long-range associations are likely related to protein–RNA in-teractions, and further experiments should shed light on them.Similar studies could be carried out using 3�ss. However, thelonger span of this motif (Sheth et al. 2006) and its more plasticorganization suggest that the pairwise associations at 3�ss will notreveal as many biases as the associations at 5�ss.
By using the data from disease-causing mutations in 5�ss,differences between orthologous pairs of mouse and human 5�ss,and genomic data for five species, we were able to generate cri-teria for prediction of splicing-disruptive SNPs at 5�ss. We haveshown that circumstantial evidence from ESTs provides supportfor these predictions and encourages further experiments tostudy their effects in vivo.
The disruptive SNPs may provide insights into genetic net-works. If a proven disruptive SNP is in Hardy-Weinberg equilib-rium, it suggests that the genetic network is immune to thechange, and this can be a starting point for investigating thereasons for this robustness of the network. Alternatively, suchSNPs might be implicated in complex diseases, wherein theireffects are apparent only under certain genetic and environmen-tal conditions. For example, there has been work on SNPs affect-ing the p53 pathway, such as a SNP in the MDM2 gene that altersa transcription-factor binding site and hence the levels of p53(Bond and Levine 2007). This results in phenotypes ranging froman effect on fertility, to the onset of tumor formation, and theresponse to various therapies, such as estrogen replacement. Ourstudy is a first step in investigating the effect of SNPs at 5�ss on agenomic scale. The consequences of the disruptions could bestochastic in nature, leading to effects that might not be readilydiscernible in in vitro systems but might nevertheless affect thein vivo phenotypes.
This study illustrates the power of the convergence of dif-ferent data sets for obtaining insights into mechanisms of gene
Figure 8. Association improvements can compensate for reductions in PWM scores. In orthologousmouse–human pairs of 5�ss, association scores improve as PWM scores get weaker. The graph showsthe average of the PWM-score differences (white bars) as well as association-score differences (blackbars) for the orthologous 5�ss mouse–human pairs, organized by the number of nucleotide differencesbetween the members of each pair (X-axis). A positive difference means a decrease in the score (andvice versa). The differences in PWM scores are always positive, as the 5�ss with the higher score withina pair is always considered first. Error bars, confidence intervals.
Roca et al.
8 Genome Researchwww.genome.org
Cold Spring Harbor Laboratory Press on January 30, 2018 - Published by genome.cshlp.orgDownloaded from

expression and for understanding the neutral and disease-causing nucleotide changes found in human populations.
Methods
Scoring splice sites with PWMPWMs reflect the frequencies of the 4 nt (A, C, G, and T) at eachposition of the splice site. PWMs can be used to score a site byconverting the frequencies into a log-odds score (log of the ratioof the actual frequency and the expected frequency) (Sheth et al.2006).
Scoring associations within splice sitesFor the associations, we calculated the expected frequencies foreach combination of a pair of positions and nucleotides, usingthe PWM and assuming independence of positions from eachother. We then calculated a log-odds score for the combination,based on the actual numbers observed in the genomic data set.The total association score for a given 5�ss is the sum of thelog-odds score for each nucleotide pair at the 5�ss. The change inassociation score measures the disruption (or enhancement) ofthe pairwise associations due to changes at the 5�ss caused bySNPs, mutations, or differences between pairs of orthologous5�ss.
In order to avoid small statistical fluctuations affecting thescores (e.g., an actual occurrence of three versus an expectednumber of 45 would give the relevant pair a strong negativescore), we excluded those pairs that are expected less than 50times in the genome. This does not affect the scoring of mostsplice sites, as these pairs are by definition rare.
Collection of data setsFrom the HGMD database (Stenson et al. 2003), we collected1772 disease-causing mutations affecting U2-type GT-AG 5�ss se-quences. After excluding mutations affecting +1 and +2 of the5�ss, we were left with 582 mutations affecting the positions �3to �1 and +3 to +6, which we used in our analysis. An additional13 5�ss mutations changing a +3 A to G at 5�ss were added froma separate source (Madsen et al. 2006). We randomly selected 5�ssfrom SpliceRack (Sheth et al. 2006) and mutated a randomlyselected position in the 5�ss to generate a list of simulated SNPs in5�ss. From dbSNP (Smigielski et al. 2000), we extracted SNPs thathave population data and mapped them to the genome to iden-tify SNPs at 5�ss. For the orthologous set, we used a publisheddata set (Carmel et al. 2004).
In vitro splicingIn the 5�ss competition assay, each test ACADSB 5�ss replaces thebeta-globin 5�ss at positions �16 and/or +1 (Fig. 5). The compe-tition between the two 5�ss provides an estimate of the differencein their intrinsic strengths.
The beta-globin wild-type 5�ss and the cryptic 5�ss at posi-tion �16 were replaced by various mutant ACADSB 5�ss by PCRmutagenesis. We inactivated a second cryptic 5�ss in beta-globinthat is located 38 nt upstream of the authentic 5�ss (Treisman etal. 1983) to prevent competition with the various ACADSB 5�ss.The different mutant beta-globin minigenes, inserted into thepSP64 vector (Promega) were in vitro transcribed (Mayeda andKrainer 1999b). The pre-mRNA transcripts were then spliced invitro using HeLa cell nuclear extract (Mayeda and Krainer 1999a),and the products were analyzed by electrophoresis in 5.5% poly-acrylamide/7M urea gels.
Table 2. A selection of SNPs at 5�ss
Gene 5�ss SNP Freq. PS PD AD Effect Allele
PPIL2 (C/T)AGGTTGGC rs12484060 0.49 3.01 1.10 2.66 ES/IR C/T (IR)UTP15 (T/C)AGGTTGGC rs16870610 0.14 3.01 1.10 2.66 NoPLD2 C(G/A)GGTAGAG rs3764897 0.32 4.08 1.66 3.17 CSMGC88374 A(A/T)GGTTGTG rs3737161 0.75 0.84 1.50 2.81 ESDENND1B C(G/A)AGTAATA rs17641524 0.22 3.47 1.66 1.98 ESPYCR1 A(A/G)GGTGAAG rs34575645 0.01 5.23 1.66 1.14 IR ALOC400988 ATCGTG(C/A)GT rs11894651 0.71 3.51 2.18 3.05 ESCOL11A1 CCTGTA(T/A)GT rs12136577 0.12 4.72 1.85 1.52 ESC6orf191 TGAGTA(A/C)GT rs17396809 0.15 4.02 2.18 2.93 NoCOL25A1 GGGGTCC(G/A)T rs1859143 0.54 1.38 2.18 1.30 CS/IR G (IR)COASY TATGTAAG(C/T) rs34135057 0.02 5.34 1.13 1.60 IR CSYNE1 AAAGTTAG(T/C) rs9397102 0.51 3.70 1.13 1.45 CS C/T
NKAIN4 (A/C)AGGTGAGT rs1129659 0.65 8.37 0.10 0.15 NoZNF423 (C/A)GGGTAAGT rs16947734 0.02 7.21 0.10 �0.99 NoCOL17A1 C(G/C)GGTAAGT rs17116450 0.13 7.21 0.06 �0.14 NoUSP14 AA(T/C)GTAAGT rs563155 0.49 6.34 0.84 0.22 NoTGFBR3 CA(C/T)GTAAGT rs35352606 0.03 6.44 0.84 0.02 NoTRIO CAGGT(A/G)AGT rs16903358 0.03 8.87 0.50 �0.60 NoNUP88 CAGGT(C/T)AGT rs739768 0.69 5.89 0.01 0.58 NoPAQR3 CAGGTA(G/T)GT rs13108247 0.33 7.13 0.11 �0.14 IR TPCDH11X CAGGTA(T/G)GG rs4252206 0.50 6.26 0.11 0.01 NoCCDC60 CTGGTAA(A/T)T rs2014138 0.20 5.19 0.15 �0.12 NoAZI2 AAGGTAAT(T/A) rs3762797 0.32 6.44 0.98 �1.25 IR A/TPDE4D CAGGTAAG(G/A) rs1553114 0.21 8.00 0.11 �0.23 No
Out of 113 SNP candidates predicted to affect splicing, 30 show EST evidence of an effect on splicing, whereas only 24 out of 169 control SNPs (likelyneutral SNPs according to our study) did. For details of the EST analysis, see the Methods section. The table shows 12 selected cases for each set: thecandidate (upper half) and control (lower half) SNPs. We found three types of alternative splicing patterns: exon skipping (ES), intron retention (IR), orselection of a nearby cryptic 5�ss (CS). The allele disrupting the 5�ss, if identifiable, is indicated in the last column. The “Freq.” column gives themaximum frequency of the minor allele. In some cases the frequency is >0.5 because the minor allele becomes a major allele in some populations. ThePWM score for the stronger allele (PS), the PWM-score difference (PD), and the association-score difference (AD) between alleles are also indicated.
Determinants of 5�ss efficiency
Genome Research 9www.genome.org
Cold Spring Harbor Laboratory Press on January 30, 2018 - Published by genome.cshlp.orgDownloaded from

EST analysisBy using the UCSC genome browser (Kent et al. 2002), we locatedthe relevant SNPs by entering the rs id numbers provided bydbSNP into the “position/search” input area. We used visual in-spection to determine the nature of the alternative splicing eventand tried to identify the allele that might be responsible for thissplicing alteration. The browser was configured to display the“human mRNAs” and “spliced ESTs” tracks in “full” mode. De-termining which allele was used in each EST was simplified bysetting the “color track by codons or bases” option to “differentmRNA bases” (follow the link on the track name to turn on thisfeature).
AcknowledgmentsJeremiah Faith and Susan Janicki gave insightful comments onthe manuscript. The anonymous reviewers gave useful criticismsthat helped improve the paper. A.J.O. and R.S. thank the DARTNeurogenomics Alliance for support. X.R. and A.R.K. acknowl-edge support from NIH grant CA13106. A.R.R. acknowledges sup-port from the Department of Biotechnology (India) grant BT/IN/BTOA/03/2005.
ReferencesBond, G.L. and Levine, A.J. 2007. A single nucleotide polymorphism in
the p53 pathway interacts with gender, environmental stresses andtumor genetics to influence cancer in humans. Oncogene26: 1317–1323.
Brow, D.A. 2002. Allosteric cascade of spliceosome activation. Annu. Rev.Genet. 36: 333–360.
Brunak, S., Engelbrecht, J., and Knudsen, S. 1991. Prediction of humanmRNA donor and acceptor sites from the DNA sequence. J. Mol. Biol.220: 49–65.
Buratti, E., Chivers, M., Kralovicova, J., Romano, M., Baralle, M.,Krainer, A.R., and Vorechovsky, I. 2004. Aberrant 5� splice sites inhuman disease genes: Mutation pattern, nucleotide structure andcomparison of computational tools that predict their utilization.Nucleic Acids Res. 35: 4250–4263.
Buratti, E., Baralle, M., Conti, L.D., Baralle, D., Romano, M., Ayala, Y.M.,and Baralle, F.E. 2007. hnRNP H binding at the 5� splice sitecorrelates with the pathological effect of two intronic mutations inthe NF-1 and TSHb genes. Nucleic Acids Res. 32: 4224–4236.
Burge, C. and Karlin, S. 1997. Prediction of complete gene structures inhuman genomic DNA. J. Mol. Biol. 268: 78–94.
Burge, C.B., Padgett, R.A., and Sharp, P.A. 1998. Evolutionary fates andorigins of U12-type introns. Mol. Cell 2: 773–785.
Cáceres, J.F., Stamm, S., Helfman, D.M., and Krainer, A.R. 1994.Regulation of alternative splicing in vivo by overexpression ofantagonistic splicing factors. Science 265: 1706–1709.
Carmel, I., Tal, S., Vig, I., and Ast, G. 2004. Comparative analysis detectsdependencies among the 5� splice-site positions. RNA 10: 828–840.
Cartegni, L., Chew, S., and Krainer, A.R. 2002. Listening to silence andunderstanding nonsense: Exonic mutations that affect splicing. Nat.Rev. Genet. 3: 285–298.
Costantini, M., Clay, O., Auletta, F., and Bernardi, G. 2006. An isochoremap of human chromosomes. Genome Res. 16: 536–541.
Crotti, L.B., Bacikova, D., and Horowitz, D.S. 2007. The PRP18 proteinstabilizes the interaction of both exons with the U5 snRNA duringthe second step of pre-mRNA splicing. Genes & Dev. 21: 1204–1216.
Du, H. and Rosbash, M. 2002. The U1 snRNP protein U1C recognizesthe 5� splice site in the absence of base pairing. Nature 419: 86–90.
ElSharawy, A., Manaster, C., Teuber, M., Rosenstiel, P., Kwiatkowski, R.,Huse, K., Platzer, M., Becker, A., Nurnberg, P., Schreiber, S., et al.2006. SNPSplicer: systematic analysis of SNP-dependent splicing ingenotyped cDNAs. Hum. Mutat. 27: 1129–1134.
Field, L.L., Bonnevie-Nielsen, V., Pociot, F., Lu, S., Nielsen, T.B., andBeck-Nielsen, H. 2005. OAS1 splice site polymorphism controllingantiviral enzyme activity influences susceptibility to type 1 diabetes.Diabetes 54: 1588–1591.
Hastings, M.L. and Krainer, A.R. 2001. Pre-mRNA splicing in the newmillennium. Curr. Opin. Cell Biol. 13: 302–309.
Jurica, M.S. and Moore, M.J. 2003. Pre-mRNA splicing: Awash in a sea of
proteins. Mol. Cell 12: 5–14.Kandels-Lewis, S. and Séraphin, B. 1993. Involvement of U6 snRNA in
5� splice site selection. Science 262: 2035–2039.Kawase, T., Akatsuka, Y., Torikai, H., Morishima, S., Oka, A., Tsujimura,
A., Miyazaki, M., Tsujimura, K., Miyamura, K., Ogawa, S., et al. 2007.Alternative splicing due to an intronic SNP in HMSD generates anovel minor histocompatibility antigen. Blood 110: 1055–1063.
Kent, W.J., Sugnet, C.W., Furey, T.S., Roskin, K.M., Pringle, T.H., Zahler,A.M., and Haussler, D. 2002. The Human Genome Browser at UCSC.Genome Res. 12: 996–1006.
Kim, E., Magen, A., and Ast, G. 2007. Different levels of alternativesplicing among eukaryotes. Nucleic Acids Res. 35: 125–131.
Krawczak, M., Reiss, J., and Cooper, D.N. 1992. The mutationalspectrum of single base-pair substitutions in mRNA splice junctionsof human genes: Causes and consequences. Hum. Genet. 90: 41–54.
Krawczak, M., Ball, E.V., and Cooper, D.N. 1998.Neighboring-nucleotide effects on the rates of germ-linesingle-base-pair substitution in human genes. Am. J. Hum. Genet.63: 474–488.
Krawczak, M., Thomas, N.S., Hundrieser, B., Mort, M., Wittig, M.,Hampe, J., and Cooper, D.N. 2007. Single base-pair substitutions inexon-intron junctions of human genes: Nature, distribution, andconsequences for mRNA splicing. Hum. Mutat. 28: 150–158.
Ladd, A.N. and Cooper, T.A. 2002. Finding signals that regulatealternative splicing in the post-genomic era. Genome Biol. 3: 1–16.doi: 10.1186/gb-2002-3-11-reviews0008.
Lejeune, F. and Maquat, L.E. 2005. Mechanistic links betweennonsense-mediated mRNA decay and pre-mRNA splicing inmammalian cells. Curr. Opin. Cell Biol. 17: 309–315.
Lesser, C.F. and Guthrie, C. 1993. Mutations in U6 snRNA that altersplice site specificity: Implications for the active site. Science6: 1982–1988.
Madsen, P.P., Kibaek, M., Roca, X., Sachidanandam, R., Krainer, A.R.,Christensen, E., Steiner, R.D., Gibson, K.M., Corydon, T.J., Knudsen,I., et al. 2006. Short/branched-chain acyl-CoA dehydrogenasedeficiency due to an IVS3+3A>G mutation that causes exonskipping. Hum. Genet. 118: 680–690.
Maroney, P.A., Romfo, C.M., and Nilsen, T.W. 2000. Functionalrecognition of 5� splice site by U4/U6.U5 tri-snRNP defines a novelATP-dependent step in early spliceosome assembly. Mol. Cell6: 317–328.
Mayeda, A. and Krainer, A.R. 1992. Regulation of alternative pre-mRNAsplicing by hnRNP A1 and splicing factor SF2. Cell 68: 365–375.
Mayeda, A. and Krainer, A.R. 1999a. Mammalian in vitro splicing assays.Methods Mol. Biol. 118: 315–321.
Mayeda, A. and Krainer, A.R. 1999b. Preparation of HeLa cell nuclearand cytosolic S100 extracts for in vitro splicing. Methods Mol. Biol.118: 309–314.
Nakai, K. and Sakamoto, H. 1994. Construction of a novel databasecontaining aberrant splicing mutations of mammalian genes. Gene141: 171–177.
Newman, A.J. and Norman, C. 1992. U5 snRNA interacts with exonsequences at 5� and 3� splice sites. Cell 68: 743–754.
Nielsen, K.B., Sorensen, S., Cartegni, L., Corydon, T.J., Doktor, T.K.,Schroeder, L.D., Reinert, L.S., Elpeleg, O., Krainer, A.R., Gregersen,N., et al. 2007. Seemingly neutral polymorphic variants may conferimmunity to splicing-inactivating mutations: A synonymous SNP inexon 5 of MCAD protects from deleterious mutations in a flankingexonic splicing enhancer. Am. J. Hum. Genet. 80: 416–432.
Ohno, K., Brengman, J.M., Felice, K.J., Cornblath, D.R., and Engel, A.G.1999. Congenital end-plate acetylcholinesterase deficiency caused bya nonsense mutation and an A→G splice-donor-site mutation atposition +3 of the collagenlike-tail-subunit gene (COLQ): How doesG at position +3 result in aberrant splicing? Am. J. Hum. Genet.65: 635–644.
O’Keefe, R.T., Norman, C., and Newman, A.J. 1996. The invariant U5snRNA loop 1 sequence is dispensable for the first catalytic step ofpre-mRNA splicing in yeast. Cell 86: 679–689.
Reddy, R., Henning, D., and Busch, H. 1981. Pseudouridine residues inthe 5�-terminus of uridine-rich nuclear RNA I (U1 RNA). Biochem.Biophys. Res. Commun. 98: 1076–1078.
Roca, X., Sachidanandam, R., and Krainer, A.R. 2003. Intrinsicdifferences between authentic and cryptic 5� splice sites. NucleicAcids Res. 31: 6321–6333.
Roca, X., Sachidanandam, R., and Krainer, A.R. 2005. Determinants ofthe inherent strength of human 5� splice sites. RNA 11: 683–698.
Senapathy, P., Shapiro, M.B., and Harris, N.L. 1990. Splice junctions,branch point sites, and exons: Sequence statistics, identification, andapplications to genome project. Methods Enzymol. 183: 252–278.
Séraphin, B., Kretzner, L., and Rosbash, M. 1988. A U1snRNA:pre-mRNA base pairing interaction is required early in yeast
Roca et al.
10 Genome Researchwww.genome.org
Cold Spring Harbor Laboratory Press on January 30, 2018 - Published by genome.cshlp.orgDownloaded from
spliceosome assembly but does not uniquely define the 5� cleavagesite. EMBO J. 183: 2533–2538.
Shapiro, M.B. and Senapathy, P. 1987. RNA splice junctions of differentclasses of eukaryotes: Sequence statistics and functional implicationsin gene expression. Nucleic Acids Res. 15: 7155–7174.
Sheth, N., Roca, X., Hastings, M.L., Roeder, T., Krainer, A.R., andSachidanandam, R. 2006. Comprehensive splice-site analysis usingcomparative genomics. Nucleic Acids Res. 34: 3955–3967.
Shinmura, K., Tao, H., Yamada, H., Kataoka, H., Sanjar, R., Wang, J.,Yoshimura, K., and Sugimura, H. 2004. Splice-site geneticpolymorphism of the human kallikrein 12 (KLK12) gene correlateswith no substantial expression of KLK12 protein having serineprotease activity. Hum. Mutat. 24: 273–274.
Siliciano, P.G. and Guthrie, C. 1988. 5� splice site selection in yeast:Genetic alterations in base pairing with U1 reveal additionalrequirements. Genes & Dev. 2: 1258–1267.
Skarratt, K.K., Fuller, S.J., Sluyter, R., Dao-Ung, L.P., Gu, B.J., and Wiley,J.S. 2005. A 5� intronic splice site polymorphism leads to a null alleleof the P2X7 gene in 1-2% of the Caucasian population. FEBS Lett.579: 2675–2678.
Smigielski, E.M., Sirotkin, K., Ward, M., and Sherry, S.T. 2000. dbSNP: Adatabase of single nucleotide polymorphisms. Nucleic Acids Res.28: 352–355.
Stenson, P., Ball, E.V., Mort, M., Phillips, A.D., Shiel, J.A., Thomas, N.S.,
Abeysinghe, S., Krawczak, M., and Cooper, D.N. 2003. Human GeneMutation Database (HGMD): 2003 update. Hum. Mutat. 21: 577–581.
Teraoka, S.N., Telatar, M., Becker-Catania, S., Liang, T., Onengut, S.,Tolun, A., Chessa, L., Sanal, O., Bernatowska, E., Gatti, R.A., et al.1999. Splicing defects in the ataxia-telangiectasia gene, ATM:Underlying mutations and consequences. Am. J. Hum. Genet.64: 1617–1631.
Treisman, R., Orkin, S.H., and Maniatis, T. 1983. Specific transcriptionand RNA splicing defects in five cloned �-thalassaemia genes. Nature302: 591–596.
Tweedie, S., Charlton, J., Clark, V., and Bird, A. 1997. Methylation ofgenomes and genes at the invertebrate-vertebrate boundary. Mol.Cell. Biol. 17: 1469–1475.
Wassarman, D.A. and Steitz, J.A. 1992. Interactions of small nuclearRNA’s with precursor messenger RNA during in vitro splicing. Science257: 1918–1925.
Yeo, G. and Burge, C.B. 2004. Maximum entropy modeling of shortsequence motifs with applications to RNA splicing signals. J. Comput.Biol. 11: 377–394.
Zhuang, Y. and Weiner, A.M. 1986. A compensatory base change in U1snRNA suppresses a 5� splice site mutation. Cell 46: 827–835.
Received July 3, 2007; accepted in revised form October 10, 2007.
Determinants of 5�ss efficiency
Genome Research 11www.genome.org
Cold Spring Harbor Laboratory Press on January 30, 2018 - Published by genome.cshlp.orgDownloaded from
10.1101/gr.6859308Access the most recent version at doi: published online November 21, 2007Genome Res.
Xavier Roca, Andrew J. Olson, A.R. Rao, et al. mutations and comparative genomics
-splice-site efficiency derived from disease-causing′Features of 5
Material
Supplemental
http://genome.cshlp.org/content/suppl/2008/01/07/gr.6859308.DC1
P<P
Published online November 21, 2007 in advance of the print journal.
Open Access
Open Access option.Genome ResearchFreely available online through the
License Freely available online through the Genome Research Open Access option.
ServiceEmail Alerting
click here.top right corner of the article or
Receive free email alerts when new articles cite this article - sign up in the box at the
object identifier (DOIs) and date of initial publication. by PubMed from initial publication. Citations to Advance online articles must include the digital publication). Advance online articles are citable and establish publication priority; they are indexedappeared in the paper journal (edited, typeset versions may be posted when available prior to final Advance online articles have been peer reviewed and accepted for publication but have not yet
http://genome.cshlp.org/subscriptionsgo to: Genome Research To subscribe to
Copyright © 2007, Cold Spring Harbor Laboratory Press
Cold Spring Harbor Laboratory Press on January 30, 2018 - Published by genome.cshlp.orgDownloaded from