feb2018 pou corporate presentation - paramountres.com · corporate presentation ... wellhead...
TRANSCRIPT

Corporate Presentation
February 2018

Advisories
2
• In the interest of providing information regarding Paramount Resources Ltd.("Paramount", "PRL" or the "Company") and its future plans and operations, thispresentation contains certain forward-looking information and statements.
• The projections, estimates and forecasts contained in such forward-lookinginformation and statements necessarily involve a number of assumptions, and aresubject to both known and unknown risks and uncertainties that may cause theCompany's actual performance and financial results in future periods to differmaterially from these projections, estimates and forecasts. The Advisories Appendixattached hereto lists some of the material assumptions, risks and uncertainties thatthese projections, estimates and forecasts are based on and are subject to.
• Accordingly, recipients are cautioned that events or circumstances could causeactual results to differ materially from those predicted.
• Any use of information contained in this presentation is expressly forbidden.
• All dollar amounts in this presentation are expressed in Canadian dollars, unlessotherwise noted.
• Reserves and production information are presented in accordance with Canadianstandards.

• Founded in 1976; IPO in 1978; TSX: POU• Market Cap: ~$2.3 Bln (134.9 MM shares @$17/sh) • Net Debt at Sep 30, 2017 ~$564 MM (1)
• Total land position: ~2.7 million net acres, including:
• ~378,000 net Montney acres• ~230,000 net Duvernay acres
• 345 MMBoe Proved Reserves; 600 MMBoe P+P Reserves (2)
• 424 P+P Undeveloped Locations (2), 2,049 P+P and High Grade Locations
Corporate Overview
3(1) Refer to the heading “Non-GAAP Measures” in the Advisories Appendix.(2) Refer to the heading “Reserves and Other Information” in the Advisories Appendix.
2017 Results and GuidanceQ3 2017 Production 49,023 Boe/d (~40% Liquids)
Q4 2017E Production 95,000 Boe/d (>38% Liquids)
October 2017 Production 98,000 Boe/d (~38% Liquids)
2017 YTD Capex (Sep 30, 2017) ~$380 MM
Q4 2017E Capex ~$130 MM
2018 Guidance2018E Production 100,000 Boe/d (40% Liquids)
2018E Capex $600 MM
2018E Opex $10.00 / Boe

Highlights
4
Transaction Highlights
• April 2016 sold Musreau Plant ~$565 MM• August 2016 sold Musreau Asset ~$2.1 Bln• December 2016 sold royalty on Cavalier Oil Sands Asset ~$100 MM• December 2016 dividend declared: ~3.8 MM Seven Generations shares ~$120 MM• May 2017 closed the sale of Valhalla assets for cash of ~$150 MM• August 16, 2017 closed Apache Canada acquisition for ~$460 MM• September 12, 2017 merged with Trilogy for 1 POU share for every 3.75 TET shares
Operating Highlights
• Record production throughput at Karr 06-18 hitting nameplate with October 2017 sales of ~26,600 Boe/d (~52% liquids) and peak wellhead throughput of ~30,500 Boe/d (~55% liquids) in the same period
• Recent 6-well pad at Kaybob Duvernay achieved average wellhead production rate of ~1,600 Boe/d per well (51% condensate) over the first 30 days of production (1)
(1) Refer to the heading “Reserves and Other Information” in the Advisories Appendix.
Higher Sales & Stronger Balance Sheet
5
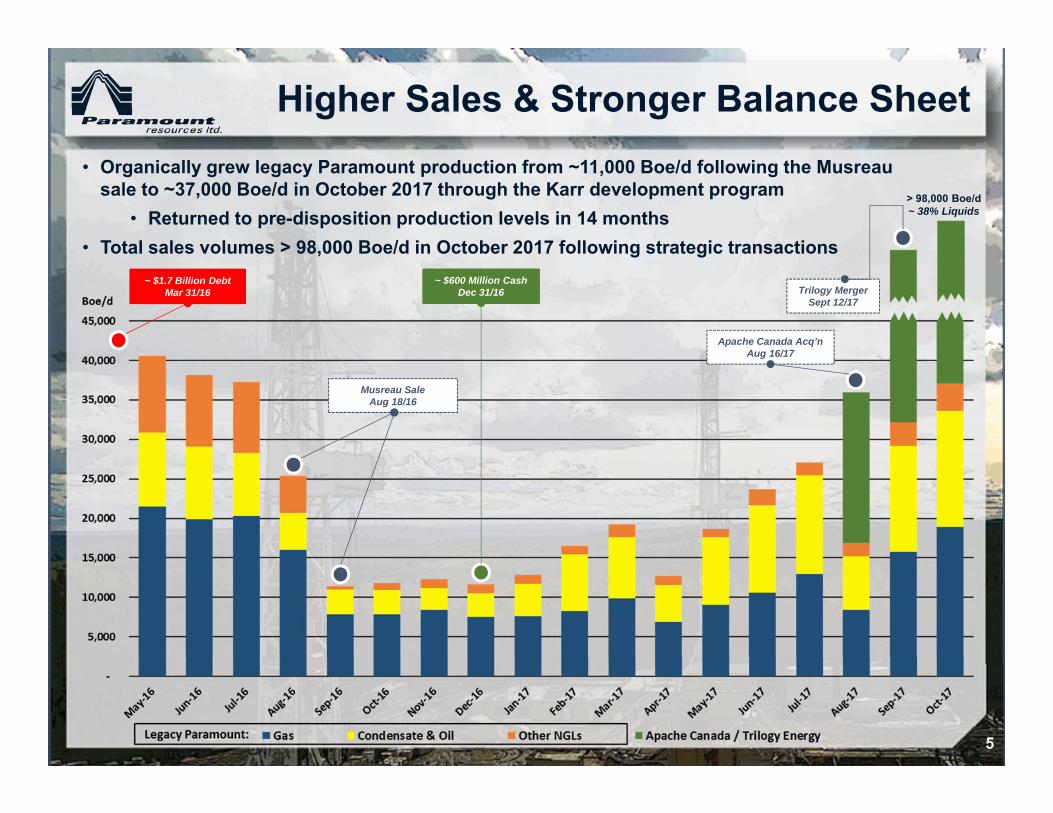
• Organically grew legacy Paramount production from ~11,000 Boe/d following the Musreausale to ~37,000 Boe/d in October 2017 through the Karr development program
• Returned to pre-disposition production levels in 14 months• Total sales volumes > 98,000 Boe/d in October 2017 following strategic transactions
~ $1.7 Billion DebtMar 31/16 Trilogy Merger
Sept 12/17
> 98,000 Boe/d~ 38% Liquids
Musreau SaleAug 18/16
Apache Canada Acq’nAug 16/17
~ $600 Million CashDec 31/16
Strategic Transactions
6
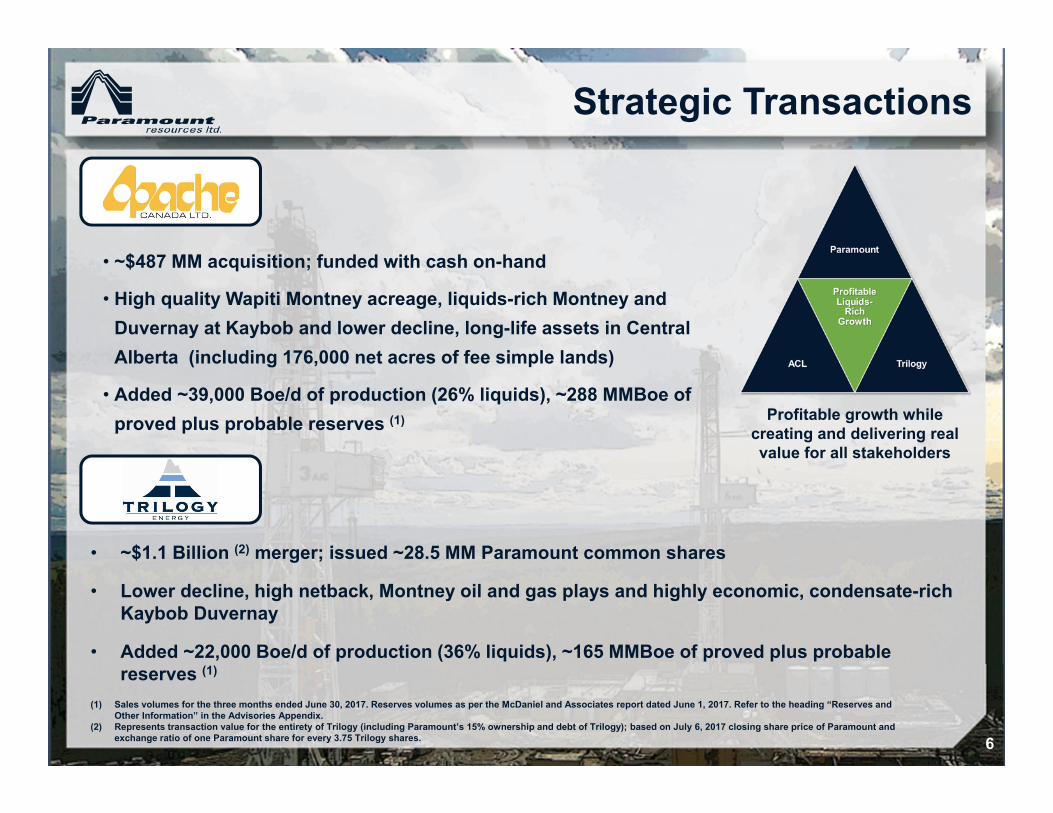
• ~$487 MM acquisition; funded with cash on-hand
• High quality Wapiti Montney acreage, liquids-rich Montney and Duvernay at Kaybob and lower decline, long-life assets in Central Alberta (including 176,000 net acres of fee simple lands)
• Added ~39,000 Boe/d of production (26% liquids), ~288 MMBoe of proved plus probable reserves (1)
(1) Sales volumes for the three months ended June 30, 2017. Reserves volumes as per the McDaniel and Associates report dated June 1, 2017. Refer to the heading “Reserves and Other Information” in the Advisories Appendix.
(2) Represents transaction value for the entirety of Trilogy (including Paramount’s 15% ownership and debt of Trilogy); based on July 6, 2017 closing share price of Paramount and exchange ratio of one Paramount share for every 3.75 Trilogy shares.
• ~$1.1 Billion (2) merger; issued ~28.5 MM Paramount common shares
• Lower decline, high netback, Montney oil and gas plays and highly economic, condensate-rich Kaybob Duvernay
• Added ~22,000 Boe/d of production (36% liquids), ~165 MMBoe of proved plus probable reserves (1)
Profitable growth while creating and delivering real value for all stakeholders
Liquids Focused Assets
7
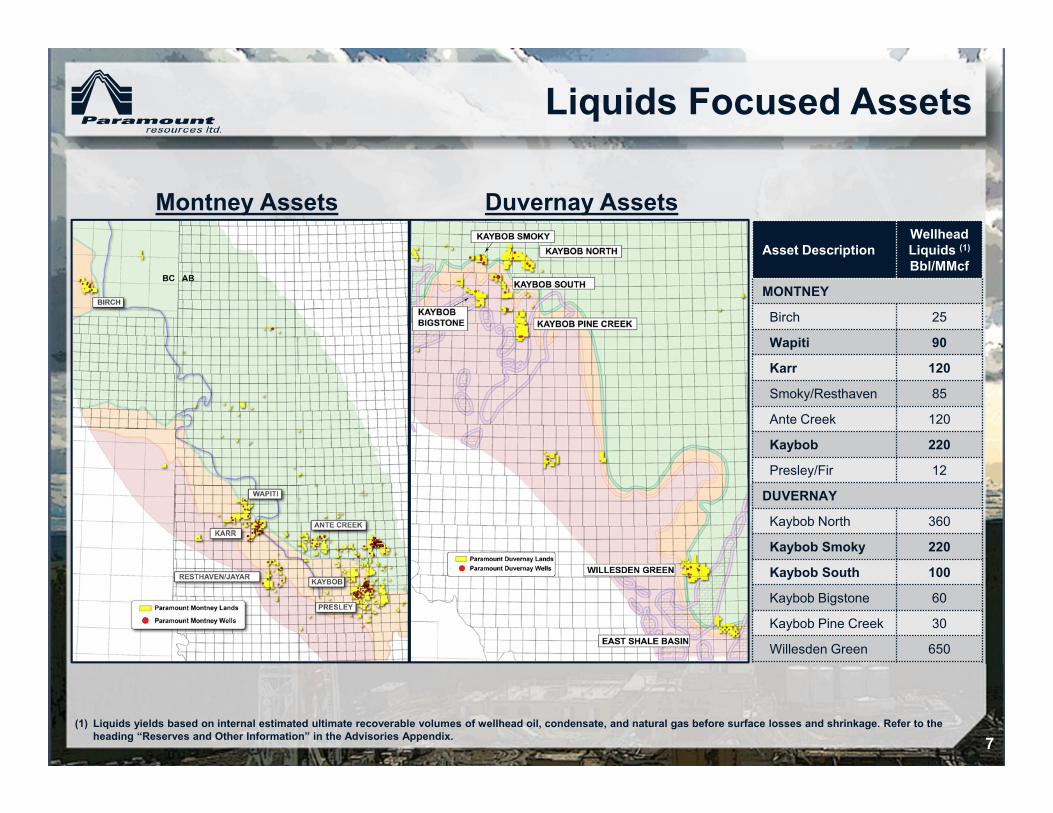
Montney Assets Duvernay Assets
(1) Liquids yields based on internal estimated ultimate recoverable volumes of wellhead oil, condensate, and natural gas before surface losses and shrinkage. Refer to the heading “Reserves and Other Information” in the Advisories Appendix.
Asset DescriptionWellhead Liquids (1)
Bbl/MMcf
MONTNEY
Birch 25
Wapiti 90
Karr 120
Smoky/Resthaven 85
Ante Creek 120
Kaybob 220
Presley/Fir 12
DUVERNAY
Kaybob North 360
Kaybob Smoky 220
Kaybob South 100
Kaybob Bigstone 60
Kaybob Pine Creek 30
Willesden Green 650
Diversified Assets
8
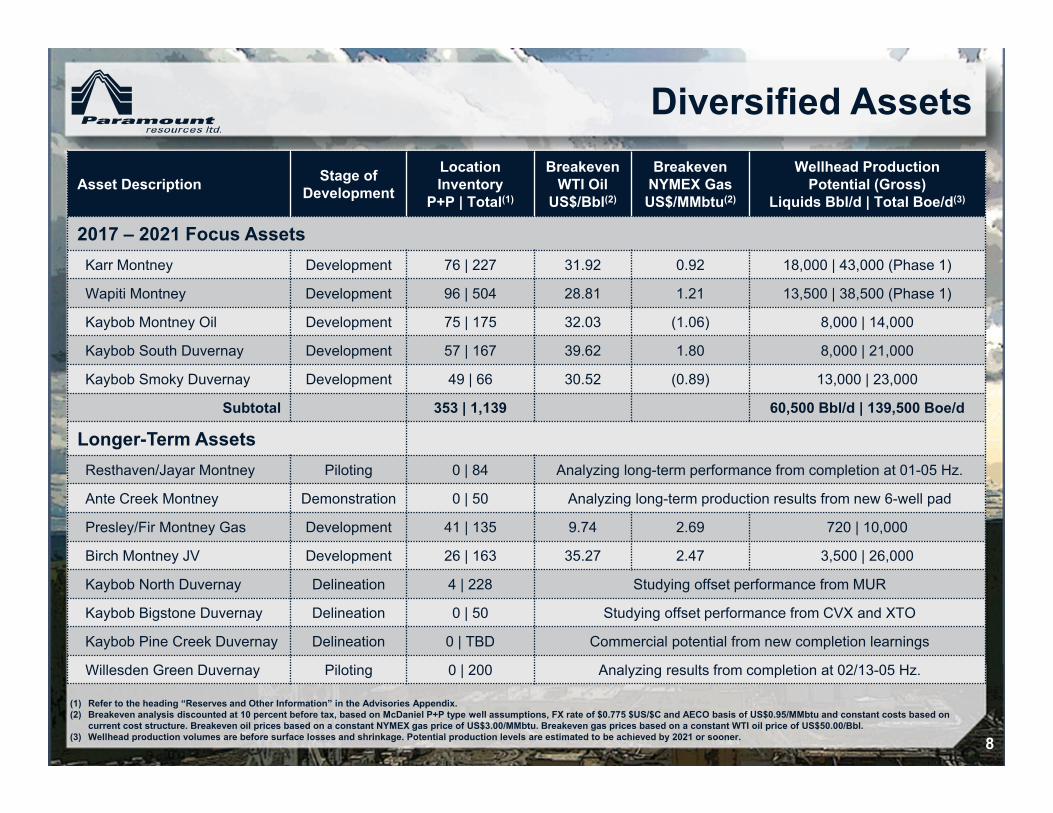
(1) Refer to the heading “Reserves and Other Information” in the Advisories Appendix. (2) Breakeven analysis discounted at 10 percent before tax, based on McDaniel P+P type well assumptions, FX rate of $0.775 $US/$C and AECO basis of US$0.95/MMbtu and constant costs based on
current cost structure. Breakeven oil prices based on a constant NYMEX gas price of US$3.00/MMbtu. Breakeven gas prices based on a constant WTI oil price of US$50.00/Bbl.(3) Wellhead production volumes are before surface losses and shrinkage. Potential production levels are estimated to be achieved by 2021 or sooner.
Asset Description Stage of Development
Location Inventory
P+P | Total(1)
Breakeven WTI Oil
US$/Bbl(2)
BreakevenNYMEX GasUS$/MMbtu(2)
Wellhead ProductionPotential (Gross)
Liquids Bbl/d | Total Boe/d(3)
2017 – 2021 Focus AssetsKarr Montney Development 76 | 227 31.92 0.92 18,000 | 43,000 (Phase 1)
Wapiti Montney Development 96 | 504 28.81 1.21 13,500 | 38,500 (Phase 1)
Kaybob Montney Oil Development 75 | 175 32.03 (1.06) 8,000 | 14,000
Kaybob South Duvernay Development 57 | 167 39.62 1.80 8,000 | 21,000
Kaybob Smoky Duvernay Development 49 | 66 30.52 (0.89) 13,000 | 23,000
Subtotal 353 | 1,139 60,500 Bbl/d | 139,500 Boe/d
Longer-Term AssetsResthaven/Jayar Montney Piloting 0 | 84 Analyzing long-term performance from completion at 01-05 Hz.
Ante Creek Montney Demonstration 0 | 50 Analyzing long-term production results from new 6-well pad
Presley/Fir Montney Gas Development 41 | 135 9.74 2.69 720 | 10,000
Birch Montney JV Development 26 | 163 35.27 2.47 3,500 | 26,000
Kaybob North Duvernay Delineation 4 | 228 Studying offset performance from MUR
Kaybob Bigstone Duvernay Delineation 0 | 50 Studying offset performance from CVX and XTO
Kaybob Pine Creek Duvernay Delineation 0 | TBD Commercial potential from new completion learnings
Willesden Green Duvernay Piloting 0 | 200 Analyzing results from completion at 02/13-05 Hz.

Focus Assets – Btax Return and NPV10 (1)
9(1) McDaniel P+P unless noted as “(Internal)”, US$50/Bbl WTI & US$3.00/MMbtu NYMEX, US$0.95/MMbtu AECO Basis & FX US$/C$ 0.775. Refer to the heading
“Reserves and Other Information” in the Advisories Appendix.
Revenue/Boe and AECO
10
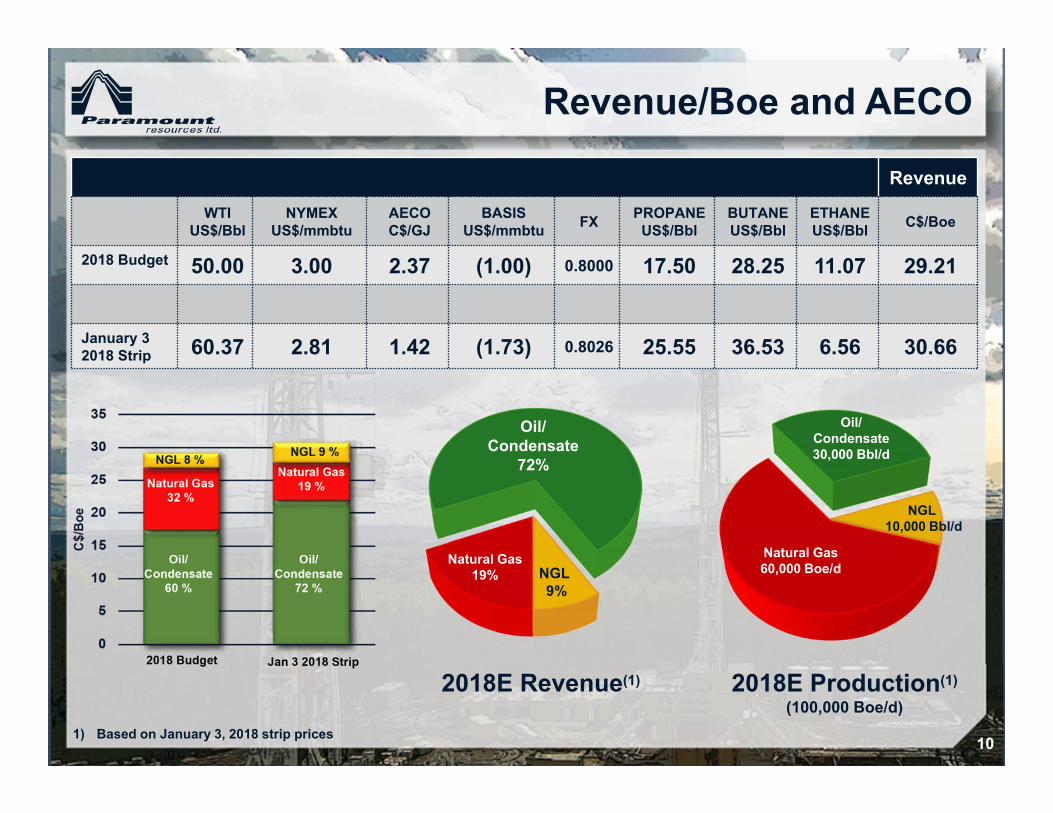
Revenue
WTIUS$/Bbl
NYMEXUS$/mmbtu
AECOC$/GJ
BASISUS$/mmbtu FX PROPANE
US$/BblBUTANEUS$/Bbl
ETHANEUS$/Bbl C$/Boe
2018 Budget 50.00 3.00 2.37 (1.00) 0.8000 17.50 28.25 11.07 29.21
January 3 2018 Strip 60.37 2.81 1.42 (1.73) 0.8026 25.55 36.53 6.56 30.66
Natural Gas19%
Natural Gas60,000 Boe/d
Oil/Condensate
72%
Oil/Condensate30,000 Bbl/d
NGL 9%
NGL 10,000 Bbl/d
2018E Production(1)
(100,000 Boe/d)2018E Revenue(1)
1) Based on January 3, 2018 strip prices

Midstream & Marketing Strategy
11
Midstream Portfolio Positioned for Growth
• Focus assets in Montney and Duvernay have takeaway capacity to manage growth plan through 2021
• Owned and operated infrastructure coupled with 3rd
party midstream provide balanced opex structure• Opportunities to increase 3rd party fee revenue from
non-core infrastructure assets
Firm, Reliable Market Access• Portfolio of firm service TransCanada Pipeline
(“TCPL”) capacity at receipt points for growth plays in Wapiti, Karr and Kaybob secures gas takeaway
• Majority of key gas processing facilities are dually connected to TCPL and Alliance
Pushing Further Downstream• Contracts for firm TCPL transport to Dawn and
Malin provide access to downstream markets• Shipper status on both Pembina and Plains feeder
pipelines allows for direct marketing of our products
• Own and operate a major Pembina-connected battery in Kaybob area which offers terminallingand blending opportunities
Karr 06-18
Keyera Wapiti
Kaybob North08-09
51.2 MMcf/d
18.2 MMcf/d
318.6 MMcf/d
November 2017 Exposure

• 145,000 net acres of Alberta Deep Basin Montney• P+P inventory of 172 locations• P+P and high grade inventory of >800 locations (1)
• Current gas processing capacity of ~145 MMcf/d
Grande Prairie Snapshot
12
Operational Highlights
• 26 of 27 wells in the 2017 Karr program on production; remaining well being completed
• 5 new 2018 wells on 1-2-66-5W6 pad in progress• Evaluating new Montney zone at Wapiti • Evaluating new Montney well at Resthaven/Jayar
Asset Summary• Three Montney assets in Alberta Deep Basin trend
- Wapiti, Karr, and Resthaven/Jayar• Over-pressured liquids-rich natural gas• Up to three development layers• Midstream capacity in place for growth• Cretaceous upside across the Deep Basin trend
Grande Prairie Statistics
(1) Refer to the heading “Reserves and Other Information” in the Advisories Appendix.
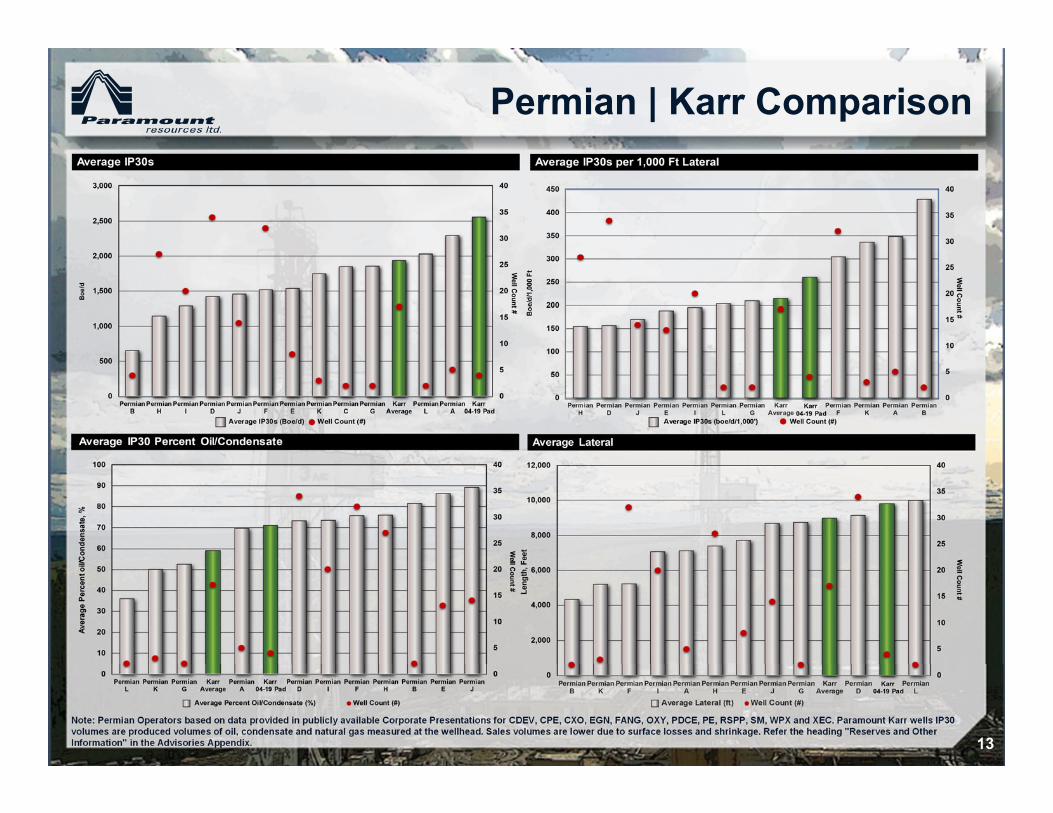
Permian | Karr Comparison
13Note: Permian Operators based on data provided in publicly available Corporate Presentations for CDEV, CPE, CXO, EGN, FANG, OXY, PDCE, PE, RSPP, SM, WPX and XEC. Paramount Karr wells IP30 volumes are produced volumes of oil, condensate and natural gas measured at the wellhead. Sales volumes are lower due to surface losses and shrinkage. Refer the heading "Reserves and Other Information" in the Advisories Appendix.

Kaybob Snapshot
14
Operational Highlights
• 2018 drill 21 hz Montney oil wells• 2018 drill 15 hz Duvernay wells from three pad
sites• Evaluating gas re-routing projects to reduce
operating costs
Asset Summary
• Three Montney assets and five Duvernay assets• Montney assets includes oil at Ante Creek and
Kaybob with gas at Presley/Fir• Duvernay assets range from volatile oil in
Kaybob North to wet gas in Kaybob Pine Creek• Operating and capital synergies due to overlap,
optimizations, and shared midstream/marketing
Kaybob Statistics• 136,000 net acres of Kaybob Duvernay • 200,000 net acres of Kaybob & Ante Creek
Montney• P+P inventory of 226 locations• P+P and high grade inventory of >850 locations (1)
• Operated gas plants and oil batteries
(1) Refer to the heading “Reserves and Other Information” in the Advisories Appendix.

Central Alberta & Other Snapshot
15
Operational Highlights• 2 hz Duvernay 2018 wells planned at Willesden
Green• 3 hz Glauconite 2018 wells planned at Leafland• Continue to monitor the performance of the 02/13-
05 Duvernay well which has a peak IP30 (oil) rate of 492 Bbl/d (total producing days 148)(1)
Asset Summary• Contiguous Willesden Green Duvernay position
with 2x over-pressure oil fairway• Large fee title land position across resource plays
in Ellerslie, Glauconite, and Cardium• Material acreage positions in the Ellerslie,
Glauconite, and Cardium• Owned and operated gas processing facilities
Central Alberta & Other Statistics
• ~91,000 net-acres of Willesden Green and East Shale Basin Duvernay
• 176,000 net-acres of fee title lands• 95,517 net acres of core Ellerslie lands • 76,879 net acres of core Glauconite lands • 187,770 net acres of core Cardium lands
(1) Refer to the heading “Reserves and Other Information” in the Advisories Appendix.
2018 Budget
16
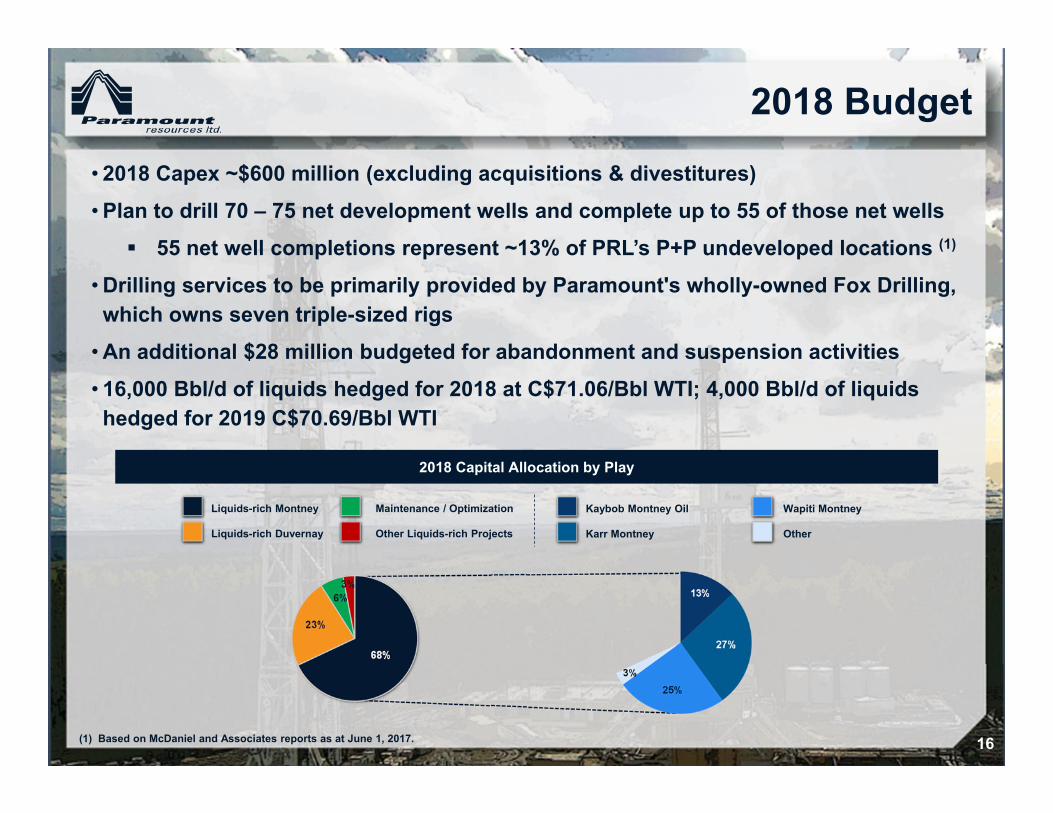
2018 Capital Allocation by Play
• 2018 Capex ~$600 million (excluding acquisitions & divestitures)• Plan to drill 70 – 75 net development wells and complete up to 55 of those net wells 55 net well completions represent ~13% of PRL’s P+P undeveloped locations (1)
• Drilling services to be primarily provided by Paramount's wholly-owned Fox Drilling, which owns seven triple-sized rigs
• An additional $28 million budgeted for abandonment and suspension activities • 16,000 Bbl/d of liquids hedged for 2018 at C$71.06/Bbl WTI; 4,000 Bbl/d of liquids hedged for 2019 C$70.69/Bbl WTI
Liquids-rich Montney
Liquids-rich Duvernay
Maintenance / Optimization
Other Liquids-rich Projects
Kaybob Montney Oil
Karr Montney
Wapiti Montney
Other
(1) Based on McDaniel and Associates reports as at June 1, 2017.

The New Paramount
17
Significantly ExpandedScale with Financial
Flexibility
~100,000 Boe/d intermediate E&P company with an extensive portfolio of liquids-rich unconventional plays and the financial strength to exploit those opportunities
Reserves: 147 MMBoe PDP, 345 MMBoe Proved, 600 MMBoe P+P (1)
Strong Liquidity: $700 MM 4-year revolving credit facility; expandable to $1 Billion (2)
Low Leverage: Q3/17 net debt ~$564 MM (3) (incl. $300 MM notes due Dec 2019)
Diversified Asset Portfolio with Multiple
Resource Plays
Large inventory of repeatable drilling locations in multiple resource development projects
Projects at various stages in the development lifecycle, from harvesting to piloting Cash flow from existing larger production base and free cash flowing projects to be
redeployed into liquids-rich growth projects Greater proportion of lower decline production
Opportunities to Realize Material Synergies
Economies of scale and cost reductions through optimization of field teams, infrastructure and commercial contracts
Consolidation of corporate organizations, systems, processes and G&A
(1) Refer to the heading “Reserves and Other Information” in the Advisories Appendix.(2) Through the exercise of $300 MM accordion feature.(3) Refer to the heading “Non-GAAP Measures” in the Advisories Appendix.
Appendix: Asset Detail
18

Karr Montney Asset Detail (1)
19
Operational Highlights
• Rig released all 27 wells within 10% of budget• 26 net wells on production and 1 well under
completion (2017 budget)• 2018 activity: drill and complete two 5-well
pads• Average peak 30-day wellhead rate of 2,011
Boe/d (~60% condensate) from 21 wells with between 30 and 307 (average 134) days of production (1)
Asset Potential
• ~45,000 net acres of liquids-rich Montney rights• P+P inventory of 76 locations plus over 150
internal high grade locations (1)
• Next growth phase will see 06-18 Facility expanded from 80 MMcf/d to 100 MMcf/d for late 2018
• Further growth phases in 50 MMcf/d increments up to 200 MMcf/d (2020 & 2021)
(1) Refer to the heading “Reserves and Other Information” in the Advisories Appendix.
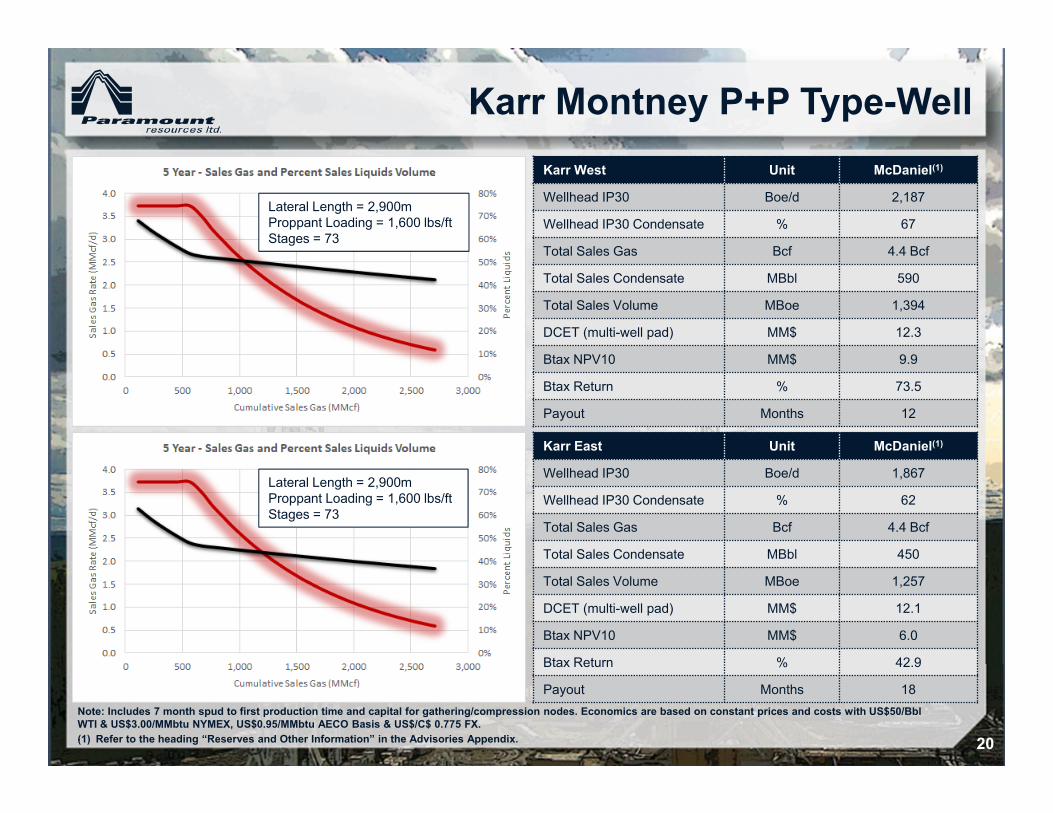
Karr Montney P+P Type-Well
20
Note: Includes 7 month spud to first production time and capital for gathering/compression nodes. Economics are based on constant prices and costs with US$50/BblWTI & US$3.00/MMbtu NYMEX, US$0.95/MMbtu AECO Basis & US$/C$ 0.775 FX..(1) Refer to the heading “Reserves and Other Information” in the Advisories Appendix.
Karr West Unit McDaniel(1)
Wellhead IP30 Boe/d 2,187
Wellhead IP30 Condensate % 67
Total Sales Gas Bcf 4.4 Bcf
Total Sales Condensate MBbl 590
Total Sales Volume MBoe 1,394
DCET (multi-well pad) MM$ 12.3
Btax NPV10 MM$ 9.9
Btax Return % 73.5
Payout Months 12
Karr East Unit McDaniel(1)
Wellhead IP30 Boe/d 1,867
Wellhead IP30 Condensate % 62
Total Sales Gas Bcf 4.4 Bcf
Total Sales Condensate MBbl 450
Total Sales Volume MBoe 1,257
DCET (multi-well pad) MM$ 12.1
Btax NPV10 MM$ 6.0
Btax Return % 42.9
Payout Months 18
Lateral Length = 2,900mProppant Loading = 1,600 lbs/ftStages = 73
Lateral Length = 2,900mProppant Loading = 1,600 lbs/ftStages = 73

Wapiti Montney Asset Detail (1)
21
Operational Highlights• 9-3 pad drilling begun (total 11 2018 wells)• Additional 11 2018 wells to be drilled from 5-3 pad• Testing new Montney zone in East Block• Third party gas plant and infrastructure under
construction with scheduled Q2 2019 in-service• Paramount completion design on new wellsAsset Potential• ~49,000 net acres of liquids rich Montney• Up to three development layers have been tested• P+P inventory of 96 locations • P+P and internal high grade of ~500 locations(1)
• Paramount is anchor tenant in gas plant and infrastructure 150 MMcf/d expandable to 300 MMcf/dDelineation & Retention(Open Hole Packers)
Zone
Peak 24 HrTest Rate(Wellhead)
Boe/d
Condy%
(Wellhead)
ProppantIntensity
Lbs/ft
00/13-18-67-7W6 UM 913 26 70200/01-07-67-7W6 LM 1,462 20 70702/04-08-67-7W6 UM 1,693 41 1,03702/01-16-69-6W6 MM 1,336 48 54900/01-16-69-6W6 MM 1,381 62 68102/01-29-68-6W6 LM 1,032 71 1,32500/09-23-67-6W6 LM 3,725 50 924
(1) Refer to the heading “Reserves and Other Information” in the Advisories Appendix.

Wapiti Montney P+P Type-Well
22
Note: Includes 7 month spud to first production time and capital for gathering/compression nodes. Economics are based on constant prices and costs with US$50/BblWTI & US$3.00/MMbtu NYMEX, US$0.95/MMbtu AECO Basis & US$/C$ 0.775 FX.(1) Refer to the heading “Reserves and Other Information” in the Advisories Appendix.
Wapiti West Unit McDaniel(1)
Wellhead IP30 Boe/d 1,592
Wellhead IP30 Condensate % 53
Total Sales Gas Bcf 6.6 Bcf
Total Sales Condensate MBbl 288
Total Sales Volume MBoe 1,551
DCET (multi-well pad) MM$ 11.8
Btax NPV10 MM$ 4.6
Btax Return % 29.8
Payout Months 25
Wapiti East Unit McDaniel(1)
Wellhead IP30 Boe/d 1,847
Wellhead IP30 Condensate % 59
Total Sales Gas Bcf 5.7 Bcf
Total Sales Condensate MBbl 540
Total Sales Volume Mboe 1,629
DCET (multi-well pad) MM$ 11.1
Btax NPV10 MM$ 9.2
Btax Return % 61.8
Payout Months 13
Lateral Length = 2,900mProppant Loading = 1,600 lbs/ftStages = 73
Lateral Length = 3,000mProppant Loading = 1,600 lbs/ftStages = 75

Kaybob Duvernay Asset Details (1)
23
Operational Highlights• Smoky 10-35 pad: 5 wells drilled to intermediate
casing point• Kaybob South 7-22 pad: first of 5 wells spud• Kaybob South 7-28 pad: 6 wells planned• Near-term data acquisition projects include fiber for
optimizing well placement, well spacing and cluster designAsset Potential
• ~136,000 core Kaybob Duvernay acres • Development focus on Smoky and Kaybob South• P+P inventory of 110 locations• P+P and internal high grade ~400 locations(1)
Kaybob Smoky• Near-term production to Smoky 06-16 Gas Plant
with two options for longer-term growth including Kaybob 08-09 Gas Plant and SemCAMs KA
Kaybob South• Existing 40 MMcf/d third party capacity from field
to sales with expansion options for up to 40 MMcf/d of incremental capacity
(1) Refer to the heading “Reserves and Other Information” in the Advisories Appendix.
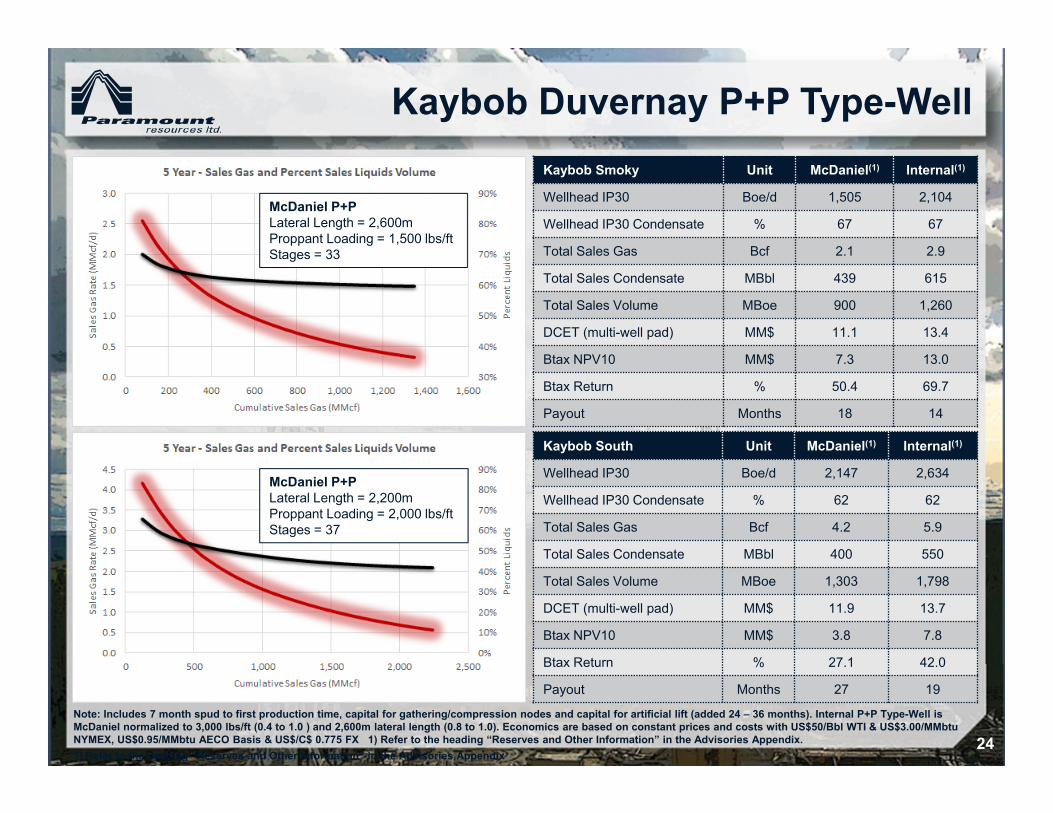
Kaybob Duvernay P+P Type-Well
24
Kaybob Smoky Unit McDaniel(1) Internal(1)
Wellhead IP30 Boe/d 1,505 2,104
Wellhead IP30 Condensate % 67 67
Total Sales Gas Bcf 2.1 2.9
Total Sales Condensate MBbl 439 615
Total Sales Volume MBoe 900 1,260
DCET (multi-well pad) MM$ 11.1 13.4
Btax NPV10 MM$ 7.3 13.0
Btax Return % 50.4 69.7
Payout Months 18 14
Kaybob South Unit McDaniel(1) Internal(1)
Wellhead IP30 Boe/d 2,147 2,634
Wellhead IP30 Condensate % 62 62
Total Sales Gas Bcf 4.2 5.9
Total Sales Condensate MBbl 400 550
Total Sales Volume MBoe 1,303 1,798
DCET (multi-well pad) MM$ 11.9 13.7
Btax NPV10 MM$ 3.8 7.8
Btax Return % 27.1 42.0
Payout Months 27 19
McDaniel P+PLateral Length = 2,600mProppant Loading = 1,500 lbs/ftStages = 33
McDaniel P+PLateral Length = 2,200mProppant Loading = 2,000 lbs/ftStages = 37
Note: Includes 7 month spud to first production time, capital for gathering/compression nodes and capital for artificial lift (added 24 – 36 months). Internal P+P Type-Well is McDaniel normalized to 3,000 lbs/ft (0.4 to 1.0 ) and 2,600m lateral length (0.8 to 1.0). Economics are based on constant prices and costs with US$50/Bbl WTI & US$3.00/MMbtuNYMEX, US$0.95/MMbtu AECO Basis & US$/C$ 0.775 FX 1) Refer to the heading “Reserves and Other Information” in the Advisories Appendix.1) Refer to the heading “Reserves and Other Information” in the Advisories Appendix

Kaybob Montney Oil Development (1)
25
Operational Highlights• 22 gross wells were drilled and completed in 2017• 2018 activity: drill and complete 21 hz wells• New completion design has 45% more stages and
290% higher proppant loading intensity
Asset Potential• Discovered 2011 with ~140 wells drilled to date• ~32,000 net-acres • P+P inventory of 75 locations with an additional 100
internal high grade locations (1)
• Paramount 12-10 Battery with 20,000 Bbl/d of sour fluid handling capacity
Description Wells Average First 3 Months Oil
On Production 2011 18 38,271 Bbl
On Production 2012 25 44,325 Bbl
On Production 2013 35 27,125 Bbl
On Production 2014/15 31 17,983 Bbl
New Completion Design 2016/17 11 34,368 Bbl
McDaniel Average P+P Type Well N/A 25,700 Bbl
(1) Refer to the heading “Reserves and Other Information” in the Advisories Appendix.

Kaybob Montney P+P Type Well
26
Kaybob Montney Unit McDaniel(1) Internal(1)
Wellhead IP30 Boe/d 545 658
Wellhead IP30 Oil % 80 80
Total Sales Gas Bcf 0.6 0.6
Total Sales Oil/Condensate MBbl 152 152
Total Sales Volume MBoe 258 258
DCET (multi-well pad) MM$ 3.0 3.0
Btax NPV10 MM$ 2.0 3.0
Btax Return % 62.1 106.4
Payout Months 12 8
McDaniel P+PLateral Length = 2,000mProppant Loading = 167 lbs/ftStages = 40
Completion Design Update
• New completion design has 45% more stages and 290% higher proppant loading intensity
• Internal P+P type well assumes recovery of 100 MBbl in first three years versus McDaniel average P+P which recovers 100 MBbl in first five years
• Acceleration of recoveries only (no incremental reserves), same design, and same cost
Note: Includes 7 month spud to first production time and capital for gathering/compression nodes. Economics are based on constant prices and costs with US$50/BblWTI & US$3.00/MMbtu NYMEX, US$0.95/MMbtu AECO Basis & US$/C$ 0.775 FX(1) Refer to the heading “Reserves and Other Information” in the Advisories Appendix.
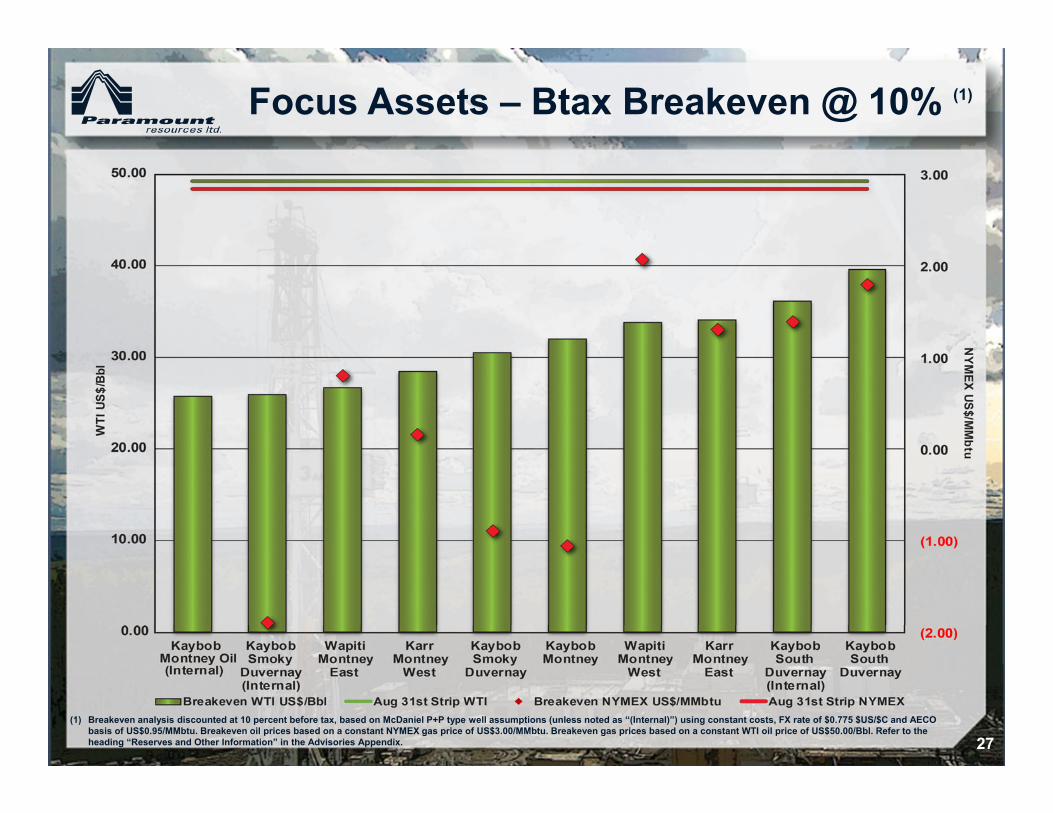
Focus Assets – Btax Breakeven @ 10% (1)
27(1) Breakeven analysis discounted at 10 percent before tax, based on McDaniel P+P type well assumptions (unless noted as “(Internal)”) using constant costs, FX rate of $0.775 $US/$C and AECO
basis of US$0.95/MMbtu. Breakeven oil prices based on a constant NYMEX gas price of US$3.00/MMbtu. Breakeven gas prices based on a constant WTI oil price of US$50.00/Bbl. Refer to the heading “Reserves and Other Information” in the Advisories Appendix.
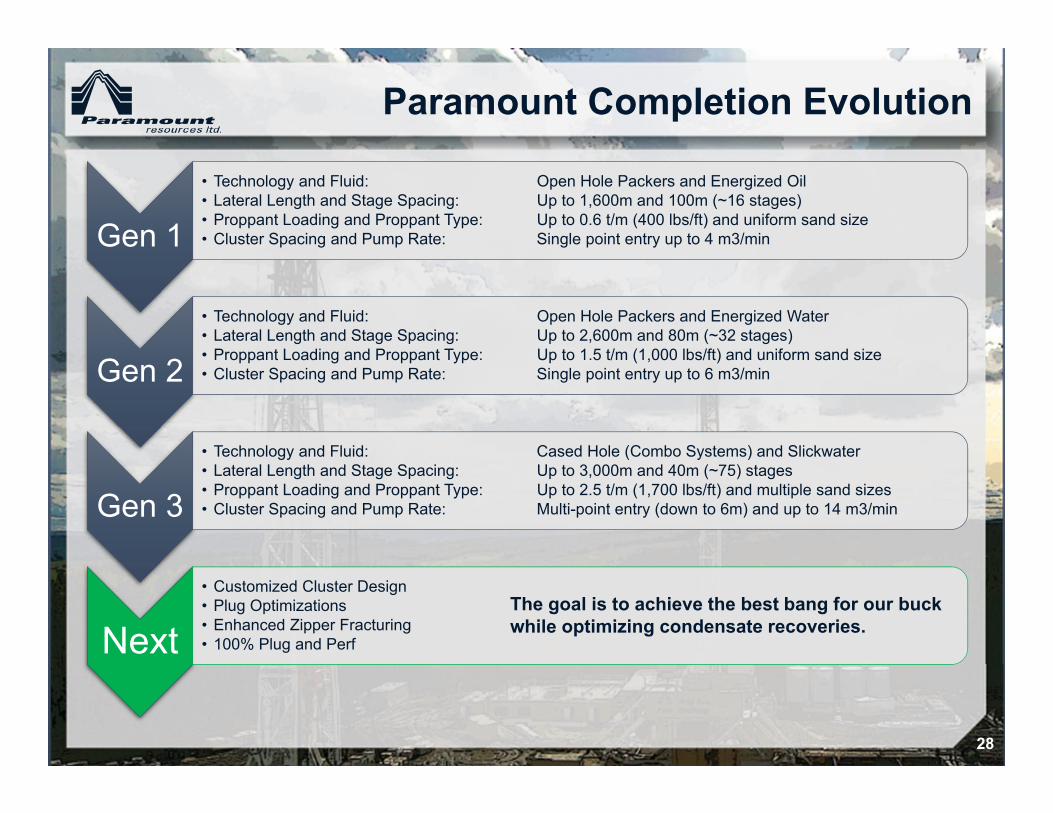
Paramount Completion Evolution
28
Gen 1
• Technology and Fluid: Open Hole Packers and Energized Oil• Lateral Length and Stage Spacing: Up to 1,600m and 100m (~16 stages)• Proppant Loading and Proppant Type: Up to 0.6 t/m (400 lbs/ft) and uniform sand size• Cluster Spacing and Pump Rate: Single point entry up to 4 m3/min
Gen 2
• Technology and Fluid: Open Hole Packers and Energized Water• Lateral Length and Stage Spacing: Up to 2,600m and 80m (~32 stages)• Proppant Loading and Proppant Type: Up to 1.5 t/m (1,000 lbs/ft) and uniform sand size• Cluster Spacing and Pump Rate: Single point entry up to 6 m3/min
Gen 3
• Technology and Fluid: Cased Hole (Combo Systems) and Slickwater• Lateral Length and Stage Spacing: Up to 3,000m and 40m (~75) stages• Proppant Loading and Proppant Type: Up to 2.5 t/m (1,700 lbs/ft) and multiple sand sizes• Cluster Spacing and Pump Rate: Multi-point entry (down to 6m) and up to 14 m3/min
Next• Customized Cluster Design• Plug Optimizations• Enhanced Zipper Fracturing• 100% Plug and Perf
The goal is to achieve the best bang for our buck while optimizing condensate recoveries.

Appendix: Paramount Investments & Performance
29

Strategic and Long-Term Investments
30(1) Please refer to the heading “Reserves and Other Information” in the Advisories Appendix. (2) Publicly disclosed by competitor.
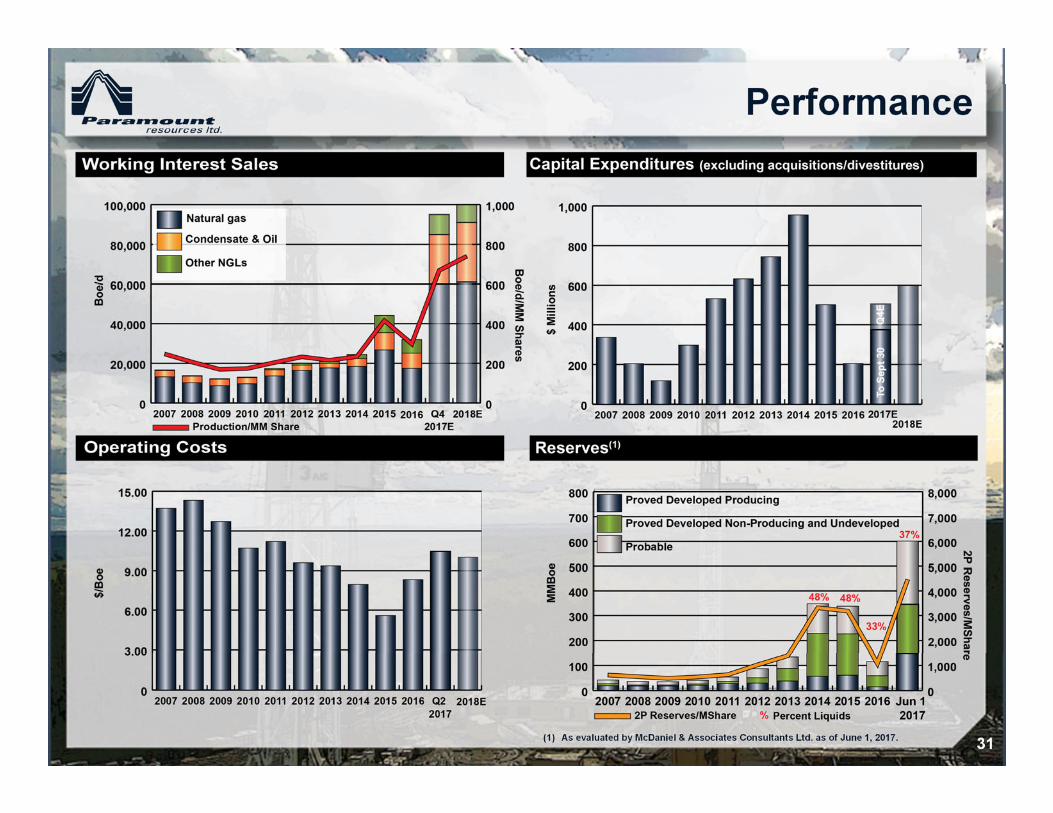
Performance
31(1) As evaluated by McDaniel & Associates Consultants Ltd. as of June 1, 2017.
Advisories Appendix

Advisories
33
Forward-Looking Information
Certain statements in this presentation constitute forward-looking information under applicable securities legislation. Forward-looking information typically contains statements with words such as "anticipate", "believe", "estimate", "will", "expect", "plan", "intend", "propose", or similar words suggesting future outcomes or an outlook.
Forward-looking information in this presentation includes, but is not limited to: projected production and sales volumes (and the liquids component thereof); forecast capital expenditures (including the plays, regions and activities where, or in respect ofwhich, this capital is expected to be spent); projected operating costs per BOE and abandonment and reclamation costs; estimated revenues and netbacks per BOE underdifferent pricing scenarios (and the portions of such revenues attributable to oil and condensate, other NGLs and natural gas production and the foreign exchange rate,royalty, transportation cost and operating expense assumptions used to generate these estimates); reserves and resource estimates; exploration, development andassociated operational plans and strategies (including planned drilling and completion programs, facility expansions and potential increases in third party processing andrelated capacities); estimated numbers of drilling locations; forecast liquids yields from, and gross liquids and total production potential of, each of the Company’s mainoperating areas as well as the estimated break-even prices for production from and the projected internal rates of return and discounted net present value of wells in each ofthese areas; ongoing enhancements in Paramount’s well completion techniques; the projected ability of the Company’s existing midstream infrastructure and commitmentsto facilitate its Montney and Duvernay development plans through 2021; anticipated opportunities to increase third party fee revenue from non-core midstream assets andrealize operating and capital synergies in the Kaybob area; anticipated benefits and results from the acquisition of Apache and merger with Trilogy; projected type wellproduction profiles (including the liquids component thereof) and associated net present value, internal rate of return and payout estimates (and the initial production rate,sales volumes, capital and operating cost, liquids yield, commodity price and other assumptions used to generate such profiles and estimates); liquidity and financialresources to develop the Company’s plays; and general business strategies and objectives.
Such forward-looking information is based on a number of assumptions which may prove to be incorrect. Assumptions have been made with respect to the following matters, in addition to any other assumptions identified in this presentation or Paramount’s continuous disclosure documents:future natural gas and liquids prices; royalty rates, taxes and capital, operating, general & administrative and other costs; foreign currency exchange rates and interestrates; general economic, market and business conditions; the ability of Paramount to obtain the required capital to finance its exploration, development and other operationsand meets its commitments and financial obligations; the ability of Paramount to obtain equipment, services, supplies and personnel in a timely manner and at anacceptable cost to carry out its activities; the ability of Paramount to secure adequate product processing, transportation, de-ethanization, fractionation and storage capacityon acceptable terms; the ability of Paramount to market its natural gas and liquids successfully to current and new customers; the ability of Paramount and its industrypartners to obtain drilling success (including in respect of anticipated production volumes, reserves additions, liquids yields and resource recoveries) and operationalimprovements, efficiencies and results consistent with expectations; the timely receipt of required governmental and regulatory approvals; and anticipated timelines andbudgets being met in respect of drilling programs and other operations.
Although Paramount believes that the expectations reflected in such forward-looking information are reasonable, undue reliance should not be placed on them as Paramount can give no assurance that such expectations will prove to be correct. Forward-looking information is based on current expectations, estimates and projections that involve a number of risks and uncertainties which could cause actual results to differ materially from those anticipated by Paramount and described in the forward-looking information. These risks and uncertainties include and/or relate (but are not limited) to:fluctuations in natural gas and liquids prices; changes in foreign currency exchange rates and interest rates; the uncertainty of estimates and projections relating to futurerevenue, future production, reserve additions, liquids yields (including condensate to natural gas ratios), resources recoveries, royalty rates, taxes and costs and expenses;the ability to secure adequate product processing, transportation, de-ethanization, fractionation and storage capacity on acceptable terms; operational risks in exploring for,developing and producing natural gas and liquids; the ability to obtain equipment, services, supplies and personnel in a timely manner and at an acceptable cost; potentialdisruptions or unexpected technical or other difficulties in designing, developing, expanding or operating new, expanded or existing facilities (including third-partyfacilities); processing, pipeline, de-ethanization, and fractionation infrastructure outages, disruptions and constraints; risks and uncertainties involving the geology of oiland gas deposits; the uncertainty of reserves and resources estimates; general business, economic and market conditions; the ability to generate sufficient cash flow fromoperations and obtain financing to fund planned exploration, development and operational activities and meet current and future commitments and obligations (includingproduct processing, transportation, de-ethanization, fractionation and similar commitments and debt obligations); changes in, or in the interpretation of, laws, regulations orpolicies (including environmental laws); the ability to obtain required governmental or regulatory approvals in a timely manner and to enter into and maintain leases andlicenses; the anticipated benefits from the acquisition of Apache and merger with Trilogy not being realized; the effects of weather;
the timing and costs of future abandonment and reclamation obligations and potential liabilities for environmental damage and contamination; uncertainties regarding aboriginalclaims and in maintaining relationships with local populations and other stakeholders; the outcome of existing and potential lawsuits, regulatory actions, audits andassessments; and other risks and uncertainties described elsewhere in this presentation and in Paramount’s filings with Canadian securities authorities, including its AnnualInformation Form.
The foregoing list of risks is not exhaustive. Additional information concerning these and other factors which could impact Paramount are included in Paramount’s Annual Information Form. The forward-looking information contained in this presentation is made as of the date hereof and, except as required by applicable securities law, Paramount undertakes no obligation to update publicly or revise any forward-looking statements or information, whether as a result of new information, future events or otherwise.
Oil and Gas Measures and Definitions
Abbreviations
Liquids Natural Gas Oil Equivalent
Bbl Barrels Mcf Thousands of cubic feet Boe Barrels of oil equivalentMBbl Thousands of barrels Bcf Billions of cubic feet MBoe Thousands of barrels of oil equivalentBbl/d Barrels per day MMcf/d Millions of cubic feet per day MMBoe Millions of barrels of oil equivalent NGLs Natural gas liquids Boe/d Barrels of oil equivalent per dayCondensate Pentane and heavier hydrocarbons
All natural gas equivalency volumes have been derived using the ratio of six thousand cubic feet of natural gas to one barrel of oil. Equivalency measures may be misleading, particularly if used in isolation. A conversion ratio of six thousand cubic feet of natural gas to one barrel of oil is based on an energy equivalency conversion method primarily applicable at the burner tip and does not represent a value equivalency at the well head. During the nine months ended September 30, 2017, the value ratio between crude oil and natural gas was approximately 23:1. This value ratio is significantly different from the energy equivalency ratio of 6:1. Using a 6:1 ratio would be misleading as an indication of value.
Reserves and Other Information
The Company’s reserves, including the reserves acquired in the acquisition of Apache Canada Ltd. (ʺApache Canadaʺ) and the merger with Trilogy Energy Corp. (ʺTrilogyʺ), were evaluated by McDaniel and Associates Consultants Ltd. (ʺMcDanielʺ) as of June 1, 2017 (the ʺMcDaniel Reserve Reportsʺ). P+P Undeveloped Locations referred to in this document are the gross number of undrilled well locations included in the McDaniel Reserve Reports. P+P and High Grade Locations referred to in this document are the P+P Undeveloped Locations plus internally identified high grade locations which have not been assigned reserves by McDaniel. Internal high grade is based on internal economic thresholds and recovery schemes. Internal remaining is based on reduced economic thresholds and more aggressive recovery schemes. Other properties include Montney assets at Birch, Presley, Fir, Ante Creek, Smoky, and Resthaven. Other properties include Duvernay assets at Kaybob North, Kaybob Bigstone, Kaybob Pine Creek, and Willesden Green.
Estimated future revenue is not necessarily representative of the fair market value of our properties and reserve volumes only and there is no guarantee that the volumes will be recovered.
Type well information labelled ‘McDaniel’ is derived from type well models incorporated in the McDaniel Reserve Reports. Type well information labelled ‘Internal’ is derived from internally generated type well models. The term “IRR” means the internal rate of return. IRRs are subject to a number of assumptions and risks, some of which are described herein and, accordingly, actual IRRs achieved may be materially different than that projected.
The terms "IP 30” and “IP90” or “first three months” mean the initial 30 days or 90 days of production, as applicable. Peak 30 Day IP is the highest daily average production rate over a 30-day consecutive period for an individual well, measured at the wellhead. Sales volumes will be lower due to shrinkage. "IP 30“, “IP90” and “Peak” production rates and performance are not necessarily indicative of long-term performance or ultimate recovery.
Advisories (con't)
34
Paramount has provided information with respect to certain of its plays and emerging opportunities which is "analogous information" as defined in NI 51-101. This analogous information includes Paramount's internally generated production type curves for certain of its wells, internal estimates of estimated ultimate recovery ("EUR") (as defined in the Society of Petroleum Engineers - Petroleum Resources Management System) and total sales volumes. This analogous information is derived from Paramount's internal sources as well as from a variety of publicly available information sources which are predominantly independent in nature (however, it is not clear in all cases whether analogous information derived from public sources was prepared by a qualified reserves evaluator or in accordance with the Canadian Oil and Gas Evaluation Handbook). These type curves and estimates are subject to the specific assumptions identified by Paramount with respect thereto, and the other assumptions contained in these advisories. No reserves, or resources other than reserves, are assigned to these type curve or EUR estimates and, accordingly, such estimates may not be representative of the actual production rates or resources associated with Paramount's wells and properties. The estimates of reserves for individual properties may not reflect the same confidence level as estimates of reserves for all properties, due to the effects of aggregation.
Analogous information is presented on a basin, sub-basin or area basis utilizing data derived from Paramount’s internal sources as well as from a variety of publicly available sources which are predominantly independent in nature. Internal estimates are subject to the specific assumptions identified by Paramount in respect of such estimates plus other assumptions contained herein, and are not necessarily representative of the actual resources associated with Paramount’s properties.
The Liard Basin estimates set forth herein are as publicly disclosed by a large U.S. public E&P company . The resource evaluation disclosed by such E&P company was not noted as having been prepared independently or by a qualified reserves evaluator or auditor (as such terms are defined in NI 51-101) or in accordance with the Canadian Oil and Gas Evaluation Handbook. This information is relevant to Paramount’s landholdings in the Liard Basin as the information is in respect of landholdings in the Liard Basin that are close to Paramount’s lands and are, accordingly, likely to have similar geology.
Test Results
The test rates disclosed in this document represent the average rate of production at the wellhead during post clean-up production testing at the largest choke setting. Pressure transient analyses and well-test interpretations have not been carried out for any of these wells and, as such, all data should be considered preliminary until such analyses or interpretations have been done. Test results are not necessarily indicative of long-term performance or of ultimate recovery.
Non-GAAP Measures
In this presentation "Net Debt", a non-GAAP measure, is used and does not have any standardized meaning as prescribed by GAAP. Net Debt is a measure of the Company’s overall debt position after adjusting for certain working capital and other amounts and is used by management to assess the Company’s overall leverage position. Refer to the Liquidity and Capital Resources section of the Company’s Management’s Discussion and Analysis for the calculation of Net Debt.
Non-GAAP measures should not be considered in isolation or construed as alternatives to their most directly comparable measure calculated in accordance with GAAP, or other measures of financial performance calculated in accordance with GAAP. Non-GAAP measures are unlikely to be comparable to similar measures presented by other issuers.
Advisories (con't)
35
