february 2, 2019 kilauea curiosities - science news
TRANSCRIPT
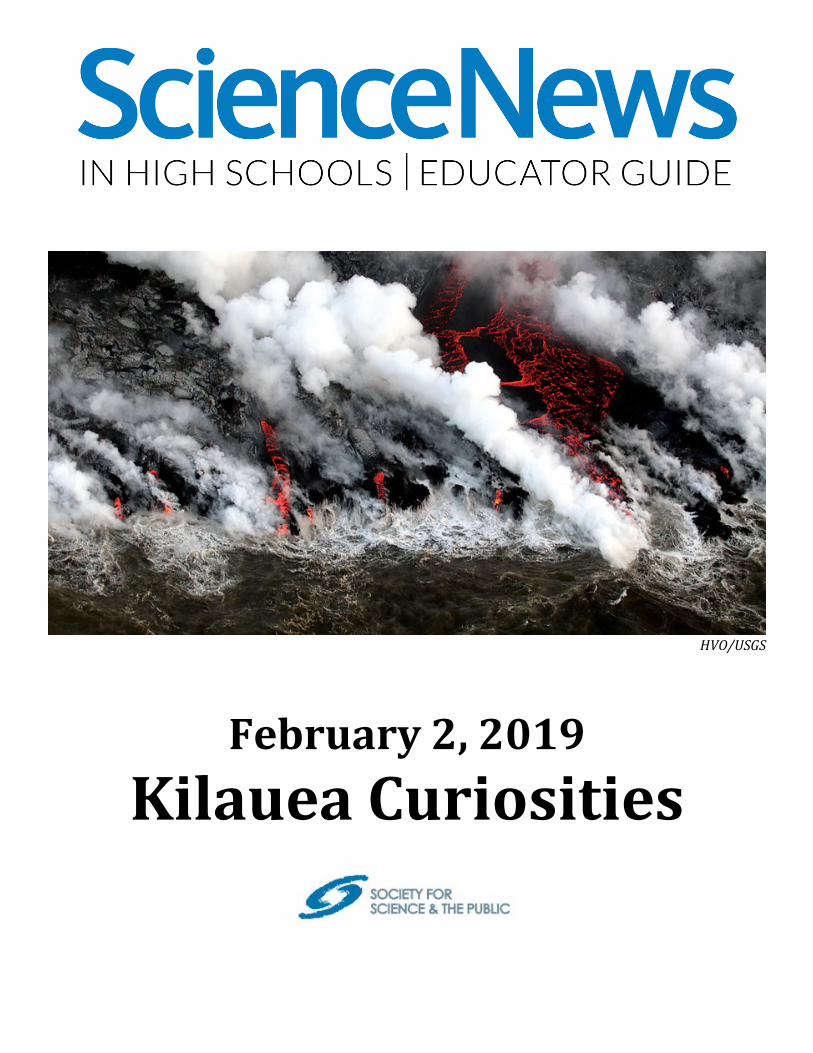
HVO/USGS
February 2, 2019
Kilauea Curiosities
February 2, 2019 Kilauea Curiosities
About this Guide Recent eruptions at Hawaii’s Kilauea volcano have given scientists a front-row seat to the volcanic processes that power the planet. Use this Guide to introduce students to Kilauea and its explosive nature. Students will find out what scientists have learned from Kilauea — including lessons from chemistry, physics, earth science and biology — and will explore the tools scientists use to monitor volcanoes more generally.
This Guide includes:
Article-based observation, Q&A — Students will answer questions based on the Science News article “Kilauea curiosities,” Readability: 11.1. Questions ask students to summarize lessons learned from Kilauea’s recent eruption, identify patterns in volcanic activity and consider cause and effect.
Article-based observations, questions only — These questions are formatted so it’s easy to print them out as a worksheet.
Cross-curricular connections, Q&A — Use these questions to help students explore concepts that cross disciplines including chemistry, physics, biology, earth science and public health. There’s one question for each section of the article, tagged with subject area. Concepts include volcanic explosivity and collapse, the ecosystem and health effects of volcanoes and how to keep people safe during natural disasters.
Cross-curricular connections, questions and resources — These questions are formatted so they can be printed and posted around the classroom for students to view as they discuss the answers. Summaries of the article sections and key terms are provided to facilitate discussion.
Activity: Volcanoes, Erupting Now?
Purpose: This activity will help students understand the tools and monitoring devices that scientists use to study ongoing volcanic activity. They will review volcano monitoring data and learn how to use it to predict possible volcano behavior.
Approximate time: 1 to 2 classes (depending on class presentations).
February 2, 2019 Kilauea Curiosities
Standards
Next Generation Science Common Core ELA
Matter and its Interactions: HS-PS1-5 Reading Informational Text (RI): 1, 2, 4, 5, 7
Motion and Stability: Forces and Interactions: HS-PS2-1, HS-PS2-2
Writing (W): 1, 2, 3, 4, 6, 7, 8, 9
Earth’s Systems: HS-ESS2-3 Speaking and Listening (SL): 1, 2, 4, 5, 6
Earth and Human Activity: HS-ESS3-1, HS-ESS3-5, HS-ESS3-6
Reading for Literacy in Science and Technical Subjects (RST): 1, 2, 3, 4, 5, 7, 8, 9
Ecosystems: Interactions, Energy, and Dynamics: HS-LS2-6
Writing Literacy in History/Social Studies and Science and Technical Subjects (WHST): 1, 2, 4, 7, 8, 9
Biological Evolution: Unity and Diversity: HS-LS4-2
Engineering Design: HS-ETS1-1, HS-ETS1-2, HS-ETS1-3
February 2, 2019 Kilauea Curiosities
Article-Based Observation, Q&A Directions: Ask students to answer the following questions based on the Science News article “Kilauea curiosities.”
1. Based on your own experience or what you may have seen in the news, do you know of any volcanoes that have erupted recently? What do you know about those eruptions? If you haven’t heard of a recent eruption, in what geographic area do you think recent eruptions may have occurred?
Kilauea, in Hawaii, has been continuously erupting for more than 30 years. In 2018, the eruption went into overdrive, spewing lava that destroyed many homes and toxic gases that were hazardous to people’s health. Students might also mention Mount Cleveland (2017), Bogoslof Island (2017) or Pavlof volcano (2016) in Alaska. And students might know about Volcán de Fuego in Guatemala (2018), Anak Krakatoa in Indonesia (2018), Calbuco in Chile (2015), Mount Etna in Italy (ongoing since 2013) or Iceland’s Eyjafjallajökull eruption (back in 2010).
2. What surprised scientists about the 2018 Kilauea eruption? Each of the five sections of the article highlights one lesson learned. Summarize each finding in one or two sentences.
Section 1: The recent eruption was particularly explosive because the molten rock was andesite, which isn’t usually found in Hawaii. Andesite contains more silica and gas bubbles than basalt, which added to the eruption’s explosive power.
Section 2: The eruption revealed how connected the volcano’s internal plumbing is. Researchers tracking collapses at the summit could warn colleagues monitoring the lava flows elsewhere in the field.
Section 3: Dozens of small collapses at Kilauea, occurring at regular intervals, spurred earthquakes and caused the caldera to sink more than 500 meters — more than the height of the Empire State Building.
Section 4: Once the eruption made it to the ocean, marine life sprouted up in the lava flows surprisingly fast. For instance, microbes set up homes along the edges of the flows by about 100 days after lava first entered the ocean.
Section 5: Kilauea’s recent eruption spouted some of the highest levels of toxic sulfur dioxide ever recorded at the volcano. At its most active, Kilauea released as much as 100 to 200 kilotons of the gas per day.
3. What are the two geological causes of volcanic activity mentioned in the article?
Some volcanoes form along regions where two tectonic plates meet and slip beneath one another. Others, like Kilauea, are fueled by a “hot spot,” or plume of magma, within Earth’s interior.
4. The article explains the pattern and rate of caldera collapse. Describe the collapse pattern. How does the stability of the volcanic system change as the caldera collapses?
The caldera collapsed in fairly regular intervals. As gas builds up in the magma chamber, the pressure of the system in the chamber increases, decreasing the stability of the volcanic system until it erupts. An eruption releases gas, decreasing the pressure in the magma chamber. This pressure release increases the system’s stability. As gas builds up in the magma chamber again, the pattern repeats itself.
5. How much new land did the 2018 lava flows create? Where was that land created?
The lava produced more than a cubic mile of new land along Hawaii’s southeast coast.
6. What is happening at Kilauea today? What clues suggest continuing activity?
Kilauea has calmed down, giving off less gas and producing fewer earthquakes. Some land movement around the Puu Oo vent suggests magma might still be moving beneath the ground. Researchers aren’t sure what Kilauea will do next.
7. What vocabulary term in the article was new or unfamiliar to you? Name the term and define it.
Example: Vog is a term used to describe volcanic smog. It is a gaseous mixture of water vapor, sulfur dioxide and carbon dioxide.
8. Based on your reading of the article, what types of scientists are interested in studying volcanic eruptions and why? If you’d like more information about volcano-related jobs, check out the Science News for Students article “Cool Jobs: Getting to know volcanoes.”
Volcanologists are geologists that study all aspects of how volcanoes form and erupt to better understand the behavior of volcanoes. Determining the nature and causes of eruptions might help forecast their occurrence, which would help keep people safe.
Geophysicists study the Earth itself and are interested in the relationships between volcanic eruptions and other geologic processes such as plate tectonics, mountain building and earthquakes. Geophysicists might also study volcanic eruptions like Kilauea’s to learn more about other planets that show signs of volcanic activity.
Biologists might study how a volcanic eruption affects life or new ecosystems that form in the wake of eruptions. Astrobiologists might use such information to explain how life could form in similar environments elsewhere in the solar system, such as Saturn’s moon Enceladus.
February 2, 2019 Kilauea Curiosities
Article-Based Observation, Q Directions: Answer the following questions based on the Science News article “Kilauea curiosities.”
1. Based on your own experience or what you may have seen in the news, do you know of any volcanoes that have erupted recently? What do you know about those eruptions? If you haven’t heard of a recent eruption, in what geographic area do you think recent eruptions may have occurred?
2. What surprised scientists about the 2018 Kilauea eruption? Each of the five sections of the article highlights one lesson learned. Summarize each finding in one or two sentences.
3. What are the two geological causes of volcanic activity mentioned in the article?
4. The article explains the pattern and rate of caldera collapse. Describe the collapse pattern. How does the stability of the volcanic system change as the caldera collapses?
5. How much new land did the 2018 lava flows create? Where was that land created?
6. What is happening at Kilauea today? What clues suggest continuing activity?

7. What vocabulary term in the article was new or unfamiliar to you? Name the term and define it.
8. Based on your reading of the article, what types of scientists are interested in studying volcanic eruptions and why? If you’d like more information about volcano-related jobs, check out the Science News for Students article “Cool Jobs: Getting to know volcanoes.”
February 2, 2019 Kilauea Curiosities
Cross-Curricular Connections, Q&A Directions: After reading “Kilauea curiosities,” students can connect the article to core concepts in chemistry, physics, biology, earth science and public health by discussing the following questions in groups. There’s one question for each section of the article, tagged with subject areas. Summaries of the sections and key terms are supplied on the “questions and resources” sheet below.
Suggestion for structuring discussion: Post the five questions that follow in five areas of the classroom. If you think it will encourage a more informed discussion, include the section summaries and key terms. Break your students up into five groups and ask each group to visit each discussion prompt and write down their answers. Reconvene to share as a full class if time permits.
Five discussion questions:
Section 1, Earth Science and Chemistry
Section 1 of the article states that the type of lava affected the explosiveness, or magnitude, of Kilauea’s eruption. Why would the amount of silica or gas bubbles in basalt lava, as compared with andesite lava, affect the magnitude of the eruption? What other factors would likely affect the magnitude of a volcanic eruption? Explain how a change in magnitude of a factor might affect the explosiveness of the eruption.
The composition, temperature and gas content of the magma all affect the explosiveness of an eruption. Andesite lava has a higher dissolved gas content than basalt lava, making it more explosive. Similar to opening a can of soda, as the external pressure on a solution with dissolved gases decreases, the dissolved gas becomes less soluble and is no longer held in solution. As magma rises toward the surface of the Earth, the external pressure decreases, and dissolved gases are no longer held in the magma. The amount, volume and pressure of the undissolved gases continue to increase until the system erupts to release the built up pressure. Magmas with greater amounts of dissolved gas are generally more explosive.
Magma’s temperature affects its viscosity, or its resistance to flow. The higher the temperature, the lower the viscosity. The percentage of silica in magma also affects the magma’s viscosity: The more silica present, the more viscous the magma and the more explosive the eruption.
Other factors such as eruption direction and location could also affect its explosiveness.
Section 2, Environmental Science, Public Health and Engineering Design
Thanks to data collected and an understanding of Kilauea’s internal plumbing, scientists were able to warn colleagues elsewhere about a possible eruption. Name and describe an instrument scientists use to predict and study potential volcanic activity. Imagine you were a scientist witnessing the collapse near the summit, write the warning message you would send your colleagues. What specific information about the volcano might you provide? If you were addressing local residents about a volcanic threat, what information would you provide and why?

Scientists use tiltmeters to study volcanic activity. Tiltmeters measure changes in the slope of the ground. The instruments can be used to measure changes on the surface of volcanoes caused by moving magma. Magma moving out of an area will cause the ground to depress. Magma moving into an area will cause the ground to swell. Other instruments to consider include seismometers and seismographs, GPS, infrared and time-lapse cameras, spectrometers for measuring volcanic gases, thermocouple probes for directly measuring lava temperature, electromagnetic ground conductivity mapping for determining how much magma is moving underground, and infrasound sensors to forecast eruptions before they happen.
Warning: At 3:00 p.m., the northeastern rim of the summit crater began collapsing. The collapse is large enough that it could trigger earthquakes. Expect tremors in your area and do what is necessary to keep yourself safe. For scientists working in the field, the most important information might be signs of ground deformation and other observations that could indicate an imminent eruption, as well as the likelihood of lahar flows in the area and volcanic gas levels in the atmosphere.
Students addressing local residents about a volcanic threat might include information on where the lava is flowing, where fissures are likely to erupt and the levels of gases and vog in the air. If possible, it would be good to include the area in danger and the time frame for the threat. This information is important for residents in case they need to stay inside due to poor air quality or evacuate because of the danger posed by other hazards. The information provided should be accurate and informative but should be presented in a way that does not panic the public.
Section 3, Chemistry and Physics
Kilauea’s caldera collapse is described as a “piston-style” collapse. Based on the definition of a piston and the article’s description of the collapse, how is the collapse like a piston and how is it unlike a piston? Draw a diagram to represent the progressive cycle of the collapse at Kilauea. Within your diagram, show the forces that explain each small collapse within the larger progression. Try to incorporate the quantitative data mentioned in Section 3 of the article into your diagram.
As magma rises closer to the Earth’s surface, the pressure on the surface causes the land to be pushed upward. The elevated land is held up by the pressure and upward force of the expanding magma. Once the pressure inside the magma chamber is too great, the volcano erupts and the magma escapes the magma chamber. Once the chamber has lost at least some of its magma, there are no longer upward forces from the magma holding up the overlying rock, so the rock collapses. The collapsing rock forms what is called the caldera. If the collapsing rock stays as a single block of land and loses elevation in a level manner, it is called a piston-style caldera collapse. The caldera, similar to a piston, is collapsing within a close-fitting chamber due to a drop in the force from the chamber below. Just like the piston, the caldera will continue to collapse until the upward pressure is equal to the downward pressure. The motion of a caldera collapse can be similar to the motion of a piston, but unlike a caldera, a piston is the moving part of a larger, man-made system, such as an engine or pump.
Student diagrams should show approximate force vectors of the magma chamber in equilibrium with the collapsed caldera. Students should show that the overlying land collapsed a distance of at least 500 meters.
Section 4, Biology and Environmental Science
How do you think the volcanic lava flow affected the marine ecosystem? Give a specific example of a complex interaction that exists among common plants and animals in a marine ecosystem. How would the ecosystem change over a period of time after the volcanic lava enters the ecosystem: What would change right after the lava event? What about in the weeks, months, decades and centuries that follow? Think about ecological succession, the stages of regrowth and the primary factors of evolution.
When lava eventually makes its way to the ocean, the water boils. The temperature increase can have a devastating effect on marine life. Fish, sea turtles and creatures trapped in tide pools often cannot escape the lava flow. Coral reefs that become covered by lava are destroyed. Reefs on the border of the lava flow are very likely to be stressed because of the hot water and large amount of sediment. Corals provide homes and food for many types of marine organisms. If reefs are destroyed or stressed, that could have a negative impact on the organisms that rely on corals.
Encourage students to think about ecological succession — the process by which ecosystems reestablish themselves after a natural disaster or human disturbance. Students might be more familiar with succession as it plays out in a forested habitat. What parallels can they draw to marine ecosystems? In the first few weeks and months after an eruption event, pioneer species including bacteria, algae and some microscopic predators are the first to colonize. These pioneer species help create an environment that’s appropriate for less hardy species. In the months following the eruption event, when conditions are more hospitable, new coral larvae might move in. But rebuilding coral reefs can take decades. As reefs grow, creatures such as sponges, anemones, fish, eels, crustaceans, turtles and more populate the area. But current global environmental conditions may impact reef growth. Stressors such as increasing ocean temperatures and ocean acidification may affect the ability of corals to bounce back to the form seen before the eruption.
It’s hard to predict what will happen in the centuries that follow; there are so many variables at play. But encourage students to consider the ways in which a changing environment might influence species and how species changes might shape reef evolution over time. Factors at play in established populations include the potential for species to increase in number, the heritable genetic variation of individuals due to mutation and sexual reproduction, competition for limited resources and the proliferation of organisms able to survive and reproduce in the environment.
Section 5, Environmental Science and Public Health
Section 5 of the article discusses the high levels of sulfur dioxide produced by Kilauea. Why is volcanic smog, or vog, a threat to local residents? What other threats might exist for local residents during an eruption, and how might these threats impact daily life? How does an active volcano affect its local environment more generally? What about the global environment? How would you go about creating a plan to mitigate one of the negative effects?
Health effects of vog exposure include eye, nose, throat and skin irritation, coughing, chest tightness and shortness of breath, fatigue and dizziness. People with asthma, cardiovascular disease and older adults might be at the highest risk for such health effects. Vog might also limit visibility on roads and for planes, and cause damage to jet engines. Other threats from volcanic eruptions include pyroclastic flows, when hot

gas and rock race downhill; mudflows called lahars; and lava flows. Volcanic eruptions come with risks of avalanches, earthquakes and tsunamis. These threats may lead to evacuations, damage to homes and infrastructure and reductions in local and regional travel. Local agriculture, fishing and tourism may suffer.
Volcanic activity can wipe out plants and destroy terrestrial and aquatic habitats, alter weather patterns and change air and soil composition. Large eruptions can eject enough gas and dust into the atmosphere to reduce the amount of solar radiation reaching the planet and thus have a cooling effect. Conversely, volcanoes can also belch greenhouse gases into the atmosphere, which can have a warming effect over millions of years.
Since we can’t control volcanic eruptions, the best ways to reduce deaths from volcanic activity are to increase public awareness and understanding of the risks and to set up monitoring, warning and evacuation plans. Some such plans are already in place, for example volcano-alert notification released by the USGS Volcano Observatory. Encourage students to consider what they would need to know to develop an effective and safe evacuation plan. Students might suggest talking with local residents about the dangers of eruptions and researching evacuation plans that have worked for other natural disasters.
February 2, 2019 Kilauea Curiosities
Cross-Curricular Connections, Q and Resources Directions: Each of the questions below relates to one of the sections of “Kilauea curiosities.” Review the section summary and key terms and then answer the questions based on your teacher’s instructions.
Section 1
Summary: The recent eruption at Kilauea was particularly explosive because the molten rock was andesite, which isn’t usually found in Hawaii. Andesite contains more silica and gas bubbles than basalt, which added to the eruption’s explosive power.
Key terms:
Andesite — A gray to black type of volcanic rock with about half the density of silica. Andesite lava commonly erupts from volcanoes in thick flows. They may travel great distances before hardening. Andesite magma can also trigger explosive eruptions characterized by pyroclastic flows.
Basalt — A type of black volcanic rock that tends to be very dense (unless volcanic eruptions seeded it with lots of air pockets).
Tectonic plates — The gigantic slabs, some spanning thousands of kilometers across, that make up Earth’s outer layer.
Hot spot — In this context, regions of the Earth’s mantle where rocks melt to generate magma. Geological hot spots are typically associated with volcanic activity.
Question:
Section 1 of the article states that the type of lava affected the explosiveness, or magnitude, of Kilauea’s eruption. Why would the amount of silica or gas bubbles in basalt lava, as compared with andesite lava, affect the magnitude of the eruption? What other factors would likely affect the magnitude of a volcanic eruption? Explain how a change in magnitude of a factor might affect the explosiveness of the eruption.
Section 2
Summary: The eruption revealed how connected the volcano’s internal plumbing is. Researchers tracking collapses at the summit could warn colleagues monitoring the lava flows elsewhere in the field.
Key terms:
Caldera — A crater that forms from a volcanic eruption and subsequent collapse.
Piston — A closed cylinder that moves up and down within a closely fitted larger cylindrical chamber by or against the pressure of a fluid. Pistons are the moving components used in engines, pumps and other similar mechanisms.
Pressure — Force applied uniformly over a surface, measured as force per unit of area.
Force — Some outside influence that can change the motion of a body, hold bodies close to one another or produce motion or stress in a stationary body.
Question:
Thanks to data collected and an understanding of the volcano’s internal plumbing, scientists were able to warn colleagues elsewhere about a possible eruption. Name and describe an instrument scientists use to predict and study potential volcanic activity. Imagine you were a scientist witnessing the collapse near the summit, write the warning message you would send your colleagues. What specific information about the volcano might you provide? If you were addressing local residents about a volcanic threat, what information would you provide and why?
Section 3
Summary: Dozens of small collapses at Kilauea, occurring at regular intervals, spurred earthquakes and caused the caldera to sink more than 500 meters — more than the height of the Empire State Building.
Key terms:
Summit crater — A large, bowl-shaped cavity in the uppermost part of a mountain or hill.
Fissure — A long, narrow opening that emerges in ice or rock. A fissure starts when pressure causes the material to crack and eventually split open.
Tiltmeter — A device that measures small changes in the tilt, or slope, of the ground or another surface. Tiltmeters are often used to monitor volcanoes, tracking land that swells or deflates because of moving magma below.
Volcanic Explosivity Index (VEI) — A numeric scale that measures the explosiveness of volcanic eruptions. According to the U.S. Geological Survey, volume of ejected rock and particles, the height of the eruption cloud and other observations are used to determine an explosivity value. The scale is logarithmic, meaning that each interval represents a tenfold increase in the observed criteria.
Question:
Kilauea’s caldera collapse is described as a “piston-style” collapse. Based on the definition of a piston and the article’s description of the collapse, how is the collapse like a piston and how is it unlike a piston? Draw a diagram to represent the progressive cycle of the collapse at Kilauea. Within your diagram, show the forces that explain each small collapse within the larger progression. Try to incorporate the quantitative data mentioned in Section 3 of the article into your diagram.
Section 4
Summary: Once the eruption made it to the ocean, marine life sprouted up in the lava flows surprisingly fast. For instance, microbes set up homes along the edges of the flows by about 100 days after lava first entered the ocean.
Key terms:
Microbes — Short for microorganisms. A living thing that is too small to see with the unaided eye, including bacteria, some fungi and many other organisms such as amoebas. Most consist of a single cell.
Hydrothermal activity — The movement of heated water beneath Earth’s surface. In some volcanic systems, hydrothermal activity is fueled by magma chambers that heat rocks. Those heated rocks then heat the surrounding water, causing the water to rise to the surface.
Species — A group of similar organisms capable of producing offspring that can survive and reproduce.
Ecosystem — A group of interacting living organisms, including microorganisms, plants and animals, and their physical environment within a particular climate. Examples include tropical reefs, rainforests, alpine meadows and polar tundra.
Question:
How do you think the volcanic lava flow affected the marine ecosystem? Give a specific example of a complex interaction that exists among common plants and animals in a marine ecosystem. How would the ecosystem change over a period of time after the volcanic lava enters the ecosystem: What would change right after the lava event? What about in the weeks, months, decades and centuries that follow? Think about ecological succession, the stages of regrowth and the primary factors of evolution.
Section 5
Summary: Kilauea’s recent eruption spouted some of the highest levels of toxic sulfur dioxide ever recorded at the volcano. At its most active, Kilauea released as much as 100 to 200 kilotons of the gas per day.
Key terms:
Sulfur dioxide — A compound made of sulfur and oxygen. It is one of the pollutants that can form when a fossil fuel is burned. It’s also a gas naturally emitted during volcanic eruptions. Its scientific symbol is SO2.
Vog — Volcanic smog that forms when sulfur dioxide and other gases and particles seep out of a volcanic fissure then react with oxygen, water vapor and sunlight.
Ash (in geology) — Small, lightweight fragments of rock and glass spewed by volcanic eruptions.
Lahar — A thick flow of mud, ash, soil and rocks. It can develop when rains mix with the materials being spewed during a volcanic eruption. This viscous mix can have the consistency of wet, newly mixed concrete. As it slides down a volcano’s slopes, it can destroy nearly everything in its path.
Question:

Section 5 of the article discusses the high levels of sulfur dioxide produced by Kilauea. Why is volcanic smog, or vog, a threat to local residents? What other threats might exist for local residents during an eruption, and how might these threats impact daily life? How does an active volcano affect its local environment more generally? What about the global environment? How would you go about creating a plan to mitigate one of the negative effects?

February 2, 2019 Kilauea Curiosities
Activity Guide for Teachers: Volcanoes, Erupting Now? Purpose: This activity will help students understand the tools and monitoring devices that scientists use to study ongoing volcanic activity. They will identify trends in monitoring data and relate those trends to volcanic behavior.
Procedural overview: After watching video clips about the Kilauea eruption and reading online materials, students will answer questions about the methods scientists use to study Kilauea. Students will then look for trends in data available for a specific monitoring technique and identify relationships between data and volcanic behavior. Finally, students will communicate their findings to the rest of the class.
Approximate time: 1 to 2 classes (depending on class presentations)
Supplies:
Activity Guide for Students
Classroom computer projector to show video clips about the Kilauea eruption
Computers for students to access the U.S. Geological Survey websites
Directions for teachers:
Depending on the time available, play some or all of the suggested video clips below to familiarize students with Kilauea and types of volcanic behavior. Discuss the importance of being able to monitor and predict volcanic behavior with your students. Ask students what it might feel like to live close to an active volcano, or if they would consider living close to an active volcano. Once students are finished with the activity, you could revisit the questions to see if student answers have changed.
Suggested videos:
Kilauea Summit Eruption: Lava returns to Halema‘uma‘u. This excellent 24-minute overview, made before the 2018 eruptions, gives background on Kilauea and how scientists study it.
Fissure eruption on May 5, 2018 (1:21)
Lava moving down a street on May 6, 2018 (0:24)
Fountaining at Fissure 20 on May 20, 2018 (0:27)
Help students access and explore the USGS Hawaiian Volcano Observatory website on monitoring techniques at volcanoes.usgs.gov/hvo/hvo_monitoring.html. Include the interactive data map, which shows earthquakes recorded within the last four weeks. Help students start to observe patterns in the data and relate these patterns to volcanic behavior.

Divide the students into four groups as outlined below. Assign each group to read and answer questions about one of the volcano monitoring techniques.
The last question for each section asks students to study available data and look for relationships between the data collected and volcanic behavior. Once students have completed this question, they can summarize and present their findings to the class.
Earthquakes
https://volcanoes.usgs.gov/observatories/hvo/hvo_monitoring_earthquakes.html
Deformation
https://volcanoes.usgs.gov/observatories/hvo/hvo_monitoring_deformation.html
Volcanic gas
https://volcanoes.usgs.gov/observatories/hvo/hvo_monitoring_gas.html
Geology
https://volcanoes.usgs.gov/observatories/hvo/hvo_monitoring_geology.html
Directions for students: Individually read the article assigned by your teacher and answer the questions that follow as a group. Be prepared to present a summary to the class.
Earthquake group: Read “Monitoring earthquakes in Hawaii” at https://volcanoes.usgs.gov/observatories/hvo/hvo_monitoring_earthquakes.html.
1. What did you learn from the first three paragraphs about the seismic network?
Seismic sensors measure ground shaking. Hawaiian Volcano Observatory maintains approximately 60 seismic measuring stations on the island of Hawaii and approximately 40 on other islands across the state.
2. What types of seismic instruments are used to record waves of sound and motion?
(1) Short-period sensors for wave periods of around 1 second. (2) Broadband sensors for wave periods from 0.01 to 120 seconds or higher. (3) Strong motion sensors that can accurately measure shaking even if it is stronger than gravity. (4) Infrasound microphones to measure seismic-related sound waves in air.
3. What characteristics of earthquakes do Hawaiian Volcano Observatory seismologists analyze and why?
Seismic data is analyzed for parameters such as: (1) Hypocenter and magnitude to locate the source and severity of earthquakes. (2) RSAM (Real-time Seismic Amplitude Measurement) to examine trends in average amplitudes over many sensors in a given area. (3) Swarm detection to spot clusters of events localized in time and space that may signal an eruption. (4) Tremor detection to track underground
movements of magma and gases.
4. How does the Hawaiian Volcano Observatory report seismic activity?
Via real-time internet updates, news releases and data analyzed and cataloged at a later time.
5. What can you learn from the earthquake data at https://volcanoes.usgs.gov/volcanoes/kilauea/monitoring_kilauea.html? What patterns do you see in the data and how does this relate to the volcanic activity at the time the data was collected? Is there a relationship that you can draw between the data and volcanic behavior?
Deformation group: Read “Deformation monitoring tracks moving magma and faults” at https://volcanoes.usgs.gov/observatories/hvo/hvo_monitoring_deformation.html.
1. What did you learn from the first two paragraphs about deformation monitoring?
Measurements of ground inflation or deflation can help to predict magma flow, eruptions and earthquakes.
2. In what level of detail can Global Positioning System (GPS) sites record ground motion?
Sites that monitor signals from GPS satellites can track ground deformations of less than 1 centimeter in real time.
3. How do tiltmeters record precise changes in ground slope?
Tiltmeters are installed in drill holes 3 to 5 meters below the surface (to avoid interference from weather and other surface effects) and make real-time electronic measurements to report any changes in the local ground slope that might be associated with magma flow.
4. How does Interferometric Synthetic Aperture Radar (InSAR) provide a snapshot of volcano deformation from air and space?
InSAR uses radar images of the ground taken from airplanes or satellites in order to create high-resolution maps of ground deformations.
5. What can you learn from the deformation data at https://volcanoes.usgs.gov/volcanoes/kilauea/monitoring_kilauea.html (click “Deformation Data” on the left side of the screen)? What patterns do you see in the data and how does this relate to the volcanic activity at the time the data was collected? Is there a relationship that you can draw between the data and volcanic behavior?
Volcanic gas group: Read “Monitoring volcanic gas in Hawaii” at https://volcanoes.usgs.gov/observatories/hvo/hvo_monitoring_gas.html.
1. What did you learn from the first three paragraphs about monitoring volcanic gas in Hawaii?
Gases drive volcanic eruptions, so it is important to measure the amount of various gases being produced. Sulfur dioxide (SO2) and carbon dioxide (CO2) are measured in detail, and other gases are measured to some degree as well.
2. How are sulfur dioxide (SO2) rates measured in real time at the Kilauea summit?
SO2 absorbs ultraviolet (UV) light from sunlight, so sensors measure the amount of UV light that penetrates from the sun through a volcanic plume to the sensor, in order to determine the amount of SO2 in the plume. Sensors are mounted facing upward on moving vehicles or on fixed ground stations, or directed across the lava lake.
3. How is the chemical composition of gas emissions measured by Fourier transform infrared (FTIR) spectroscopy?
A FTIR spectrometer analyzes the spectrum of infrared radiation collected by a telescope pointed at lava. Certain absorption or emission lines in the spectrum indicate the presence of different gases. The strength of each line indicates the amount of that gas.
4. How are CO2 and SO2 measured at Mauna Loa Volcano?
These gases are measured via an automated station that is actually located in the crater.
5. What can you learn from the graph of the amount of SO2 released annually during the period 1979–2016?
After a period of inactivity, the East Rift Zone began steadily emitting large amounts of SO2 in 1983. The summit began emitting a huge amount of SO2 in 2008. The Rift emissions drastically decreased in the early 2010s, perhaps because so much gas was being emitted by the summit. Now the summit isn’t emitting much SO2 either.
6. Click on the links at the bottom of the page and describe any useful additional information you find there. What patterns do you see in the data and how does this relate to the volcanic activity at the time the data was collected? Is there a relationship that you can draw between the data and volcanic behavior?
Geology group: Read “Geological monitoring of Hawaiian eruptions” at https://volcanoes.usgs.gov/observatories/hvo/hvo_monitoring_geology.html.
1. What did you learn from the first two paragraphs about field operations for tracking eruptions and assessing hazards?
Geological monitoring of lava and tephra (ejected rocks) involves some remote monitoring from cameras or aircraft but also a lot of field visits to collect and analyze lava and tephra samples.
2. How do lava-flow maps show the history of Hawaiian eruptions?
Lava flow positions can be recorded using GPS on the ground (slow but accurate) or from the air (fast but less accurate). Combining GPS data from the ground and air with aerial photographs shows how current lava flows are changing the landscape, and also how previous lava flows have built up the existing landscape of Hawaii.
3. How does measuring lava volume over time help to forecast hazards?
The effusion rate (volume of lava erupted per time) can be measured by estimating the flow area and thickness, by measuring the electromagnetic fields of flowing electrically conductive lava or by measuring the amount of associated SO2 released. Increased lava flow volume can be a warning sign for nearby researchers or structures.
4. How do webcams and time-lapse cameras improve interpretation and situational awareness?
Unlike human observers, cameras can be positioned in many different places and can monitor continuously in order to capture interesting events. These images can be combined with other types of measurements to get a better understanding of volcanic behavior and events.
5. How does monitoring lava and tephra chemistry identify changes in magma sources?
Magma that has come via different routes or spent different amounts of time in various locations underground has different fingerprints, in terms of its chemical composition. Analyzing the lava and tephra that result from that magma can indicate the origin, path and history of the magma.
6. Study the webcams at https://volcanoes.usgs.gov/volcanoes/kilauea/multimedia_webcams.html that show what Kilauea looks like in real time from many different angles. What patterns do you see in the data and how does this relate to the volcanic activity at the time the data was collected? Is there a relationship that you can draw between the data and volcanic behavior?
February 2, 2019 Kilauea Curiosities
Activity Guide for Students: Volcanoes, Erupting Now? Directions for students: Individually read the article assigned by your teacher and answer the questions that follow as a group. Be prepared to present a summary to the class.
Earthquake group: Read “Monitoring earthquakes in Hawaii” at https://volcanoes.usgs.gov/observatories/hvo/hvo_monitoring_earthquakes.html.
1. What did you learn from the first three paragraphs about the seismic network?
2. What types of seismic instruments are used to record waves of sound and motion?
3. What characteristics of earthquakes do Hawaiian Volcano Observatory seismologists analyze and why?
4. How does the Hawaiian Volcano Observatory report seismic activity?
5. What can you learn from the earthquake data at https://volcanoes.usgs.gov/volcanoes/kilauea/monitoring_kilauea.html? What patterns do you

see in the data and how does this relate to the volcanic activity at the time the data was collected? Is there a relationship that you can draw between the data and volcanic behavior?
Deformation group: Read “Deformation monitoring tracks moving magma and faults” at https://volcanoes.usgs.gov/observatories/hvo/hvo_monitoring_deformation.html.
1. What did you learn from the first two paragraphs about deformation monitoring?
2. In what level of detail can Global Positioning System (GPS) sites record ground motion?
3. How do tiltmeters record precise changes in ground slope?
4. How does Interferometric Synthetic Aperture Radar (InSAR) provide a snapshot of volcano deformation from air and space?
5. What can you learn from the deformation data at https://volcanoes.usgs.gov/volcanoes/kilauea/monitoring_kilauea.html (click “Deformation Data” on the left side of the screen)? What patterns do you see in the data and how does this relate to the volcanic activity at the time the data was collected? Is there a relationship that you can draw between the data and volcanic behavior?
Volcanic gas group: Read “Monitoring volcanic gas in Hawaii” at https://volcanoes.usgs.gov/observatories/hvo/hvo_monitoring_gas.html.
1. What did you learn from the first three paragraphs about monitoring volcanic gas in Hawaii?
2. How are sulfur dioxide (SO2) rates measured in real time at the Kilauea summit?
3. How is the chemical composition of gas emissions measured by Fourier transform infrared (FTIR) spectroscopy?
4. How are CO2 and SO2 measured at Mauna Loa Volcano?
5. What can you learn from the graph of the amount of SO2 released annually during the period 1979–2016?
6. Click on the links at the bottom of the page and describe any useful additional information you
find there. What patterns do you see in the data and how does this relate to the volcanic activity at the time the data was collected? Is there a relationship that you can draw between the data and volcanic behavior?
Geology group: Read “Geological monitoring of Hawaiian eruptions” at https://volcanoes.usgs.gov/observatories/hvo/hvo_monitoring_geology.html.
1. What did you learn from the first two paragraphs about field operations for tracking eruptions and assessing hazards?
2. How do lava-flow maps show the history of Hawaiian eruptions?
3. How does measuring lava volume over time help to forecast hazards?
4. How do webcams and time-lapse cameras improve interpretation and situational awareness?
5. How does monitoring lava and tephra chemistry identify changes in magma sources?

6. Study the webcams at https://volcanoes.usgs.gov/volcanoes/kilauea/multimedia_webcams.html that show what Kilauea looks like in real time from many different angles. What patterns do you see in the data and how does this relate to the volcanic activity at the time the data was collected? Is there a relationship that you can draw between the data and volcanic behavior?
February 2, 2019 Kilauea Curiosities
© Society for Science & the Public 2000–2019. All rights reserved.
Related Articles Science News:
“No, Kilauea won’t cause mass destruction,” Readability: 10.9
“Here’s a look at the world’s deadliest volcanoes — and the ways they kill,” Readability: 12.3
Science News for Students:
“Kilauea’s volcanic fireworks show no signs of stopping,” Readability: 7.5
“How long will Kilauea’s new eruption last?” Readability: 7.4
“Cool Jobs: Getting to know volcanoes,” Readability: 7.3