february 2008 - university of connecticut · uconn adds $3.1 billion annually to connecticut’s...
TRANSCRIPT

1
February 2008 Update
University of Connecticut
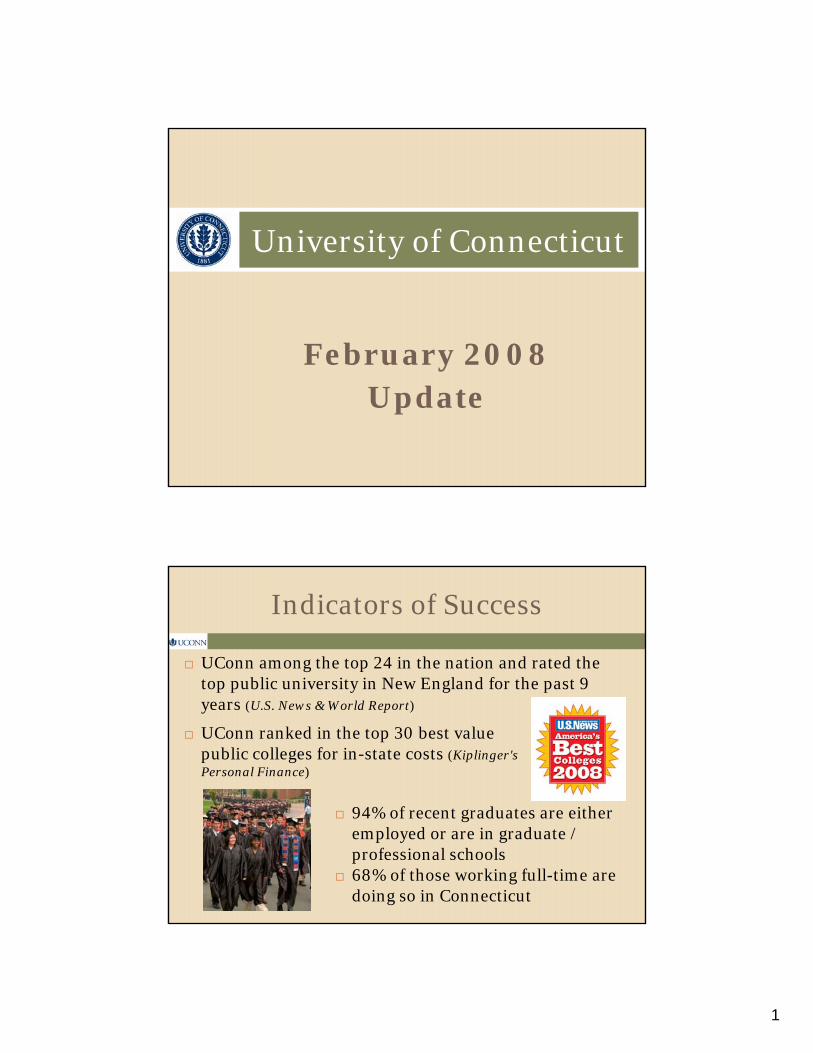
Indicators of Success
UConn among the top 24 in the nation and rated the top public university in New England for the past 9 years (U.S. News & World Report)
UConn ranked in the top 30 best value public colleges for in-state costs (Kiplinger's Personal Finance)
94% of recent graduates are either employed or are in graduate / professional schools68% of those working full-time are doing so in Connecticut

2
Indicators of Success
UCONN 2000 construction program has created more than 9.5M square feet of new & renovated space
Athletic teams have won 8 NCAA Division I national championships, 33 Big East tournaments & 41 Big East regular season titles since 1995
UConn Health Center’s John Dempsey Hospital named Solucient Top 100 Hospital in 2007
UConn Health Center’s School of Dental Medicine is consistently #1 or #2 in the country in the National Dental Board
UConn’s Contribution to Connecticut
Faculty Research, Training & Service:
Contributes to Connecticut’s economic growthEnhances health, technological advancement & quality of life across the state, the nation & beyondExternal funding increased 78% from FY97 to FY07
Innovative Technologies: Faculty awarded more than 175 patents in the past ten years & incubated 16 new businesses
UConn adds $3.1 billion annually to Connecticut’s gross state productFuel Cells:
CT Global Fuel Cell Center-supported by federal government & major state and other firmsInvolves 4o faculty in vital cutting-edge research
Stem Cells: UConn faculty won 15 of 21 grants awarded by Connecticut’s Stem Cell Research Advisory Committee in 2006 ($12M)

3
Student Quality & Diversity
Over the last 6 years (fall 2002-2007):School of Medicine applications increased by 71% (1,776 to 3,042)
School of Dental Medicine applications increased by 79% (870 to 1,557)
School of Medicine passing rates on National Exams have averaged 96% or above
School of Dental Medicine passing rates on National Exams have been at 100%
Total Minority Enrollment has increased from 19.8% in fall 1997 to 23.6% in fall 2007
Approximately 35% of School of Medicine graduates practice in the state while 46% of School of Dental Medicine graduates practice in the state
Health Center
Fall 2007 compared to fall 1995 at Storrs:Applications increased 114% (9,874 to 21,105)
Freshman enrollment increased by 57% (2,021 to 3,179)
Freshman minority enrollment increased by 100% (308 to 617)
SAT scores increased by 79 points from fall 96-07 (1113 to 1192)
Valedictorians and salutatorians increased by 38 students (105 to 143) bringing the total since 1995 to 928 at all campuses
Student Quality & DiversityStorrs & Regional Campuses
4
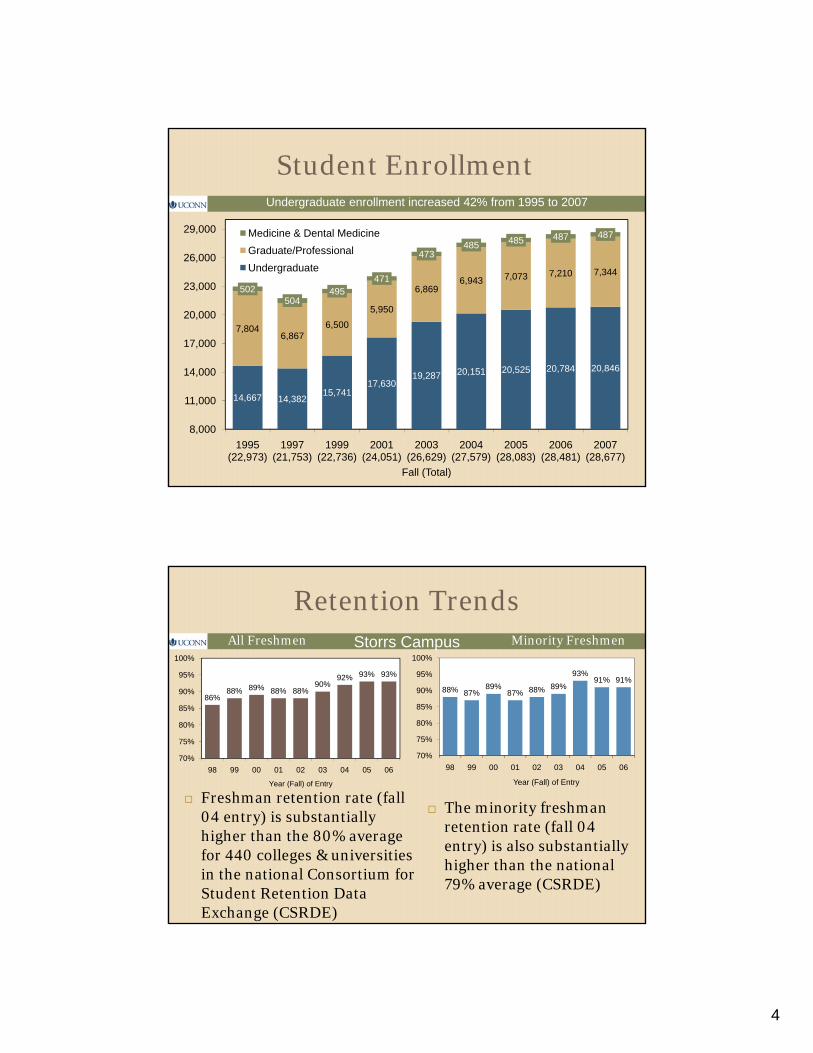
Student Enrollment
14,667 14,38215,741
17,63019,287 20,151 20,525 20,784 20,846
7,8046,867
6,5005,950
6,8696,943 7,073 7,210 7,344
502504
495471
473485 485 487 487
8,000
11,000
14,000
17,000
20,000
23,000
26,000
29,000
1995 (22,973)
1997 (21,753)
1999 (22,736)
2001 (24,051)
2003 (26,629)
2004 (27,579)
2005 (28,083)
2006 (28,481)
2007 (28,677)
Fall (Total)
Medicine & Dental MedicineGraduate/ProfessionalUndergraduate
Undergraduate enrollment increased 42% from 1995 to 2007
Retention Trends
86%88% 89% 88% 88%
90%92% 93% 93%
70%
75%
80%
85%
90%
95%
100%
98 99 00 01 02 03 04 05 06
Year (Fall) of Entry
88% 87%89%
87% 88% 89%93%
91% 91%
70%
75%
80%
85%
90%
95%
100%
98 99 00 01 02 03 04 05 06
Year (Fall) of Entry
Freshman retention rate (fall 04 entry) is substantially higher than the 80% average for 440 colleges & universities in the national Consortium for Student Retention Data Exchange (CSRDE)
The minority freshman retention rate (fall 04 entry) is also substantially higher than the national 79% average (CSRDE)
All Freshmen Minority FreshmenStorrs Campus

5
4-Year Graduation Trend
Among the 58 Public Research Peer Universities:UConn’s 4-year graduation rate of 53% (fall 00) ranks 10thUConn’s average time to graduate of 4.3 years (fall 00) ranks 5th
Only University of Virginia-Main Campus, University of North Carolina at Chapel Hill, University of Michigan-Ann Arbor & University of Illinois at Urbana-Champaign rank higher
43% 43%46% 45%
50%53% 54%
56%
61%
40%
45%
50%
55%
60%
65%
95 96 97 98 99 00 01 02 03Year (Fall) of Entry
Storrs Campus
6-Year Graduation Trend
Among the 58 Public Research Peer Universities:UConn’s 6-year graduation rate of 74% (fall 00) ranks 21st
UConn’s 6-year minority graduation rate of 69% (fall 00)
ranks 20th
70%69%
70%71%
72%74% 74%
60%
65%
70%
75%
95 96 97 98 99 00 01Year (Fall) of Entry
Storrs Campus

6
Degrees Awarded
2,951 2,778 2,866 2,8543,499 3,684 3,845 4,255 4,354
1,757 1,845 1,595 1,718
1,805 1,7022,121
2,148 2,188
114 127 120 114
113 103
109121 112
0
1,000
2,000
3,000
4,000
5,000
6,000
7,000
1995 (4,822)
1997 (4,750)
1999 (4,581)
2001 (4,686)
2003 (5,417)
2004 (5,489)
2005 (6,075)
2006 (6,524)
2007 (6,654)
FY (Total)
Medicine & Dental MedicineGraduate/ProfessionalUndergraduate
Approximately 103,800 alumni live in Connecticut
Undergraduate degrees have increased 53% since 2001
FY08 Key Revenue Drivers
18.2%
4.8%
43.8%
14.0%
6.0%
13.2%
State Support: 18.2%Interns & Residents: 4.8%Patient Care: 43.8%CMHC: 14.0%All Other: 6.0%Gifts, Grants & Contracts: 13.2%
Storrs & Regionals Health Center
36.1%
29.6%
15.4%
14.9%4.0%
State Support: 36.1%Tuition & Fees: 29.6%Auxiliaries: 15.4%Gifts, Grants & Contracts: 14.9%All Other: 4.0%

7
State Appropriation ($M)
FY07 Allotment FY08* Approp FY09* Approp
Storrs & Regionals $222.6 $225.5 $229.4FY08 includes $2M for Center for Entrepreneurship, $1M for Faculty
Hiring Plan, $200K for Water Basin Planning, $200K for MbEIN Program & $200K for LISICOS.
FY09 includes $2M for Center for Entrepreneurship, $2M for Eminent Faculty & $1M for Faculty Hiring Plan.
Health Center $76.9 $94.2 $102.0FY08 & FY09 include funds for the Academic Gap, $100K for Area
Health Education Collaboratives & $200K for the Huntington’s Disease Program.
FY09 does not reflect $3.6M for JDH fringe benefit costs, included in the appropriation for the State Comptroller’s Office.
*FY08 & FY09 exclude the state’s share of collective bargaining increases
Non-State Revenue Streams
Research funding
Private support
Clinical revenue @ Health Center
Tuition/fees/room/board @ Storrs & Regionals

8
Research, Training & Service External Awards ($M)
$59.6 $61.2 $78.9
$92.1 $91.5 $91.7 $93.1 $93.8
$44.8 $49.7
$69.1
$96.2 $92.5 $90.1 $92.5 $92.0
$0
$50
$100
$150
$200
FY97 ($104.4)
FY99 ($110.9)
FY01 ($148.0)
FY03 ($188.3)
FY05 ($184.0)
FY06 ($182.2)
FY07 ($185.6)
FY08 ($185.8 est)
Health Center
Storrs & Regionals
Recent national trend is flat federal funding of academic research, particularly for projects sponsored by the National Institutes of Health
UConn Foundation ($M)
$49.
5
$175
.7
$209
.2 $272
.0
$298
.9
$336
.0
$0
$50
$100
$150
$200
$250
$300
95 99 03 05 06 07Fiscal Year
Endowment Assets
$5.1
$12.
7
$25.
6
$27.
9 $33.
7
$33.
3
$0
$5
$10
$15
$20
$25
$30
$35
95 99 03 05 06 07Fiscal Year
Support of Students & Programs
9
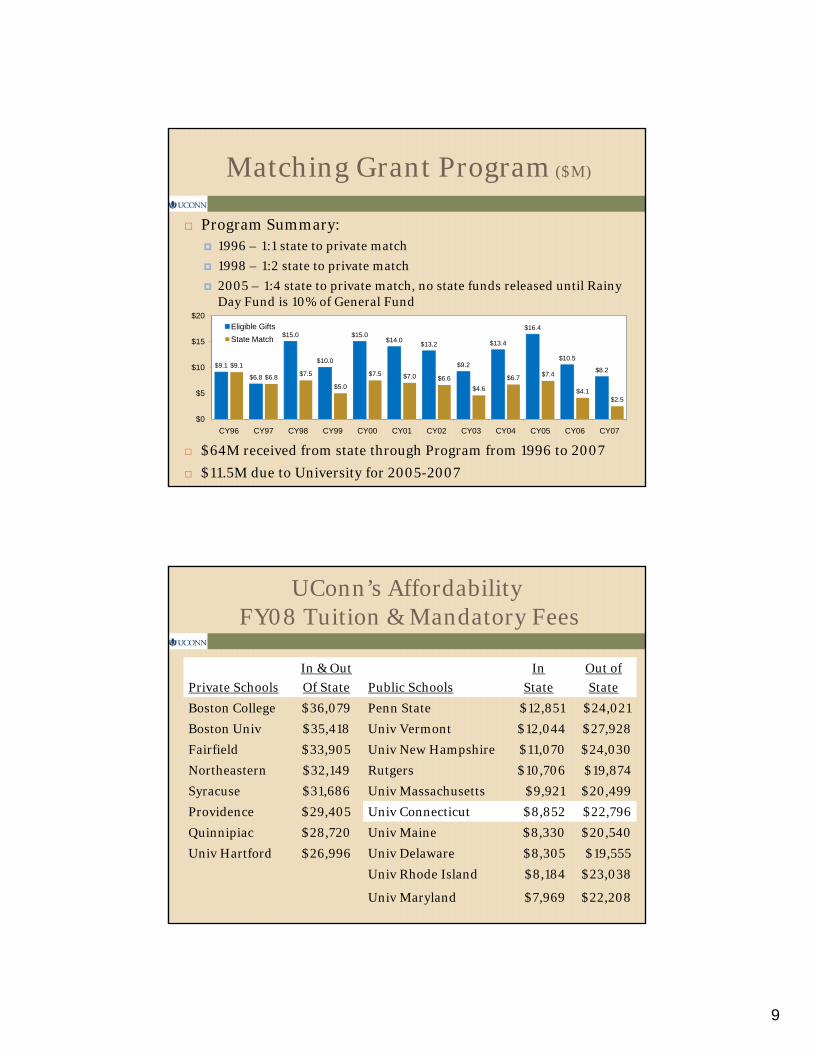
Matching Grant Program ($M)
Program Summary:1996 – 1:1 state to private match
1998 – 1:2 state to private match
2005 – 1:4 state to private match, no state funds released until Rainy Day Fund is 10% of General Fund
$64M received from state through Program from 1996 to 2007
$11.5M due to University for 2005-2007
$9.1
$6.8
$15.0
$10.0
$15.0$14.0 $13.2
$9.2
$13.4
$16.4
$10.5
$8.2$9.1
$6.8 $7.5
$5.0
$7.5 $7.0 $6.6$4.6
$6.7 $7.4
$4.1$2.5
$0
$5
$10
$15
$20
CY96 CY97 CY98 CY99 CY00 CY01 CY02 CY03 CY04 CY05 CY06 CY07
Eligible GiftsState Match
UConn’s AffordabilityFY08 Tuition & Mandatory Fees
Private Schools
In & Out
Of State Public Schools
In
State
Out of
State
Boston College $36,079 Penn State $12,851 $24,021
Boston Univ $35,418 Univ Vermont $12,044 $27,928
Fairfield $33,905 Univ New Hampshire $11,070 $24,030
Northeastern $32,149 Rutgers $10,706 $19,874
Syracuse $31,686 Univ Massachusetts $9,921 $20,499
Providence $29,405 Univ Connecticut $8,852 $22,796
Quinnipiac $28,720 Univ Maine $8,330 $20,540
Univ Hartford $26,996 Univ Delaware $8,305 $19,555
Univ Rhode Island $8,184 $23,038
Univ Maryland $7,969 $22,208
10
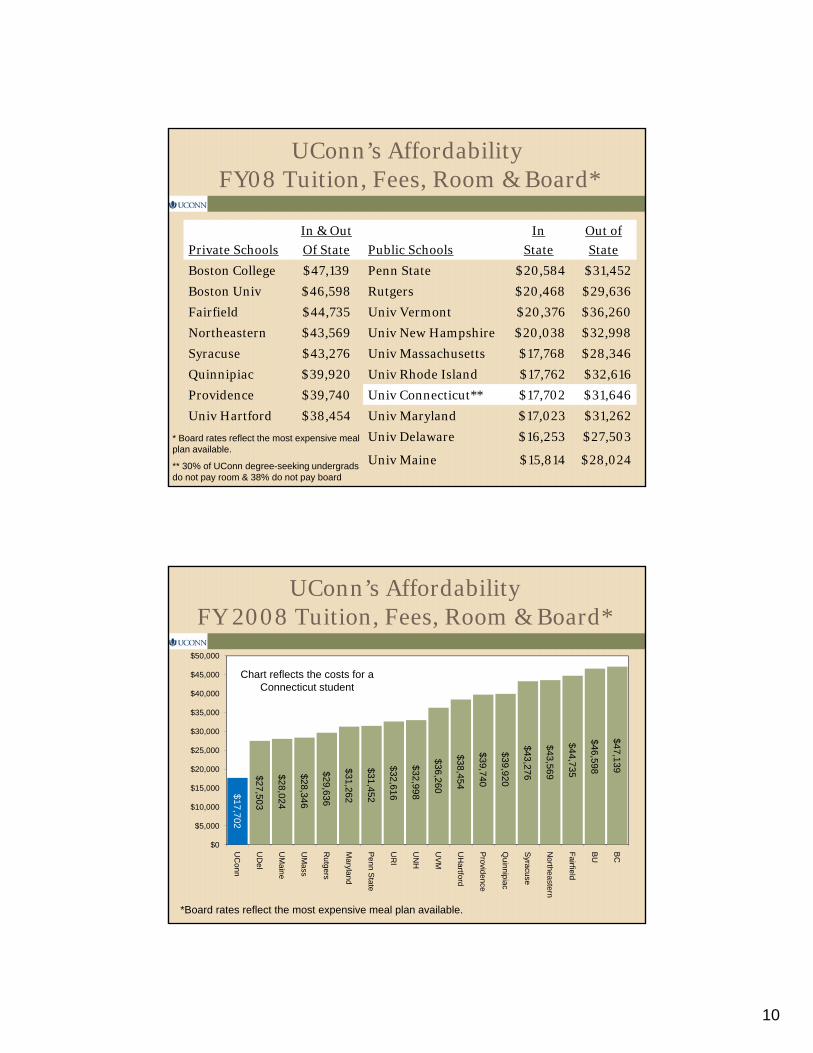
UConn’s AffordabilityFY08 Tuition, Fees, Room & Board*
Private Schools
In & Out
Of State Public Schools
In
State
Out of
State
Boston College $47,139 Penn State $20,584 $31,452
Boston Univ $46,598 Rutgers $20,468 $29,636
Fairfield $44,735 Univ Vermont $20,376 $36,260
Northeastern $43,569 Univ New Hampshire $20,038 $32,998
Syracuse $43,276 Univ Massachusetts $17,768 $28,346
Quinnipiac $39,920 Univ Rhode Island $17,762 $32,616
Providence $39,740 Univ Connecticut** $17,702 $31,646
Univ Hartford $38,454 Univ Maryland $17,023 $31,262
Univ Delaware $16,253 $27,503
Univ Maine $15,814 $28,024
* Board rates reflect the most expensive meal plan available.
** 30% of UConn degree-seeking undergrads do not pay room & 38% do not pay board
UConn’s AffordabilityFY 2008 Tuition, Fees, Room & Board*
$17,702
$27,503
$28,024
$28,346
$29,636
$31,262
$31,452
$32,616
$32,998
$36,260
$38,454
$39,740
$39,920
$43,276
$43,569
$44,735
$46,598
$47,139
$0
$5,000
$10,000
$15,000
$20,000
$25,000
$30,000
$35,000
$40,000
$45,000
$50,000
UC
onn
UD
el
UM
aine
UM
ass
Rutgers
Maryland
Penn S
tate
UR
I
UN
H
UV
M
UH
artford
Providence
Quinnipiac
Syracuse
Northeastern
Fairfield
BU
BC
Chart reflects the costs for a Connecticut student
*Board rates reflect the most expensive meal plan available.
11
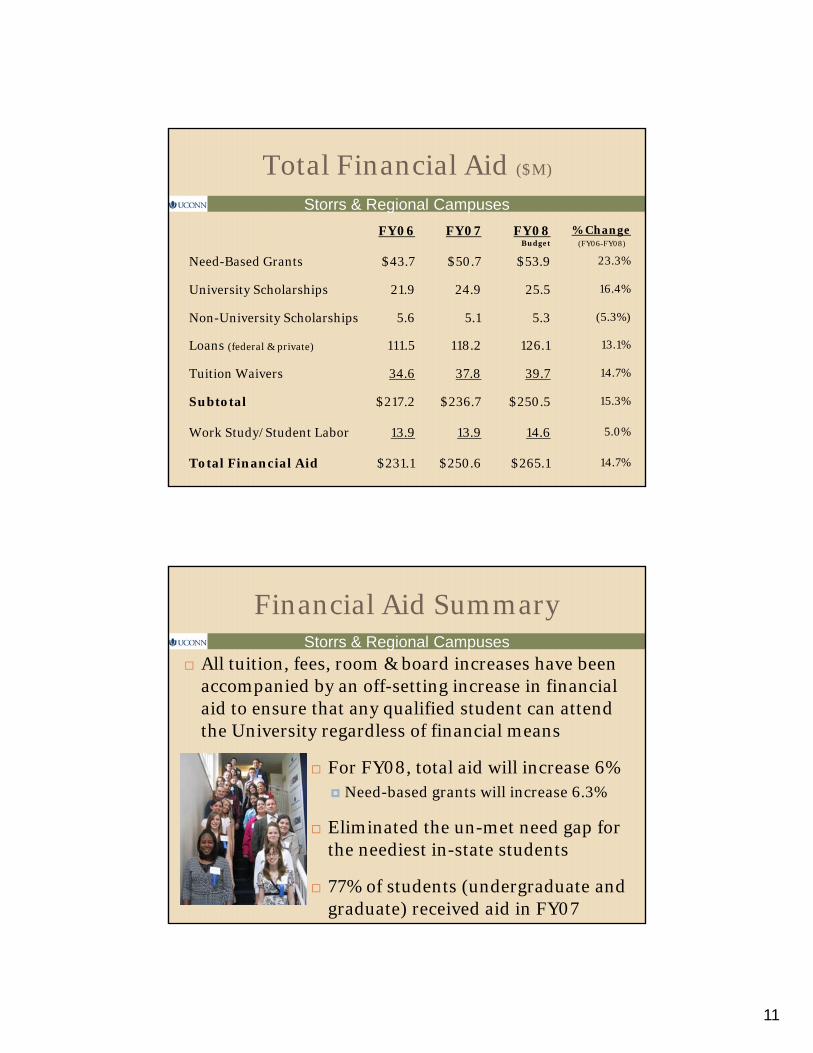
Total Financial Aid ($M)
FY06 FY07 FY08Budget
% Change(FY06-FY08)
Need-Based Grants $43.7 $50.7 $53.9 23.3%
University Scholarships 21.9 24.9 25.5 16.4%
Non-University Scholarships 5.6 5.1 5.3 (5.3%)
Loans (federal & private) 111.5 118.2 126.1 13.1%
Tuition Waivers 34.6 37.8 39.7 14.7%
Subtotal $217.2 $236.7 $250.5 15.3%
Work Study/Student Labor 13.9 13.9 14.6 5.0%
Total Financial Aid $231.1 $250.6 $265.1 14.7%
Storrs & Regional Campuses
Financial Aid Summary
All tuition, fees, room & board increases have been accompanied by an off-setting increase in financial aid to ensure that any qualified student can attend the University regardless of financial means
For FY08, total aid will increase 6%Need-based grants will increase 6.3%
Eliminated the un-met need gap for the neediest in-state students
77% of students (undergraduate and graduate) received aid in FY07
Storrs & Regional Campuses

12
Budget ($M)
FY07(unaudited)
FY08 Budget
Storrs & RegionalsRevenues $862.3 $901.0
Expenditures 853.0 903.3
Net Gain/Loss $9.3 ($2.3)
Health CenterRevenues $673.2 $712.9
Expenditures 677.4 712.9
Net Gain/Loss ($4.2) $0.0
Budget Priorities
Programmatic imperatives Record enrollment, retention & graduation ratesIncreased expectations of studentsEnriched educational experiencesResponse to changing workforce demandsEconomic development potential for ConnecticutSignature Program investment
FY08 spending plan highlightsStorrs & Regionals: increase faculty ($3.0M); enhance campus security ($0.7M)Health Center: achieve financial stability; strengthen signature programs ($3.8M)

13
Provost’s Priorities for FY08
Academic leadership in schools/colleges
Internationalization & Diversity
Focused research enhancements
New faculty hiring – FY08 & FY09
Storrs & Regional Campuses
Academic LeadershipStorrs & Regional Campuses
Senior academic leadership at the Storrs & Regional Campuses is provided by the 11 Deans
4 new Deans recruited to start in fall 2007 or spring 2008: Law, Business, Nursing & EngineeringAt least 3 searches underway for new Deans to take over in fall 2008—CLAS, Social Work & Graduate SchoolSuccessful completion of these searches is the highest priority in Academic Affairs

14
Internationalization & Diversity
Aim to increase the international dimension of teaching & research programs & enhance range of diversity programming
Achieve diversity goals spelled out in various college plans for faculty & students Increase percentage of students who benefit from an international experience from 12% to 30%
Forge substantial partnerships across a broad array of research & teaching programs with a limited number of prestigious international universitiesIncrease recruitment efforts for undergradinternational students & provision of appropriate support such as Global House
Storrs & Regional Campuses
Research Enhancement
Increase emphasis on focused research areas identified in Academic Plan
Development of Eminent Faculty Program in alternative fuels funded by state and private partnership
Development of entrepreneurial support activities through Schools of Business and LawPartnering with state agencies in nanotechnology researchCollaboration with foreign institutions on research projects involving the environment & health & human behavior
Pursuing workforce development for the state building upon research strengths in engineering, nursing, business, social work, etc.
Further strategic investment in cultural & artistic programming
Storrs & Regional Campuses
15
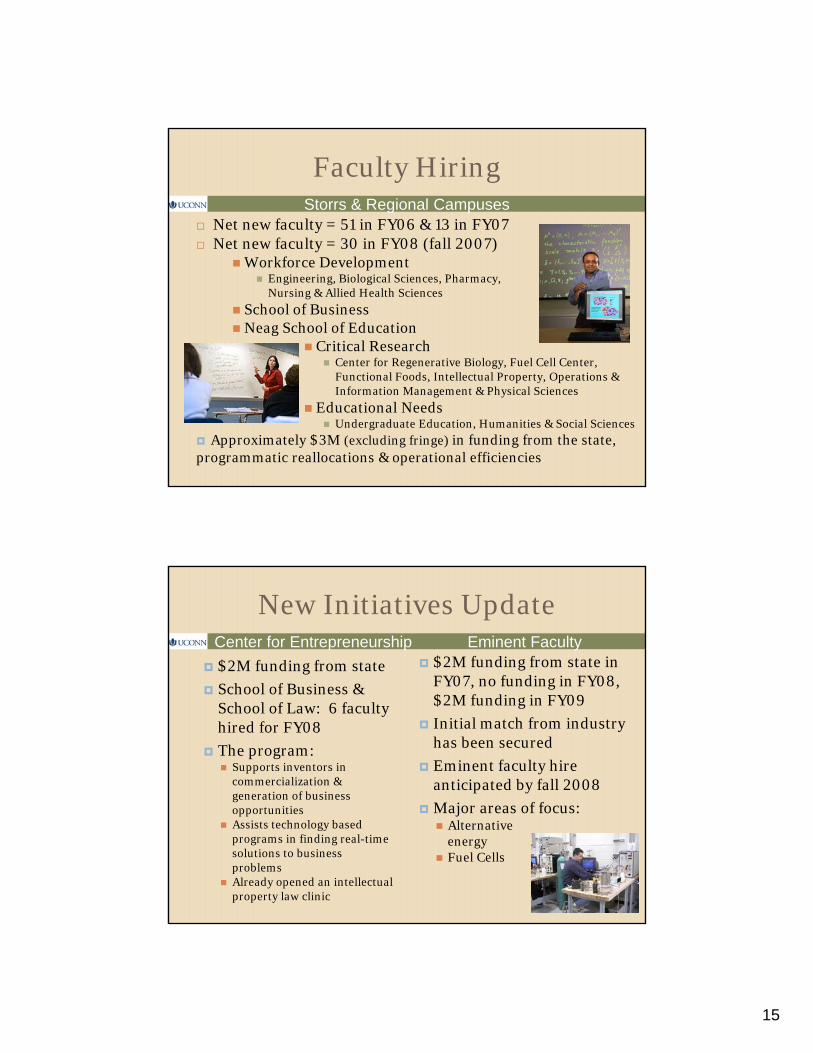
Faculty Hiring
Net new faculty = 51 in FY06 & 13 in FY07Net new faculty = 30 in FY08 (fall 2007)
Workforce Development Engineering, Biological Sciences, Pharmacy, Nursing & Allied Health Sciences
School of BusinessNeag School of Education
Critical ResearchCenter for Regenerative Biology, Fuel Cell Center, Functional Foods, Intellectual Property, Operations & Information Management & Physical Sciences
Educational NeedsUndergraduate Education, Humanities & Social Sciences
Approximately $3M (excluding fringe) in funding from the state, programmatic reallocations & operational efficiencies
Storrs & Regional Campuses
New Initiatives Update
$2M funding from state
School of Business & School of Law: 6 faculty hired for FY08
The program:Supports inventors in commercialization & generation of business opportunitiesAssists technology based programs in finding real-time solutions to business problemsAlready opened an intellectual property law clinic
$2M funding from state in FY07, no funding in FY08, $2M funding in FY09
Initial match from industry has been secured
Eminent faculty hire anticipated by fall 2008
Major areas of focus:Alternative energyFuel Cells
Center for Entrepreneurship Eminent Faculty

16
Faculty Growth
1,1481,106
1,0401,096 1,122 1,121 1,130
1,1651,107
1,2001,251 1,264
1,294
500
700
900
1,100
1,300
'95 '96 '97 '98 '99 '00 '01 '02 '03 '04 '05 '06 '07Fall
Storrs & Regional Campuses
Student Faculty Ratio
14.21 14.1714.86 14.88 15.19
15.8316.56 17.10
18.1617.47 17.21 17.26 17.00
0
4
8
12
16
20
'95 '96 '97 '98 '99 '00 '01 '02 '03 '04 '05 '06 '07Fall
Storrs & Regional Campuses

17
February 2008Update
University of Connecticut Health Center
Beginning in FY02, the Health Center experienced 4 straight years of improved financial performance & balanced budgetsIn FY07, the Health Center experienced a $4.2M deficit
($12.4) ($12.2)
($7.2)
$0.1 $0.3 $0.6 $0.4
($7.8)($4.2)
($18)
($13)
($8)
($3)
$2
$7
$12
FY99 FY00 FY01 FY02 FY03 FY04 FY05 FY06 FY07
UConn Health CenterTotal Excess / Deficiency ($M)

18
The financial turnaround of John Dempsey Hospital (JDH) was a key factor in balancing the Health Center’s overall budgetIn FY06, while still generating a margin, the hospital was no longer able to fill the “academic gap”By FY07, JDH was in deficit as forecast
($12.4) ($13.9)
($5.6)
$1.1 $3.4 $3.3
$8.1 $4.6
($7.8)
($18)($13)
($8)($3)$2 $7
$12
FY99 FY00 FY01 FY02 FY03 FY04 FY05 FY06 FY07
John Dempsey HospitalTotal Excess / Deficiency ($M)
From FY00 to FY07, the state appropriation (the mainstay of the academic enterprise) saw an average annual rate of increase of only 0.8%
72.5
76.079.6
83.3
87.6
91.8
95.6
99.4
72.575.6
77.679.4
81.584.4
91.5
97.2
72.5 75.3 74.1 74.2 73.7 73.276.2 76.9
$70
$80
$90
$100
$110
FY00 FY01 FY02 FY03 FY04 FY05 FY06 FY07
State Appropriation ($M)
2000 State Appropriation adjusted for CPI Medical Care Services Inflation
2000 Appropriation adjusted for Growth in CT State General Fund
State Appropriation in Current Dollars

19
Cost Improvements ($M)
The combination of inflation, flat state appropriations & reliance on hospital income in a volatile health care market put finances at riskOver the years, UCHC has sought to mitigate this structural financial problem through increased clinical revenue generation & ongoing cost improvement efforts (both revenue enhancement & expense reduction, including workforce cuts)FY00 FY01 FY02 FY03 FY04 FY05 FY06 FY07 Total$12.9 $7.7 $20.6
5.8 1.2 7.05.5 5.57.1 3.0 10.1
9.4 2.7 12.12.7 2.7
5.2 5.21.8 1.8
13.0 13.0$12.9 $13.5 $13.8 $12.4 $5.4 $5.2 $1.8 $13.0 $78.0
Incremental impact of prior year improvements
FY07 Plan
Goal was to stabilize the operating budget through yet another series of cost reductions & revenue enhancements
Elimination of 74 filled & vacant positions
Implemented a $9M improvement planAdditional vacant position eliminationPurchasing standardization cost savingsHospital value analysis & revenue cycle project savingsOther expense reductions (travel, consulting, miscellaneous)Aggressive funding plan for 19 new & replacement physician hires in UMG15% tuition increaseDeferral of academic & managerial merit increases

20
FY07 Wins
Record JDH volume (inpatient and outpatient)
Excellent expense control
The $9M cost improvement plan ultimately achieved $13M
JDH Admissions
6.1%6,923
8.5%7,513
14.2%8,580
4.2%8,940
5.2%9,407
4.7%9,845
(0.1%)9,832
1.7%10,001
3.0%10,300
6,000
7,000
8,000
9,000
10,000
11,000
FY00 FY01 FY02 FY03 FY04 FY05 FY06 FY07 FY08 est.

21
JDH Outpatient Visits
6.1%140,558
(1.3%)138,709
21.6%168,720
20.4%203,099
12.3%228,003
6.0%241,636
5.8%255,665
7.0%273,676
7.4%294,000
95,000
145,000
195,000
245,000
295,000
345,000
FY00 FY01 FY02 FY03 FY04 FY05 FY06 FY07 FY08 est.
JDH Average Daily Census
127.2128.9
135.9
141.9
147.3
152.8
158.3
166.7
162.1165.0
167.8
125
135
145
155
165
175
FY98 FY99 FY00 FY01 FY02 FY03 FY04 FY05 FY06 FY07 FY08 est.
22
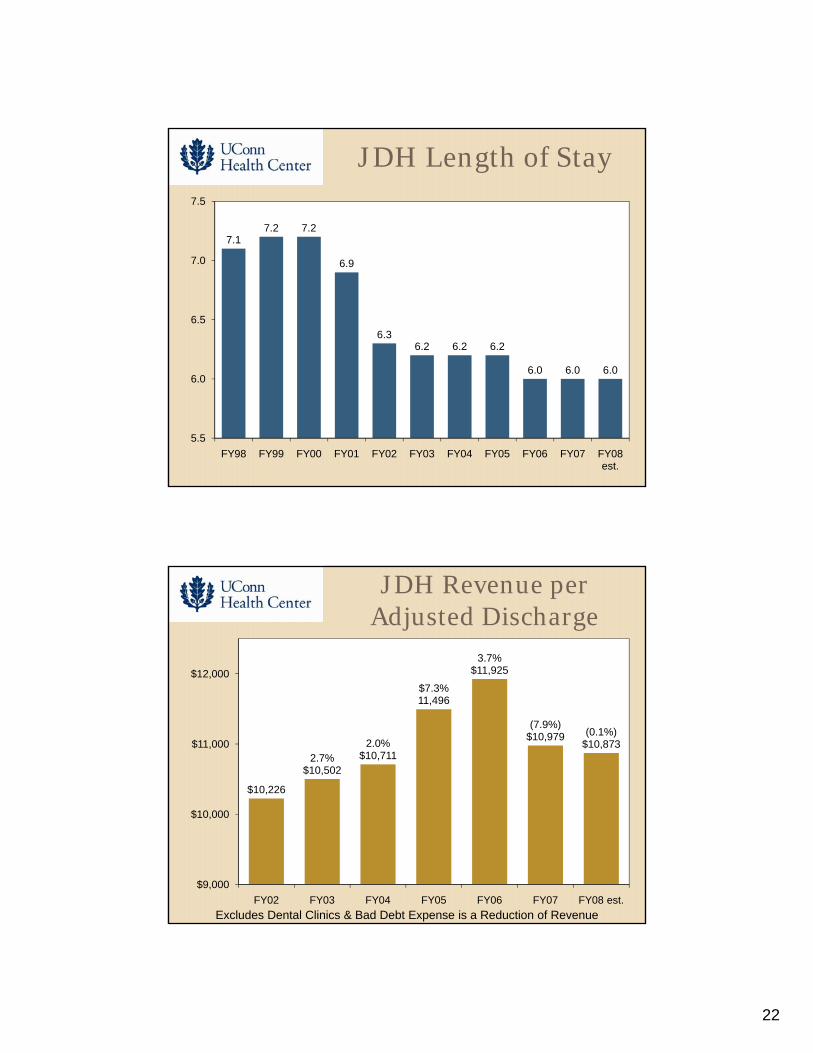
JDH Length of Stay
7.17.2 7.2
6.9
6.36.2 6.2 6.2
6.0 6.0 6.0
5.5
6.0
6.5
7.0
7.5
FY98 FY99 FY00 FY01 FY02 FY03 FY04 FY05 FY06 FY07 FY08 est.
JDH Revenue per Adjusted Discharge
$10,226
2.7%$10,502
2.0%$10,711
$7.3%11,496
3.7%$11,925
(7.9%)$10,979 (0.1%)
$10,873
$9,000
$10,000
$11,000
$12,000
FY02 FY03 FY04 FY05 FY06 FY07 FY08 est.Excludes Dental Clinics & Bad Debt Expense is a Reduction of Revenue

23
JDH Expense per Adjusted Discharge
$10,3170.2%
$10,335
2.7%$10,611
4.1%$11,049
5.7%$11,673 (2.1%)
$11,422 (1.1%)$11,293
$9,000
$10,000
$11,000
$12,000
FY02 FY03 FY04 FY05 FY06 FY07 FY08 est.Excludes Dental Clinics & Bad Debt Expense is a Reduction of Revenue
JDH FTE’s per Adjusted Occupied Bed
5.295.11
4.96
4.694.56
4.42
4.66
4.34 4.42
2.5
3.5
4.5
5.5
FY00 FY01 FY02 FY03 FY04 FY05 FY06 FY07 FY08 est.FTE = Full-Time Equivalent
24
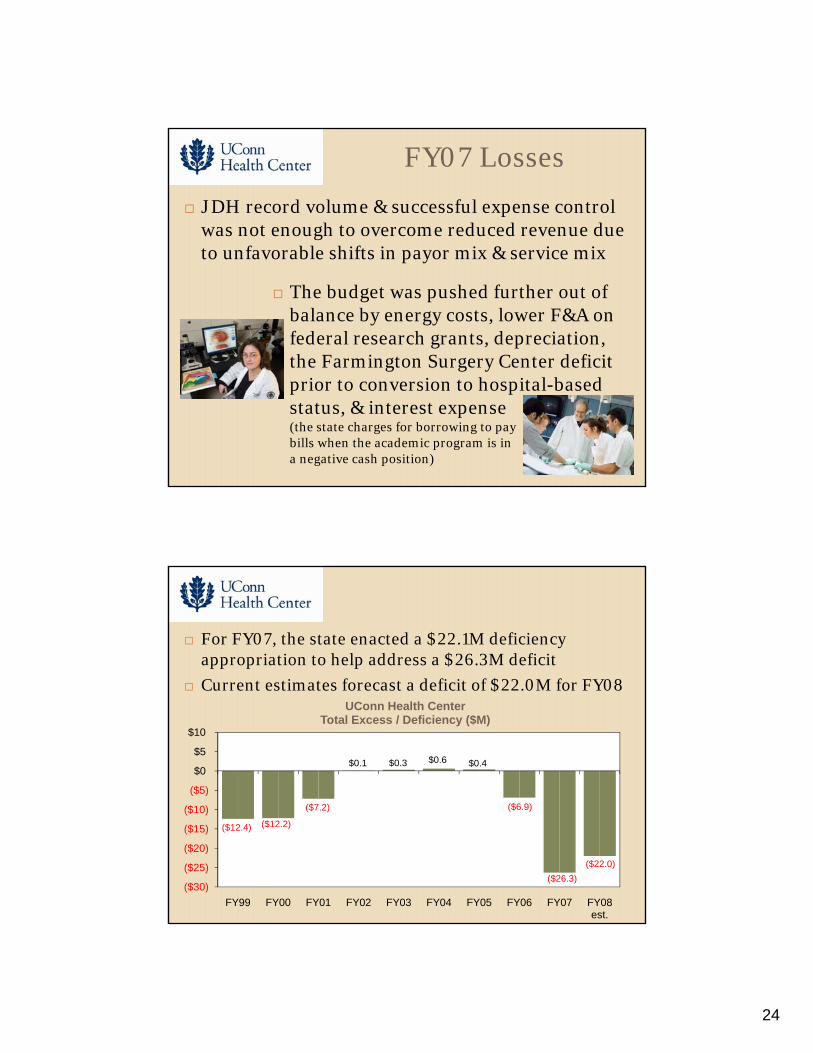
FY07 Losses
JDH record volume & successful expense control was not enough to overcome reduced revenue due to unfavorable shifts in payor mix & service mix
The budget was pushed further out of balance by energy costs, lower F&A on federal research grants, depreciation, the Farmington Surgery Center deficit prior to conversion to hospital-based status, & interest expense (the state charges for borrowing to pay bills when the academic program is in a negative cash position)
For FY07, the state enacted a $22.1M deficiency appropriation to help address a $26.3M deficit
Current estimates forecast a deficit of $22.0M for FY08
($12.4) ($12.2)
($7.2)
$0.1 $0.3 $0.6 $0.4
($6.9)
($26.3)($22.0)
($30)
($25)
($20)
($15)
($10)
($5)
$0
$5
$10
FY99 FY00 FY01 FY02 FY03 FY04 FY05 FY06 FY07 FY08 est.
UConn Health CenterTotal Excess / Deficiency ($M)

25
Going Forward
Structural deficit has reached a level that it can no longer be off-set by cost improvement efforts
Years of aggressive cost cutting have left few new opportunities Further cost cutting will negatively impact revenue
JDH net positive revenues are no longer sufficient to keep pace
Despite increasing volumes & successful expense management, factors such as reimbursement levels, case mix & payor mix are beyond our controlJDH financial health is also affected by its small size, bed distribution (only half are medical/surgical), poorly reimbursed services provided as part of mission, & cost factors resulting from its status as a state entity…JDH has succeeded against the odds
Fringe Benefit Cost JDH v. CHA Member Hospitals
As a state entity, JDH has fringe rates significantly higher than other hospitalsJDH has absorbed the cost of fringe benefits for its employees without state fringe benefit supportThe dollar value of that differential was estimated at $9.7M in FY07 and $11M for FY08 (The current fringe rate for JDH is 41%)
34.07%38.72% 37.11%
27.17% 27.39% 28.93%
15%
25%
35%
45%
FY04 FY05 FY06
John Dempsey Hospital Connecticut Hospital Association

26
The FY08 state appropriation has provided a sound “current services” adjustment & addressed the “academic gap”
72.576.0
79.683.3
87.6
91.895.6
100.4
104.4
108.6
72.5 75.3 74.1 74.2 73.7 73.276.2 76.9
94.2
102.0
$70
$80
$90
$100
$110
FY00 FY01 FY02 FY03 FY04 FY05 FY06 FY07 FY08 FY09
State Appropriation ($M)
2000 State Appropriation adjusted for CPI Medical Care Services Inflation
State Appropriation in Current Dollars
FY08 State Budget
The Deficiency appropriation for FY07 recognizes that previous levels of state support have been inadequate to support academic program needs = the “academic gap”, & that JDH is challenged financiallyThe 22% increase in the FY08 state appropriation resets the foundation upon which adequate levels of future state support should be built
$13.5M “academic gap” appropriation$2.2M current services increase
The $1.4M estimated increase in Medicaid reimbursement did not materialize for UCHC due to the new distribution formula

27
FY08 State BudgetAspects of the structural deficit which were not fully addressed in the 2007 legislative session
JDH fringe benefit differential cost estimated impact is $11M in FY08
No FY08 appropriationFY09 appropriation (to the State Comptroller’s statewide fringe benefit account) is $$3.6M
Medicaid reimbursement still falls far short of actual cost (a very high proportion of JDH bed days are Medicaid; JDH is a key provider of Medicaid dental services; new distribution formula, etc.)JDH capital proposal (study legislation requires interim report March 31, 2008; final report June 30, 2008)
FY08 Budget Realities
Priorities for the budget were achievement of a stable & balanced budget despite:
Continuing structural challenges for JDH financesIncreasing fixed costs, market competition & health care inflation
Factors beyond our control (limited hospital capacity, case mix, payor mix, reimbursement levels) have upset that balanceAnother round of cost improvements is underway with the assistance of PriceWaterhouseCoopers Every effort will be made to reduce the projected shortfall, but major cuts would affect patient care and reduce revenue

28
FY08 Budget Priorities
BalanceSignature Programs
$17M invested since FY01$3.8M in incremental investments in FY08
Musculoskeletal InstituteDental Implant Center to start April 20084 faculty recruitments (Spine, Joint, Foot & Ankle, & Neurosurgeon)
CancerTomotherapy Center2 faculty recruitments
CardiologyElectrophysiology Lab Operations2 faculty recruitments (Cardiologist & EP Lab)
Connecticut & Public HealthMasters of Public Health AccreditationExpansion of the Center for Public Health
FY08 Budget Priorities
ResearchClinical & Translational Science Institute
Stem Cell Core
New Program Viral Vector Core
Expansion of the Molecular Core Freezer Program
Biophysical Core
Clinical EnhancementsUMG
Faculty recruitment & Hiring Plan
JDHInternal focus: operations – access, throughput, safety & service
University of Connecticut Health Center
February 2008
2
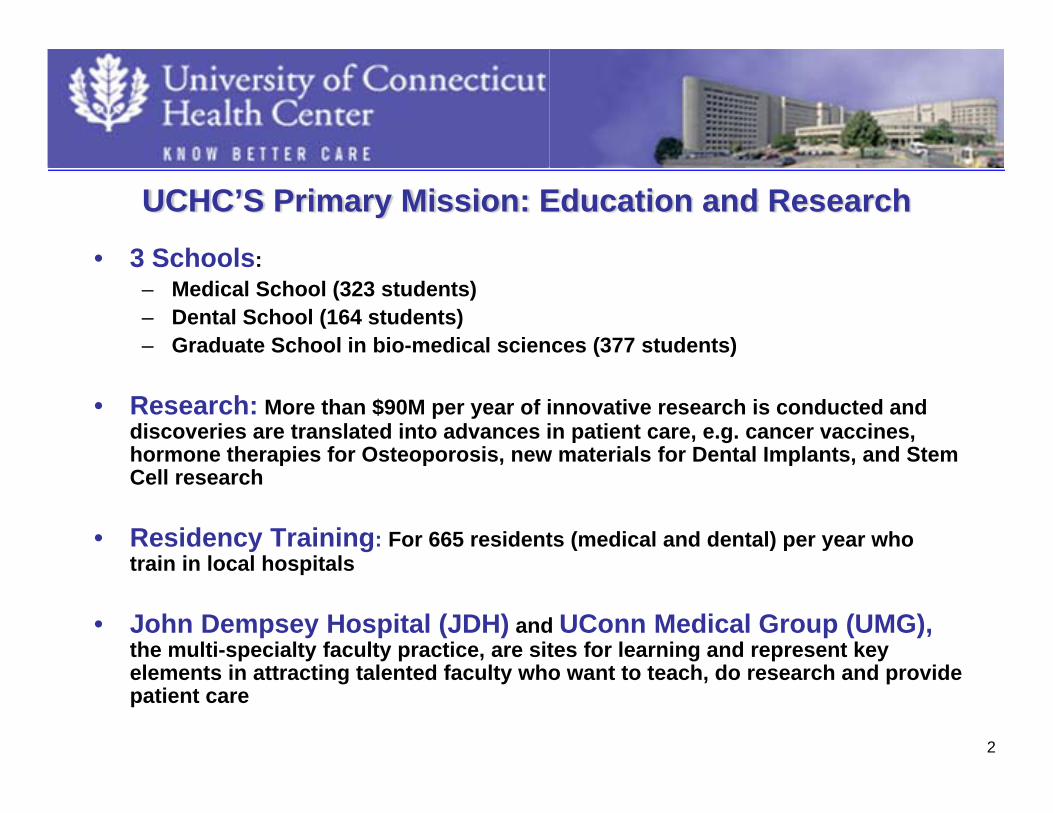
UCHC’S Primary Mission: Education and Research
• 3 Schools: – Medical School (323 students) – Dental School (164 students)– Graduate School in bio-medical sciences (377 students)
• Research: More than $90M per year of innovative research is conducted and discoveries are translated into advances in patient care, e.g. cancer vaccines, hormone therapies for Osteoporosis, new materials for Dental Implants, and Stem Cell research
• Residency Training: For 665 residents (medical and dental) per year who train in local hospitals
• John Dempsey Hospital (JDH) and UConn Medical Group (UMG),the multi-specialty faculty practice, are sites for learning and represent key elements in attracting talented faculty who want to teach, do research and provide patient care

3
A Worthy Investment• Approximately 35% of School of Medicine graduates practice in the State, as do
46% of School of Dental Medicine graduates
• Dental School is historically #1 or #2 in the country
• Total minority enrollment has increased from 19.8% in Fall 1997 to 23.6% in Fall 2007
• School of Medicine national leader in innovative curriculum
• JDH is winner of Solucient’s Top 100 Award three years in a row (2005, 2006, 2007) and in 2007 was awarded the 2007 Premier/CaseScience Select Practice National Quality Award
• Although the Medical School is one of the smallest medical schools in the country (ranking in the 15th percentile for number of medical students)
– SOM ranks 11th among 29 peer public medical schools in per dollar sponsored research funding per faculty member
– Our GME program ranks in the 55th percentile for numbers of students benchmarked against all public medical schools
• The Health Center has 5365 employees (72% union, 12% faculty, 3% managerial and 13% residents/graduate assistants/student payroll) and generates 6,171 other jobs in the state economy and $938 million in Gross State Product

4
UCHC: Separate Components, But one Vital System• UCHC must maintain a productive core of full-time faculty
committed to our academic mission
• UCHC needs to grow its full time faculty base to stabilize and enhance its education programs – UCHC has a smaller faculty size compared to other
regional schools– Time/reimbursement pressures mean that fewer
community physicians now give time to teaching
• We must be competitive in attracting faculty. Medical faculty want to be where:– Their teaching is highly valued– Their research is enabled – And they can practice close to their teaching and their
research
5
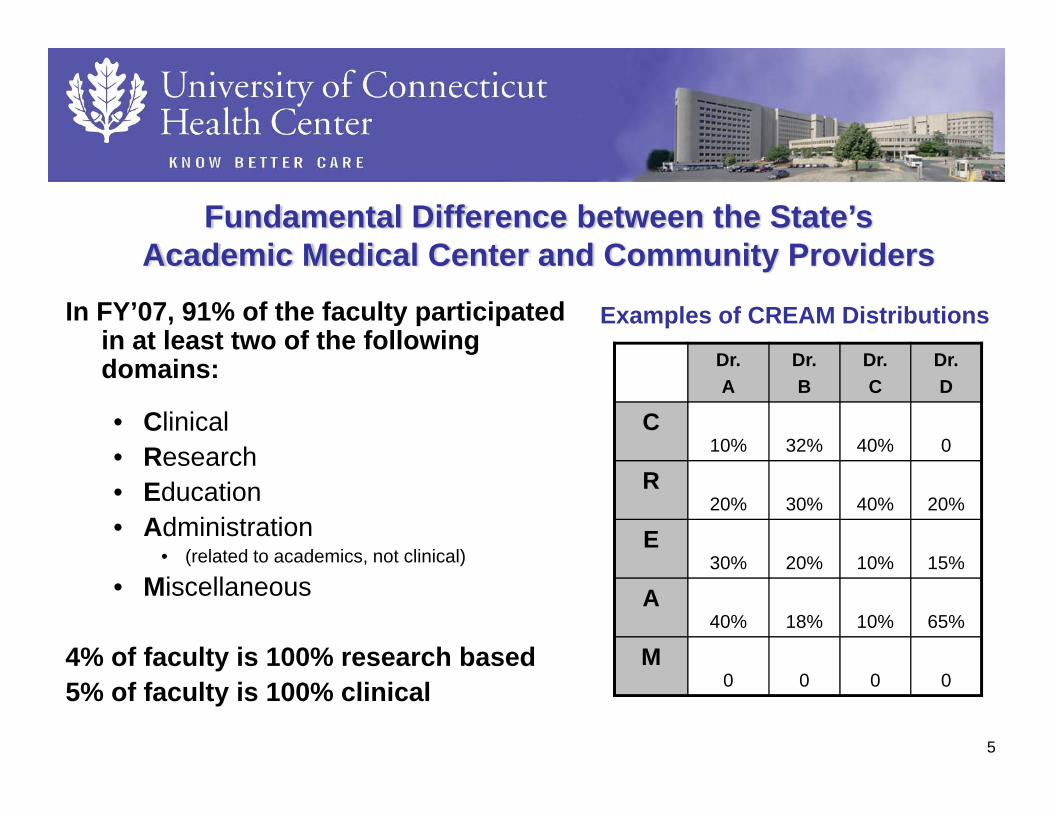
In FY’07, 91% of the faculty participated in at least two of the following domains:
• Clinical• Research• Education• Administration
• (related to academics, not clinical)
• Miscellaneous
4% of faculty is 100% research based5% of faculty is 100% clinical
Dr. A
Dr. B
Dr.C
Dr.D
C10% 32% 40% 0
R20% 30% 40% 20%
E30% 20% 10% 15%
A40% 18% 10% 65%
M0 0 0 0
Fundamental Difference between the State’s Academic Medical Center and Community Providers
Examples of CREAM Distributions
6
• Service to Medicaid Patients→ In FY06, JDH was among the top 5 hospitals in CT in Medicaid inpatient days as a percentage of
total inpatient days→ Largest single provider of dental services to Medicaid clients and the under- and uninsured
• 66% of patient visits to the UCHC dental clinic in Farmington are Medicaid clients• 70% of all student/intern/resident dental care activity is service to Medicaid clients
• Clinical Service Collaboration:→ Dept. of Public Health, Dept. of Correction, Dept. of Mental Health & Addiction Services, Dept.
of Veteran Affairs (Rocky Hill), Dept. of Developmental Services
• Community Service:→ South Park Inn Medical Clinic (Hartford)→ South Marshall Street Homeless Clinic (Hartford)→ Connecticut Poison Control Center→ YMCA Adolescent Girls Medical Clinic (Hartford)→ Camp Courant Dental Screening Program→ Migrant Worker Clinic→ Covenant House (Willimantic)
• Economic Driver for the Region and State:→ Catalyst for Biomedical and Biotech jobs, e.g., Stem Cells
UCHC: A Resource to the Community and the State

7
• Internship/Residency Program→ The internship/residency program contributes to the quality of service in the participating
hospitals & also drives additional Medicare reimbursement to their bottom line
• Trained physicians and staff of Waterbury and St. Mary’s for regional cardiac surgery and interventional cardiology program
• Trained staff and assisted ECHN in establishing a Level II nursery at Manchester Hospital
• Pediatric dentistry program at CCMC
• Statewide Neonatal Transport Program and Regional Neonatal Intensive Care Unit / In FY07, UConn’s Neonatal Transport Program transported 350 neonates to JDH and 15 other hospitals from 98 Connecticut towns
• Provide workforce at St Francis/UConn Burgdorf Clinic (Hartford’s north end)
• Provide cardiac perfusionist services to St. Mary’s and Waterbury Hospitals
• Regional dental emergency room service
• Training site for nursing, allied health schools
UCHC: Partner & Resource to Other Hospitals

8
State Support• Traditionally received state general fund support to the academic (education
and research) enterprise only
• 18.2% of the Health Center budget is state supported
• 81.8% comes from other revenues (clinical, research, tuition, philanthropy)
U N IV E R S ITY OF C ON N E C TIC U T H E ALTH C E N TE R S TA TE S UP P ORT A S A P E RC E NT OF TOTA L E X P E NS E S
22.6%
20.5%
18.2%17.3%
16.6% 16.2%
19.1% 18.2%
5 . 0 0 %
10 . 0 0 %
15 . 0 0 %
2 0 . 0 0 %
2 5 . 0 0 %
FY 2001 FY 2002 FY 2003 FY 2004 FY 2005 FY 2006 FY 2007 FY 2008Bu d g e t
F isca l Ye a r
Perc
ent
9
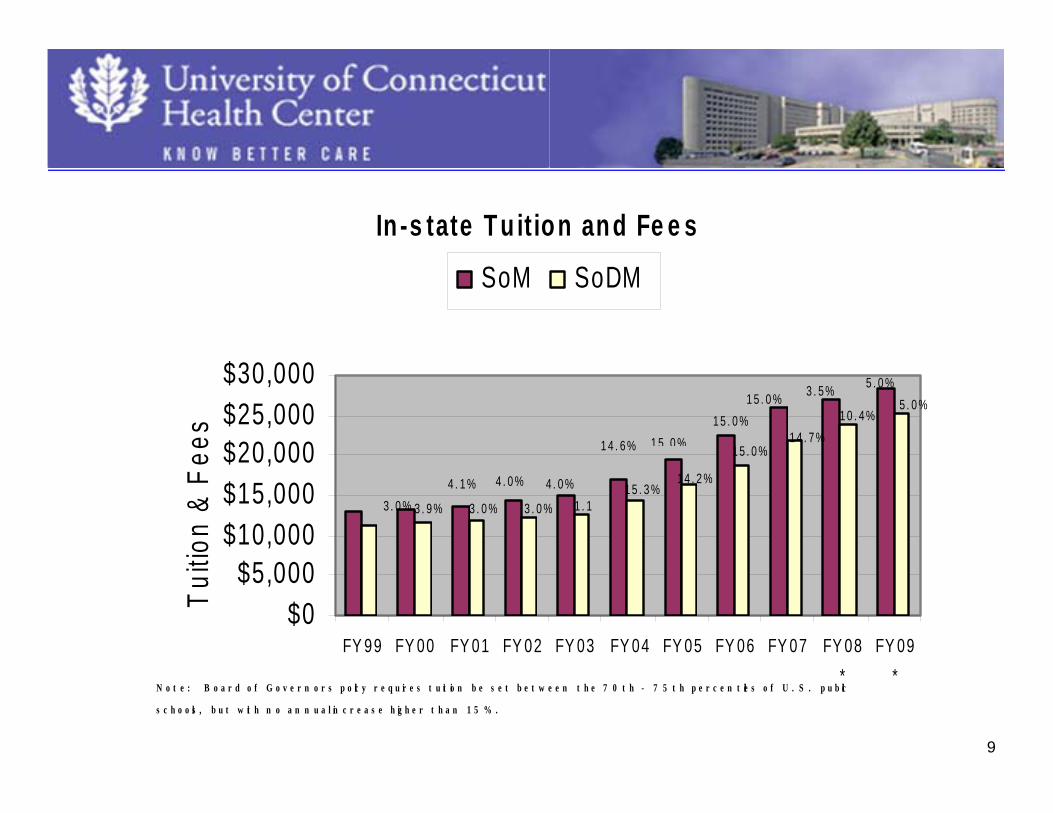
In -s tate T u it io n an d Fe e s
$0$5,000
$10,000$15,000$20,000$25,000$30,000
FY 99 FY 00 FY 01 FY 02 FY 03 FY 04 FY 05 FY 06 FY 07 FY 08*
FY 09*
Tuitio
n &
Fees
SoM SoDM
N o t e : B o a r d o f G o v e r n o r s p o lic y r e q u ir e s t u it io n b e s e t b e t w e e n t h e 7 0 t h - 7 5 t h p e r c e n t ile s o f U . S . p u b lic
s c h o o ls , b u t w it h n o a n n u a l in c r e a s e h ig h e r t h a n 1 5 % .
5 . 0 %5 . 0 %
3 . 5 %
1 0 . 4 %1 5 . 0 %
1 4 . 7 %1 5 . 0 %
1 5 . 0 %
3 . 0 % 3 . 9 %
4 . 1 %
3 . 0 %
4 . 0 %
3 . 0 %
4 . 0 %1 . 1
%
1 4 . 6 %
1 5 . 3 %
1 5 . 0 %
1 4 . 2 %

10
UNIV E RS IT Y O F C O NNE C T IC UT HE ALT H C E NT E RR E S E AR C H AW AR D S B Y F IS C AL YE AR
No te : Th is g r ap h in clu d e s th e fu ll g r an t am o u n t (e ve n if m u lt i-ye ar ) in the ye ar o f th e aw ar d
44,783,89148,038,708 49,656,153
57,843,333
69,094,668
80,781,654
96,229,65498,825,833
92,520,77590,072,487
92,483,505 92,000,000
7.3% 3.4%
16.5%
19.5%
16.9%
19.1% 2.7%
-6.4% -0.5%2.7%-2.6%
30,000,000
50,000,000
70,000,000
90,000,000
110,000,000
F Y 19 9 7 F Y 19 9 8 F Y 19 9 9 F Y 2 0 0 0 F Y 2 0 0 1 F Y 2 0 0 2 F Y 2 0 0 3 F Y 2 0 0 4 F Y 2 0 0 5 F Y 2 0 0 6 F Y 2 0 0 7 F Y 2 0 0 8
F isca l Ye a r
Rev
enue

11
About John Dempsey Hospital (JDH)• Opened in 1975, JDH is the only public university acute care hospital in
Connecticut and the 2nd smallest academic health center hospital in the United States
• Originally planned at 400 beds, the first phase of JDH was built at 200 beds. The second tower was never built
• Has 224 fully staffed and licensed beds, of which 116 are very specialized (Neonatal, Prison, Psychiatry, Maternity), leaving only 108 medical/surgical (flexible) beds
• Traditionally received no state general fund support for operations or capital program
• Faces the same set of challenges as the state’s other 29 acute care hospitals: Medicaid/Medicare cutbacks, uncompensated care, low reimbursement rates, nursing and other health care profession shortages and the realities of an intensely competitive marketplace
• 16.6% of JDH inpatient cases are Medicaid recipients. JDH is in the top five hospitals in Connecticut for Medicaid inpatient days as a percentage of total inpatient days. JDH is a disproportionate share hospital for Medicaid and Medicare
12
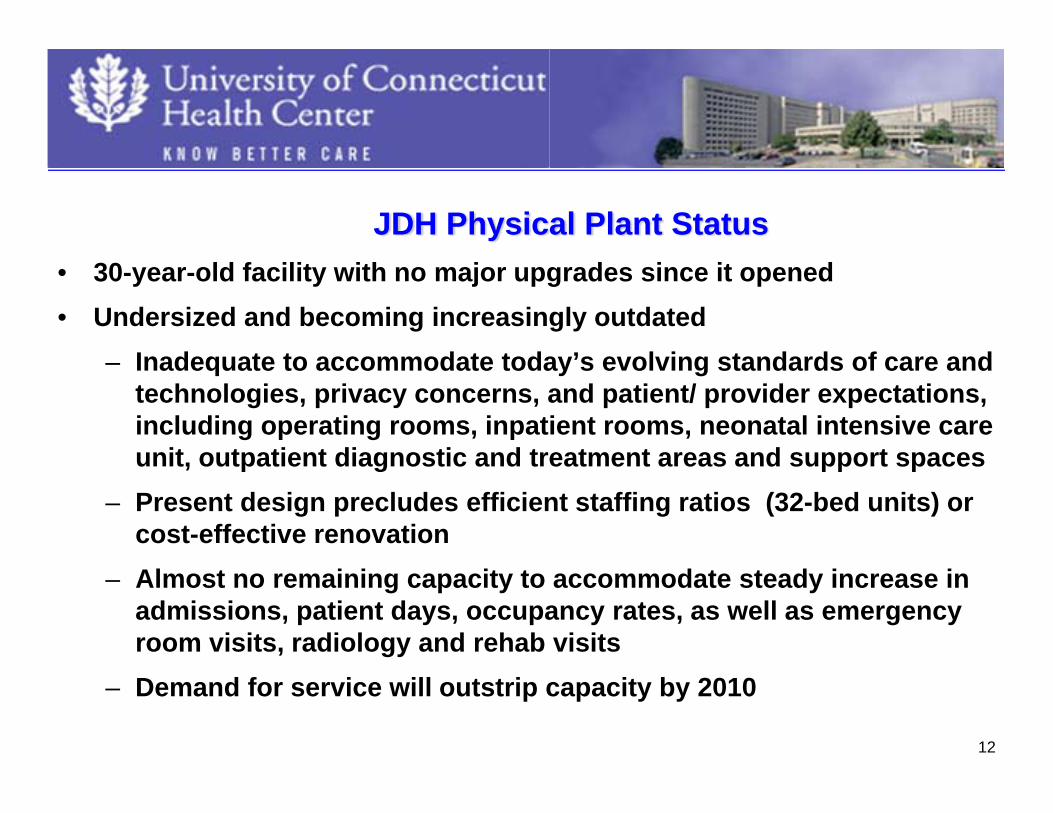
JDH Physical Plant Status• 30-year-old facility with no major upgrades since it opened• Undersized and becoming increasingly outdated
– Inadequate to accommodate today’s evolving standards of care and technologies, privacy concerns, and patient/ provider expectations, including operating rooms, inpatient rooms, neonatal intensive care unit, outpatient diagnostic and treatment areas and support spaces
– Present design precludes efficient staffing ratios (32-bed units) or cost-effective renovation
– Almost no remaining capacity to accommodate steady increase in admissions, patient days, occupancy rates, as well as emergency room visits, radiology and rehab visits
– Demand for service will outstrip capacity by 2010
13
The faculty and students in high quality medical and dental schools need a full
service hospital of adequate size in which education and research are a
core, first priority which enables high quality clinical care.

General Assembly 2007• June & Sept : General Assembly approves study bill to be conducted by
the Connecticut Academy of Science and Engineering (CASE).
“The Office of Legislative Management shall, within available appropriations, contract with the Connecticut Academy of Science and Engineering to conduct a needs-based analysis of The University of Connecticut Health Center facilities plan. The academy shall conduct such analysis in consultation with the Office of Health Care Access. Such analysis shall consider (1) a comparison of the center's proposal for a replacement hospital with the alternative plan for a remodeled center, (2) the projected state-wide need for hospital beds up to at least the year 2018, and any possible impact that any acute care hospital in the region may experience if the amount of beds is increased at the university hospital, (3) the center's need for a modernized academic medical facility to provide instruction and achieve excellence in the schools of medicine and dental medicine and program in biomedical science, attract medical and biomedical professionals to such schools and program and to support research and clinical trials, and (4) other factors that the academy may deem appropriate.”
– Interim report due 3/31/08– Final report 6/30/08
14