february 2016 3.5 bulgaria | cyprus | romania | … monthly...1 february 2016 1.5 ioannis gkionis...
TRANSCRIPT

1
February 2016
Ioannis Gkionis
Research Economist
Eurobank Ergasias
+30 210 3331225
Galatia Phoka
Research Economist
Eurobank Ergasias
+30 210 3718922
The authors wish to thank
Dr. Tasos Anastasatos,
Deputy Chief Economist, for
his insightful comments
DISCLAIMER This report has been issued by Eurobank
Ergasias S.A. (“Eurobank”) and may not be
reproduced in any manner or provided to
any other person. Each person that
receives a copy by acceptance thereof
represents and agrees that it will not
distribute or provide it to any other
person. This report is not an offer to buy
or sell or a solicitation of an offer to buy
or sell the securities mentioned herein.
Eurobank and others associated with it
may have positions in, and may effect
transactions in securities of companies
mentioned herein and may also perform
or seek to perform investment banking
services for those companies. The
investments discussed in this report may
be unsuitable for investors, depending on
the specific investment objectives and
financial position. The information
contained herein is for informative
purposes only and has been obtained
from sources believed to be reliable but it
has not been verified by Eurobank. The
opinions expressed herein may not
necessarily coincide with those of any
member of Eurobank. No representation
or warranty (express or implied) is made
as to the accuracy, completeness,
correctness, timeliness or fairness of the
information or opinions herein, all of
which are subject to change without
notice. No responsibility or liability
whatsoever or howsoever arising is
accepted in relation to the contents
hereof by Eurobank or any of its directors,
officers or employees.
Any articles, studies, comments etc.
reflect solely the views of their author.
Any unsigned notes are deemed to have
been produced by the editorial team. Any
articles, studies, comments etc. that are
signed by members of the editorial team
express the personal views of their
author.
Bulgaria | Cyprus | Romania | Serbia
Solid regional growth in Q4:15 spurs optimism for 2016 prospects
REGIONAL MACROECONOMIC DEVELOPMENTS & OUTLOOK
Strong finish for the region in Q4-2015 despite headwinds in the EM space
Sustained low world energy prices provide a positive, albeit probably smaller than last year,
boost on growth momentum in 2016
Economic sentiment in the region in the first two months of 2016 still at its highest or close to the
highest level since 2008
REGIONAL MARKET DEVELOPMENTS & OUTLOOK
Despite some improvement in global investor sentiment, February proved to be yet another
month of increased market volatility and risk aversion
Regional currencies remained supported by expectations for further ECB stimulus, healthy growth
prospects
Local-currency government bonds retained a firm tone on subdued inflation pressures, ECB
easing
COUNTRY FOCUS
Bulgaria: Economy ended the previous year on a strong note
Cyprus: Economy out of the woods
Romania: Surprise inflation reading in January
Serbia: Delays in this year’s fiscal consolidation measures likely ahead of the snap general
elections
Solid growth momentum sustained in Q4-2015
Source: National Statistics, Eurobank Research
0.0
0.5
1.0
1.5
2.0
2.5
3.0
3.5
4.0
Bulgaria Cyprus Romania SerbiaQ2 2015 Q3 2015 Q4 2015
(%, YoY)

2
February 2016
Contents
I. Regional Macroeconomic Developments & Outlook .............................................................. 3 II. Regional Market Developments & Outlook ............................................................................ 5
Trader’s view .............................................................................................................................. 7
III. Country Focus .......................................................................................................................... 8 Bulgaria (Baa2/BB+/BBB-) ....................................................................................................... 8
Cyprus ((P)B3/BB-/B+) .......................................................................................................... 10
Romania (Baa3/BBB-/BBB-) .................................................................................................. 12
Serbia (B1/BB-/B+) ................................................................................................................. 14

3
February 2016
I. Regional Macroeconomic Developments & Outlook
Strong finish for the region in the last quarter of 2015
Headwinds to the global
economic outlook have increased
stemming from concerns about
the US economy
Despite increased EM space
concerns, the region made a
strong finish in Q4-2015, while the
sentiment data coming out up
until now in the new year support
cautious optimism for new year’s
growth prospects
Bulgaria expanded at the highest
rate since 2011, driven primarily
by the increased government
spending ahead of the closing of
the EU funds programming period
2007-2013
Inflationary pressures in Romania
are building faster than in its
regional peers, prompting the
Central Bank to send hawkish
messages to the markets
Fresh concerns about the developed economies’ prospects, coming primarily from disappointing consumer data in the
US, have sparked a new round of fears of a significant- higher than envisaged before- slowdown in the global
economic outlook and have put the growth forecasts for a number of economies in question. In addition, negative
spillovers from the Chinese growth slowdown via the commodity markets continue to pose a serious problem for commodity
producers in the EM space. As a result, data coming out from EM space continue to disappoint, while a divergence between
the economic prospects of commodity exporters and importers is becoming more prominent. For the time being, the growth
prospects of the Euroarea –the main trade partner and primary generator of capital flows for the region- have remained
unscathed. Yet, the tightening of the financial conditions in the Euroarea has created expectations of further action on behalf of
ECB. At the same time, the US Fed, having delivered the first interest rate hike back in December, is now seen at a wait and
see mood well beyond March. In any case, the ability of the Central Banks to stimulate growth through monetary policy has
increasingly come in question.
A number of national statistics offices across the region released earlier this month flash estimates of GDP growth for
Q4-2015. Among them, Bulgaria, Romania, Cyprus and, earlier this month, Serbia published flash estimates more or
less in line with our expectations. Those readings confirm our earlier FY forecasts stipulated in the previous editions
and serve as a reminder that there are few winners’ economies in the EM space. From a growth point of view, it would
be fair to say that 2015 has been a very good year for the region, most probably the best since 2008. Although we do
not have a full detailed break-down for all the economies, domestic demand has been the main driver behind growth in
Q4. Lax monetary policies together with low world energy prices continue to provide a positive boost on the growth
momentum. Although this boost is destined to eventually fade away as energy prices normalize, it is poised to carry on
in 2016 as well; low energy costs keep inflation pressures subdued, supporting real disposable incomes and providing
more flexibility to household, corporate, and sovereign balance sheets. Even though the economic sentiment data
published in February disappointed for the region as a whole as a result of lower manufacturing confidence, in the
economies of our focus, the indicator is at its highest or still relatively close to the highest level since 2008, as
consumers benefit from rising real wages, firmer labor markets and low inflation.
On a country level, Bulgaria expanded by +3.1% YoY in Q4, the highest rate since Q2-2011, driven primarily by the
increase in government spending, which in turn is related to an increased EU funds absorption ahead of the closing of
the programming period 2007-2013 by year end. Having the highest energy consumption intensity in EU-28 and a very
high exposure to the Euro area via trade and capital flows, Bulgaria will most probably continue to benefit the most
from low world energy prices and the ongoing Euro area recovery. However, the fragmented multi-party government
led by GERB survived its first vote of no confidence motion, an illustration of the lingering political risks we were
alluding to in our previous report. Cyprus accelerated to +2.7% YoY in Q4, driven most probably by the ongoing
consumption recovery, which brings the full year growth estimate at +1.6% YoY in 2015, after a three year recession
in 2012-2014. The count-down for Cyprus’ successful graduation from the economic adjustment program in March has
already started. Yet, the conditionality of the last program review is not fully fulfilled yet, as the approval from the
parliament of the corporatization of CYTA is still pending, which has decreased the probability of a clean exit. In any
case, even though the economy has turned page, the post-MoU era is still full of challenges.
Romania registered another quarter of robust domestic demand-driven growth in Q4-2015, which brought the FY2015
growth at +3.7%. Yet, inflation surprised to the upside in January. Despite the continuous energy prices slump and the
negative base effects from fiscal easing, inflationary pressures in Romania are building faster than in its regional
peers, making the Central Bank to send hawkish messages to the markets that could also translate into earlier than
expected action in the monetary policy front. Serbia slowed to +1.2% YoY in Q4 on weaker than in the previous
quarter net exports and investment activity. Having expanded by +0.8% in FY2015, the economy is gradually trying to
find its way onto a new growth path while not having recovered fully from the catastrophic floods in spring 2014. In the
run up to early parliamentary elections in late April, the precautionary IMF agreement is on track, allowing for further
fiscal consolidation, but a stronger push for structural reform is still missing.
. Ioannis Gkionis ([email protected]) (+30) 210 337 1225

4
February 2016
FIGURE 1: Growth performance 2014-2016
Source: Eurostat, National Authorities, Eurobank Research
FIGURE 2: Annual average inflation 2014- 2016
Source: Eurostat, National Authorities, Eurobank Research
FIGURE 3: Investments to GDP ratios 2008 vs. 2014
Source: IMF WEO, Eurobank Research
FIGURE 4: Energy intensity of the individual countries, 2013
Source: Eurostat, National Authorities, Eurobank Research
FIGURE 5: Fiscal Balance (% of GDP, Cash basis) 2014- 2016
Source: Eurostat, National Authorities, Eurobank Research
FIGURE 6: Annual average unemployment rates 2013-2015
Source: Eurostat, National Authorities Eurobank Research
-3
-2
-1
0
1
2
3
4
5
EuroArea Bulgaria Cyprus Romania Serbia
2014 2015E 2016F(%, yoy)
-2
-1
0
1
2
3
4
EuroArea Bulgaria Cyprus Romania Serbia
2014 2015F 2016F(%, yoy)
0
5
10
15
20
25
30
35
40
EuroArea Bulgaria Cyprus Romania Serbia
2008 2014% GDP
0
100
200
300
400
500
600
700
EU-28 Bulgaria Cyprus Romania Serbia
kg of oil equivalent per 1000 EUR of GDP
0
1
2
3
4
5
6
7
8
EuroArea Bulgaria Cyprus Romania Serbia
2014 2015E 2016F(% of GDP)
0
5
10
15
20
25
EuroArea Bulgaria Cyprus Romania Serbia
2013 2014 2015E% Labor force

5
February 2016
II. Regional Market Developments & Outlook
Despite some improvement in global investor sentiment, February proved to be yet another month of increased market volatility and risk aversion Market volatility remained high in
February
MSCI EM index ended in a negative
territory for the 4th month running
Regional currencies remained
supported by expectations for further
ECB stimulus, healthy growth
prospects
Local-currency government bonds
retained a firm tone on subdued
inflation pressures, ECB easing
Volatility in global financial markets is
likely to resurface
Despite some modest improvement in global investor sentiment since late January, February proved to be yet another
month mired in bouts of increased market volatility and risk aversion. Early into the month concerns mounted about the
prospects of the European banking sector. Meanwhile, investor worries that world Central Banks are running out of
ammunition to support global growth, were reflected in the limited impact in global financial markets of the decision by the
Bank of Japan to introduce negative interest rates for the first time ever. Volatility in global oil prices and China-related jitters
also continued to play a key role in the performance of emerging market assets. That said, scaled back expectations for
another Fed rate hike within this year and the increased prospect for further ECB stimulus as early as the March 10th
monetary policy meeting provided some support to risk sentiment, as did the timid recovery witnessed in global commodity
prices since the middle of the month.
Against this backdrop, the MSCI Emerging Markets index finished February in marginally negative territory (-0.3%), closing
in the red for the fourth consecutive month and posting year-to-date losses of approximately -7%. Despite that, the index
stands about 8% higher from its 6 ½ year low, hit in late January, a few weeks after the beginning of the Fed’s rate tightening
cycle. In this environment, CESEE bourses put a mixed performance in February, with the majority of the indices in the
region recording modest loses. Overall, CESEE as well as regional assets have remained broadly supported compared to
their global developing-country peers on the back of healthier economic growth prospects, hopes for further ECB stimulus
and broadly accommodative Central Banks' monetary policies. Falling oil prices also favor oil-importing markets, such as
most CESEE countries, and bode well for maintaining inflationary pressures subdued. At the same time, they support
reducing external vulnerabilities, especially in those countries where energy consumption is heavily based on imports.
Mounting expectations for further ECB stimulus action and healthy growth prospects in the CESEE space, as well as in the
region of our interest, have provided support to the respective currencies. Although most ended the month little changed, the
Polish zloty and the Romanian leu stand out as the most notable outperformers in February, as economic activity remained
robust (Poland 3.6% & Romania 3.8% YoY annual GDP growth in 2015). Against this backdrop, the EUR/PLN traded near
a 7-week trough, at 4.3390, by the end of the month, while the EUR/RON hit a 2-month low at 4.4470 on February 17th.
Notably, the zloty has fully recovered the losses from the January sell off, post the unexpected S&P decision to cut Poland's
sovereign credit rating by 1-notch to BBB+ with Negative Outlook, on the back of concerns of the new government’s policies
on the independence of the country’s institutions. On the flipside, the Serbian dinar slid to a 1-year low of 123.70/EUR in late
February, primarily on the back of strong corporate demand, prompting repeated Central Bank interventions in the FX
markets in order to support the currency.
Elsewhere, CESEE local-currency government bonds remained well supported in view of persistently subdued inflationary
pressures and revived expectations for further Central Bank easing, as well as further ECB QE. Serbian paper led the gains
in February following January’s correction. The latter was likely related to profit taking following last year’s impressive
performance, as well as to supply side concerns ahead of large auctions due in the coming weeks. In more detail, the yield
of the 10.00% May 2022 slid by ca 40bps to 7.36% on the month, while the corresponding yields of Hungary’s 5.50% June
2015, Poland’s 3.25% July 2025 and Romania’s 4.75% February 2025 fell by 20 to 26bps.
Looking ahead, volatility in global financial markets is likely to increase anew, especially if the ECB disappoints easing
expectations on March 10th or the pace of the Fed’s rate-tightening path proves faster than anticipated. Volatility in
commodities prices, renewed global growth concerns and China-related jitters will also likely remain at play. The prospect of
revived geopolitical tensions is another factor to watch for. On a regional basis, a heavy elections’ calendar in the region this
year also bears risks in the face of potential fiscal slippages and escalation of political uncertainty.
Galatia Phoka ([email protected])
(+30) 210 371 8922

6
February 2016
FIGURE 7: Major world & CESEE stock markets performance (%)
Source: Reuters, Bloomberg, Eurobank Research
FIGURE 8: World & CESEE stock markets YTD performance
Source: Reuters, Bloomberg, Eurobank Research
FIGURE 9: MSCI stock indices performance (by region)
Source: Reuters, Bloomberg, Eurobank Research
FIGURE 10: CESEE FX performance
Source: Reuters, Bloomberg, Eurobank Research
FIGURE 11: Change in CESEE government bond yields (in bps)
Source: Reuters, Bloomberg, Eurobank Research
FIGURE 12: Change in 5-Year CDS spreads (in bps)
Source: Reuters, Bloomberg, Eurobank Research
-10 -8 -6 -4 -2 0 2 4 6 8
BELEX15 (RS)
FTSE Eurofirst 300
BETI (RO)
MSCI Emerging Markets Index
S&P Index
Dow Jones
Oil (Generic 1st Future)
SOFIX (BG)
BUX (HU)
WIG (PL)
CYMNPRL (CY)
PFTS (UA)
BIST 100 (TR) Change compared to end-January
Year-to-date change
1100
1200
1300
1400
1500
1600
1700
1800
1900
650
700
750
800
850
900
950
1000
1050
1100
1150
Dec-1
1
Mar-
12
Jun-1
2
Sep-1
2
Dec-1
2
Mar-
13
Jun-1
3
Sep-1
3
Dec-1
3
Mar-
14
Jun-1
4
Sep-1
4
Dec-1
4
Mar-
15
Jun-1
5
Sep-1
5
Dec-1
5
MSCI Emerging Markets (LHS) MSCI World (RHS)
BRICS
Emerging ASIA
WORLD
Emerging Markets
Emerging Europe
Eastern Europe
LATAM
-15% -10% -5% 0% 5% 10%
Change compared to end-January
Year-to-date change
EUR/RON
EUR/PLN
EUR/HUF
EUR/USD
USD/TRY
EUR/RSD
USD/UAH
-5% 0% 5% 10% 15%
Change compared to end-January
Year-to-date change
RSD (10.00% May22)
HUF (5.50% Jun25)
TRY (9.00% Jul24)
PLN (3.25% Jul25)
RON (4.75% Feb25)
BGN (4.00% Jul24)
-50 -40 -30 -20 -10 0 10
Change compared to end-January
Year-to-date
HUNGARY
SERBIA
BULGARIA
ROMANIA
POLAND
CYPRUS
TURKEY
-10 -5 0 5 10 15 20 25 30
Change compared to end-January
Year-to-date

7
February 2016
Trader’s view
We prefer to stay sidelined on the
dinar
Prefer to stay underweight on
local government bonds
Long ROMGB positions appear
favorable amid ample liquidity and
attractive carry
Stay neutral in the long-end of the
curve due to high market
uncertainty and in view of the
Eurobond issuance
FX
In the last report, we expressed our belief that the EUR/RSD pair would move lower in the short-term. We were right, partially.
The pair was heading towards our first objective (122.00) but the National Bank of Serbia overturned this downtrend with its
decision to intervene and stop any further strengthening of the domestic currency. In view of heightened market volatility and
repeated Central Bank interventions from either side of the EUR/RSD’s recent range, we expect range trading to prevail in the
coming weeks. In this context, we anticipate the EUR/RSD to remain bound within 122.50-123.00 over the next month or so,
with a rise towards 123.00-124.00 in a 3-month horizon. In this environment and taking into account a potential escalation of
market volatility in the way to the upcoming snap national elections we would prefer to stay sidelined on constructing any new
positions on the dinar.
Local rates
Since rumors on new Eurobond issue started spreading in mid-February in Bulgaria, local government bonds came under
pressure in the 6-10 year sector, where yields increased by 25-35bps back to their November levels. Instead, the short and
mid-term papers stayed supported as banks continued to place extra liquidity. We expect further steepening of the curve in the
coming weeks. The auction calendar is likely to remain empty in March ahead of a planned Eurobond issue in that month.
However, the lower overall supply in the primary market for this year would drive more competition among investors in
upcoming auctions. Along these lines we would prefer to stay underweight on local government bonds.
In Romania, ample RON liquidity in the market in tandem with a favorable macroeconomic growth outlook for Romania in the
short-term suggest that long positions on Romanian local currency paper appear favorable. High liquidity is expected to be
present in the markets in the coming months, while the carry of those bonds seems more than attractive.
Security Position Entry Current level Target Stop loss
ROMGB 2025 Long 3.40% 3.46% 3.10% 3.65%
External debt markets
Bulgarian Eurobonds, on the other hand, experienced a more limited correction in February, with corresponding yields up by
10bps compared to their end-January levels. We favor the mid-term sector in the Bulgarian Eurobond market as it appears
underpriced compared to regional peers, such as Romania. Nonetheless, we prefer to stay neutral in the long-end of the curve
at this point due to high global market uncertainty and wait until the Eurobond issuance to specify any targets. Rumor has it,
that the Finance Ministry plans to sell EUR 2bn on international markets in March, most likely in two tranches of 10 and 15/20
years. Yields are expected at circa 2.80% for the 10-year paper and 4% for the 20-year one, net of issuance premium.
Vessela Boteva ([email protected])
+359 (2) 8166 491
Romulus-Daniel Georgescu ([email protected])
+4021 3656292
Zoran Korac ([email protected])
+381 11 206 5821
8
February 2016
III. Country Focus
Bulgaria (Baa2/BB+/BBB-)
Economy ended the previous year on a strong note
The economy picked up pace in
the last quarter of 2015, growing
at the strongest rate since Q2-
2011.
Sustained labor market
recovery is expected to support
further consumption recovery in
2016
The annual EU Commission
report urged once again
authorities to accelerate
progress in the reform of the
judiciary and the fight against
corruption and organized crime
Full year budget execution
undershoots the revised official
target in 2015
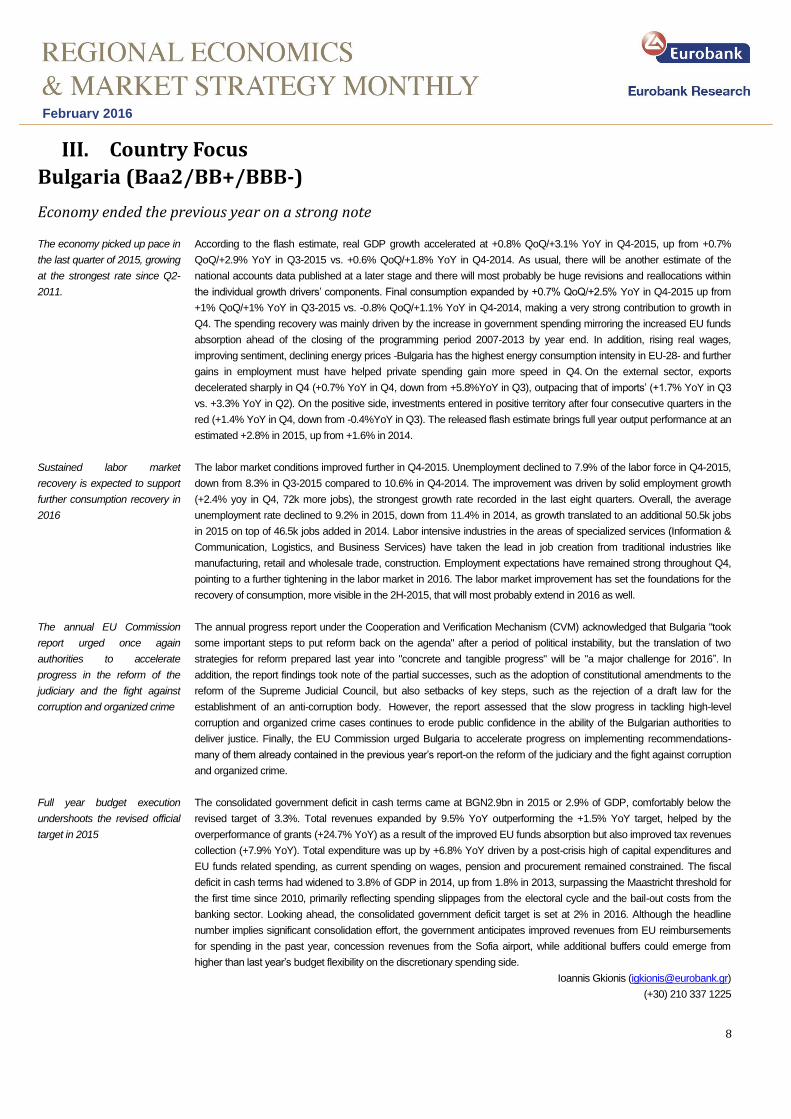
According to the flash estimate, real GDP growth accelerated at +0.8% QoQ/+3.1% YoY in Q4-2015, up from +0.7%
QoQ/+2.9% YoY in Q3-2015 vs. +0.6% QoQ/+1.8% YoY in Q4-2014. As usual, there will be another estimate of the
national accounts data published at a later stage and there will most probably be huge revisions and reallocations within
the individual growth drivers’ components. Final consumption expanded by +0.7% QoQ/+2.5% YoY in Q4-2015 up from
+1% QoQ/+1% YoY in Q3-2015 vs. -0.8% QoQ/+1.1% YoY in Q4-2014, making a very strong contribution to growth in
Q4. The spending recovery was mainly driven by the increase in government spending mirroring the increased EU funds
absorption ahead of the closing of the programming period 2007-2013 by year end. In addition, rising real wages,
improving sentiment, declining energy prices -Bulgaria has the highest energy consumption intensity in EU-28- and further
gains in employment must have helped private spending gain more speed in Q4. On the external sector, exports
decelerated sharply in Q4 (+0.7% YoY in Q4, down from +5.8%YoY in Q3), outpacing that of imports’ (+1.7% YoY in Q3
vs. +3.3% YoY in Q2). On the positive side, investments entered in positive territory after four consecutive quarters in the
red (+1.4% YoY in Q4, down from -0.4%YoY in Q3). The released flash estimate brings full year output performance at an
estimated +2.8% in 2015, up from +1.6% in 2014.
The labor market conditions improved further in Q4-2015. Unemployment declined to 7.9% of the labor force in Q4-2015,
down from 8.3% in Q3-2015 compared to 10.6% in Q4-2014. The improvement was driven by solid employment growth
(+2.4% yoy in Q4, 72k more jobs), the strongest growth rate recorded in the last eight quarters. Overall, the average
unemployment rate declined to 9.2% in 2015, down from 11.4% in 2014, as growth translated to an additional 50.5k jobs
in 2015 on top of 46.5k jobs added in 2014. Labor intensive industries in the areas of specialized services (Information &
Communication, Logistics, and Business Services) have taken the lead in job creation from traditional industries like
manufacturing, retail and wholesale trade, construction. Employment expectations have remained strong throughout Q4,
pointing to a further tightening in the labor market in 2016. The labor market improvement has set the foundations for the
recovery of consumption, more visible in the 2H-2015, that will most probably extend in 2016 as well.
The annual progress report under the Cooperation and Verification Mechanism (CVM) acknowledged that Bulgaria "took
some important steps to put reform back on the agenda" after a period of political instability, but the translation of two
strategies for reform prepared last year into "concrete and tangible progress" will be "a major challenge for 2016”. In
addition, the report findings took note of the partial successes, such as the adoption of constitutional amendments to the
reform of the Supreme Judicial Council, but also setbacks of key steps, such as the rejection of a draft law for the
establishment of an anti-corruption body. However, the report assessed that the slow progress in tackling high-level
corruption and organized crime cases continues to erode public confidence in the ability of the Bulgarian authorities to
deliver justice. Finally, the EU Commission urged Bulgaria to accelerate progress on implementing recommendations-
many of them already contained in the previous year’s report-on the reform of the judiciary and the fight against corruption
and organized crime.
The consolidated government deficit in cash terms came at BGN2.9bn in 2015 or 2.9% of GDP, comfortably below the
revised target of 3.3%. Total revenues expanded by 9.5% YoY outperforming the +1.5% YoY target, helped by the
overperformance of grants (+24.7% YoY) as a result of the improved EU funds absorption but also improved tax revenues
collection (+7.9% YoY). Total expenditure was up by +6.8% YoY driven by a post-crisis high of capital expenditures and
EU funds related spending, as current spending on wages, pension and procurement remained constrained. The fiscal
deficit in cash terms had widened to 3.8% of GDP in 2014, up from 1.8% in 2013, surpassing the Maastricht threshold for
the first time since 2010, primarily reflecting spending slippages from the electoral cycle and the bail-out costs from the
banking sector. Looking ahead, the consolidated government deficit target is set at 2% in 2016. Although the headline
number implies significant consolidation effort, the government anticipates improved revenues from EU reimbursements
for spending in the past year, concession revenues from the Sofia airport, while additional buffers could emerge from
higher than last year’s budget flexibility on the discretionary spending side.
Ioannis Gkionis ([email protected])
(+30) 210 337 1225

9
February 2016
FIGURE 13: GDP growth & Inflation 2000-2015
Source: National statistics, Ecowin Reuters, Eurobank Research
FIGURE 14: CA Deficit & Net FDI inflows 2010-2015
Source: National statistics, Ecowin Reuters, Eurobank Research
FIGURE 15: Inflation dynamics 2012-2015
Source: National statistics, Ecowin Reuters, Eurobank Research
FIGURE 16: Fiscal deficit & Gross Public Debt 2010-2015
Source: Eurostat, Eurobank Research
-6
-4
-2
0
2
4
6
8
10
12
14
200
0
200
1
200
2
200
3
200
4
200
5
200
6
200
7
200
8
200
9
2010
2011
2012
2013
2014
2015
Q1
2015
Q2
2015
Q3
GDP growth (yoy) Inflation (annual average)
%
-2
1
3
5
2010 2011 2012 2013 2014 Jan-Nov
2015
CA Balance (% GDP) Net FDI Inflows (% GDP)
% GDP
-3%
-2%
-1%
0%
1%
2%
3%
4%
5%
De
c-12
Ma
r-13
Jun
-13
Se
p-1
3
De
c-13
Ma
r-14
Jun
-14
Se
p-1
4
De
c-14
Ma
r-15
Jun
-15
Se
p-1
5
De
c-15
Tobacco & Alcohol Food Utilities Other categories
10
20
30
- 4.5
- 4.0
- 3.5
- 3.0
- 2.5
- 2.0
- 1.5
- 1.0
- 0.5
0.0
2010 2011 2012 2013 2014 2015E
Fiscal Balance (% of GDP, cash basis, Lh)
Gross Public Debt (% GDP, Rh)
% GDP % GDP
Source: National Sources, Eurostat, IMF, Eurobank Research
2014 2015 2016f 2017f
Real GDP (yoy%) 1.6 2.8 2.6 3.1
Inflation (yoy%)
CPI (annual average) -1.4 -0.1 1.0 1.5
CPI (end of period) -0.9 -0.4 1.2 2.0
Fiscal Accounts (%GDP)
General Government Balance -3.7 -3.3 -2.0 -1.4
Gross Public Debt 27.7 26.7 29.7 31.1
Primary Balance -3.0 -2.0 -1.1 -0.4
Labor Statistics
Unemployment Rate (LFS, %) 11.4 9.9 9.1 8.5
Wage Growth (total economy) 6.8 7.5 7.0
External Accounts
Current Account (% GDP) 0.9 1.5 1.0 0.5
Net FDI (EUR bn) 1.3 1.5 1.5 1.5
FDI / Current Account (%) Na Na Na Na
FX Reserves (EUR bn) 16.5 20.3 21.0 22.5
Domestic Credit 2012 2013 2014 2015
Total Credit (%GDP) 72.3 72.9 67.7 57.1
Credit to Enterprises (%GDP) 44.1 43.9 38.1 34.9
Credit to Households (%GDP) 21.8 21.7 21.0 20.8
FX Credit/Total Credit (%) 63.1 59.8 54.3 50.6
Private Sector Credit (yoy) 3.0 0.2 -8.2 -1.2
Loans to Deposits (%) 99.4 92.1 84.2 78.2
Financial Markets Current 3M 6M 12M
Policy Rate
EUR/BGN 1.96 1.96 1.96 1.96
Bulgaria: Macro & Market Data
Currency Board

10
February 2016
Cyprus ((P)B3/BB-/B+)
Economy out of the woods
After a three year recession in
2012-2014 the economy
expanded by +1.6% YoY in
2015. Growth is expected to gain
further momentum to 2% in 2016
The count-down for Cyprus’
successful graduation from the
economic adjustment program in
March has already started
Even though the economy has
turned page, the post-MoU era is
full of challenges for Cyprus
Asset quality remains a key
challenge for the domestic
banking sector, even though the
pace of loans’ restructuring has
picked up in recent months
The flash estimate of the last quarter- the fourth consecutive positive one on both quarterly and an annual basis after a
three year recession- is an illustration that the economy is finally out of the woods. On a seasonally adjusted basis, growth
accelerated further to +0.4% QoQ/+2.7% YoY in Q4-2015, up from +0.5% qoq/+2.3% yoy in Q3-2015, compared to -
0.1% qoq/-1.6% yoy in Q4-2014. In the full year 2015, growth expanded by +1.6% YoY, a notch higher than the revised
government projection, compared to -2.5% in 2014, -5.9% in 2013 and -2.4% in 2012. Although the components of
growth are not known yet, it is highly likely that the consumption rebound has continued in Q4-2015, driven by sentiment
improvement as a result of strong compliance with programme’s conditionalities, lower energy prices, lower
unemployment and a rise in real incomes. Looking ahead, we anticipate growth to gain further momentum in 2016 as
lower energy prices, the lagged effect from Euro depreciation, the lack of additional fiscal austerity measures and a
flourishing tourism sector are expected to provide more support to consumption’s recovery and net exports.
If authorities satisfy the conditionalities of the last program review with respect to the approval from the parliament of the
corporatization of CYTA -the telecom public utility- Cyprus will become in March the third country after Portugal and
Ireland to have made a clean exit from its economic adjustment program. The issue is highly politically sensitive and has
received a lot of public attention ahead of the parliamentary elections in next May. More importantly, time is running out
for the endorsement of the review in the next Eurogroup in early March. Overall, Cyprus has already made use of €7.3bn
up until now out of a total €10bn available in the program. Although the disbursement of the last ESM tranche is not
absolutely necessary as market access has been restored, at a comparably higher cost than that of official lending the
endorsement of the review will send a positive signal to the markets allowing for a further improvement in the cost of
funding. More importantly, it will allow the ECB to provide a waiver for government bonds to be eligible for Euro system
financing after Cyprus’ graduation from the program, even though the sovereign rating of Cyprus is still below investment
grade, despite rating agencies’ upgrading. Cyprus has made the fastest come-back to international markets among other
Euroarea programme countries tapping the international markets three times (June 2014, April 2015 and October 2015).
After a sharp output decline in 2012-2014, it is apparent that Cyprus has entered a new growth path. Cyprus has made
significant adjustment progress within the programme in a number of areas, including but not limited to, restoring the
health of the banking sector, a complete lift of capital controls, fixing of public finances and addressing earlier
macroeconomic imbalances. In any case, even after the prospective parliamentary elections of May a handful of
unfinished structural reforms in the areas of privatizations, public administration and the health sector need to proceed. In
addition,, the challenges of the still high NPLs stock and high ELA exposure (€3.5bn in January 2016 or 19.7% of
projected GDP, down from €11.4bn in March 2013) need to be addressed, while maintaining high primary surpluses. To
ensure sustainable growth in the medium-term, there is still need for a comprehensive post-MoU growth strategy. Such a
strategy should rely on the key comparative advantages of Cyprus, including the low corporate tax rate, the key
geostrategic position of the island in the Mediterranean Sea, the facilitation of international business, quality human
capital.
Addressing the high NPLs ratio remains a key challenge for the banking sector. The banking system-wide NPEs ratio- a
more conservative asset quality EBA methodology which inflates NPLs numbers by including restructured loans for a
probation period of at least 12 months-declined to 46.1% in October 2015, compared to 47.8% in December 2014. The
ratio remains relatively high, among the highest following any recent banking crisis. Yet, the pace of loans restructuring,
an essential tool for the resolution of NPLs, has picked up in the last months of 2015. The amount of loans restructured
climbed from €1bn in Q1-2015 to €1.2bn in Q2-2015, further to €1.4bn in Q3-2015, and reached €1.18bn already in the
two month period October-November 2015. As a result, a large fraction of the restructured loans falls into the 12-month
probation period and are still classified in NPEs (39% in Nov2015 vs.33% in Dec2014). On a more positive note,
according to the Central Bank data, 78% of the fixed-term loans which were restructured between 1 January 2014 and 30
November 2015 abide by the new repayment schedule agreed as part of the restructuring process. The pace of
restructuring is anticipated to accelerate in the coming months, now that more incentives are in place for borrowers and
lenders, namely the foreclosures and insolvency framework are in full force.
Ioannis Gkionis ([email protected])
(+30) 210 337 1225

11
February 2016
FIGURE 17: Growth performance Cyprus vs. Euroarea 2010-2015
Source: Eurostat, Eurobank Research
FIGURE 18: HICP Cyprus vs. Euroarea 2010-2015
Source: Eurostat, Eurobank Research
FIGURE 19: 10Y Government Bond Yield
Source: Bloomberg, Eurobank Research
FIGURE 20: Fiscal deficit & Gross Public Debt 2011-2016
Source: Ministry of Finance, Eurobank Research
-7
-6
-5
-4
-3
-2
-1
0
1
2
3
4
20
10
Q1
20
10
Q2
20
10
Q3
20
10
Q4
20
11
Q1
20
11
Q2
20
11
Q3
20
11
Q4
20
12
Q1
20
12
Q2
20
12
Q3
20
12
Q4
20
13
Q1
20
13
Q2
20
13
Q3
20
13
Q4
20
14
Q1
20
14
Q2
20
14
Q3
20
14
Q4
20
15
Q1
20
15
Q2
20
15
Q3
Cyprus Euroarea
%, yoy
-3
-2
-1
0
1
2
3
4
5
Ma
r-1
0
Jun
-10
Se
p-1
0
De
c-1
0
Ma
r-1
1
Jun
-11
Se
p-1
1
De
c-1
1
Ma
r-1
2
Jun
-12
Se
p-1
2
De
c-1
2
Ma
r-1
3
Jun
-13
Se
p-1
3
De
c-1
3
Ma
r-1
4
Jun
-14
Se
p-1
4
De
c-1
4
Ma
r-1
5
Jun
-15
Se
p-1
5
De
c-1
5
CYPRUS EUROAREA
%, yoy
2
4
6
8
10
12
14
16
18
Oct-10 Jul-11 Apr-12 Jan-13 Oct-13 Jul-14 Apr-15 Jan-16
(YTM, %)
60
65
70
75
80
85
90
95
100
105
110
-7
-6
-5
-4
-3
-2
-1
0
1
2
2011 2012 2013 2014 2015E 2016F 2017F 2018F
General Government Deficit (% of GDP, Cash Basis, Lh)
Gross Public Debt (% of GDP, Cash Basis, Rh)
% of GDP % of GDP
Source: National Sources, Eurostat, IMF, Eurobank Research
2014 2015f 2016f 2017f
Real GDP (yoy%) -2.5 1.6 2.0 2.5
Inflation (yoy%)
HICP (annual average) -0.3 -1.5 0.2 0.6
HICP (end of period) -1.0 -1.4 0.6 1.3
Fiscal Accounts (%GDP)
General Government Balance -0.2 -1.5 0.0 0.8
Gross Public Debt 108.2 109.0 99.8 95.7
Primary Balance 2.8 1.5 2.5 3.0
Labor Statistics
Unemployment Rate (LFS, %) 16.1 15.6 14.5 13.2
Wage Growth (total economy) -4.7 -0.8 1.1 1.4
External Accounts (% GDP)
Current Account -4.6 -4.7 -4.4 -3.8
Trade Balance (G&S) 0.7 1.5 2.0 1.9
Net FDI 4.1 -0.7 -6.2 -1.3
Domestic Credit 2012 2013 2014 2015
Total Credit (%GDP) 371.6 351.4 353.5 360.8
Credit to Enterprises (%GDP) 170.2 160.2 148.1 151.5
Credit to Households (%GDP) 138.2 140.0 142.7 136.4
Private Sector Credit (yoy) 6.2% -12.2% -2.3% -3.4%
Loans to Deposits (%) 103.3% 135.3% 133.4% 136.6%
Cyprus: Macro & Market Data

12
February 2016
Romania (Baa3/BBB-/BBB-)
Surprise inflation reading in January
Romania stood out of the pack for
a second consecutive year in
2015. FY growth came at 3.7% in
2015 up from 3% in 2014
The trade deficit deterioration is
one of the warning signs that
macroeconomic imbalances could
reemerge.
Inflation surprised to the upside in
the first month of the year despite
the decline in energy prices and
the headline VAT rate cut.
Despite the continuous energy
prices slump and the negative base
effects from fiscal easing, inflationary
pressures are rising in Romania
faster than its peers.
Local currency credit dynamics
accelerated to a new post-crisis
high in December
According to the flash estimate release, real GDP expanded by +1.1%QoQ/+3.8% YoY in Q4-2015 in seasonally adjusted
terms, up from +1.5%QoQ/+3.7% YoY in Q3-2015 and +0.9%QoQ/+2.8%YoY in Q4-2014. The Q4 reading brings FY
growth performance at 3.7% in 2015, a notch below our 3.8% forecast compared to 3% in 2014 and 3.5% in 2013.
Although the components are yet to be known, we anticipate that growth has been primarily domestic demand-driven.
Romania is expected to be a regional outperformer in 2016 as well. Growth is expected to accelerate further to 4.1% in
2016, partly driven by a private consumption spending boom, fuelled by the unwarranted pro-cyclical fiscal stimulus ahead
of the parliamentary elections scheduled in late 2016. Hence, the economy is driven close to, if not above, its potential
growth rate at the expense of pushing government finances off consolidation track.
So far, the robust performance in services and current transfers as a result of the improved EU funds absorption maintain
the current account deficit at relatively low levels (-1.1% of GDP in 2015.) According to the latest INSEE data, the trade of
goods deficit widened to €1,174mn in December, up by 55.8% YoY bringing the cumulative deterioration at 38.0% in 2015.
Double digit import growth (+12.4% YoY in December /+7.6% YoY in 2015) coupled with decelerating exports
performance (+3.8% YoY in December/+4.1% YoY in 2015) as a result of the underperformance of exports to extra-EU28
destinations are the main drivers behind the trade of goods deficit dynamics (4.9% of GDP in 2015 vs. 4.2% in 2014)
Inflation came at -0.8% MoM/-2.1% YoY in January, down from +0.1%MoM/-0.9%YoY in December. The print was
significantly above market expectations (BBG survey:+0.3%MoM/-2.7%YoY). The 4ppts headline VAT rate cut-from 24%
to 20%, effective from January 1st, compounded by the food staff VAT rate cut-from 24% to 9% effective from last June,
pushed headline inflation further into negative territory. On a monthly basis, the volatile food component of CPI edged up at
+0.47%MoM/-6.29%YoY in January compared to +0.22%MoM/-6.20%YoY in last December. Accordingly, non-food items
decelerated sharply to -1.56%MoM/+0.12%YoY vs. -0.1%MoM/+1.95%YoY in last December. Finally, Services slowed
down to -1.12%MoM/+1.23%YoY compared to +0.4%MoM/+2.4%YoY in December.
In our view, there are two key takeaways from the January inflation reading. Firstly, the pass through effect of the headline
VAT rate cut into inflation turned out effectively lower than in the case of the food VAT rate cut. To some extent, this is
reflected in the less than expected slowdown of the services inflation component. This is not totally surprising, given that
real wage growth- the highest in EU-28 at the moment-is rallying at double digit growth rates and subsequently feeds into
retail sales and prices. Secondly, inflationary pressures are building fast, which may explain the hawkish NBR rhetoric in
the February inflation report presentation, and could prompt earlier NBR action. The NBR governor, Mr. Isarescu, pointed
out that given the two years’ time lag of the monetary policy transmission mechanism, the time of taking some action may
be approaching. However, he added that narrowing the interest rate corridor might be delayed in order to deter short-term
speculative capital inflows. Having stayed put on rates and MRRs in February as expected, NBR upgraded its year end
inflation forecast in 2016 to +1.4% YoY vs. +1.0% YoY in the November inflation report and presented for the first time its
year-end forecast in 2017 at +3.4% YoY. Looking ahead, inflation is most likely to stay below the target range (2.5%±1%)
until 1H-2016. However, notwithstanding the impact of taxes, inflation has already entered the target band. HICP at
constant taxes climbed to +2.3% YoY in Dec2015 vs. only +0.3%YoY in Dec2014, at a comparably higher than its regional
peers (Poland:-0.5%YoY, Hungary: +0.8%YoY, Bulgaria:-0.9%YoY).
Credit to the non-government sector continued recovering in December driven by the robust local currency credit
dynamics. Non-government credit edged up to -0.4%MoM/+3.0%YoY in December vs. +1.9 MoM/+2.3%YoY in
November. RON-credit accelerated to a new post-crisis high at -0.7% MoM/+19.7% YoY in December, up from +2.2%
MoM/+18.7%YoY in November. Lending to households expanded briskly by +1.3%MoM/+31.1%YoY in December, while
lending to the corporates somehow lagged behind at -2.5%MoM/+11.0%YoY. FX-lending continued shrinking by -
0.1%MoM/-9.1%YoY in December, down from +1.6% MoM/-10.6%YoY in November. This reflects the lack of new FX-
lending as a result of the macro-prudential regulations in place but also the disposal of NPLs at the end of last year. On the
other hand, deposits of the non-government sector expanded by +6.8%MoM/+8.6%YoY in December, up from +1.6%
MoM/+7.3% YoY in November driven by the seasonally increased consumer and government spending in the last month
of the year.
Ioannis Gkionis ([email protected]) (+30) 210 333 71225

13
February 2016
FIGURE 21: Growth rates Romania vs. EU - 28 2010-2015
Source: Eurostat, Eurobank Research
FIGURE 22: Sentiment indicators 2011-2015
Source: Eurostat, Ecowin Reuters, Eurobank Research
FIGURE 23: Monetary policy & FX rate 2012-2015
Source: Bloomberg, Eurobank Research
FIGURE 24: Inflation components 2011-2015
Source: National statistics, Eurobank Research
-2.0
-1.0
0.0
1.0
2.0
3.0
4.0
5.0
2010 2011 2012 2013 2014 2015Q2 2015Q3
%, yoy
Romania EU-28
40
50
60
70
80
90
100
110
120
10
20
30
40
50
60
70
Dec
-10
Mar
-11
Jun-
11
Sep-
11
Dec
-11
Mar
-12
Jun-
12
Sep-
12
Dec
-12
Mar
-13
Jun-
13
Sep-
13
Dec
-13
Mar
-14
Jun-
14
Sep-
14
Dec
-14
Mar
-15
Jun-
15
Sep-
15
Dec
-15
Industry (lhs) Services (lhs)Consumers (lhs) Construction (lhs)Retail Trade (lhs) Economic Sentiment (rhs)
1.5
2
2.5
3
3.5
4
4.5
5
5.5
4.2
4.25
4.3
4.35
4.4
4.45
4.5
4.55
4.6
4.65
4.7
Ma
y-1
2
Au
g-1
2
No
v-1
2
Feb
-13
Ma
y-1
3
Au
g-1
3
No
v-1
3
Feb
-14
Ma
y-1
4
Au
g-1
4
No
v-1
4
Feb
-15
Ma
y-1
5
Au
g-1
5
No
v-1
5
%eop
EUR/RON (left, eop) Policy Rate (%, right)
-3
-2
-1
0
1
2
3
4
5
6
De
c-1
1
Ap
r-1
2
Au
g-1
2
De
c-1
2
Ap
r-1
3
Au
g-1
3
De
c-1
3
Ap
r-1
4
Au
g-1
4
De
c-1
4
Ap
r-1
5
Au
g-1
5
De
c-1
5
Food Non-Food Services
pps.
Source: National Authorities, EC, IMF, Eurobank Research
2014 2015 2016f 2017f
Real GDP (yoy%) 2.9 3.8 4.1 3.5
Inflation (yoy%)
CPI (annual average) 1.1 -0.6 -0.3 2.5
CPI (end of period) 0.8 -0.9 1.4 3.4
Fiscal Accounts (%GDP, Cash Basis)
General Government Balance -1.9 -1.9 -2.8 -3.7
Gross Public Debt (including guarantees) 39.5 39.1 40.5 42.6
Labor Statistics (annual avg,%)
Unemployment Rate (ILO, % of labor force) 6.8 6.7 6.5 6.3
Wage Growth (total economy) 7.6 8.4 9.5 5.0
External Accounts
Current Account (%GDP, BPM5) -0.4 -1.1 -2.0 -2.5
Net FDI (EUR bn) 2.5 2.7 3.0 3.5
FDI / Current Account (%) 385.0 157.1 111.3 126.7
FX Reserves (EUR bn) 32.2 32.3 33.0 33.5
Domestic Credit (end of period) 2012 2013 2014 2015
Total Credit (%GDP) 52.0 47.0 44.4 43.9
Credit to Enterprises (%GDP) 20.3 18.0 15.7 15.5
Credit to Households (%GDP) 17.8 16.5 15.4 15.4
FX Credit/Total Credit (%, private) 62.5 60.9 56.2 49.3
Private Sector Credit (yoy) 1.3 -3.3 -3.1 3.0
Loans to Deposits (%) 133.9 118.4 106.3 106.6
Financial Markets Current 3M 6M 12M
Policy Rate 1.75 1.75 1.75 2.00
EUR/RON 4.46 4.45 4.45 4.35
Romania: Macro & Market Data
14
February 2016
Serbia (B1/BB-/B+)
Delays in this year’s fiscal consolidation measures likely ahead of the snap general elections
2015 budget deficit outperforms
target and last year’s shortfall
CPI inches higher on base
effects
But scope for further NBS easing
appears rather limited
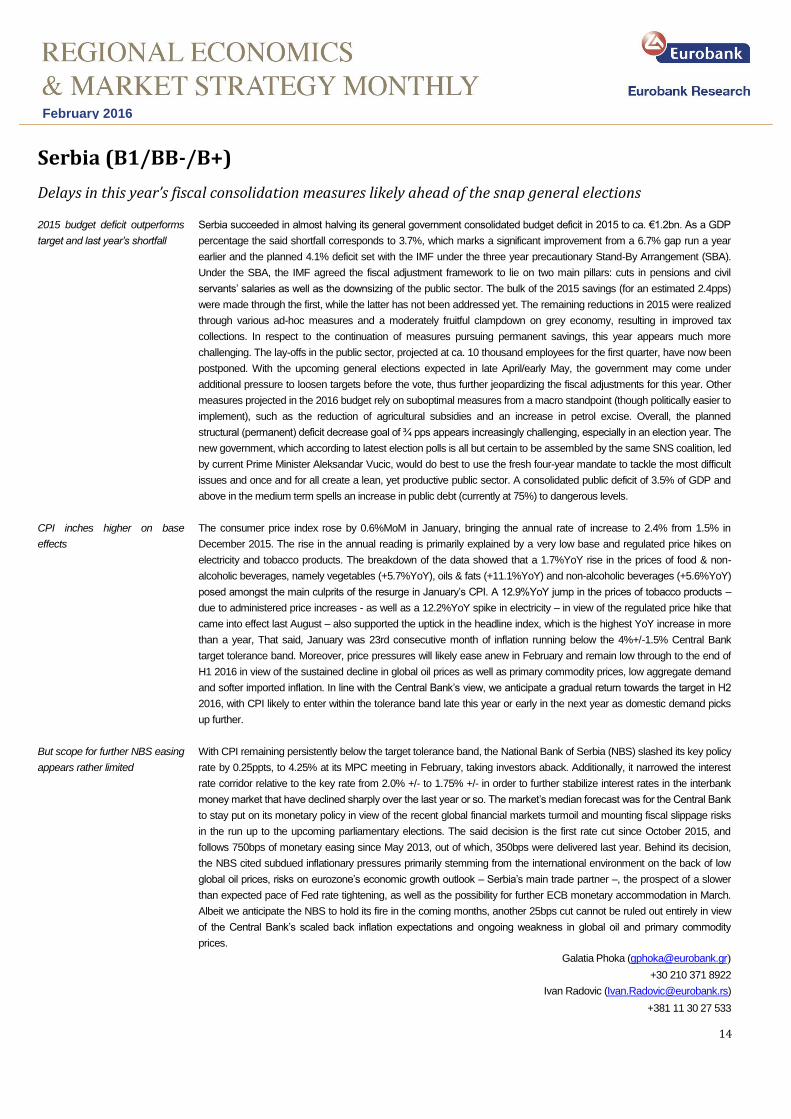
Serbia succeeded in almost halving its general government consolidated budget deficit in 2015 to ca. €1.2bn. As a GDP
percentage the said shortfall corresponds to 3.7%, which marks a significant improvement from a 6.7% gap run a year
earlier and the planned 4.1% deficit set with the IMF under the three year precautionary Stand-By Arrangement (SBA).
Under the SBA, the IMF agreed the fiscal adjustment framework to lie on two main pillars: cuts in pensions and civil
servants’ salaries as well as the downsizing of the public sector. The bulk of the 2015 savings (for an estimated 2.4pps)
were made through the first, while the latter has not been addressed yet. The remaining reductions in 2015 were realized
through various ad-hoc measures and a moderately fruitful clampdown on grey economy, resulting in improved tax
collections. In respect to the continuation of measures pursuing permanent savings, this year appears much more
challenging. The lay-offs in the public sector, projected at ca. 10 thousand employees for the first quarter, have now been
postponed. With the upcoming general elections expected in late April/early May, the government may come under
additional pressure to loosen targets before the vote, thus further jeopardizing the fiscal adjustments for this year. Other
measures projected in the 2016 budget rely on suboptimal measures from a macro standpoint (though politically easier to
implement), such as the reduction of agricultural subsidies and an increase in petrol excise. Overall, the planned
structural (permanent) deficit decrease goal of ¾ pps appears increasingly challenging, especially in an election year. The
new government, which according to latest election polls is all but certain to be assembled by the same SNS coalition, led
by current Prime Minister Aleksandar Vucic, would do best to use the fresh four-year mandate to tackle the most difficult
issues and once and for all create a lean, yet productive public sector. A consolidated public deficit of 3.5% of GDP and
above in the medium term spells an increase in public debt (currently at 75%) to dangerous levels.
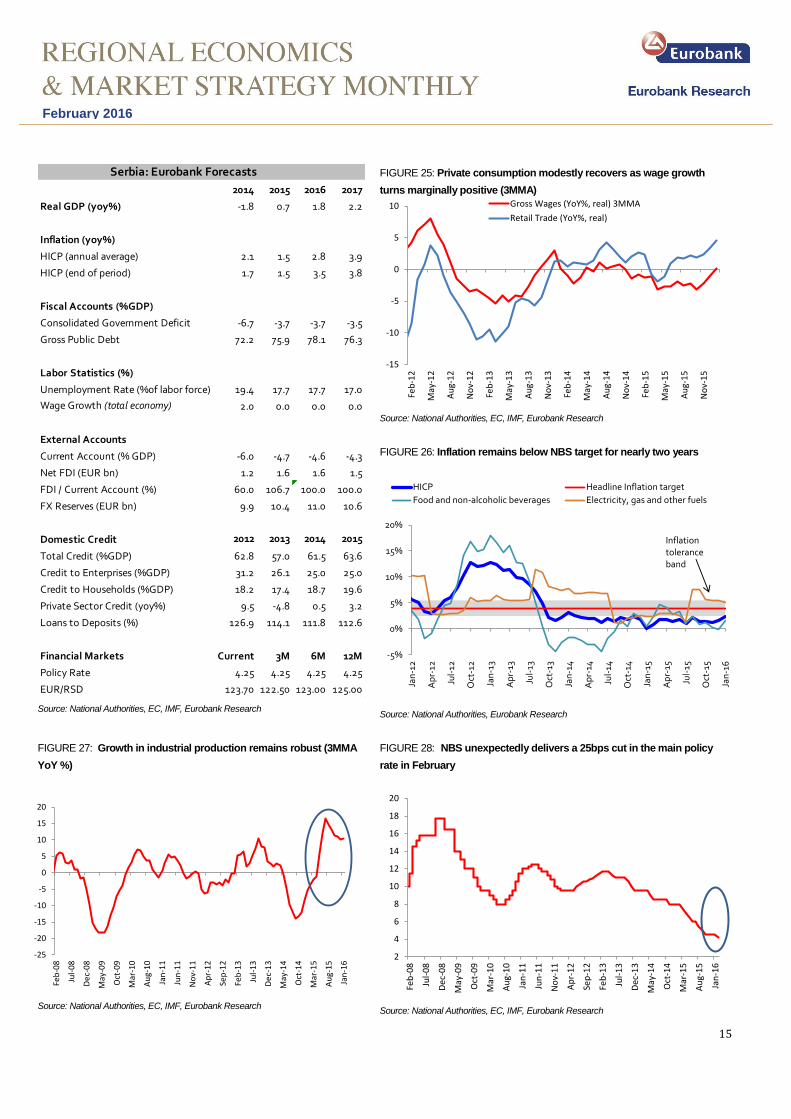
The consumer price index rose by 0.6%MoM in January, bringing the annual rate of increase to 2.4% from 1.5% in
December 2015. The rise in the annual reading is primarily explained by a very low base and regulated price hikes on
electricity and tobacco products. The breakdown of the data showed that a 1.7%YoY rise in the prices of food & non-
alcoholic beverages, namely vegetables (+5.7%YoY), oils & fats (+11.1%YoY) and non-alcoholic beverages (+5.6%YoY)
posed amongst the main culprits of the resurge in January’s CPI. A 12.9%YoY jump in the prices of tobacco products –
due to administered price increases - as well as a 12.2%YoY spike in electricity – in view of the regulated price hike that
came into effect last August – also supported the uptick in the headline index, which is the highest YoY increase in more
than a year, That said, January was 23rd consecutive month of inflation running below the 4%+/-1.5% Central Bank
target tolerance band. Moreover, price pressures will likely ease anew in February and remain low through to the end of
H1 2016 in view of the sustained decline in global oil prices as well as primary commodity prices, low aggregate demand
and softer imported inflation. In line with the Central Bank’s view, we anticipate a gradual return towards the target in H2
2016, with CPI likely to enter within the tolerance band late this year or early in the next year as domestic demand picks
up further.
With CPI remaining persistently below the target tolerance band, the National Bank of Serbia (NBS) slashed its key policy
rate by 0.25ppts, to 4.25% at its MPC meeting in February, taking investors aback. Additionally, it narrowed the interest
rate corridor relative to the key rate from 2.0% +/- to 1.75% +/- in order to further stabilize interest rates in the interbank
money market that have declined sharply over the last year or so. The market’s median forecast was for the Central Bank
to stay put on its monetary policy in view of the recent global financial markets turmoil and mounting fiscal slippage risks
in the run up to the upcoming parliamentary elections. The said decision is the first rate cut since October 2015, and
follows 750bps of monetary easing since May 2013, out of which, 350bps were delivered last year. Behind its decision,
the NBS cited subdued inflationary pressures primarily stemming from the international environment on the back of low
global oil prices, risks on eurozone’s economic growth outlook – Serbia’s main trade partner –, the prospect of a slower
than expected pace of Fed rate tightening, as well as the possibility for further ECB monetary accommodation in March.
Albeit we anticipate the NBS to hold its fire in the coming months, another 25bps cut cannot be ruled out entirely in view
of the Central Bank’s scaled back inflation expectations and ongoing weakness in global oil and primary commodity
prices.
Galatia Phoka ([email protected])
+30 210 371 8922
Ivan Radovic ([email protected])
+381 11 30 27 533
15
February 2016
Source: National Authorities, EC, IMF, Eurobank Research
FIGURE 25: Private consumption modestly recovers as wage growth
turns marginally positive (3MMA)
Source: National Authorities, EC, IMF, Eurobank Research
FIGURE 26: Inflation remains below NBS target for nearly two years
Source: National Authorities, Eurobank Research
FIGURE 27: Growth in industrial production remains robust (3MMA
YoY %)
Source: National Authorities, EC, IMF, Eurobank Research
FIGURE 28: NBS unexpectedly delivers a 25bps cut in the main policy
rate in February
Source: National Authorities, EC, IMF, Eurobank Research
2014 2015 2016 2017
Real GDP (yoy%) -1.8 0.7 1.8 2.2
Inflation (yoy%)
HICP (annual average) 2.1 1.5 2.8 3.9
HICP (end of period) 1.7 1.5 3.5 3.8
Fiscal Accounts (%GDP)
Consolidated Government Deficit -6.7 -3.7 -3.7 -3.5
Gross Public Debt 72.2 75.9 78.1 76.3
Labor Statistics (%)
Unemployment Rate (%of labor force) 19.4 17.7 17.7 17.0
Wage Growth (total economy) 2.0 0.0 0.0 0.0
External Accounts
Current Account (% GDP) -6.0 -4.7 -4.6 -4.3
Net FDI (EUR bn) 1.2 1.6 1.6 1.5
FDI / Current Account (%) 60.0 106.7 100.0 100.0
FX Reserves (EUR bn) 9.9 10.4 11.0 10.6
Domestic Credit 2012 2013 2014 2015
Total Credit (%GDP) 62.8 57.0 61.5 63.6
Credit to Enterprises (%GDP) 31.2 26.1 25.0 25.0
Credit to Households (%GDP) 18.2 17.4 18.7 19.6
Private Sector Credit (yoy%) 9.5 -4.8 0.5 3.2
Loans to Deposits (%) 126.9 114.1 111.8 112.6
Financial Markets Current 3M 6M 12M
Policy Rate 4.25 4.25 4.25 4.25
EUR/RSD 123.70 122.50 123.00 125.00
Serbia: Eurobank Forecasts
-15
-10
-5
0
5
10
Feb
-12
May
-12
Au
g-1
2
No
v-1
2
Feb
-13
May
-13
Au
g-1
3
No
v-1
3
Feb
-14
May
-14
Au
g-1
4
No
v-1
4
Feb
-15
May
-15
Au
g-1
5
No
v-1
5
Gross Wages (YoY%, real) 3MMA
Retail Trade (YoY%, real)
-5%
0%
5%
10%
15%
20%
Jan
-12
Ap
r-12
Jul-
12
Oct
-12
Jan
-13
Ap
r-13
Jul-
13
Oct
-13
Jan
-14
Ap
r-14
Jul-
14
Oct
-14
Jan
-15
Ap
r-15
Jul-
15
Oct
-15
Jan
-16
HICP Headline Inflation target
Food and non-alcoholic beverages Electricity, gas and other fuels
Inflation toleranceband
-25
-20
-15
-10
-5
0
5
10
15
20
Feb
-08
Jul-
08
De
c-0
8
May
-09
Oct
-09
Mar
-10
Au
g-1
0
Jan
-11
Jun
-11
No
v-1
1
Ap
r-1
2
Sep
-12
Feb
-13
Jul-
13
De
c-1
3
May
-14
Oct
-14
Mar
-15
Au
g-1
5
Jan
-16
2
4
6
8
10
12
14
16
18
20
Feb
-08
Jul-
08
De
c-0
8
May
-09
Oct
-09
Mar
-10
Au
g-1
0
Jan
-11
Jun
-11
No
v-1
1
Ap
r-1
2
Sep
-12
Feb
-13
Jul-
13
De
c-1
3
May
-14
Oct
-14
Mar
-15
Au
g-1
5
Jan
-16
