february 2016 hcmc central business district cbd monthly ...€¦ · february 2016 hcmc central...
TRANSCRIPT

Accelerating successwww.colliers.com/vietnam
FEBRUARY 2016HCMC CENTRAL BUSINESS DISTRICT
CBD MONTHLY MARKET REPORT

TABLE OF CONTENTSHCMC MARKET OVERVIEW
Office
Retail
Hotel
ServicedApartment
LIST OF FIGURES Figure1
Figure2
Figure3
Figure4
Figure5
Figure6
Figure7
Figure8
Figure9
Figure10
LIST OF TABLES Table1
Table2
Table3
Table4
Table5
Table6
COVER PAGE: Saigon skyline
Page
3-5
6-7
8-9
10-11
3
3
3
6
6
6
8
8
10
10
4
7
8
9
10
11
...........................................................................................................................
...........................................................................................................................
...........................................................................................................................
..............................................................................................................
Office, Market performance ................................................................................
Office, Average asking rent by grade.................................................................
Office, Occupacy rate by grade..........................................................................
Retail, Market performance ..............................................................................
Retail, Average asking rent by grade.................................................................
Retail, Occupacy rate by grade .........................................................................
Hotel, Market performance................................................................................
Hotel, Average room rate..................................................................................
Serviced apartment, Occupancy rate by grade..................................................
Serviced apartment, Average rental rate by grade.............................................
Significant office projects..................................................................................
Significant retail projects .................................................................................
Hotel, Future supply .........................................................................................
Significant hotel projects...................................................................................
Serviced apartment, Future Supply...................................................................
Significant serviced apartment projects ..........................................................
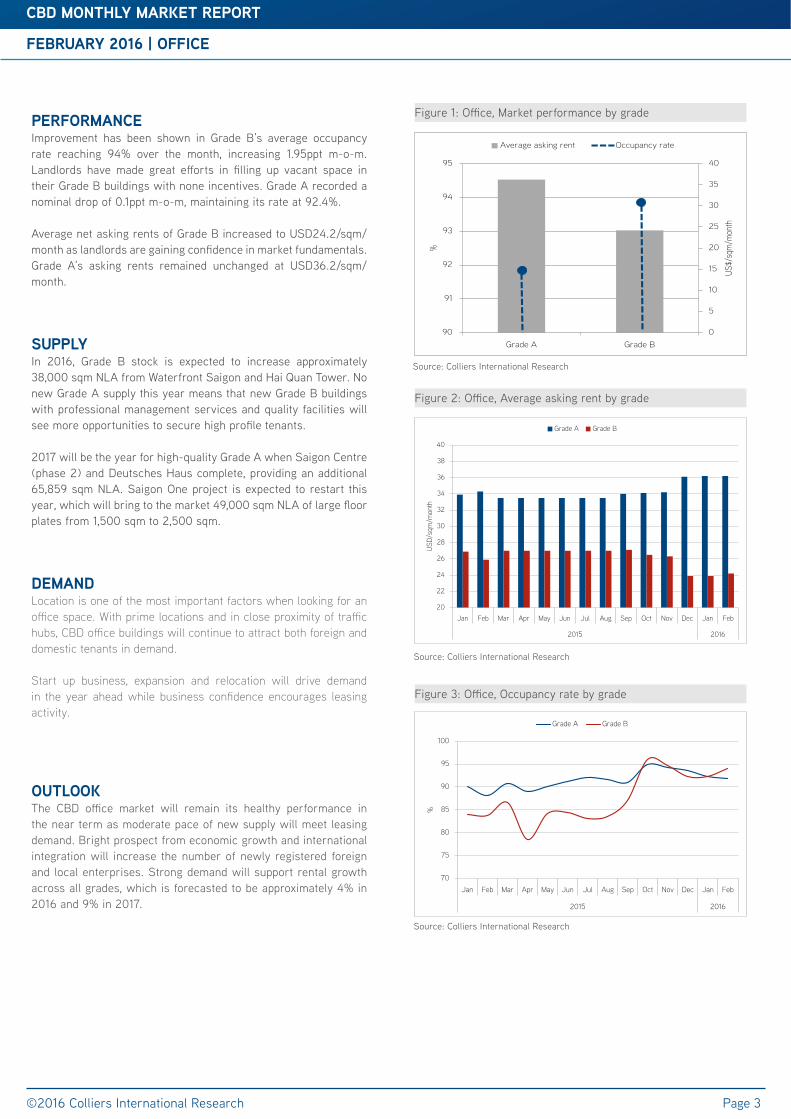
Figure 3: Office, Occupancy rate by grade
PERFORMANCEImprovement has been shown in Grade B’s average occupancy rate reaching 94% over the month, increasing 1.95ppt m-o-m. Landlords have made great efforts in filling up vacant space in their Grade B buildings with none incentives. Grade A recorded a nominal drop of 0.1ppt m-o-m, maintaining its rate at 92.4%.
Average net asking rents of Grade B increased to USD24.2/sqm/month as landlords are gaining confidence in market fundamentals. Grade A’s asking rents remained unchanged at USD36.2/sqm/month.
SUPPLYIn 2016, Grade B stock is expected to increase approximately 38,000 sqm NLA from Waterfront Saigon and Hai Quan Tower. No new Grade A supply this year means that new Grade B buildings with professional management services and quality facilities will see more opportunities to secure high profile tenants. 2017 will be the year for high-quality Grade A when Saigon Centre (phase 2) and Deutsches Haus complete, providing an additional 65,859 sqm NLA. Saigon One project is expected to restart this year, which will bring to the market 49,000 sqm NLA of large floor plates from 1,500 sqm to 2,500 sqm.
DEMANDLocation is one of the most important factors when looking for an office space. With prime locations and in close proximity of traffic hubs, CBD office buildings will continue to attract both foreign and domestic tenants in demand.
Start up business, expansion and relocation will drive demand in the year ahead while business confidence encourages leasing activity.
OUTLOOKThe CBD office market will remain its healthy performance in the near term as moderate pace of new supply will meet leasing demand. Bright prospect from economic growth and international integration will increase the number of newly registered foreign and local enterprises. Strong demand will support rental growth across all grades, which is forecasted to be approximately 4% in 2016 and 9% in 2017.
FEBRUARY 2016 | OFFICE
©2016 Colliers International Research
CBD MONTHLY MARKET REPORT
Page 3
Figure 1: Office, Market performance by grade
Source: Colliers International Research
Source: Colliers International Research
Source: Colliers International Research
Figure 2: Office, Average asking rent by grade
0
5
10
15
20
25
30
35
40
90
91
92
93
94
95
Grade A Grade B
US$/
sqm
/mon
th
%
Average asking rent Occupancy rate
70
75
80
85
90
95
100
Jan Feb Mar Apr May Jun Jul Aug Sep Oct Nov Dec Jan Feb
2015 2016
%
Grade A Grade B
20
22
24
26
28
30
32
34
36
38
40
Jan Feb Mar Apr May Jun Jul Aug Sep Oct Nov Dec Jan Feb
2015 2016
USD
/sqm
/mon
thGrade A Grade B
(*) US$/sqm/month (NLA)
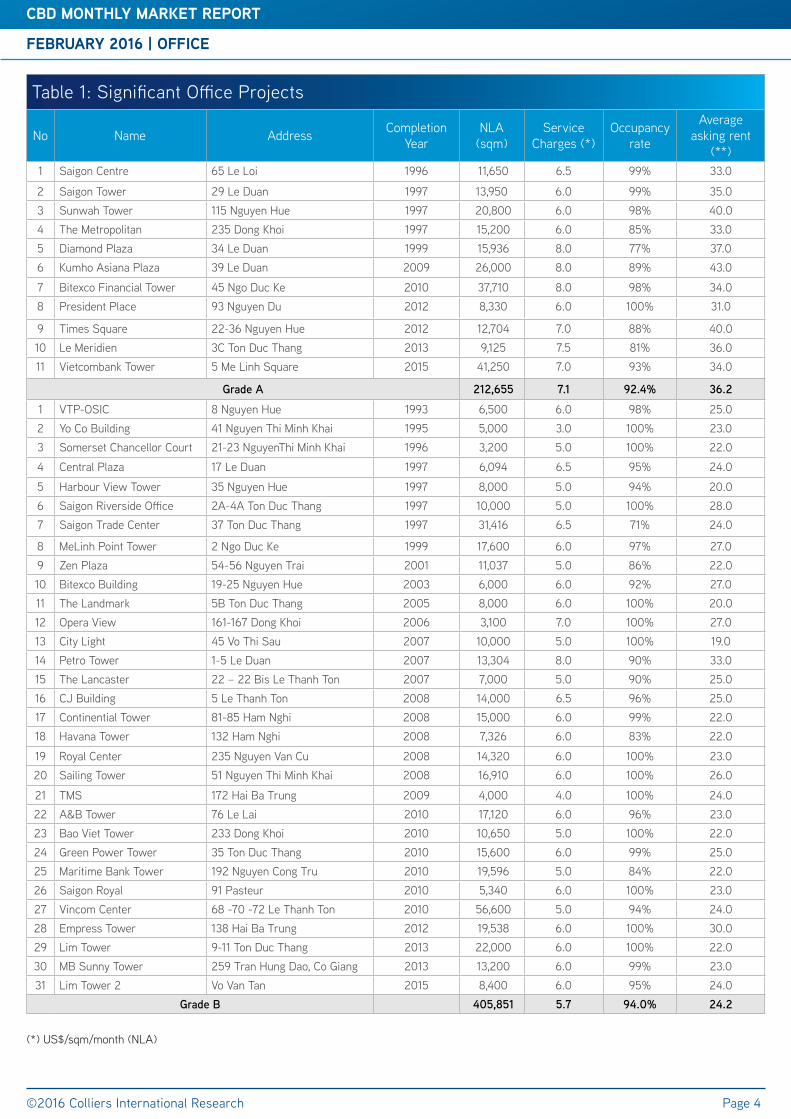
Table 1: Significant Office Projects
No Name Address Completion Year
NLA (sqm)
Service Charges (*)
Occupancy rate
Average asking rent
(**)1 Saigon Centre 65 Le Loi 1996 11,650 6.5 99% 33.0
2 Saigon Tower 29 Le Duan 1997 13,950 6.0 99% 35.03 Sunwah Tower 115 Nguyen Hue 1997 20,800 6.0 98% 40.04 The Metropolitan 235 Dong Khoi 1997 15,200 6.0 85% 33.05 Diamond Plaza 34 Le Duan 1999 15,936 8.0 77% 37.06 Kumho Asiana Plaza 39 Le Duan 2009 26,000 8.0 89% 43.0
7 Bitexco Financial Tower 45 Ngo Duc Ke 2010 37,710 8.0 98% 34.08 President Place 93 Nguyen Du 2012 8,330 6.0 100% 31.0
9 Times Square 22-36 Nguyen Hue 2012 12,704 7.0 88% 40.010 Le Meridien 3C Ton Duc Thang 2013 9,125 7.5 81% 36.011 Vietcombank Tower 5 Me Linh Square 2015 41,250 7.0 93% 34.0
GradeA 212,655 7.1 92.4% 36.2
1 VTP-OSIC 8 Nguyen Hue 1993 6,500 6.0 98% 25.02 Yo Co Building 41 Nguyen Thi Minh Khai 1995 5,000 3.0 100% 23.03 Somerset Chancellor Court 21-23 NguyenThi Minh Khai 1996 3,200 5.0 100% 22.0
4 Central Plaza 17 Le Duan 1997 6,094 6.5 95% 24.0
5 Harbour View Tower 35 Nguyen Hue 1997 8,000 5.0 94% 20.06 Saigon Riverside Office 2A-4A Ton Duc Thang 1997 10,000 5.0 100% 28.07 Saigon Trade Center 37 Ton Duc Thang 1997 31,416 6.5 71% 24.0
8 MeLinh Point Tower 2 Ngo Duc Ke 1999 17,600 6.0 97% 27.09 Zen Plaza 54-56 Nguyen Trai 2001 11,037 5.0 86% 22.010 Bitexco Building 19-25 Nguyen Hue 2003 6,000 6.0 92% 27.011 The Landmark 5B Ton Duc Thang 2005 8,000 6.0 100% 20.012 Opera View 161-167 Dong Khoi 2006 3,100 7.0 100% 27.013 City Light 45 Vo Thi Sau 2007 10,000 5.0 100% 19.014 Petro Tower 1-5 Le Duan 2007 13,304 8.0 90% 33.015 The Lancaster 22 – 22 Bis Le Thanh Ton 2007 7,000 5.0 90% 25.016 CJ Building 5 Le Thanh Ton 2008 14,000 6.5 96% 25.017 Continential Tower 81-85 Ham Nghi 2008 15,000 6.0 99% 22.018 Havana Tower 132 Ham Nghi 2008 7,326 6.0 83% 22.0
19 Royal Center 235 Nguyen Van Cu 2008 14,320 6.0 100% 23.020 Sailing Tower 51 Nguyen Thi Minh Khai 2008 16,910 6.0 100% 26.0
21 TMS 172 Hai Ba Trung 2009 4,000 4.0 100% 24.022 A&B Tower 76 Le Lai 2010 17,120 6.0 96% 23.023 Bao Viet Tower 233 Dong Khoi 2010 10,650 5.0 100% 22.024 Green Power Tower 35 Ton Duc Thang 2010 15,600 6.0 99% 25.025 Maritime Bank Tower 192 Nguyen Cong Tru 2010 19,596 5.0 84% 22.026 Saigon Royal 91 Pasteur 2010 5,340 6.0 100% 23.027 Vincom Center 68 -70 -72 Le Thanh Ton 2010 56,600 5.0 94% 24.028 Empress Tower 138 Hai Ba Trung 2012 19,538 6.0 100% 30.029 Lim Tower 9-11 Ton Duc Thang 2013 22,000 6.0 100% 22.030 MB Sunny Tower 259 Tran Hung Dao, Co Giang 2013 13,200 6.0 99% 23.031 Lim Tower 2 Vo Van Tan 2015 8,400 6.0 95% 24.0
GradeB 405,851 5.7 94.0% 24.2
FEBRUARY 2016 | OFFICE
©2016 Colliers International Research
CBD MONTHLY MARKET REPORT
Page 4

FEBRUARY 2016 | OFFICE
CBD MONTHLY MARKET REPORT
CBD HCMC GRADE A OFFICE BUILDINGS
©2016 Colliers International Research
SAIGON SKYLINE REVIEW
Page 5
KUMHO ASIANA PLAZA39 Le Duan, District 1
26,000/1,402$ 40.00$ 8.00
DIAMOND PLAZA SAIGON34 Le Duan, District 1
15,936/2,200$ 37.00$ 8.00
LE MERIDIEN 3C Ton Duc Thang, District 1
9,125/NA$ 36.00$ 7.50
SAIGON TOWER29 Le Duan, District 1
13,950/NA$ 35.00$ 6.00
DEUTSCHES HAUS3-5 Le Van Huu, District 1
THE METROPOLITAN235 Dong Khoi, District 1
15,200/1,000$ 33.00$ 6.00
PRESIDENT PLACE93 Nguyen Du, District 1
8,330/1,000$ 31.00$ 6.00
BITEXCO FINANCIAL TOWER45 Ngo Duc Ke, District 1
37,710/900-1,300$ 34.00$ 8.00
VIETCOMBANK TOWER5 Me Linh Square, District 1
41,250/NA$ 34.00$ 7.00
TIMES SQUARE SAIGON22-36 Nguyen Hue, District 1
12,704/1,450$ 40.00$ 7.00
SAIGON CENTRE65 Le Loi, District 1
11,650/ 1,073$ 33.00$ 6.50
SUNWAH TOWER115 Nguyen Hue, District 1
20,800/ 1,166$ 40.00$ 6.00
FEBRUARY 2016 | RETAIL
©2016 Colliers International Research
CBD MONTHLY MARKET REPORT
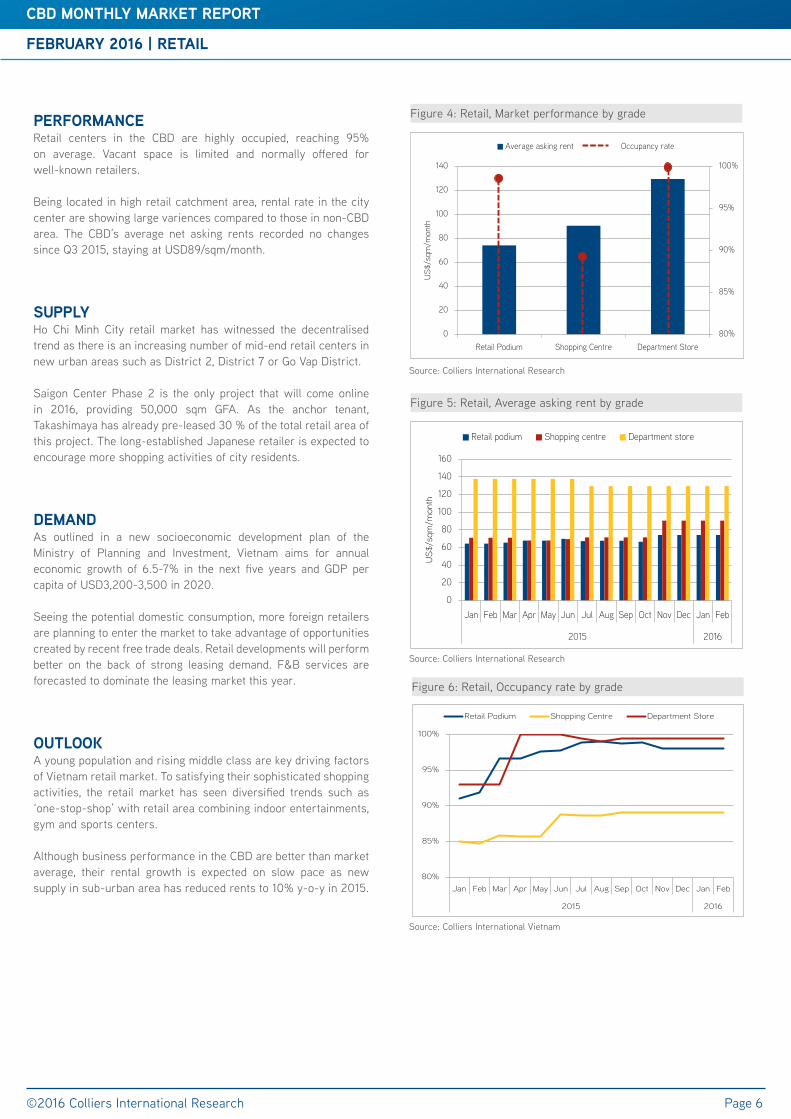
PERFORMANCERetail centers in the CBD are highly occupied, reaching 95% on average. Vacant space is limited and normally offered for well-known retailers. Being located in high retail catchment area, rental rate in the city center are showing large variences compared to those in non-CBD area. The CBD’s average net asking rents recorded no changes since Q3 2015, staying at USD89/sqm/month.
SUPPLYHo Chi Minh City retail market has witnessed the decentralised trend as there is an increasing number of mid-end retail centers in new urban areas such as District 2, District 7 or Go Vap District. Saigon Center Phase 2 is the only project that will come online in 2016, providing 50,000 sqm GFA. As the anchor tenant, Takashimaya has already pre-leased 30 % of the total retail area of this project. The long-established Japanese retailer is expected to encourage more shopping activities of city residents.
DEMANDAs outlined in a new socioeconomic development plan of the Ministry of Planning and Investment, Vietnam aims for annual economic growth of 6.5-7% in the next five years and GDP per capita of USD3,200-3,500 in 2020. Seeing the potential domestic consumption, more foreign retailers are planning to enter the market to take advantage of opportunities created by recent free trade deals. Retail developments will perform better on the back of strong leasing demand. F&B services are forecasted to dominate the leasing market this year.
OUTLOOKA young population and rising middle class are key driving factors of Vietnam retail market. To satisfying their sophisticated shopping activities, the retail market has seen diversified trends such as ‘one-stop-shop’ with retail area combining indoor entertainments, gym and sports centers. Although business performance in the CBD are better than market average, their rental growth is expected on slow pace as new supply in sub-urban area has reduced rents to 10% y-o-y in 2015.
Page 6
Source: Colliers International Research
Source: Colliers International Research
Figure 5: Retail, Average asking rent by grade
Figure 4: Retail, Market performance by grade
Figure 6: Retail, Occupancy rate by grade
Source: Colliers International Vietnam
0
20
40
60
80
100
120
140
160
Jan Feb Mar Apr May Jun Jul Aug Sep Oct Nov Dec Jan Feb
2015 2016
US
$/sq
m/m
onth
Retail podium Shopping centre Department store
80%
85%
90%
95%
100%
Jan Feb Mar Apr May Jun Jul Aug Sep Oct Nov Dec Jan Feb
2015 2016
Retail Podium Shopping Centre Department Store
80%
85%
90%
95%
100%
0
20
40
60
80
100
120
140
Retail Podium Shopping Centre Department Store
US
$/sq
m/m
onth
Average asking rent Occupancy rate

Table 2: Significant Retail Projects
No NameofProject/Building Address Location Completion
YearNLA(sqm) ARR(*) OccupancyRate
1 Saigon Center Le Loi District 1 1996 Renovation Renovation Renovation2 Times Square 22-36 Nguyen Hue District 1 2013 9,000 90 100.0%3 Caravelle Hotel 19 Lam Son Square District 1 2000 150 220 100.0%4 Continental Saigon 132-134 Dong Khoi District 1 2000 200 90 100.0%5 New World Hotel 76 Le Lai Street District 1 2000 1,000 60 100.0%6 Zen Plaza 54-56 Nguyen Trai District 1 2001 6,817 50 94.0%7 Sheraton Saigon 88 Dong Khoi District 1 2002 750 200 69.0%8 Opera View Lam Son Square District 1 2006 1,260 85 100.0%9 Kumho Asiana 35 Le Duan District 1 2009 6,830 75 100.0%10 Rex Arcade 141 Nguyen Hue District 1 2010 2,000 120 100.0%11 ICON 68 45 Ngo Duc Ke District 1 2011 8,000 50 99.0%12 President Place 93 Nguyen Du District 1 2012 800 70 100.0%
RetailPodium 36,807 74.1 98.0%
1 City Plaza 230 Nguyen Trai District 1 2000 5,250 25 100.0%2 Parkson Saigontourist 35 Le Thanh Ton Street District 1 2002 17,000 90 99.0%3 Nowzone Nguyen Van Cu Street District 1 2008 9,000 55 100.0%4 Vincom Center B 72 Le Thanh Ton District 1 2010 45,000 120 99.0%5 Union Square 171 Dong Khoi District 1 2012 38,000 73 65.0%6 Diamond Plaza 34 Le Duan District 1 1999 9,000 90 100.0%
ShoppingCentre 123,250 90.4 88.7%
1 Saigon Square 1 77 - 89 Nam Ky Khoi Nghia District 1 2006 1,300 77 100.0%2 Taka Plaza 102 Nam Ky Khoi Nghia District 1 2011 1,000 167 100.0%3 Lucky Plaza 38 Nguyen Hue District 1 2013 1,000 160 98.0%
DepartmentStore 3,300 129.4 99.4%
FEBRUARY 2016 | RETAIL
©2016 Colliers International Research
CBD MONTHLY MARKET REPORT
Page 7
(*) ARR (Average Rental Rate): All rents are stated in net rents per sqm, inclusive service charge but exculding VAT
FEBRUARY 2016 | HOTEL
©2016 Colliers International Research
CBD MONTHLY MARKET REPORT
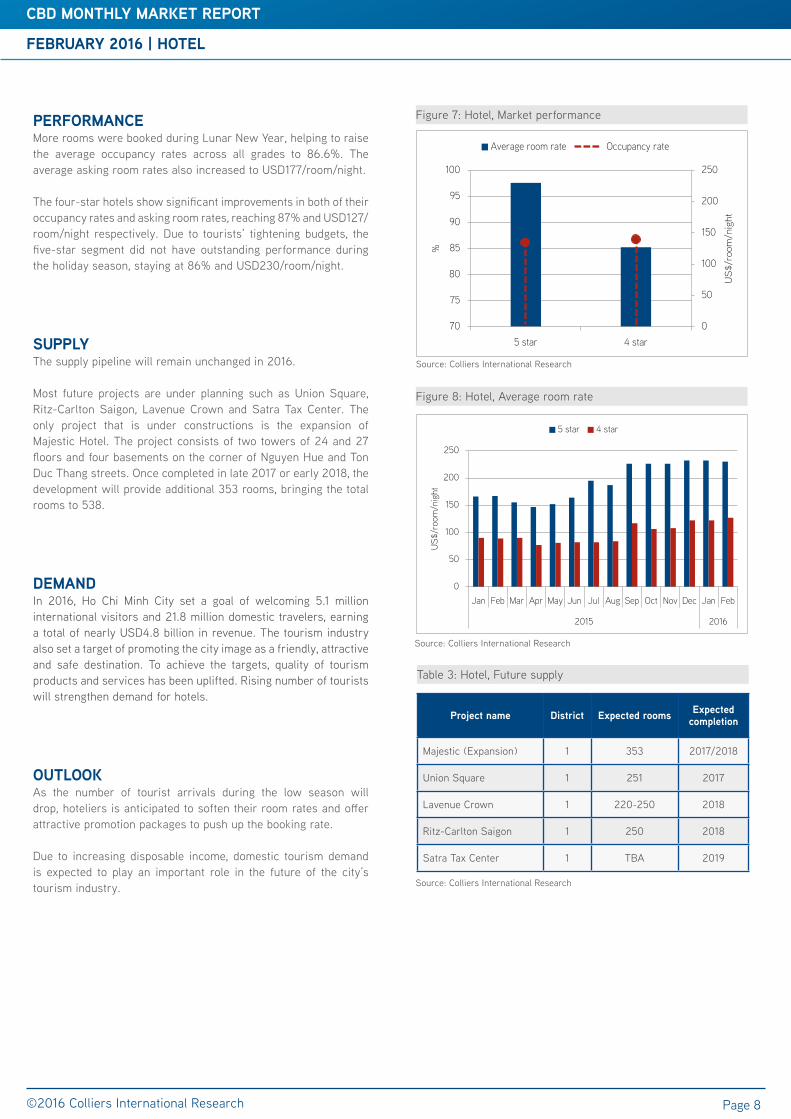
PERFORMANCEMore rooms were booked during Lunar New Year, helping to raise the average occupancy rates across all grades to 86.6%. The average asking room rates also increased to USD177/room/night. The four-star hotels show significant improvements in both of their occupancy rates and asking room rates, reaching 87% and USD127/room/night respectively. Due to tourists’ tightening budgets, the five-star segment did not have outstanding performance during the holiday season, staying at 86% and USD230/room/night.
SUPPLYThe supply pipeline will remain unchanged in 2016.
Most future projects are under planning such as Union Square, Ritz-Carlton Saigon, Lavenue Crown and Satra Tax Center. The only project that is under constructions is the expansion of Majestic Hotel. The project consists of two towers of 24 and 27 floors and four basements on the corner of Nguyen Hue and Ton Duc Thang streets. Once completed in late 2017 or early 2018, the development will provide additional 353 rooms, bringing the total rooms to 538.
DEMANDIn 2016, Ho Chi Minh City set a goal of welcoming 5.1 million international visitors and 21.8 million domestic travelers, earning a total of nearly USD4.8 billion in revenue. The tourism industry also set a target of promoting the city image as a friendly, attractive and safe destination. To achieve the targets, quality of tourism products and services has been uplifted. Rising number of tourists will strengthen demand for hotels.
OUTLOOKAs the number of tourist arrivals during the low season will drop, hoteliers is anticipated to soften their room rates and offer attractive promotion packages to push up the booking rate. Due to increasing disposable income, domestic tourism demand is expected to play an important role in the future of the city’s tourism industry.
Page 8
Source: Colliers International Research
Source: Colliers International Research
Source: Colliers International Research
Figure 8: Hotel, Average room rate
Table 3: Hotel, Future supply
Figure 7: Hotel, Market performance
0
50
100
150
200
250
Jan Feb Mar Apr May Jun Jul Aug Sep Oct Nov Dec Jan Feb
2015 2016
US$
/roo
m/n
ight
5 star 4 star
Project name District Expected rooms Expectedcompletion
Majestic (Expansion) 1 353 2017/2018
Union Square 1 251 2017
Lavenue Crown 1 220-250 2018
Ritz-Carlton Saigon 1 250 2018
Satra Tax Center 1 TBA 2019
0
50
100
150
200
250
70
75
80
85
90
95
100
5 star 4 star
US
$/ro
om/n
ight
%
Average room rate Occupancy rate
FEBRUARY 2016 | HOTEL
CBD MONTHLY MARKET REPORT
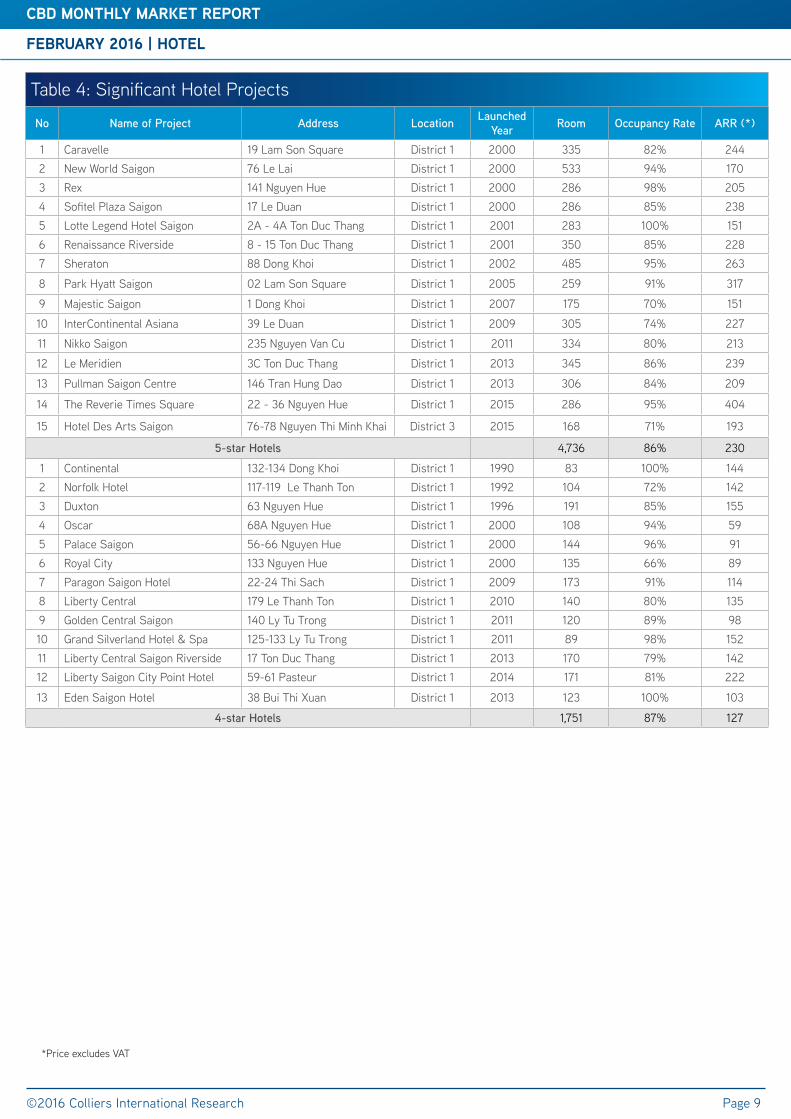
Table 4: Significant Hotel Projects
No NameofProject Address Location LaunchedYear Room OccupancyRate ARR(*)
1 Caravelle 19 Lam Son Square District 1 2000 335 82% 2442 New World Saigon 76 Le Lai District 1 2000 533 94% 1703 Rex 141 Nguyen Hue District 1 2000 286 98% 2054 Sofitel Plaza Saigon 17 Le Duan District 1 2000 286 85% 2385 Lotte Legend Hotel Saigon 2A - 4A Ton Duc Thang District 1 2001 283 100% 1516 Renaissance Riverside 8 - 15 Ton Duc Thang District 1 2001 350 85% 2287 Sheraton 88 Dong Khoi District 1 2002 485 95% 263
8 Park Hyatt Saigon 02 Lam Son Square District 1 2005 259 91% 317
9 Majestic Saigon 1 Dong Khoi District 1 2007 175 70% 151
10 InterContinental Asiana 39 Le Duan District 1 2009 305 74% 227
11 Nikko Saigon 235 Nguyen Van Cu District 1 2011 334 80% 213
12 Le Meridien 3C Ton Duc Thang District 1 2013 345 86% 239
13 Pullman Saigon Centre 146 Tran Hung Dao District 1 2013 306 84% 209
14 The Reverie Times Square 22 - 36 Nguyen Hue District 1 2015 286 95% 404
15 Hotel Des Arts Saigon 76-78 Nguyen Thi Minh Khai District 3 2015 168 71% 193
5-starHotels 4,736 86% 230
1 Continental 132-134 Dong Khoi District 1 1990 83 100% 1442 Norfolk Hotel 117-119 Le Thanh Ton District 1 1992 104 72% 1423 Duxton 63 Nguyen Hue District 1 1996 191 85% 1554 Oscar 68A Nguyen Hue District 1 2000 108 94% 595 Palace Saigon 56-66 Nguyen Hue District 1 2000 144 96% 916 Royal City 133 Nguyen Hue District 1 2000 135 66% 897 Paragon Saigon Hotel 22-24 Thi Sach District 1 2009 173 91% 1148 Liberty Central 179 Le Thanh Ton District 1 2010 140 80% 1359 Golden Central Saigon 140 Ly Tu Trong District 1 2011 120 89% 9810 Grand Silverland Hotel & Spa 125-133 Ly Tu Trong District 1 2011 89 98% 15211 Liberty Central Saigon Riverside 17 Ton Duc Thang District 1 2013 170 79% 14212 Liberty Saigon City Point Hotel 59-61 Pasteur District 1 2014 171 81% 222
13 Eden Saigon Hotel 38 Bui Thi Xuan District 1 2013 123 100% 103
4-starHotels 1,751 87% 127
FEBRUARY 2016 | HOTEL
©2016 Colliers International Research
CBD MONTHLY MARKET REPORT
Page 9
*Price excludes VAT
CBD MONTHLY MARKET REPORT
FEBRUARY 2016 | SERVICED APARTMENT
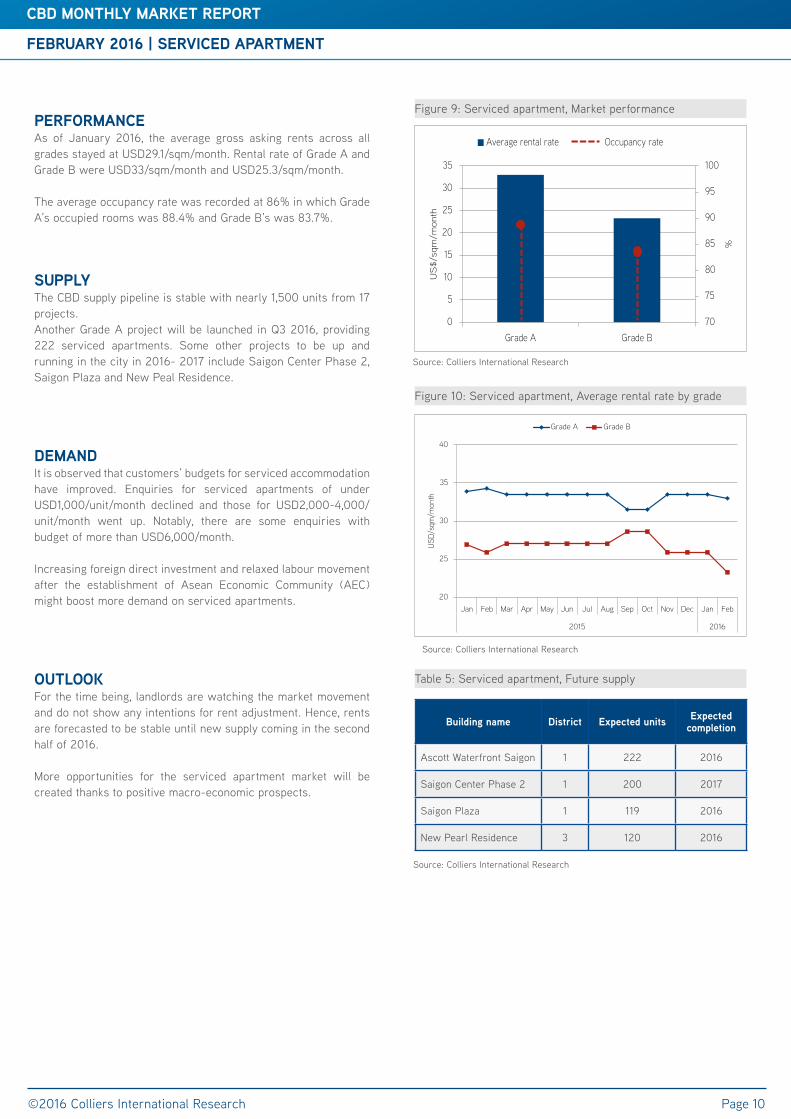
PERFORMANCEAs of January 2016, the average gross asking rents across all grades stayed at USD29.1/sqm/month. Rental rate of Grade A and Grade B were USD33/sqm/month and USD25.3/sqm/month.
The average occupancy rate was recorded at 86% in which Grade A’s occupied rooms was 88.4% and Grade B’s was 83.7%.
SUPPLYThe CBD supply pipeline is stable with nearly 1,500 units from 17 projects. Another Grade A project will be launched in Q3 2016, providing 222 serviced apartments. Some other projects to be up and running in the city in 2016- 2017 include Saigon Center Phase 2, Saigon Plaza and New Peal Residence.
DEMANDIt is observed that customers’ budgets for serviced accommodation have improved. Enquiries for serviced apartments of under USD1,000/unit/month declined and those for USD2,000-4,000/unit/month went up. Notably, there are some enquiries with budget of more than USD6,000/month.
Increasing foreign direct investment and relaxed labour movement after the establishment of Asean Economic Community (AEC) might boost more demand on serviced apartments.
OUTLOOKFor the time being, landlords are watching the market movement and do not show any intentions for rent adjustment. Hence, rents are forecasted to be stable until new supply coming in the second half of 2016.
More opportunities for the serviced apartment market will be created thanks to positive macro-economic prospects.
©2016 Colliers International Research Page 10
Source: Colliers International Research
Source: Colliers International Research
Source: Colliers International Research
Figure 10: Serviced apartment, Average rental rate by grade
Table 5: Serviced apartment, Future supply
Figure 9: Serviced apartment, Market performance
20
25
30
35
40
Jan Feb Mar Apr May Jun Jul Aug Sep Oct Nov Dec Jan Feb
2015 2016
USD
/sqm
/mon
thGrade A Grade B
Building name District Expected units Expectedcompletion
Ascott Waterfront Saigon 1 222 2016
Saigon Center Phase 2 1 200 2017
Saigon Plaza 1 119 2016
New Pearl Residence 3 120 2016
70
75
80
85
90
95
100
0
5
10
15
20
25
30
35
Grade A Grade B
%
US
$/sq
m/m
onth
Average rental rate Occupancy rate

CBD MONTHLY MARKET REPORT
FEBRUARY 2016 | SERVICED APARTMENT
Table 6: Significant Serviced Apartment Projects
No. ProjectName Address Location CompletionYear
TotalRoom
AverageOccupancy
ARR(*)(**)
1 The Landmark 5B Ton Duc Thang District 1 1995 66 90.0% 262 Sedona Suites 65 Le Loi District 1 1996 89 82.0% 30
3 Somerset Chancellor Court 21-23 Nguyen Thi Minh Khai District 1 1996 172 90.0% 32
4 Nguyen Du Park Villas 111 Nguyen Du District 1 2004 41 98.0% 305 The Lancaster 22-22 Bis Le Thanh Ton District 1 2007 55 73.0% 376 Intercontinental Asian Saigon 39 Le Duan District 1 2009 260 91.0% 36
GradeA 683 88.4% 33.0
1 Norfork Mansion 17-21 Ly Tu Trong District 1 1998 126 85.0% 262 Saigon Sky Garden 20 Le Thanh Ton District 1 1998 154 85.0% 263 Somerset HCM 8A Nguyen Binh Khiem District 1 1998 165 86.0% 234 Diamond Plaza 34 Le Duan District 1 1999 42 86.0% 295 Garden View Court 101 Nguyen Du District 1 2000 76 91.0% 316 Ben Thanh Luxury 172-174 Ky Con District 1 2010 88 91.0% 18
7 Lafayette De SaiGon 8 Phung Khac Khoan District 1 2010 18 95.0% 28
8 Vincom Center 45A Ly Tu Trong District 1 2010 60 34.0% 26
9 Nikko Saigon 235 Nguyen Van Cu District 1 2011 54 100.0% 30
10 Saigon City Residence 8A/3D2 Thai Van Lung District 1 2011 17 84.0% 23
11 Spring Court 1Bis Phung Khac Khoan District 1 2011 14 76.0% 23
GradeB 814 83.7% 25.3
FEBRUARY 2016 | SERVICED APARTMENT
©2016 Colliers International Research
CBD MONTHLY MARKET REPORT
Page 11
(*) US/sqm/month(**) ARR (Average Rental Rate): All rents are stated in gross rents per sqm, not including VAT and serviced charge

COLLIERSINTERNATIONAL|VIETNAM
HO CHI MINH CITYBitexco Office Building, 7th Floor19-25 Nguyen Hue StreetDistrict 1, HCM City, VietnamTel: + 84 8 3827 5665
HANOIPress Club Building, 4th Floor59A Ly Thai To Street, Hoan Kiem District, Hanoi, VietnamTel: +84 8 3827 5665
502officesin67countrieson6continents
DAVIDJACKSONGeneral Director
+84 8 3827 5665
AboutColliersInternationalColliers International is a leader in global real estate services, defined by our spirit of enterprise.
Through a culture of service excellence and a shared sense of initiative, we integrate the resources of real estate specialists worldwide to accelerate the success of our partners.We connect through a shared set of values that shape a collaborative environment throughout our organization that is unsurpassed in the industry.
With more than 100 professionals in 2 offices in Vietnam, the team is market driven and has proven and successful track record with both international and local experience.
From Hanoi to Ho Chi Minh City, we provide a full range of real estate services
The foundation of our services is the strength and depth of our experience.
$2.30billion in annual revenue
1.7billion square feet under management
16,300professionalsand staff
This document has been prepared by Colliers International for advertising and general information only. Colliers International makes no guarantees, represen-tations or warranties of any kind, expressed or implied, regarding the information including, but not limited to, warranties of content, accuracy and reliability. Any interested party should undertake their own inquiries as to the accuracy of the information. Colliers International excludes unequivocally all inferred or implied terms, conditions and warranties arising out of this document and excludes all liability for loss and damages arising there from. This publication is the copyrighted property of Colliers International and/or its licensor(s). ©2016. All rights reserved.
For further information, please contact us:
©2016 Colliers International Research www.colliers.com/vietnam
HAVOSenior Research Analyst
+84 8 3827 5665
Publication Coverage Frequency Content Availability
Knowledge Report/Market Insights
Vietnam Cities Quarterly All market sectors Publicly available
Investment report Vietnam Quarterly Economic updates and Investment highlights
Publicly available
CBD Report HCMC CBD Monthly Office, Retail, Hotel and Serviced Apartment
Publicly available
Residential launch update
HCMC Monthly Residential Publicly available
Asia Pacific Office Report
Asia Pacificincluding Vietnam
Quarterly Office market Publicly available
Vietnam Property Market Report
Vietnam cities Quarterly All market sectors On subscription
Development Recommendation
Vietnam cities At request All market sectors On subscription