february 2018 | restaurants, hospitality & leisurerss.hsyndicate.com/file/152008351.pdfq4 2017...
TRANSCRIPT
F E B R U A RY 2018 | R E S TA U R A NT S, H O S P ITA L IT Y & L E I S U R E
Q4 2017 Hotel Bulletin: weaker demand metrics but 2017 transaction volumes nearly double 2016 total
In Q4 2017, occupancy levels either declined or remained flat in all 12 cities we reviewed, with the majority of cities also recording flat or declining RevPAR. Transaction values, on the other hand, recorded another stellar quarter with overall 2017 levels almost double those in 2016. In this edition’s focus, we reflect on performance in the UK hotel market over the last five years.
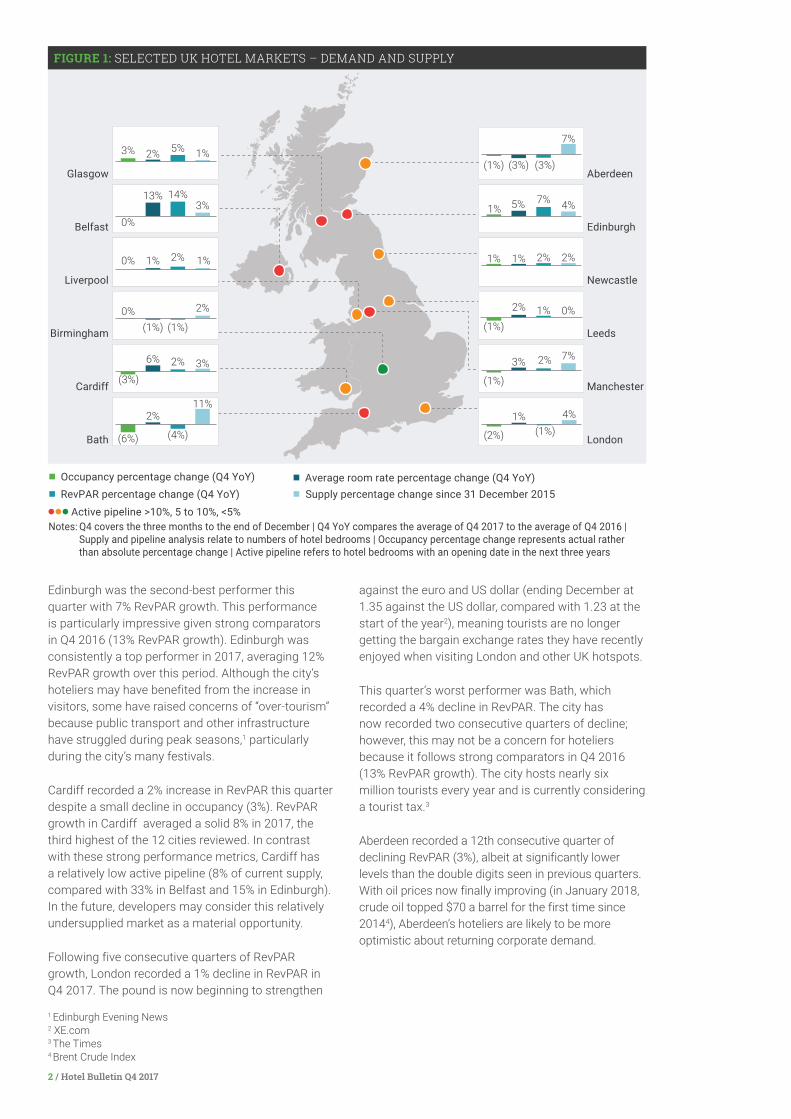
D E M A N DSTR’s Q4 2017 demand data shows another quarter of soft RevPAR growth compared with 2016, suggesting that the UK hotel sector is approaching the top of the market. Belfast recorded double-digit RevPAR growth, but was the only city to do so. Meanwhile, four of the 12 cities recorded declining RevPAR, half of the cities recorded declining occupancy levels, and the other half only saw very limited growth. It is worth noting that, for cities like Birmingham and Bath, these statistics follow a strong performance in the same quarter in the previous year.
Top performer Belfast recorded its sixth consecutive quarter of RevPAR growth (14%). The Northern Ireland capital has been in the top three cities for growth every quarter this year. The relatively small market (fewer than 4,000 bedrooms) has benefited from a weaker pound, which boosted visitor numbers along with significant investment in the city’s tourism industry. So far, there have been limited increases in supply to match demand growth, but with a current active pipeline of 33% of current supply, double-digit RevPAR growth may not continue in the medium-to-long term.
2 / Hotel Bulletin Q4 2017
Edinburgh was the second-best performer this quarter with 7% RevPAR growth. This performance is particularly impressive given strong comparators in Q4 2016 (13% RevPAR growth). Edinburgh was consistently a top performer in 2017, averaging 12% RevPAR growth over this period. Although the city’s hoteliers may have benefited from the increase in visitors, some have raised concerns of “over-tourism” because public transport and other infrastructure have struggled during peak seasons,1 particularly during the city’s many festivals.
Cardiff recorded a 2% increase in RevPAR this quarter despite a small decline in occupancy (3%). RevPAR growth in Cardiff averaged a solid 8% in 2017, the third highest of the 12 cities reviewed. In contrast with these strong performance metrics, Cardiff has a relatively low active pipeline (8% of current supply, compared with 33% in Belfast and 15% in Edinburgh). In the future, developers may consider this relatively undersupplied market as a material opportunity.
Following five consecutive quarters of RevPAR growth, London recorded a 1% decline in RevPAR in Q4 2017. The pound is now beginning to strengthen
against the euro and US dollar (ending December at 1.35 against the US dollar, compared with 1.23 at the start of the year2), meaning tourists are no longer getting the bargain exchange rates they have recently enjoyed when visiting London and other UK hotspots.
This quarter’s worst performer was Bath, which recorded a 4% decline in RevPAR. The city has now recorded two consecutive quarters of decline; however, this may not be a concern for hoteliers because it follows strong comparators in Q4 2016 (13% RevPAR growth). The city hosts nearly six million tourists every year and is currently considering a tourist tax.3
Aberdeen recorded a 12th consecutive quarter of declining RevPAR (3%), albeit at significantly lower levels than the double digits seen in previous quarters. With oil prices now finally improving (in January 2018, crude oil topped $70 a barrel for the first time since 20144), Aberdeen’s hoteliers are likely to be more optimistic about returning corporate demand.
Notes: Q4 covers the three months to the end of December | Q4 YoY compares the average of Q4 2017 to the average of Q4 2016 | Supply and pipeline analysis relate to numbers of hotel bedrooms | Occupancy percentage change represents actual rather than absolute percentage change | Active pipeline refers to hotel bedrooms with an opening date in the next three years
Occupancy percentage change (Q4 YoY)
Active pipeline >10%, 5 to 10%, <5%
RevPAR percentage change (Q4 YoY) Supply percentage change since 31 December 2015Average room rate percentage change (Q4 YoY)
0%
13% 14%3%
0%(1%) (1%)
2%
(1%) (3%) (3%)
7%
1% 5% 7% 4%
1% 1% 2% 2%
(1%)
2% 1% 0%
(2%)
1%(1%)
4%
(1%)
2%3% 7%
0% 1% 2% 1%
(6%)
2%
(4%)
11%
(3%)
2%6% 3%
3% 2% 5% 1%
LondonBath
Birmingham
Cardiff
Belfast
Liverpool
Manchester
Leeds
Newcastle
Edinburgh
AberdeenGlasgow
FIGURE 1: SELECTED UK HOTEL MARKETS – DEMAND AND SUPPLY
1 Edinburgh Evening News2 XE.com3 The Times4 Brent Crude Index

3 / Hotel Bulletin Q4 2017
S U P P LY A N D D E M A N DFigure 2 compares the proportion of current supply (inner circle) and active pipeline (outer circle) in the UK market by sector. Q4 2017 was another relatively slow quarter for openings, with fewer than 3,000 new bedrooms coming onto the market. Development activity remains strong, particularly in the budget and four-star sectors, which together make up over two-thirds of the total pipeline.
There were a number of notable five-star hotel openings and developments announced in Q4 2017, and five-star openings are set to continue this year with Kettner’s Townhouse and L’Oscar due to open this quarter in central London.
Notable Q4 2017 openings and new developments include:
• MGallery by Sofitel opened the 86-bedroom Victory House, London Leicester Square at the end of 2017. The property is located on Leicester Square in the former Victory House offices. The hotel is owned by Criterion Capital and will be managed by Bespoke Hotels.
• The City of Westminster Council has approved plans to develop a five-star hotel in Cambridge House at 94 Piccadilly, London.
• Marriott International opened its third Moxy-branded UK hotel with the 294-bedroom Moxy London Stratford. Moxy currently has a further 12 projects with almost 2,500 bedrooms in the UK development pipeline.
T R A N S A CT I O N STransaction values in Q4 2017 totalled £1.3 billion, of which £0.9 billion related to portfolio transactions (the highest since Q4 2015). This total does not include the Luxury Family Hotels transaction, the value of which was undisclosed.
2017 transaction values totalled £4.6 billion, nearly double that of the previous year as investors rush to clear out their portfolios before Brexit is enacted. Transaction levels have now returned to levels similar to those in 2014 (£4.4 billion) and 2015 (£5.3 billion). It remains to be seen whether 2018 transactions will remain at these levels or drop back down to that of 2016.
Notable transactions in Q4 2017 include:
• Pandox Hotels, a Swedish hotel investor, and Leonardo Hotels, the European division of Israel-based Fattal Hotels Group, have entered into agreement with Lone Star to acquire 36 Jurys Inn hotels and the Hilton Garden Inn Heathrow for £800 million.
• Patron Capital has sold the family-oriented brand Luxury Family Hotels to the management team and its backers for an undisclosed sum.
• Aprirose acquired the Hilton Reading for £28 million from M&G Real Estate. This adds to several other acquisitions Aprirose made this year. The investor also acquired the QHotels portfolio for £525 million, the Mercure Bristol Holland House & Spa for £45 million, and the Hampton by Hilton in London Docklands for £34 million.
5 star
Active pipeline (%)Current supply (%)
Apartments Budget 3 star
4 star
Source: AM:PMNote: Active pipeline includes developments with a confirmed opening date in the next three years; the budget category includes hostels, budget, and two star hotels
FIGURE 2: UK CURRENT BEDROOM SUPPLY (INNER CIRCLE) AND ACTIVE PIPELINE (OUTER CIRCLE) BY GRADING
(%)
3
33
29
31
5
7
33
18
34
8
Portfolio 2016 Single asset 2016Portfolio 2017 Single asset 2017
Source: HVSNote: Only disclosed hotel transactions over £6 million included in this analysis
FIGURE 3: UK TRANSACTION VALUE
(£BN)
0
1.0
2.0
3.0
4.0
5.0
TotalQ1 Q2 Q3 Q4

4 / Hotel Bulletin Q4 2017
I N F O C U SThe beginning of 2018 gives us an opportunity not only to examine all four quarters of 2017, but also to reflect on trends over the last five years and look forward over the next year.
Figure 4 shows the moving monthly annual average trend of RevPAR growth over the past five years. RevPAR has grown steadily throughout the period, with London hotels showing more promise in 2017 and the UK Regional hotel market showing the dramatic effect that Aberdeen hotels have had on overall RevPAR since January 2015. Hopefully, we’ve seen the worst of this, and hotels in the Granite City will enjoy a resurgence of business in 2018 now that oil prices have shown some signs of growth.
Figure 5 shows five-year trends for London hotels in absolute terms, with annual occupancy fluctuating by very little around 82%; average room rates rising from £136 to £149; and RevPAR growing from £113 to £122. This 9% growth kept pace with inflation (9%5), and includes a healthy growth in new London hotels’ supply during the period. This coming year we expect little change in London hotels’ occupancy, with average room rates (and thereby RevPAR) growing by up to 5%.6
Regional UK hotels performed well during the last five years, with occupancy growing from 75% to 77% and average room rates climbing from £67 to £78 (See figure 6). RevPAR growth from £50 to £61 (21%) clearly outpaced inflation (9%). Stripping out Aberdeen, RevPAR grew by a hugely impressive 31% in the period, thereby emphasising the reason why the UK provinces have become increasingly more attractive to hotel investors in recent years. In 2018, we expect little change in Regional UK hotels’ occupancy too, with average room rates (and thereby RevPAR) growing by up to 3%.7
Looking back over five years of UK hotel transactions (figure 7) shows us that the improving performance of hotels between 2013 and 2015 was matched by a healthy growth in the volume of hotel transactions from £2.6 billion to £5.3 billion. Then in 2016 came the announcement of the EU withdrawal referendum followed by the vote itself on 23 June—and the volume of hotel transactions promptly dropped by more than half to £2.4 billion as investors fathomed the potential impact of Brexit. Clearly, by 2017 we had picked ourselves up, dusted ourselves off, realised that life will carry on and started buying hotels again, with a volume of £4.6 billion just beating that in 2014.
As we write this Bulletin in early February, it is clear that this enthusiasm for acquiring UK hotels is continuing and we should look forward to reporting an even healthier 2018, maybe even exceeding the total values seen in 2015.
Source: STR
FIGURE 4: ROLLING MONTHLY REVPAR GROWTH
(%)
-4-202468
1012
Jan-13 Jan-14 Jan-15 Jan-16 Jan-17
London Regions Regions ex Aberdeen
FIGURE 5: LONDON DEMAND
Source: STR
70%72%74%76%78%80%82%84%
50 60 70 80 90
100 110 120 130 140 150
2013 2014 2015 2016 2017
Rates RevPAR Occupancy
FIGURE 6: UK REGIONS DEMAND
Source: STROccupancyRates RevPAR
70%
72%
74%
76%
78%
80%
50 55 60 65 70 75 80
2013 2014 2015 2016 2017
Portfolio Single assetSource: HVS
FIGURE 7: UK TRANSACTIONS
0
1
2
3
4
5
6
2013 2014 2015 2016 2017
(£BN)
Source for all data is STR unless otherwise specified.5 Office of National Statistics6 HVS7 HVS

5 / Hotel Bulletin Q4 2017
FIGURE 8: GLASGOW
(%)
-
-30
1530
-15
Q1 2017 Q2 2017 Q3 2017 Q4 2017
FIGURE 14: ABERDEEN
(%)
-30
15-
30
-15
Q1 2017 Q2 2017 Q3 2017 Q4 2017
FIGURE 9: BELFAST
(%)
-30
15-
30
-15
Q1 2017 Q2 2017 Q3 2017 Q4 2017
FIGURE 15: EDINBURGH
(%)
-30
15-
30
-15
Q1 2017 Q2 2017 Q3 2017 Q4 2017
FIGURE 10: LIVERPOOL
(%)
-
-30
1530
-15
Q1 2017 Q2 2017 Q3 2017 Q4 2017
FIGURE 16: NEWCASTLE
(%)
-
-30
1530
-15
Q1 2017 Q2 2017 Q3 2017 Q4 2017
FIGURE 11: BIRMINGHAM
(%)
-
-30
1530
-15
Q1 2017 Q2 2017 Q3 2017 Q4 2017
FIGURE 17: LEEDS
(%)
-
-30
1530
-15
Q1 2017 Q2 2017 Q3 2017 Q4 2017
FIGURE 12: CARDIFF
(%)
-
-30
1530
-15
Q1 2017 Q2 2017 Q3 2017 Q4 2017
FIGURE 18: MANCHESTER
(%)
-
-30
1530
-15
Q1 2017 Q2 2017 Q3 2017 Q4 2017
FIGURE 13: BATH
(%)
-30
15-
30
-15
Q1 2017 Q2 2017 Q3 2017 Q4 2017
FIGURE 19: LONDON
(%)
-
-30
1530
-15
Q1 2017 Q2 2017 Q3 2017 Q4 2017
Key for all: Demand growth Historical supply change Active pipelineSource for all: AM:PM, STR
I N V E S T M E NT I N D I C ATO R S F O R Q1 2017 TO Q4 2017
Notes: Demand growth calculated as the average quarterly RevPAR change over the last four quarters Historical supply change calculated as change in hotel bedrooms between September 2015 and 2017 Active pipeline calculated as active pipeline as a percentage of current supply

6 / Hotel Bulletin Q4 2017
C O NTA CT T H E A U T H O R S: Graeme Smith ([email protected]), Russell Kett ([email protected]), Alan Gordon ([email protected]), and Alexander Robinson ([email protected]).
F O R M O R E I N F O R M AT I O N, C O NTA CT: Graeme Smith Managing Director +44 20 7332 5115 [email protected]
All hotel performance data included in this report was provided by STR unless otherwise indicated.
A B O U T A L I X PA RT N E R S In today’s fast paced global market timing is everything. You want to protect, grow or transform your business. To meet these challenges we offer clients small teams of highly qualified experts with profound sector and operational insight. Our clients include corporate boards and management, law firms, investment banks, investors and others who appreciate the candor, dedication, and transformative expertise of our teams. We will ensure insight drives action at that exact moment that is critical for success. When it really matters. alixpartners.com
The opinions expressed are those of the author and do not necessarily reflect the views of AlixPartners, LLP, its affiliates, or any of its or their respective professionals or clients. This article regarding Hotel Bulletin Q4 2017 (“Article”) was prepared by AlixPartners, LLP (“AlixPartners”) for general information and distribution on a strictly confidential and non-reliance basis. No one in possession of this Article may rely on any portion of this Article. This Article may be based, in whole or in part, on projections or forecasts of future events. A forecast, by its nature, is speculative and includes estimates and assumptions which may prove to be wrong. Actual results may, and frequently do, differ from those projected or forecast. The information in this Article reflects conditions and our views as of this date, all of which are subject to change. We undertake no obligation to update or provide any revisions to the Article. This article is the property of AlixPartners, and neither the article nor any of its contents may be copied, used, or distributed to any third party without the prior written consent of AlixPartners.
©2018 AlixPartners, LLP
A B O U T A M:P MAM:PM is the most advanced system for staying on top of hotel supply development. Currently available for the UK and Ireland, AM:PM was acquired by STR in 2016, and is currently being integrated for several markets around the world. With AM:PM, you can stay informed on new hotel openings, pipeline construction and development, closures, rebrands and transactions and access intuitive reports. Beyond the updates, you can visualize this data with our fully functional map tool.
A B O U T H V SHVS is the world’s leading consulting and services organization focused of the hotel, mixed-use, shared ownership, gaming and leisure industries. Established in 1980, the company performs 4,500+ assignments each year for hotel and real estate owners, investors, lenders, operators and developers worldwide. HVS principals are regarded as the leading experts in their respective regions of the globe. Through a network of more than 40 offices and 350 professionals, HVS provides an unparalleled range of complementary services for the hospitality industry.
Superior results through unrivalled hospitality intelligence. Everywhere.
A B O U T S T R STR is the source for premium global data benchmarking, analytics and marketplace insights. Our data is confidential, reliable, accurate and actionable. Our comprehensive solutions, analytics and unrivalled marketplace insights are built to fuel growth and help our clients make better business decisions. For further information, please visit www.str.com, email [email protected] or call +44 (0) 207 922 1930.