february 2021 volume 21 number 3 - bank of jamaica
TRANSCRIPT

February 2021 Volume 21 Number 3

ⓒ 2021 Bank of Jamaica
Nethersole Place
Kingston
Jamaica
Telephone: (876) 922 0750-9
Fax: (876) 967 4265
Email: [email protected]
Website: www.boj.org.jm
ISSN 0799 1037
Printed in Jamaica
Monetary Policy at the Bank of Jamaica
Bank of Jamaica’s monetary policy objective is to achieve an inflation target of 4 - 6 per cent per annum. This
low, stable and predictable inflation rate, measured as the change in the consumer price index that is published
by the Statistical Institute of Jamaica, will facilitate sustained growth and development in Jamaica.
The inflation target was established by the Minister of Finance and the Public Service in consultation with Bank
of Jamaica in September 2017.
The Bank uses a variety of tools to achieve its inflation target, the main one being the interest rate on overnight
balances in the current accounts of deposit‐taking institutions at Bank of Jamaica. Changes in the Bank’s policy
rate signals the Bank’s policy stance towards achieving its inflation objective, which is transmitted to prices
through the financial markets and then through spending and investment decisions.
Monetary policy decisions affect inflation with a lag of between 4 to 8 quarters. For this reason, monetary policy
in Jamaica is forward looking and the Bank puts much effort into establishing its view of the economy in the
future, and bases its decision on this view. It is also important that the Bank clearly and transparently
communicates this view of the future to the Jamaican public. The Bank undertakes an assessment of the
economy eight times during each calendar year and publishes its decisions in accordance with a pre-announced
schedule. On four of these occasions, when most data on the key macro-economic variables are available, the
Bank prepares a comprehensive macroeconomic forecast covering the international economy, the fiscal
accounts, balance of payments, money, credit, interest rates, GDP and prices.
This Monetary Policy Report describes the Bank’s most recent policy decision by the Bank and outlines the Bank’s
projections for inflation in Jamaica and the main macroeconomic variables that affect it. The Monetary Policy
Report is prepared and published once every three months at the time of four of the Bank’s monetary policy
announcements.

This page was intentionally left blank
Overview
Developments in the December 2020 quarter continued to be impacted by the ongoing coronavirus (COVID-19)
crisis in Jamaica and the world. There have been some signs of improvement in economic activity, but the
prospects for the Jamaican economy continue to be characterised by uncertainty, particularly in the context of
a recent surge in COVID-19 cases domestically and internationally as well as more stringent measures taken by
governments around the world to contain the virus spread.
Annual inflation accelerated to 5.2 per cent at December 2020 from 4.9 per cent at September 2020. This outturn
mainly reflected the impact of increases in agricultural food prices and energy costs. Over the next eight quarters,
inflation is projected to average 5.0 per cent (lower than the average rate of 5.3 per cent previously projected).
The Bank anticipates that Inflation will rise in the range 4.0 to 6.0 per cent at March 2021, decelerate in the
range of 4.0 to 5.0 per cent at June 2021 and then accelerate in the range 4.5 to 5.5 per cent at September
2021. Inflation is projected remain within the Bank’s inflation target of 4.0 per cent to 6.0 per cent over the
medium-term.
The Jamaican economy is estimated to have contracted in the range of 7.5 to 9.5 per cent for the December
2020 quarter, an improvement relative to the contraction of 10.7 per cent recorded for the September 2020
quarter. There were estimated declines in the majority of the industries for the review quarter. For FY2020/21,
real GDP is still projected to contract between 10.0 and 12.0 per cent but recover partially in the next year. The
risks to the growth forecast are skewed to the downside.
Jamaica’s current account of the balance of payments is anticipated to improve over the next eight quarters
relative to the previous forecast. This improvement is largely underpinned by an upward revision to the surplus
on the services sub-account inflows to the country. The Bank anticipates that the current account deficit (CAD)
of the balance of payments will average 2.8 per cent of GDP for FY2020/21 to FY2022/23, lower (better) than
the previous forecast of 3.2 per cent of GDP. Jamaica’s international reserves remain buoyant, with gross
reserves at end-January amounting to approximately US$3.9 billion, representing 117.8% of the Assessing
Reserve Adequacy metric for FY2020/21. The risks to the projections for the CAD are balanced. The outlook for
the gross reserves has also improved relative to the previous projection due to a favourable outturn at December
2020.
The foreign exchange market has generally observed the continuation of two-way movements in the exchange
rate. The annual average rate of depreciation at end-January 2021 was 5.9 per cent, which, although above
the average depreciation of 3.4 per cent recorded last year is still moderate under the circumstances. Total B-
FXITT flash sale operations since the onset of the crisis in March 2020 to date has amounted to US$381.0
million.
The financial system has remained generally resilient throughout the pandemic. Both the primary ratio and capital
adequacy ratio, which measures the capacity of banks to absorb unexpected losses, remained comfortably
above their respective statutory minima. All banks have also remained well capitalized and in compliance with
prudent liquidity standards.
The COVID-19 pandemic continues to affect activity in the domestic banking sector and overall financing in
Jamaica. Broad money grew at an annual rate of 14.6 per cent at November 2020, a deceleration relative to the
growth at September 2020. The expansion in broad money at November 2020 reflected growth of 11.9 per cent
in local currency deposits, a deceleration relative to the 19.7 per cent recorded at end-September 2020. The
deceleration in the growth in deposits reflected a slowdown in the growth in demand and savings deposits, to
17.3 per cent and 17.1 per cent, respectively, relative to growth of 22.1 per cent and 17.8 per cent in September
2020. In addition, time deposits declined by 14.2 per cent for the period relative to a growth of 20.7 per cent in
September 2020. Growth in deposits may have been related to increased efforts by DTIs to attract more
depositors. Loan growth has remained fairly resilient although the pace of growth has moderated. It remained
above what was expected given the sharp fallout in economic activity, bolstered by continued demand for loans
by businesses for working capital needs. Since the start of the pandemic, the Bank has implemented a number
of initiatives aimed at supporting JMD liquidity including reducing the cash reserve requirement, implementing a
GOJ-BOJ bond-buying programme, reactivating the BOJ Intermediation Facility, a special Repo facility for Credit
Unions and also the Occasional Term Repurchase Operation. The Bank’s liquidity support in both Jamaican and
US dollars has been substantial and unprecedented, equivalent to more than 12.0 per cent of GDP.

Given the heightened challenges associated with the COVID-19 outbreak, Bank of Jamaica has maintained an
accommodative monetary policy stance, aimed at encouraging and supporting a speedy economic recovery. At
the same time, the Bank continued to be focussed on ensuring that inflation remains low, stable and predictable
within the target of 4.0 to 6.0 per cent. The Bank is also prepared to take all necessary actions to ensure that
Jamaica’s financial system remains sound and well capitalized.
.

Contents
1.0 Inflation 1
Recent Developments 1
Inflation Outlook & Forecast 2
Inflation Risks 5
Box 1: Businesses’ Inflation Expectations Survey 3
2.0 International Economy 6
Trends in the Global Economy 6
Trading Partners’ Inflation 9
Trends in Trading Partners’ Exchange Rates 10
Terms of Trade 10
Commodity Prices 11
External Financial Markets 13
Global Stock Market 14
Box 2: Economic Growth in Selected Economies 8
3.0 Real Sector 15
GDP Growth and Output Gap 15
Aggregate Supply 16
Aggregate Demand 18
Labour Market Developments 18
Real Sector Outlook 18
4.0 Fiscal Accounts 20
Recent Developments 20
Near-term Outlook 21
5.0 Balance of Payments 22
Recent Developments 22
6.0 Monetary Policy & Market Operations 24
Recent Developments 24
Liquidity Conditions 24
7.0 Financial Markets 26
Market Interest Rates 26
Exchange Rate Developments 26
Equities Market 27
8.0 Monetary Aggregates 29
Money 29
Private Sector Credit 30
Monetary Projections 34
Box 3: Quarterly Means of Payment Assessment 31
9.0 Conclusion 35

Additional Tables 36
Glossary 52
List of Boxes 56

ABBREVIATIONS & ACRONYMS
B-FXITT Bank of Jamaica’s Foreign Exchange Intervention & Trading Tool
BOJ Bank of Jamaica
BOP Balance of Payments
Brexit British Exit
bps Basis points
CAD Current Account Deficit
CDs Certificates of Deposit
CDI Credit Demand Index
CIF Cost, Insurance and Freight
CPI Consumer Price Index
CPI-AF Consumer Price Index without Agriculture and Fuel
CPI-F Consumer Price Index without Fuel
CPI-FF Consumer Price Index without Food and Fuel
CSI Credit Supply Index
CY Calendar Year
DIJA The Dow Jones Industrial Average
DTIs Deposit-taking Institutions
EFR Excess funds rate
EGOF Electricity, Gas & Other Fuels
EMBI+ JP Morgan Emerging Market Bond Index
e.o.p End of Period
EPI Export Price Index
EFR Excess Funds Rate
Fed US Federal Reserve System
FNB Food & Non-Alcoholic Beverages
FTSE Financial Times Stock Exchange
FY Fiscal Year
GDP Gross Domestic Product
GOJ Government of Jamaica
GOJGBs Government of Jamaica Global Bonds
HWEG Housing, Water, Electricity Gas & Other Fuels
IES Inflation Expectations Survey
IMF International Monetary Fund
IPI Import Price Index
IRC Interest Rate Corridor
JMD Jamaica Dollar
JSE Jamaica Stock Exchange
LHS Left Hand Side
LME London Metal Exchange
M2J Broad money supply
M2+ Broad money supply that includes foreign currency deposits
MCI Monetary Conditions Index
NDA Net Domestic Assets
NIR Net International Reserve
NOP Net Opening Position
o/w Of which
O/N Overnight
OMO Open Market Operations
PMMR Private Money Market Rates
QoQ Quarter over Quarter
QPC Quantitative Performance Criteria
RADA Rural Agriculture Development Agency
REER Real Effective Exchange Rate
S&P Standard & Poor’sSBA Stand-by Agreement
SCT Special Consumption Tax
SLF Standing Liquidity Facility
T-Bill Treasury Bill
TP Trading Partners
UR Unemployment Rate
US United States
USD US dollar
WASR Weighted Average Selling Rate
WTI West Texas Intermediate
Quarterly Monetary Policy Report February 2021
Bank of Jamaica
Inflation is projected to average 5.0 per cent over the next eight quarters (March 2021 to December
2022), within the target range of 4.0 per cent to 6.0 per cent. This forecast is lower relative to the
previous projections for average inflation of 5.3 per cent over the next eight quarters (December 2020
to September 2022). The downward revision is primarily driven by a lower trajectory for agricultural
food price inflation, partly offset by a higher trajectory for processed foods, energy and transport.
Agricultural prices have moderated recently and planting conditions and supply from the sector in the
March 2021 quarter are assessed to be favourable. The higher trajectory for processed foods, energy
and transport is as a result of higher grains and oil prices, respectively.
Core inflation is projected to gradually increase over the next fiscal year. The higher core is due to the
impact of accommodative monetary and fiscal policies as well as improvement in external demand
conditions. However, this upward trend in core inflation is tempered by relatively weak domestic
demand conditions, arising from the impact of the COVID-19 pandemic and associated measures to
control the virus.
Recent Developments and Near-
term Outlook
The annual point-to-point inflation rate at December
2020 was 5.2 per cent, an acceleration relative to
the 4.9 per cent recorded at September 2020 but a
deceleration relative to the 6.2 per cent recorded at
December 2019. The annual headline inflation rate
at December 2020 was within the Bank’s target of
4.0 per cent to 6.0 per cent but below the Bank’s
November 2020 projection of 5.9 per cent.
The acceleration in inflation for the December 2020
quarter, relative to the preceding quarter, mainly
reflected the impact of higher agricultural food price
inflation and higher energy costs. Inflation for the
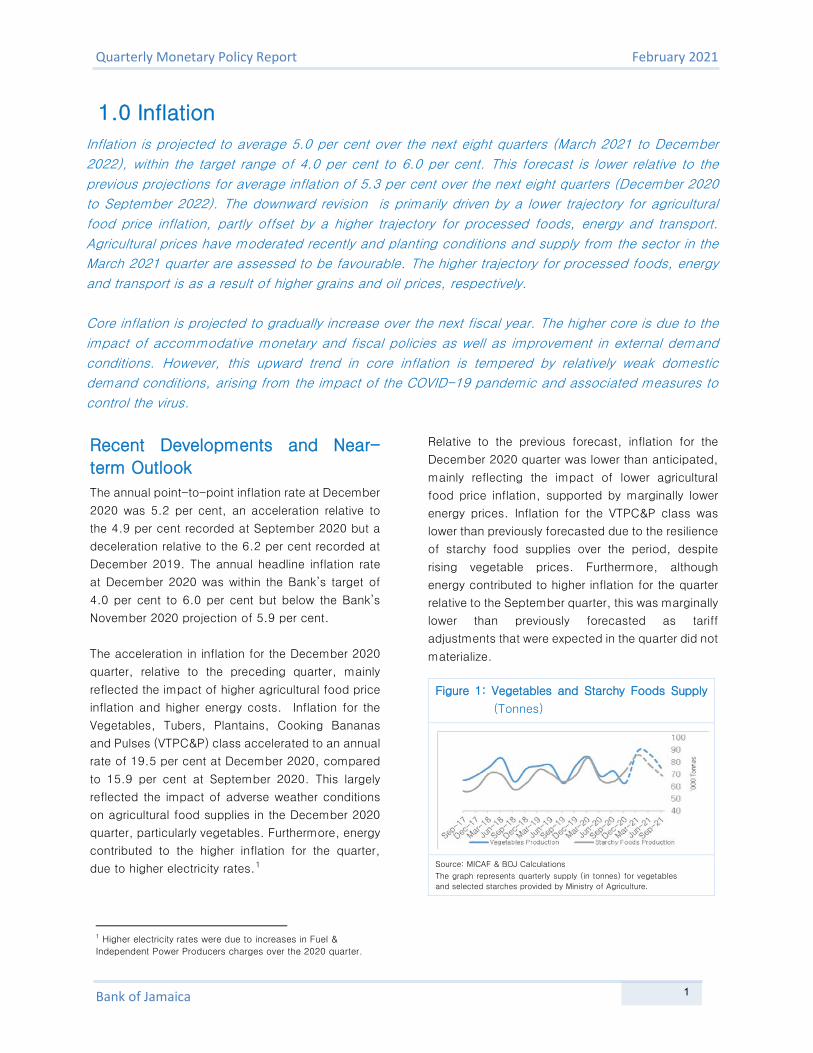
Vegetables, Tubers, Plantains, Cooking Bananas
and Pulses (VTPC&P) class accelerated to an annual
rate of 19.5 per cent at December 2020, compared
to 15.9 per cent at September 2020. This largely
reflected the impact of adverse weather conditions
on agricultural food supplies in the December 2020
quarter, particularly vegetables. Furthermore, energy
contributed to the higher inflation for the quarter,
due to higher electricity rates.1
1 Higher electricity rates were due to increases in Fuel &
Independent Power Producers charges over the 2020 quarter.
Relative to the previous forecast, inflation for the
December 2020 quarter was lower than anticipated,
mainly reflecting the impact of lower agricultural
food price inflation, supported by marginally lower
energy prices. Inflation for the VTPC&P class was
lower than previously forecasted due to the resilience
of starchy food supplies over the period, despite
rising vegetable prices. Furthermore, although
energy contributed to higher inflation for the quarter
relative to the September quarter, this was marginally
lower than previously forecasted as tariff
adjustments that were expected in the quarter did not
materialize.
Figure 1: Vegetables and Starchy Foods Supply
(Tonnes)
Source: MICAF & BOJ Calculations
The graph represents quarterly supply (in tonnes) for vegetables
and selected starches provided by Ministry of Agriculture.
1.0 Inflation
1
Quarterly Monetary Policy Report February 2021
Bank of Jamaica
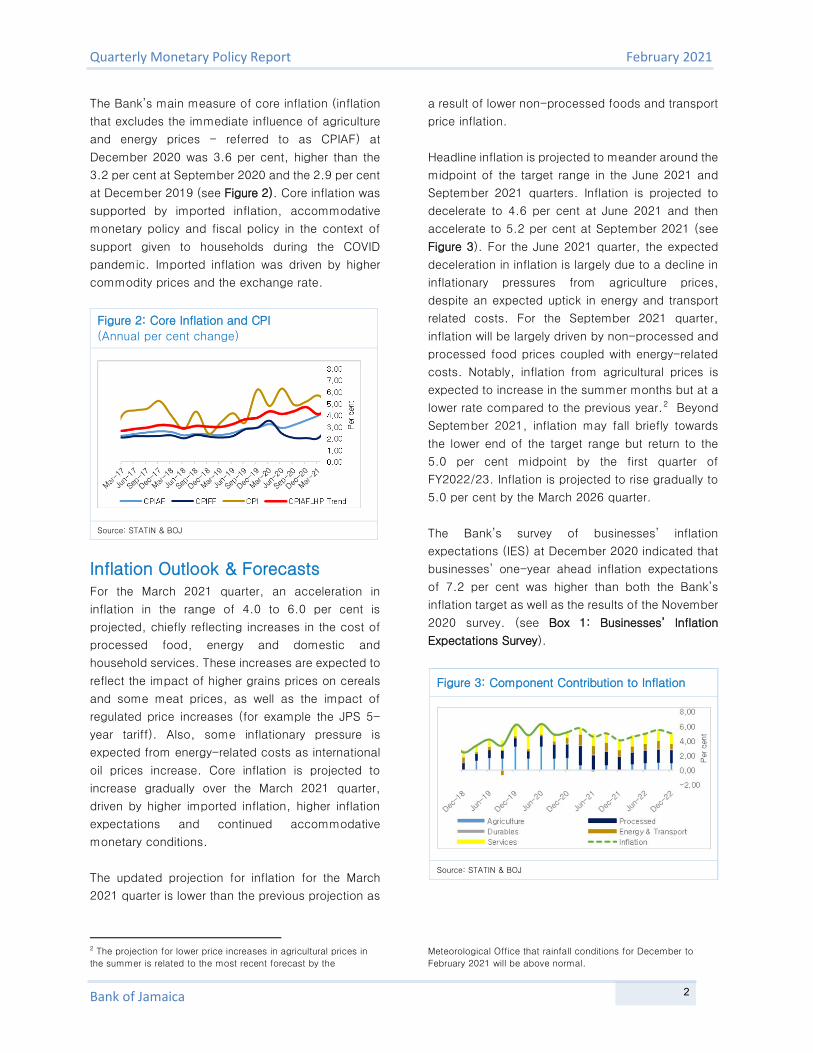
The Bank’s main measure of core inflation (inflation
that excludes the immediate influence of agriculture
and energy prices - referred to as CPIAF) at
December 2020 was 3.6 per cent, higher than the
3.2 per cent at September 2020 and the 2.9 per cent
at December 2019 (see Figure 2). Core inflation was
supported by imported inflation, accommodative
monetary policy and fiscal policy in the context of
support given to households during the COVID
pandemic. Imported inflation was driven by higher
commodity prices and the exchange rate.
Figure 2: Core Inflation and CPI
(Annual per cent change)
Source: STATIN & BOJ
Inflation Outlook & Forecasts For the March 2021 quarter, an acceleration in
inflation in the range of 4.0 to 6.0 per cent is
projected, chiefly reflecting increases in the cost of
processed food, energy and domestic and
household services. These increases are expected to
reflect the impact of higher grains prices on cereals
and some meat prices, as well as the impact of
regulated price increases (for example the JPS 5-
year tariff). Also, some inflationary pressure is
expected from energy-related costs as international
oil prices increase. Core inflation is projected to
increase gradually over the March 2021 quarter,
driven by higher imported inflation, higher inflation
expectations and continued accommodative
monetary conditions.
The updated projection for inflation for the March
2021 quarter is lower than the previous projection as
2 The projection for lower price increases in agricultural prices in
the summer is related to the most recent forecast by the
a result of lower non-processed foods and transport
price inflation.
Headline inflation is projected to meander around the
midpoint of the target range in the June 2021 and
September 2021 quarters. Inflation is projected to
decelerate to 4.6 per cent at June 2021 and then
accelerate to 5.2 per cent at September 2021 (see
Figure 3). For the June 2021 quarter, the expected
deceleration in inflation is largely due to a decline in
inflationary pressures from agriculture prices,
despite an expected uptick in energy and transport
related costs. For the September 2021 quarter,
inflation will be largely driven by non-processed and
processed food prices coupled with energy-related
costs. Notably, inflation from agricultural prices is
expected to increase in the summer months but at a
lower rate compared to the previous year.2 Beyond
September 2021, inflation may fall briefly towards
the lower end of the target range but return to the
5.0 per cent midpoint by the first quarter of
FY2022/23. Inflation is projected to rise gradually to
5.0 per cent by the March 2026 quarter.
The Bank’s survey of businesses’ inflation
expectations (IES) at December 2020 indicated that
businesses’ one-year ahead inflation expectations
of 7.2 per cent was higher than both the Bank’s
inflation target as well as the results of the November
2020 survey. (see Box 1: Businesses’ Inflation
Expectations Survey).
Figure 3: Component Contribution to Inflation
Source: STATIN & BOJ
Meteorological Office that rainfall conditions for December to
February 2021 will be above normal.
2

Quarterly Monetary Policy Report February 2021
Bank of Jamaica
Box 1: Businesses’ Inflation Expectations Survey –
December 2020
Overview
The Bank’s Survey of Businesses’ Inflation
Expectations (IES) at December 2020 indicated that
the one-year ahead inflation expectations was
higher than the Bank’s inflation target of 4.0 to 6.0
per cent. Similar to the previous survey, respondents
expect the cost of stock replacement to reflect the
highest increase among the input factors over the
next twelve months. The proportion of respondents
who held this view declined slightly relative to the
November 2020 survey. On the other hand, the costs
of wages & salaries and fuel & transport were
expected to be the lowest input costs over the next
twelve months with 73 per cent and 11 per cent,
respectively. Perceptions about the future business
conditions improved slightly while the present
business conditions declined on a yearly basis in the
latest survey. Perception of inflation control
improved relative to the previous survey.
Inflation Expectations
In the December 2020 survey, respondents’
expectation of inflation 12 months ahead increased
to 7.2 per cent, relative to 6.4 per cent in the
November 2020 survey. Furthermore, businesses
expected an annual point to point inflation rate at
December 2020 of 6.7 per cent, which is below the
annual point to point outturn of 5.2 per cent (see
Figure 1).
Perception of Inflation Control
The index of inflation control increased when
compared to the November 2020 survey (see Figure
2). This outturn reflected an increase in the share of
respondents who were “satisfied” with how inflation
was being controlled.
Exchange Rate Expectations In the December 2020 survey, respondents expected
the exchange rate to depreciate at a slower rate over
all three horizons relative to the previous survey (see
Table 1).
Figure 1: Expected 12-Month Ahead Inflation Question: Based on the average monthly inflation for the last 12 months,
what do you think the average monthly rate will be for the next 12 months?
a.
b.
Source: Businesses’ Inflation Expectations Survey
Figure 2: Perception of Inflation Control Question: How satisfied are you with the way inflation is
being controlled by the Government?
Source: Businesses’ Inflation Expectations Survey Notes: The Index of Inflation Control is calculated as the number of satisfied respondents minus the number of dissatisfied respondents plus 100
3
Quarterly Monetary Policy Report February 2021
Bank of Jamaica
Table 1: Exchange Rate Expectations
Question: In November 2020 the exchange rate for the Jamaican Dollar (JA$) in respect of the United States Dollar (US$) was $147.96. What do you think the rate will be for the following periods?
Expected Exchange Rate Depreciation/Appreciation (%)
Periods Ahead Sep-20
Oct-20
Novl-20 Dec-20
3-Months 3.6 -0.9 1.7 0.1
6-Months 4.6 0.2 2.5 0.7
12- Months 4.1 0.3 3.0 0.8
Source: Businesses’ Inflation Expectations Survey.
Note: The responses have been converted to percentage change.
(-) indicates an appreciation of the exchange rate
(+) indicates a depreciation of the exchange rate
Interest Rate Expectations
The majority of respondents expected the Bank’s
policy rate, three months ahead, to remain
unchanged. The proportion of respondents of this
view increased relative to the previous survey while
there was a decline in the proportion who believes
it will be “marginally lower”. The 90-day Treasury
bill (T-Bill) yield, three months ahead, was
expected to remain at 0.6 per cent when
compared to the November 2020 survey.
Perception of Present and Future Business
Conditions
Respondents views on present business conditions
declined in the December 2020 survey relative to
the previous survey. This was due to an increase in
the proportion of respondents of the view that
things are “worse.” However, similar to the
November 2020 survey, businesses were more
optimistic about the future as the proportion of
respondents who believe that conditions will be “
better” increased.
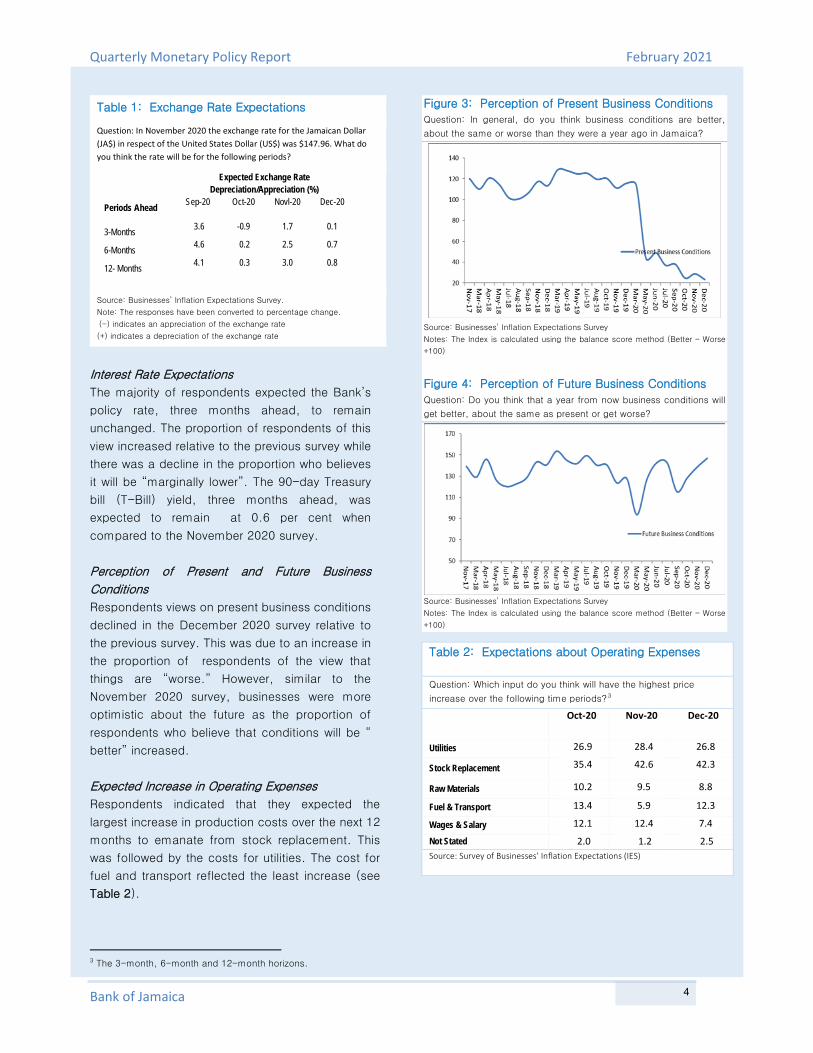
Expected Increase in Operating Expenses
Respondents indicated that they expected the
largest increase in production costs over the next 12
months to emanate from stock replacement. This
was followed by the costs for utilities. The cost for
fuel and transport reflected the least increase (see
Table 2).
3 The 3-month, 6-month and 12-month horizons.
Figure 3: Perception of Present Business Conditions Question: In general, do you think business conditions are better,
about the same or worse than they were a year ago in Jamaica?
Source: Businesses’ Inflation Expectations Survey
Notes: The Index is calculated using the balance score method (Better – Worse
+100)
Figure 4: Perception of Future Business Conditions Question: Do you think that a year from now business conditions will
get better, about the same as present or get worse?
Source: Businesses’ Inflation Expectations Survey
Notes: The Index is calculated using the balance score method (Better – Worse
+100)
Table 2: Expectations about Operating Expenses
Question: Which input do you think will have the highest price
increase over the following time periods?3
Oct-20 Nov-20 Dec-20
Utilities 26.9 28.4 26.8
Stock Replacement 35.4 42.6 42.3
Raw Materials 10.2 9.5 8.8
Fuel & Transport 13.4 5.9 12.3
Wages & Salary 12.1 12.4 7.4
Not Stated 2.0 1.2 2.5 Source: Survey of Businesses’ Inflation Expectations (IES)
4
Quarterly Monetary Policy Report February 2021
Bank of Jamaica
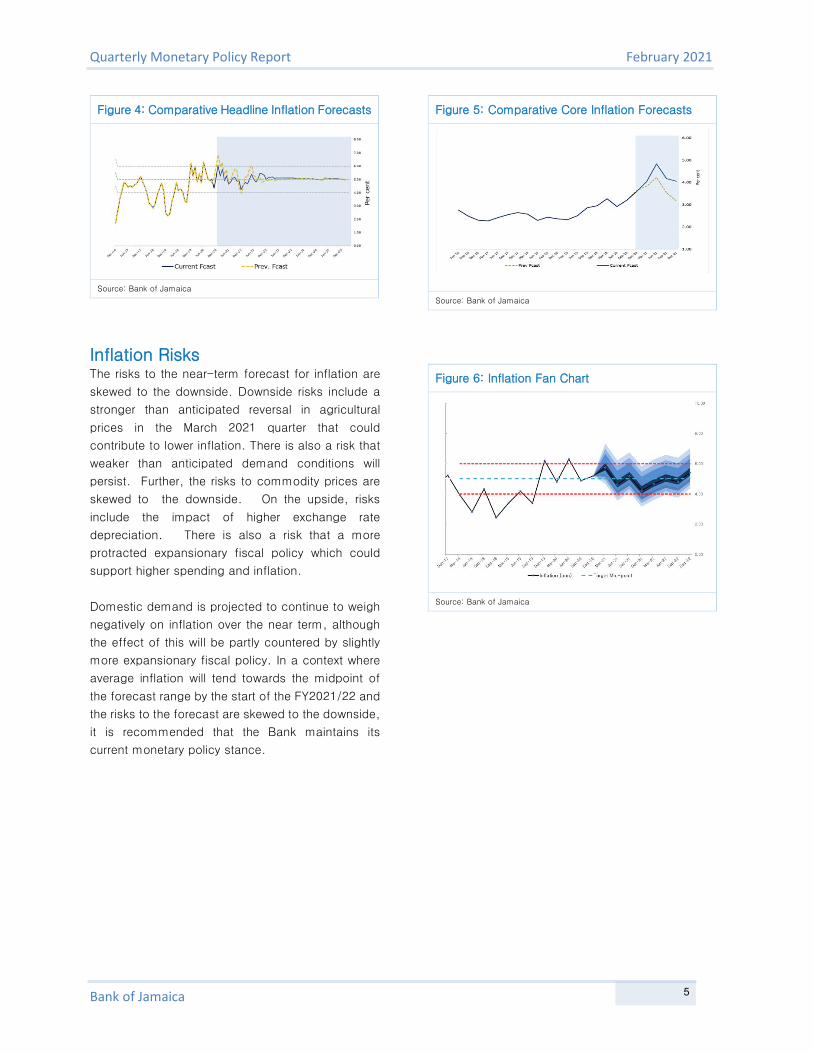
Figure 4: Comparative Headline Inflation Forecasts
Source: Bank of Jamaica
Inflation Risks The risks to the near-term forecast for inflation are
skewed to the downside. Downside risks include a
stronger than anticipated reversal in agricultural
prices in the March 2021 quarter that could
contribute to lower inflation. There is also a risk that
weaker than anticipated demand conditions will
persist. Further, the risks to commodity prices are
skewed to the downside. On the upside, risks
include the impact of higher exchange rate
depreciation. There is also a risk that a more
protracted expansionary fiscal policy which could
support higher spending and inflation.
Domestic demand is projected to continue to weigh
negatively on inflation over the near term, although
the effect of this will be partly countered by slightly
more expansionary fiscal policy. In a context where
average inflation will tend towards the midpoint of
the forecast range by the start of the FY2021/22 and
the risks to the forecast are skewed to the downside,
it is recommended that the Bank maintains its
current monetary policy stance.
Figure 5: Comparative Core Inflation Forecasts
Source: Bank of Jamaica
Figure 6: Inflation Fan Chart
Source: Bank of Jamaica
5

Quarterly Monetary Policy Report February 2021
Bank of Jamaica
2.0 International Economy Positive developments with the COVID-19 vaccine as well as expectations for further fiscal stimulus
fuelled optimism about the global economic recovery. However, with continued increases in
coronavirus infections and renewed tightening of restrictions, projected global growth is more muted
in the December 2020 and the March 2021 quarters, relative to the previous projections. The global
economic recovery is expected to improve from the second half of 2021 onwards as vaccines are
made available, warmer weather slows virus transmission and governments gradually ease
restrictions. Global growth is consequently projected to average 4.5 per cent over the next eight
quarters (March 2021 to December 2022), above the previous projection of 4.2 per cent.
Preliminary indications are that GDP growth in the US expanded by 4.0 per cent for the December
2020 quarter, broadly in line with expectations, following an expansion of 33.4 per cent for the
September 2020 quarter. It is projected that US GDP for 2020 will contract by 3.5 per cent, followed
by a recovery of 3.9 per cent in 2021. This represents an upward revision relative to the decline of
4.1 per cent previously projected for 2020 and marginally lower growth when compared to previous
expectation of 4.0 per cent for 2021. The output gap for the US is projected to be broadly in line with
the previous forecast.
Bank of Jamaica anticipates that the Fed will maintain interest rates at current levels over the next
eight quarters, implying the absence of external impetus for domestic interest rates to rise. Jamaica’s
sovereign bond yields are consequently projected to be relatively stable over the forecast horizon.
The projection for commodity prices over the next eight quarters has been revised upwards, relative
to the previous forecast. However, the risks to the forecast for commodity prices are skewed to the
downside.
Trends in the Global Economy The global economy is estimated to have contracted
by 2.0 per cent for the December 2020 quarter, a
smaller decline relative to the contraction of 3.0 per
cent in the September 2020 quarter as well as the
previous projection for a reduction of 2.6 per
cent.The estimated decline for the December 2020
quarter reflects a reduction in economic activity in
most major economies amid an increase in virus
numbers and renewed lockdown restrictions.
1 The IMF in the January 2021 WEO update indicated that the
global economy is projected to contract by 3.5 per cent for
2020, 0.9 percentage points (pps) above the October 2020 WEO
Global growth is projected to average 4.5 per cent
over the next eight quarters (March 2021 to
December 2022), above the previous projection of
4.2 per cent (see Figure 7). The pace of 2021’s
recovery will be uneven, with the expectations for
stronger growth in China, as the country was able to
curb the spread of the virus before the rest of the
world. The global economic recovery is expected to
improve from the second half of 2021 onwards as
vaccines are made available to more segments of
the population, warmer weather slows virus
transmission and governments gradually ease
restrictions. 1
forecast. The upward revision reflected stronger-than-expected
momentum in the second half of 2020. The global economy is
6
Quarterly Monetary Policy Report February 2021
Bank of Jamaica
The risks to global growth are skewed to the
downside. Worse outcomes could arise if the
COVID-19 outbreak persists longer. On the upside,
however, the recession could be less severe if the
deployment of vaccines encourages a stronger
increase in confidence and subsequently contribute
to a stronger rise in domestic demand. Many
countries have also provided large-scale fiscal and
monetary support to mitigate the negative economic
impact of the pandemic.
Figure 7: Global Growth Projection*
(Per cent change annualised)
Source: Bloomberg *Bank of Jamaica’s Estimate and forecast
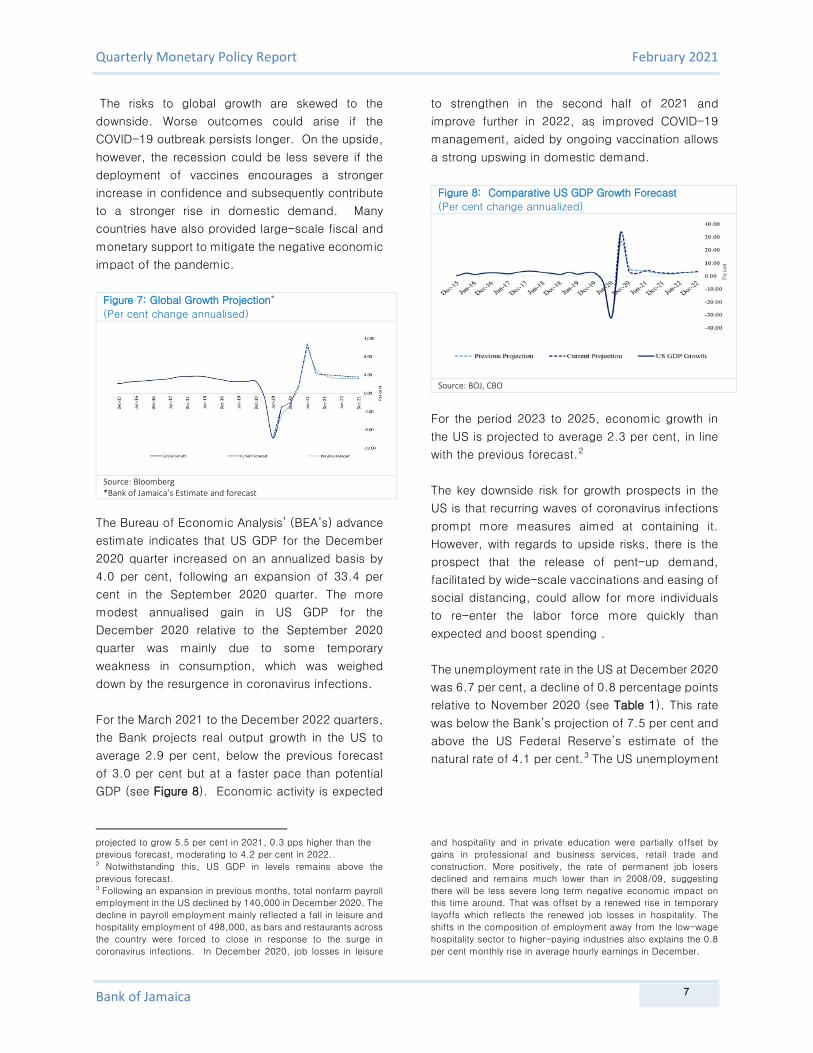
The Bureau of Economic Analysis’ (BEA’s) advance
estimate indicates that US GDP for the December
2020 quarter increased on an annualized basis by
4.0 per cent, following an expansion of 33.4 per
cent in the September 2020 quarter. The more
modest annualised gain in US GDP for the
December 2020 relative to the September 2020
quarter was mainly due to some temporary
weakness in consumption, which was weighed
down by the resurgence in coronavirus infections.
For the March 2021 to the December 2022 quarters,
the Bank projects real output growth in the US to
average 2.9 per cent, below the previous forecast
of 3.0 per cent but at a faster pace than potential
GDP (see Figure 8). Economic activity is expected
projected to grow 5.5 per cent in 2021, 0.3 pps higher than the
previous forecast, moderating to 4.2 per cent in 2022.. 2 Notwithstanding this, US GDP in levels remains above the
previous forecast. 3 Following an expansion in previous months, total nonfarm payroll
employment in the US declined by 140,000 in December 2020. The
decline in payroll employment mainly reflected a fall in leisure and
hospitality employment of 498,000, as bars and restaurants across
the country were forced to close in response to the surge in
coronavirus infections. In December 2020, job losses in leisure
to strengthen in the second half of 2021 and
improve further in 2022, as improved COVID-19
management, aided by ongoing vaccination allows
a strong upswing in domestic demand.
Figure 8: Comparative US GDP Growth Forecast
(Per cent change annualized)
Source: BOJ, CBO
For the period 2023 to 2025, economic growth in
the US is projected to average 2.3 per cent, in line
with the previous forecast.2
The key downside risk for growth prospects in the
US is that recurring waves of coronavirus infections
prompt more measures aimed at containing it.
However, with regards to upside risks, there is the
prospect that the release of pent-up demand,
facilitated by wide-scale vaccinations and easing of
social distancing, could allow for more individuals
to re-enter the labor force more quickly than
expected and boost spending .
The unemployment rate in the US at December 2020
was 6.7 per cent, a decline of 0.8 percentage points
relative to November 2020 (see Table 1). This rate
was below the Bank’s projection of 7.5 per cent and
above the US Federal Reserve’s estimate of the
natural rate of 4.1 per cent.3 The US unemployment
and hospitality and in private education were partially offset by
gains in professional and business services, retail trade and
construction. More positively, the rate of permanent job losers
declined and remains much lower than in 2008/09, suggesting there will be less severe long term negative economic impact on
this time around. That was offset by a renewed rise in temporary
layoffs which reflects the renewed job losses in hospitality. The
shifts in the composition of employment away from the low-wage
hospitality sector to higher-paying industries also explains the 0.8
per cent monthly rise in average hourly earnings in December.
7
Quarterly Monetary Policy Report February 2021
Bank of Jamaica
Box 2: Economic Growth in Selected Economies
China
The Chinese economy recorded an expansion of 6.5
per cent for the December 2020 quarter compared
to a year ago. This pace was quicker than the
expansion of 4.9 per cent in the September 2020
quarter. The expansion in the December 2020
quarter was supported by growth in the industrial
sector, which remained among the fastest growing
sectors. However, the biggest improvement was
from services activity, with all sectors recording
growth on an annual basis. Conditions remain
mixed, however, with virus disruptions still weighing
on some sectors like hospitality while others, such
as IT, continue to expand at a rapid pace.
GDP growth in China is projected to average 7.2 per
cent, over the next eight quarters, and range
between 5.3 per cent to 17.5 per cent.4
Japan
The Japanese economy is estimated to have
recorded an expansion of 4.2 per cent for the
December 2020 quarter, following an expansion of
22.9 per cent in the September 2020 quarter.
For the next eight quarters, GDP growth in Japan is
projected in the range of 1.5 per cent to 4.6 per
cent, averaging approximately 1.9 per cent.5
Canada
The Canadian economy is estimated to have
expanded by 2.8 per cent for the December 2020
quarter on a quarterly annualised basis, compared
to an expansion of 40.5 per cent for the September
2020 quarter.
For the next eight quarters, GDP growth in Canada
is projected in the range of 8.7 per cent to 27.7 per
cent, averaging approximately 16.7 per cent.
4 Estimates for China growth represent year-over-year per cent
change.
Euro Area
The Euro Area is estimated to have contracted by
8.9 per cent in the December 2020 quarter,
compared to an expansion of 60.0 per cent in the
previous quarter.
For the next eight quarters, GDP growth in the Euro
Area is projected in the range of 2.0 per cent to 7.0
per cent, averaging approximately 3.6 per cent.
United Kingdom (UK)
The UK economy is estimated to have contracted
9.3 per cent in the December 2020 quarter, on a
quarterly annualised basis following an expansion of
81.1 per cent in the previous quarter. Growth in the
UK economy over the next eight quarters is
projected in the range of 2.8 per cent to 9.1 per
cent, averaging approximately 5.1 per cent.
5 The projection assumes a contraction of 1.6 per cent in the
March 2021 quarter.
8
Quarterly Monetary Policy Report February 2021
Bank of Jamaica
rate is projected to decline over the next eight
quarters.6, 7
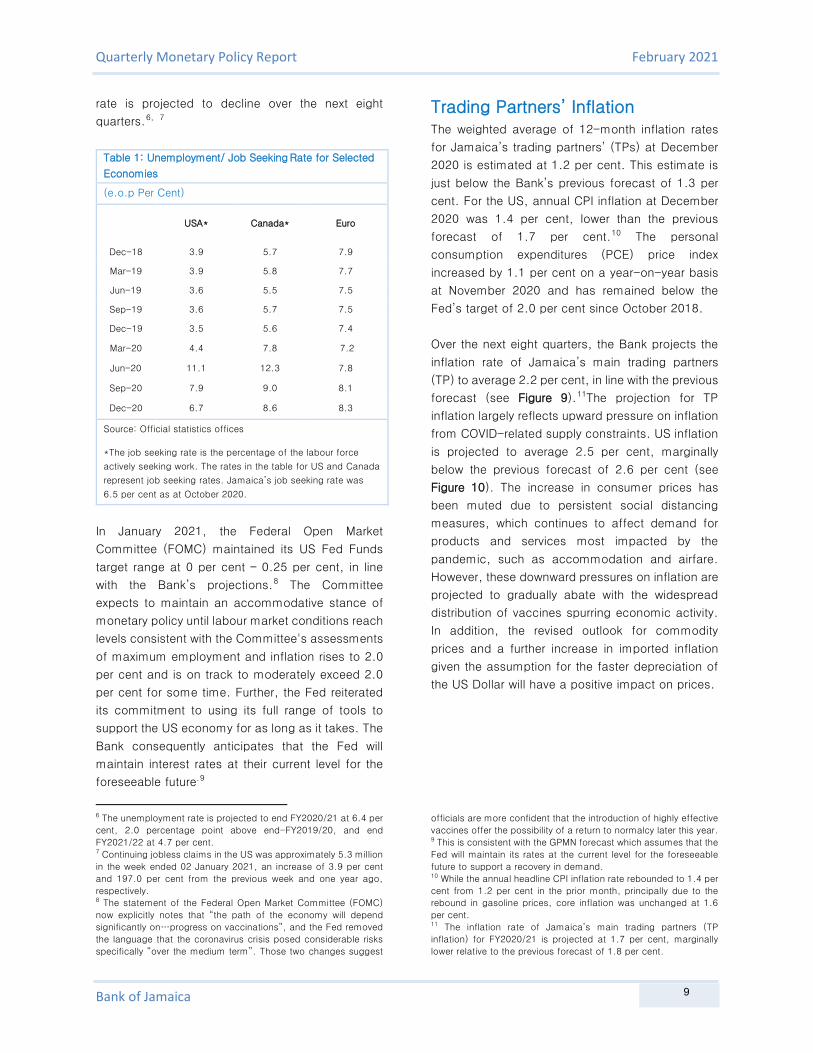
Table 1: Unemployment/ Job Seeking Rate for Selected
Economies
(e.o.p Per Cent)
USA* Canada* Euro
Dec-18 3.9 5.7 7.9
Mar-19 3.9 5.8 7.7
Jun-19 3.6 5.5 7.5
Sep-19 3.6 5.7 7.5
Dec-19 3.5 5.6 7.4
Mar-20 4.4 7.8 7.2
Jun-20 11.1 12.3 7.8
Sep-20 7.9 9.0 8.1
Dec-20 6.7 8.6 8.3
Source: Official statistics offices
*The job seeking rate is the percentage of the labour force
actively seeking work. The rates in the table for US and Canada
represent job seeking rates. Jamaica’s job seeking rate was
6.5 per cent as at October 2020.
In January 2021, the Federal Open Market
Committee (FOMC) maintained its US Fed Funds
target range at 0 per cent – 0.25 per cent, in line
with the Bank’s projections.8 The Committee
expects to maintain an accommodative stance of
monetary policy until labour market conditions reach
levels consistent with the Committee's assessments
of maximum employment and inflation rises to 2.0
per cent and is on track to moderately exceed 2.0
per cent for some time. Further, the Fed reiterated
its commitment to using its full range of tools to
support the US economy for as long as it takes. The
Bank consequently anticipates that the Fed will
maintain interest rates at their current level for the
foreseeable future.9
6 The unemployment rate is projected to end FY2020/21 at 6.4 per
cent, 2.0 percentage point above end-FY2019/20, and end
FY2021/22 at 4.7 per cent. 7 Continuing jobless claims in the US was approximately 5.3 million
in the week ended 02 January 2021, an increase of 3.9 per cent
and 197.0 per cent from the previous week and one year ago,
respectively. 8 The statement of the Federal Open Market Committee (FOMC)
now explicitly notes that “the path of the economy will depend
significantly on…progress on vaccinations”, and the Fed removed
the language that the coronavirus crisis posed considerable risks
specifically “over the medium term”. Those two changes suggest
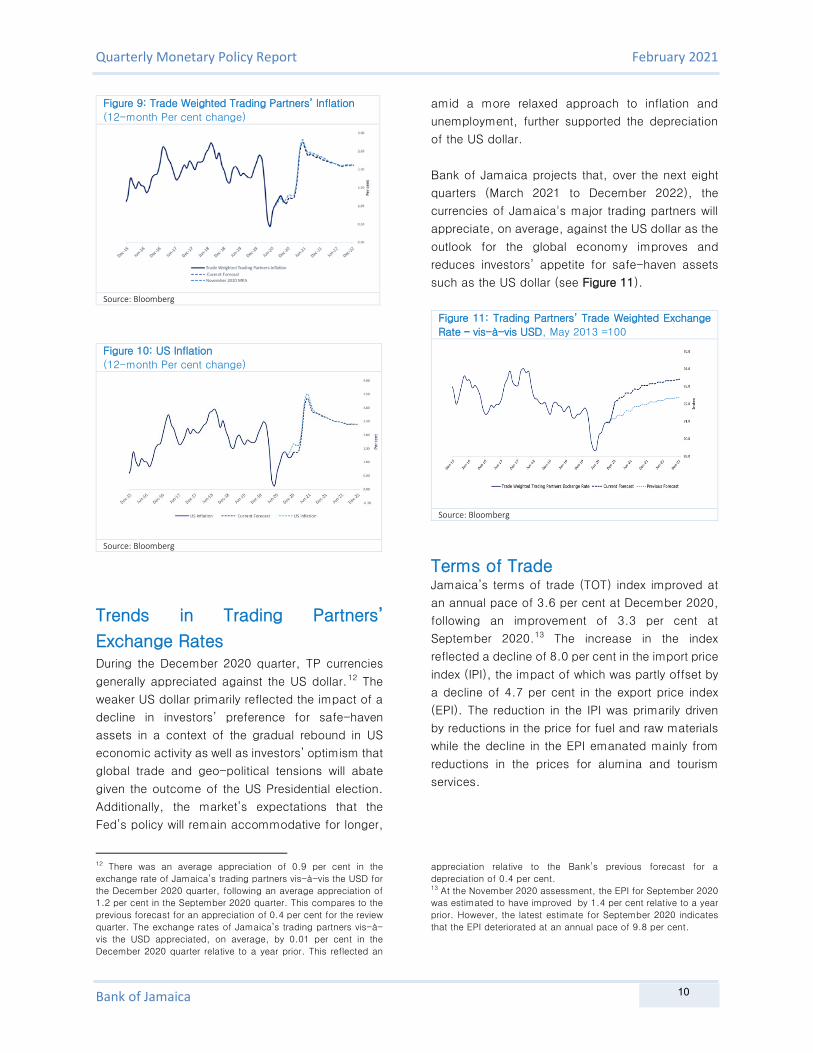
Trading Partners’ Inflation The weighted average of 12-month inflation rates
for Jamaica’s trading partners’ (TPs) at December
2020 is estimated at 1.2 per cent. This estimate is
just below the Bank’s previous forecast of 1.3 per
cent. For the US, annual CPI inflation at December
2020 was 1.4 per cent, lower than the previous
forecast of 1.7 per cent.10 The personal
consumption expenditures (PCE) price index
increased by 1.1 per cent on a year-on-year basis
at November 2020 and has remained below the
Fed’s target of 2.0 per cent since October 2018.
Over the next eight quarters, the Bank projects the
inflation rate of Jamaica’s main trading partners
(TP) to average 2.2 per cent, in line with the previous
forecast (see Figure 9).11The projection for TP
inflation largely reflects upward pressure on inflation
from COVID-related supply constraints. US inflation
is projected to average 2.5 per cent, marginally
below the previous forecast of 2.6 per cent (see
Figure 10). The increase in consumer prices has
been muted due to persistent social distancing
measures, which continues to affect demand for
products and services most impacted by the
pandemic, such as accommodation and airfare.
However, these downward pressures on inflation are
projected to gradually abate with the widespread
distribution of vaccines spurring economic activity.
In addition, the revised outlook for commodity
prices and a further increase in imported inflation
given the assumption for the faster depreciation of
the US Dollar will have a positive impact on prices.
officials are more confident that the introduction of highly effective
vaccines offer the possibility of a return to normalcy later this year. 9 This is consistent with the GPMN forecast which assumes that the
Fed will maintain its rates at the current level for the foreseeable
future to support a recovery in demand. 10 While the annual headline CPI inflation rate rebounded to 1.4 per
cent from 1.2 per cent in the prior month, principally due to the
rebound in gasoline prices, core inflation was unchanged at 1.6
per cent. 11 The inflation rate of Jamaica’s main trading partners (TP
inflation) for FY2020/21 is projected at 1.7 per cent, marginally
lower relative to the previous forecast of 1.8 per cent.
9
Quarterly Monetary Policy Report February 2021
Bank of Jamaica
Figure 9: Trade Weighted Trading Partners’ Inflation
(12-month Per cent change)
Source: Bloomberg
Figure 10: US Inflation
(12-month Per cent change)
Source: Bloomberg
Trends in Trading Partners’
Exchange Rates
During the December 2020 quarter, TP currencies
generally appreciated against the US dollar.12 The
weaker US dollar primarily reflected the impact of a
decline in investors’ preference for safe-haven
assets in a context of the gradual rebound in US
economic activity as well as investors’ optimism that
global trade and geo-political tensions will abate
given the outcome of the US Presidential election.
Additionally, the market’s expectations that the
Fed’s policy will remain accommodative for longer,
12 There was an average appreciation of 0.9 per cent in the
exchange rate of Jamaica’s trading partners vis-à-vis the USD for
the December 2020 quarter, following an average appreciation of
1.2 per cent in the September 2020 quarter. This compares to the
previous forecast for an appreciation of 0.4 per cent for the review
quarter. The exchange rates of Jamaica’s trading partners vis-à-
vis the USD appreciated, on average, by 0.01 per cent in the
December 2020 quarter relative to a year prior. This reflected an
amid a more relaxed approach to inflation and
unemployment, further supported the depreciation
of the US dollar.
Bank of Jamaica projects that, over the next eight
quarters (March 2021 to December 2022), the
currencies of Jamaica's major trading partners will
appreciate, on average, against the US dollar as the
outlook for the global economy improves and
reduces investors’ appetite for safe-haven assets
such as the US dollar (see Figure 11).
Figure 11: Trading Partners’ Trade Weighted Exchange
Rate – vis-à-vis USD, May 2013 =100
Source: Bloomberg
Terms of Trade Jamaica’s terms of trade (TOT) index improved at
an annual pace of 3.6 per cent at December 2020,
following an improvement of 3.3 per cent at
September 2020.13 The increase in the index
reflected a decline of 8.0 per cent in the import price
index (IPI), the impact of which was partly offset by
a decline of 4.7 per cent in the export price index
(EPI). The reduction in the IPI was primarily driven
by reductions in the price for fuel and raw materials
while the decline in the EPI emanated mainly from
reductions in the prices for alumina and tourism
services.
appreciation relative to the Bank’s previous forecast for a
depreciation of 0.4 per cent. 13 At the November 2020 assessment, the EPI for September 2020
was estimated to have improved by 1.4 per cent relative to a year
prior. However, the latest estimate for September 2020 indicates
that the EPI deteriorated at an annual pace of 9.8 per cent.
10
Quarterly Monetary Policy Report February 2021
Bank of Jamaica
The outturn for the December 2020 quarter reflected
a smaller improvement relative to the previous
projection and was largely attributable to a smaller
pace of decline in import prices.
Bank of Jamaica projects that Jamaica’s TOT will
deteriorate over the next eight quarters (March 2021
quarter to the December 2022 quarter), primarily
due to reductions in export prices, particularly that
for tourism, as well as an increase in import prices,
driven by fuel and raw materials.14
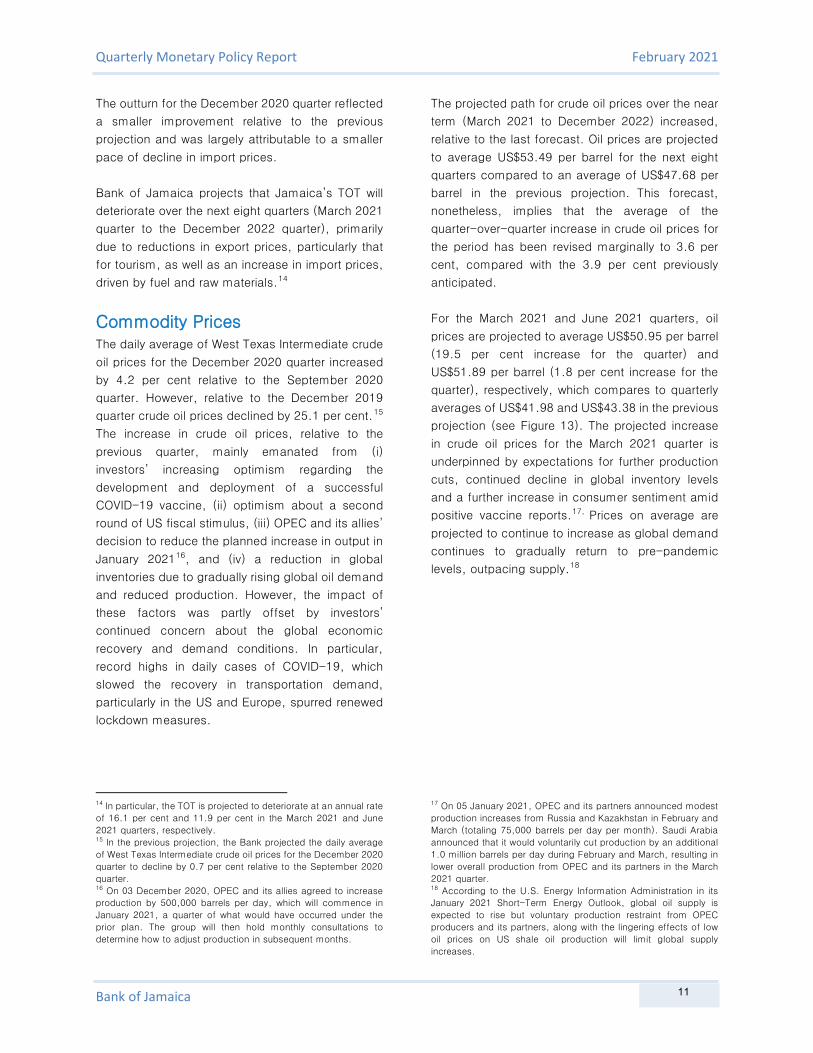
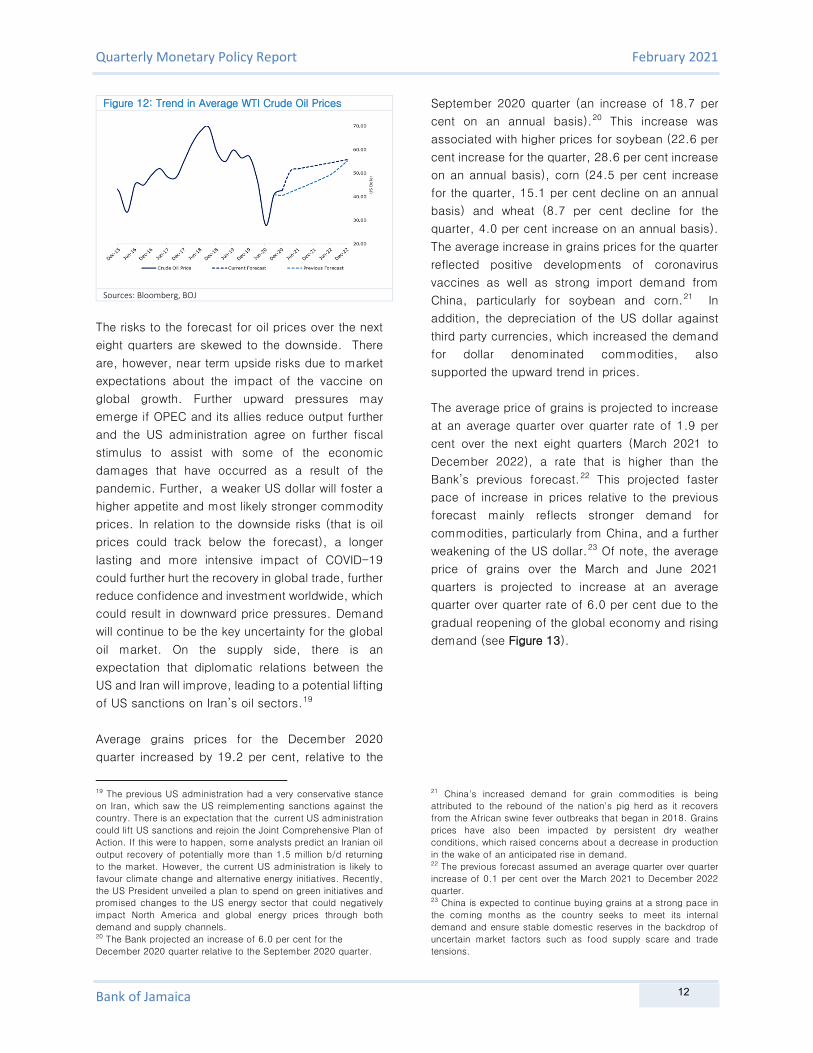
Commodity Prices The daily average of West Texas Intermediate crude
oil prices for the December 2020 quarter increased
by 4.2 per cent relative to the September 2020
quarter. However, relative to the December 2019
quarter crude oil prices declined by 25.1 per cent.15
The increase in crude oil prices, relative to the
previous quarter, mainly emanated from (i)
investors’ increasing optimism regarding the
development and deployment of a successful
COVID-19 vaccine, (ii) optimism about a second
round of US fiscal stimulus, (iii) OPEC and its allies’
decision to reduce the planned increase in output in
January 202116, and (iv) a reduction in global
inventories due to gradually rising global oil demand
and reduced production. However, the impact of
these factors was partly offset by investors’
continued concern about the global economic
recovery and demand conditions. In particular,
record highs in daily cases of COVID-19, which
slowed the recovery in transportation demand,
particularly in the US and Europe, spurred renewed
lockdown measures.
14 In particular, the TOT is projected to deteriorate at an annual rate
of 16.1 per cent and 11.9 per cent in the March 2021 and June
2021 quarters, respectively. 15 In the previous projection, the Bank projected the daily average
of West Texas Intermediate crude oil prices for the December 2020
quarter to decline by 0.7 per cent relative to the September 2020
quarter. 16 On 03 December 2020, OPEC and its allies agreed to increase
production by 500,000 barrels per day, which will commence in
January 2021, a quarter of what would have occurred under the
prior plan. The group will then hold monthly consultations to
determine how to adjust production in subsequent months.
The projected path for crude oil prices over the near
term (March 2021 to December 2022) increased,
relative to the last forecast. Oil prices are projected
to average US$53.49 per barrel for the next eight
quarters compared to an average of US$47.68 per
barrel in the previous projection. This forecast,
nonetheless, implies that the average of the
quarter-over-quarter increase in crude oil prices for
the period has been revised marginally to 3.6 per
cent, compared with the 3.9 per cent previously
anticipated.
For the March 2021 and June 2021 quarters, oil
prices are projected to average US$50.95 per barrel
(19.5 per cent increase for the quarter) and
US$51.89 per barrel (1.8 per cent increase for the
quarter), respectively, which compares to quarterly
averages of US$41.98 and US$43.38 in the previous
projection (see Figure 13). The projected increase
in crude oil prices for the March 2021 quarter is
underpinned by expectations for further production
cuts, continued decline in global inventory levels
and a further increase in consumer sentiment amid
positive vaccine reports.17, Prices on average are
projected to continue to increase as global demand
continues to gradually return to pre-pandemic
levels, outpacing supply.18
17 On 05 January 2021, OPEC and its partners announced modest
production increases from Russia and Kazakhstan in February and
March (totaling 75,000 barrels per day per month). Saudi Arabia
announced that it would voluntarily cut production by an additional
1.0 million barrels per day during February and March, resulting in
lower overall production from OPEC and its partners in the March
2021 quarter. 18 According to the U.S. Energy Information Administration in its
January 2021 Short-Term Energy Outlook, global oil supply is
expected to rise but voluntary production restraint from OPEC
producers and its partners, along with the lingering effects of low
oil prices on US shale oil production will limit global supply
increases.
11
Quarterly Monetary Policy Report February 2021
Bank of Jamaica
Figure 12: Trend in Average WTI Crude Oil Prices
Sources: Bloomberg, BOJ
The risks to the forecast for oil prices over the next
eight quarters are skewed to the downside. There
are, however, near term upside risks due to market
expectations about the impact of the vaccine on
global growth. Further upward pressures may
emerge if OPEC and its allies reduce output further
and the US administration agree on further fiscal
stimulus to assist with some of the economic
damages that have occurred as a result of the
pandemic. Further, a weaker US dollar will foster a
higher appetite and most likely stronger commodity
prices. In relation to the downside risks (that is oil
prices could track below the forecast), a longer
lasting and more intensive impact of COVID-19
could further hurt the recovery in global trade, further
reduce confidence and investment worldwide, which
could result in downward price pressures. Demand
will continue to be the key uncertainty for the global
oil market. On the supply side, there is an
expectation that diplomatic relations between the
US and Iran will improve, leading to a potential lifting
of US sanctions on Iran’s oil sectors.19
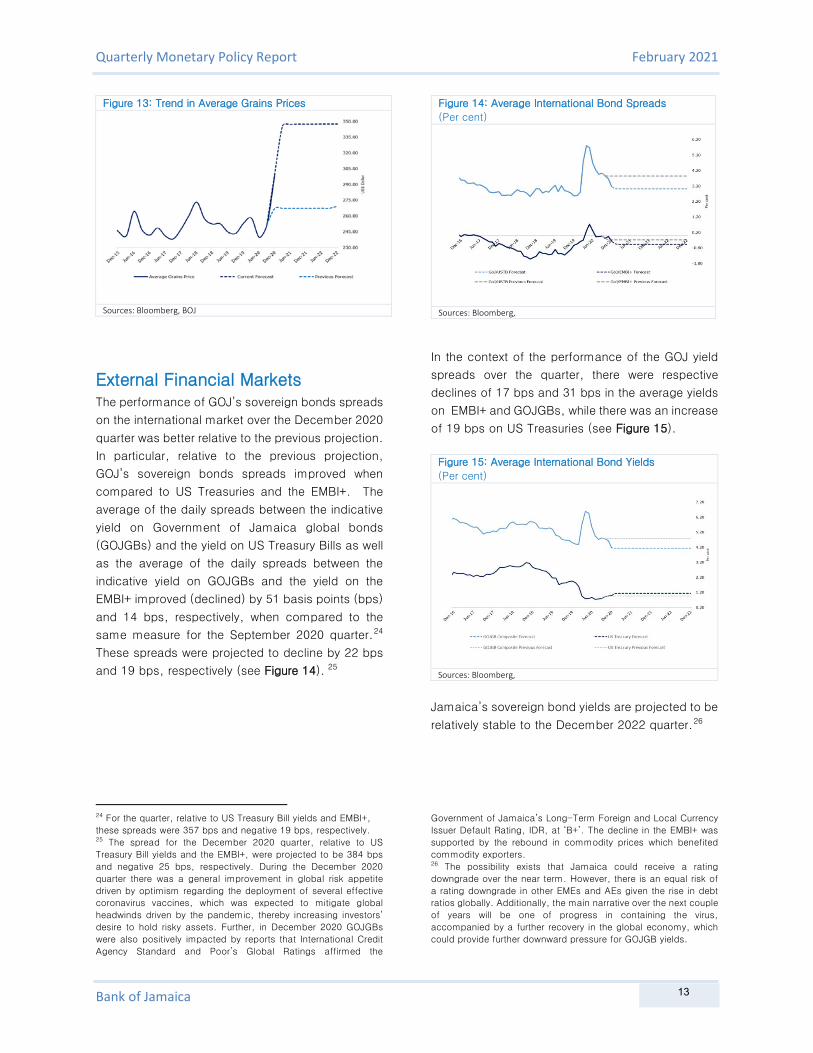
Average grains prices for the December 2020
quarter increased by 19.2 per cent, relative to the
19 The previous US administration had a very conservative stance
on Iran, which saw the US reimplementing sanctions against the
country. There is an expectation that the current US administration
could lift US sanctions and rejoin the Joint Comprehensive Plan of
Action. If this were to happen, some analysts predict an Iranian oil
output recovery of potentially more than 1.5 million b/d returning
to the market. However, the current US administration is likely to
favour climate change and alternative energy initiatives. Recently,
the US President unveiled a plan to spend on green initiatives and
promised changes to the US energy sector that could negatively
impact North America and global energy prices through both
demand and supply channels. 20 The Bank projected an increase of 6.0 per cent for the
December 2020 quarter relative to the September 2020 quarter.
September 2020 quarter (an increase of 18.7 per
cent on an annual basis).20 This increase was
associated with higher prices for soybean (22.6 per
cent increase for the quarter, 28.6 per cent increase
on an annual basis), corn (24.5 per cent increase
for the quarter, 15.1 per cent decline on an annual
basis) and wheat (8.7 per cent decline for the
quarter, 4.0 per cent increase on an annual basis).
The average increase in grains prices for the quarter
reflected positive developments of coronavirus
vaccines as well as strong import demand from
China, particularly for soybean and corn.21 In
addition, the depreciation of the US dollar against
third party currencies, which increased the demand
for dollar denominated commodities, also
supported the upward trend in prices.
The average price of grains is projected to increase
at an average quarter over quarter rate of 1.9 per
cent over the next eight quarters (March 2021 to
December 2022), a rate that is higher than the
Bank’s previous forecast.22 This projected faster
pace of increase in prices relative to the previous
forecast mainly reflects stronger demand for
commodities, particularly from China, and a further
weakening of the US dollar.23 Of note, the average
price of grains over the March and June 2021
quarters is projected to increase at an average
quarter over quarter rate of 6.0 per cent due to the
gradual reopening of the global economy and rising
demand (see Figure 13).
21 China's increased demand for grain commodities is being
attributed to the rebound of the nation's pig herd as it recovers
from the African swine fever outbreaks that began in 2018. Grains
prices have also been impacted by persistent dry weather
conditions, which raised concerns about a decrease in production
in the wake of an anticipated rise in demand. 22 The previous forecast assumed an average quarter over quarter
increase of 0.1 per cent over the March 2021 to December 2022
quarter. 23 China is expected to continue buying grains at a strong pace in
the coming months as the country seeks to meet its internal
demand and ensure stable domestic reserves in the backdrop of
uncertain market factors such as food supply scare and trade
tensions.
12
Quarterly Monetary Policy Report February 2021
Bank of Jamaica
Figure 13: Trend in Average Grains Prices
Sources: Bloomberg, BOJ
External Financial Markets The performance of GOJ’s sovereign bonds spreads
on the international market over the December 2020
quarter was better relative to the previous projection.
In particular, relative to the previous projection,
GOJ’s sovereign bonds spreads improved when
compared to US Treasuries and the EMBI+. The
average of the daily spreads between the indicative
yield on Government of Jamaica global bonds
(GOJGBs) and the yield on US Treasury Bills as well
as the average of the daily spreads between the
indicative yield on GOJGBs and the yield on the
EMBI+ improved (declined) by 51 basis points (bps)
and 14 bps, respectively, when compared to the
same measure for the September 2020 quarter.24
These spreads were projected to decline by 22 bps
and 19 bps, respectively (see Figure 14). 25
24 For the quarter, relative to US Treasury Bill yields and EMBI+,
these spreads were 357 bps and negative 19 bps, respectively. 25 The spread for the December 2020 quarter, relative to US
Treasury Bill yields and the EMBI+, were projected to be 384 bps
and negative 25 bps, respectively. During the December 2020
quarter there was a general improvement in global risk appetite
driven by optimism regarding the deployment of several effective
coronavirus vaccines, which was expected to mitigate global
headwinds driven by the pandemic, thereby increasing investors’
desire to hold risky assets. Further, in December 2020 GOJGBs
were also positively impacted by reports that International Credit
Agency Standard and Poor’s Global Ratings affirmed the
Figure 14: Average International Bond Spreads
(Per cent)
Sources: Bloomberg,
In the context of the performance of the GOJ yield
spreads over the quarter, there were respective
declines of 17 bps and 31 bps in the average yields
on EMBI+ and GOJGBs, while there was an increase
of 19 bps on US Treasuries (see Figure 15).
Figure 15: Average International Bond Yields
(Per cent)
Sources: Bloomberg,
Jamaica’s sovereign bond yields are projected to be
relatively stable to the December 2022 quarter.26
Government of Jamaica’s Long-Term Foreign and Local Currency
Issuer Default Rating, IDR, at ‘B+’. The decline in the EMBI+ was
supported by the rebound in commodity prices which benefited
commodity exporters. 26 The possibility exists that Jamaica could receive a rating
downgrade over the near term. However, there is an equal risk of
a rating downgrade in other EMEs and AEs given the rise in debt
ratios globally. Additionally, the main narrative over the next couple
of years will be one of progress in containing the virus,
accompanied by a further recovery in the global economy, which
could provide further downward pressure for GOJGB yields.
13

Quarterly Monetary Policy Report February 2021
Bank of Jamaica
Global Stock Market The performances of selected global stock market
indices during the December 2020 quarter were
strong. Relative to the September 2020 quarter, the
Dow Jones Industrial Average (DJIA) and the S&P
500, the Eurofirst 300 and the FTSE 100 advanced
by 10.2 per cent, 11.7 per cent, 9.8 per cent and
10.1 per cent, respectively (see Figure 16). While
the strong performances were supported by
continued monetary and fiscal stimulus, the major
catalyst stemmed from signs of economic recovery
and expectations of continued improvement based
on the deployment of several effective coronavirus
vaccines. This development was expected to
mitigate global headwinds driven by the pandemic,
thereby increasing investors’ desire to hold risky
assets. Further, the reduction in uncertainty
regarding the US Presidential election as well as the
agreement of a post-Brexit trade deal between the
European Union and United Kingdom played a
crucial role in increasing investors’ confidence.
US equities gained in the December 2020 quarter
with most of the gains recorded in November 2020
due to investors’ reaction to continued news about
the viability of multiple COVID-19 vaccines. There
were notable market gains in December 2020 as
vaccines were given emergency validation by the
World Health Organization and the United States
Food and Drug Administration, improving the
prospects for a durable recovery. Further, the
approval by Congress of a US$900 billion stimulus
package announced in late December 2020
supported the expectations of continued recovery in
the US economy and propelled stocks to record high
levels. The Federal Reserve also reinforced its
supportive message, stating it will continue with
current levels of quantitative easing and investors
remained confident that the central bank would
maintain interest rates at near zero levels for the
foreseeable future.
Eurozone and UK equities reversed the losses
recorded in the September 2020 quarter, propelled
by announcements of the efficacy of several
COVID-19 vaccine candidates and subsequent
emergency approval for distribution. Of note, a new
variant of the coronavirus was discovered in the UK
resulting in a new phase of lockdown measures. In
response, EU leaders agreed on a €1.8 trillion
(US$2.18 trillion) long-term budget and COVID-19
recovery package in December 2020. Further,
equities were positively impacted by easing
concerns around a disorderly Brexit as the exit trade
agreement between the United Kingdom and the
European Union was achieved before the 31
December 2020 deadline, which set out preferential
arrangements in areas such as trade in goods and
in services.
Figure 16: Selected Stock Market Indices
(Quarter–over-Quarter Per cent)
Source: Bloomberg
14

Quarterly Monetary Policy Report February 2021
Bank of Jamaica
3.0 Real Sector In the context of the impact of the coronavirus on the Jamaican economy, domestic economic activity is
projected to decline over the December 2020 to March 2021 quarters then rebound over the rest of the forecast
horizon. Consequently, for FY2020/21, real GDP is projected to fall in the range of 10.0 to 12.0 per cent and
recover partially in FY2021/22. Real GDP is anticipated to return to its pre-COVID level in the March 2023 quarter.
Over the medium term (the next three years), GDP growth is projected to average in the range 2.0 to 4.0 per
cent per year, which is above the previous projections. This growth largely reflects the expected rebound in
tourism and related industries as well as higher growth in mining.
The current forecast is higher than the previous projection over the near-term (March 2021 to December 2021).
In this regard, there are slightly higher projections for construction, agriculture and electricity, partly offset by
lower projections for tourism and related industries as well as manufacture. The output gap over the projection
horizon is expected to remain generally in line with the estimates at the last forecast. The risks to the forecast
for real GDP growth are skewed to the downside.
GDP Growth and Output Gap The Jamaican economy is estimated to have
contracted in the range 7.5 to 8.5 per cent for the
December 2020 quarter, an improvement relative to
to the contraction of 10.7 per cent recorded for the
September 2020 quarter and relative to the previous
projection. The estimated decline for the quarter
occurred in the context of the continued adverse
impact of the novel coronavirus on the economy and
measures implemented to contain its spread.1
Consequently, only Construction, Mining &
Quarrying and Government Services are estimated
to have grown. Reductions were chiefly reflected in
Hotels & Restaurants, Other Services, Transport &
Communication, Electricity & Water, Manufacture
and Agriculture, Forestry & Fishing.2
Worse than previously projected declines for the
review quarter are estimated for Electricity & Water,
Transport, Manufacture and Finance & Insurance. In
contrast, a slower pace of decline is estimated for
Hotel & Restaurants and Agriculture, Forestry &
1 During the December 2020 quarter, measures implemented to
contain the spread of the coronavirus included nightly curfews, stay
at home orders for person 70 years and older as well as restrictions
on gatherings. 2 Other Services include recreation, entertainment and sporting
activities. 3 Electricity consumption declined on average by 10.7 per cent for
the December 2020 quarter relative to the anticipated fall of 1.1
per cent.
Fishing while growth, rather than a decline, is now
estimated for the Construction industry. Higher
growth is also anticipated for Mining & Quarrying.
The upward revision to Mining is due to higher than
anticipated capacity utilization at the alumina plants
in the quarter. On the basis of available data, a
larger decline is estimated for Electricity.3 Value
added in Agriculture is anticipated to be higher than
previously projected given the lower than expected
impact of adverse weather conditions experienced
in the quarter.4 Manufacture is estimated to have
declined faster due to reductions in both food
production and petroleum refining.5 The stronger
decline in Transport is associated with a greater than
anticipated decline in the use of public
transportation and volume of cargo moving through
the ports. The downward revision to Finance
reflected trends in recent outturns, due to significant
declines in fees and service charges.
In the context of the decline in GDP for the
December 2020 quarter, Bank of Jamaica
estimated a negative output gap for the quarter, in
4 Data from the Ministry of Agriculture indicated that domestic crop
production fell by 7.6 per cent in the December 2020 quarter. This
is relative to the Bank’s previous projection for a decline of 15.0
per cent. 5 The decline in food production reflected lower output in most
categories, particularly food production and bakery products.
Sugar & molasses is anticipated to be flat for the period.
15

Quarterly Monetary Policy Report February 2021
Bank of Jamaica
line with the previous projection. This estimated
output gap was also smaller than the gap in the
September 2020 quarter but larger than the gap for
the December 2019 quarter.6
Aggregate Supply For the December 2020 quarter, value added in the
majority of the industries is estimated to have
declined. In contrast, Construction, Mining &
Quarrying and Producers of Government Services
are estimated to have grown. The estimated growth
in Construction reflected increases in all sub-
industries, while increased value added in mining
emanated from higher production at the bauxite and
alumina plants. Similarly, growth in Producers of
Government Services reflected greater services
offered to curb the spread of the coronavirus.
Value added for Hotels & Restaurants is estimated
to have declined at a slower pace in the December
2020 quarter (see Figure 17). The reduction for the
quarter was premised on lower foreign national
arrivals via air transport and cruise ships. Notably,
there have been no cruise arrivals since the re-
opening of the ports to incoming passengers in the
June 2020 quarter. Additionally, airport arrivals
continue to be affected by travel advisories in major
source markets as coronavirus cases surge in
advanced countries. This, along with the frequent
updates of curfew restrictions as well as an
increase in the number of confirmed coronavirus
cases in the Island, has resulted in lower bookings
for many hotels.
Transport, Storage & Communication is estimated
to have declined for the December 2020 quarter and
was also related to the reduction in air passenger
arrivals. Declines were also seen in road
transportation as well as in the movement of cargo
at the outports and public passenger transportation.
Electricity & Water Supply is estimated to have
contracted in the review quarter. This reduction
reflected a fall in electricity consumption (proxied by
total electricity sales) and water consumption during
6 The output gap is the difference between real GDP and the
potential output. Expressed in percentage form, the output gap
Figure 17: Trend in Visitor Days (12-Month Per
cent change)
Source: The Jamiaca Tourist Board
Table 2: Industry Contribution to Growth
(December 2020 Quarter)
Contribution Estimated Impact
on Growth GOODS -1.8 -1.0 to 0.0
Agriculture, Forestry &
Fishing -2.7 -3.5 to -2.5
Mining & Quarrying 1.4 6.5 to 7.5
Manufacture -6.5 -7.0 to -6.0
Construction 6.1 6.5 to 7.5 SERVICES -98.2 -11.5 to -10.5
Electricity & Water Supply -3.1 -9.0 to -8.0
Wholesale & Retail
Trade, Repairs &
Installation -13.9 -7.0 to -6.0
Hotels & Restaurants -37.7 -53.5 to -52.5
Transport Storage &
Communication -12.7 -10.5 to -9.5
Financing & Insurance
Services -7.3 -5.5 to -4.5
Real Estate, Renting &
Business Activities -3.1 -3.0 to -2.0
Producers of Government
Services 0.2 -0.5 to 0.5
Other Services -19.2 -23.0 to -22.0
Financial Intermediation
Services Indirectly Measured 1.5 2.5 to 3.5
Source: Bank of Jamaica
.
the review period. The decrease in electricity and
water consumption during the period may be
associated with lower usage in the context of the
continued closure of schools and some businesses
due to the pandemic.
measures the deviation of real GDP from its potential as a fraction
of potential output.
16

Quarterly Monetary Policy Report February 2021
Bank of Jamaica
The decline in Manufacturing for the review quarter
largely reflected a fall in both Other Manufacturing
and Food, Beverages & Tobacco. The reduction in
Other Manufacturing is associated mainly with
decreased production of refined petroleum during
the quarter. The decline in Food, Beverages &
Tobacco reflects a decrease in all categories,
particularly food excluding sugar.
Wholesale & Retail Trade is estimated to have
declined for the review quarter. This performance
was largely driven by a reduction in output levels in
the agriculture and manufacturing industries as well
as a an estimated decrease in imports of goods.
Value added for Agriculture, Forestry & Fishing is
estimated to have declined in the quarter. This
decline largely reflected reduction in domestic crop
production which was partly offset by an increase in
animal farming. The decline in domestic crop
production largely reflected the adverse impact of
the flood rains experienced in November 2020 that
resulted in many crops being damaged.7 With
regard to animal farming, the growth largely
reflected increases in broiler production due to
increased demand for baby chicks.
Value added for Mining & Quarrying for the
December 2020 quarter is estimated to have grown
relative to the corresponding quarter of 2019 when
Alpart was closed (see Figure 18). This growth
largely reflected growth in alumina production as
crude bauxite production declined.
Construction is estimated to have grown for the
review quarter. This performance was largely driven
by increases within civil engineering and building
installation. Activities related to civil engineering
were higher due to increased levels of expenditure
on road rehabilitation works. With regard to building
construction, NHT housing starts declined in the
quarter (see Figure 19).
7 For the December 2020, domestic crop production declined by
7.6 per cent.
Figure 18: Trends in Crude Bauxite, Alumina & Total
Bauxite Production (12-Month Per cent Change)
Source: Jamaica Bauxite Institute
Given the above changes, both non-tradable and
tradable industries are estimated to have contracted
for the review quarter. The decline in the tradable
sector was mainly attributed to Hotels &
Restaurants, Agriculture, Forestry & Fishing and
Transport, Storage & Communication while, for the
non-tradable sector, the decline was chiefly
associated with Other Services and Electricity &
Water Supply.
Figure 19: National Housing Trust Housing Starts
& Completion (12-Month Per cent change)
Source: The National Housing Trust
17

Quarterly Monetary Policy Report February 2021
Bank of Jamaica
Aggregate Demand From the perspective of aggregate demand, there
are also indications of a decline in spending for the
December 2020 quarter. This estimate reflected
reductions in net exports, investment and private
consumption.
Labour Market Developments Jamaica’s unemployment rate (UR) at October 2020
increased to 10.7 per cent, 3.5 percentage points
(pps) relative to the rate at October 2019. The
increase in the UR reflected a decline of 7.4 per cent
(96,200) in the employed labour force, in the
context of a reduction of 3.8 per cent (51,500) in
the labour force. The number of unemployed
persons increased by 42.5 per cent, while the labour
force participation rate fell by 2.5 pps to 62.0 per
cent.
In the context of the adverse impact of the novel
coronavirus, Bank of Jamaica projects that labour
market conditions will worsen over the next two
quarters before improving in the latter quarters. In
this regard, the average unemployment rate over the
March 2021 to December 2022 quarters is projected
to fall to 9.9 per cent.8 The employed labour force
is projected to grow (year over year), even while the
labour force is projected to increase marginally.
The anticipated increase in unemployment,
particularly over the next four quarters is lower than
the previous projection, reflecting the trend in
unemployment outturns evidenced in the previous
two surveys. Notwithstanding, unemployment is
anticipated to remain generally above pre-COVID
levels.
Outlook
Real GDP is projected to grow at an average rate of
3.5 to 4.5 per cent over the March 2021 to
8 This is the average unemployment rate of the three surveys
conducted by STATIN in 2020. 9 The recovery in real GDP is anticipated to begin in the June
2021 quarter.
December 2022 quarters but remain below potential
output. This forecast reflects an anticipated decline
in real GDP for the March 2021 quarter due to the
continuing impact of the novel coronavirus on the
economy and a partial recovery in subsequent
quarters. The projected growth in the economy
occurs in the context of continued accommodative
monetary conditions (see Monetary Conditions).
From the perspective of aggregate supply, a decline
is anticipated for the March 2021 quarter, which is
projected to be followed by growth over the
remaining quarters.9 For the March 2021 quarter,
the projected fall in real output is expected to be
mainly reflected in Hotels & Restaurants, Other
Services and Transport, Storage & Communication.
These declines are predicated on the continued
adverse impact of the novel coronavirus on travel
and entertainment activities. Hotels & Restaurants,
Transport, Storage & Communication and Other
Services will continue to be adversely affected by
the reduction in travel and lower activity at the ports,
which are generally in line with previous
expectations.10
Output in industries such as Manufacturing,
Electricity & Water, Finance & Insurance Services
and Wholesale & Retail is assumed to be affected
by lower demand. For Wholesale & Retail Trade,
lower value added is anticipated given the adverse
impact of lower output levels in the Manufacturing
and Agriculture industries as well as a decrease in
imports of goods. With regard to Electricity & Water,
electricity consumption is anticipated to be lower
given the decline in business activity, particularly in
the tourism and education sectors. For Finance &
Insurance, the decline is predicated on a reduction
in investments and security dealer activities as well
as a fall in insurance services (life and non-life).
Over the June 2021 to September 2022 quarters, a
partial rebound in real GDP is anticipated, buoyed
by both the goods and service industries. Growth is
10 Travel advisories have been issued by Jamaica which indicate
that visitors are required to quarantine for 14 days. Further,
restrictions on movement due to nightly curfew regulations have
resulted in the closure of entertainment activities which may
discourage incoming passengers.
18
Quarterly Monetary Policy Report February 2021
Bank of Jamaica
anticipated in Hotels & Restaurants, Other Services,
Mining & Quarrying, Construction, Manufacture and
Agriculture, Forestry & Fishing. The anticipated
rebound in Tourism and Other Services is consistent
with the improvement in the external economy. In
addition, a rebound in Mining is anticipated
reflecting a normalization of production from the
closure of Alpart in October 2019 and operational
challenges experienced by the other alumina plants.
For Construction, growth is based on a projected
increase in spending on the South Coast
Improvement Project as well as increased residential
and commercial construction. Value added in
Manufacture is largely predicated on increased food
production. With regards to Agriculture, Forestry &
Fishing, an improvement is anticipated given
expected investments in traditional crop production
and various initiatives by the Government to assist
the sector.
The forecast of aggregate spending supports the
outlook for real GDP over the next four quarters. The
projected reduction in the March 2021 quarter is
offset by the anticipated improvement in all
components in the latter quarters. The decline in
aggregate spending in the March 2021 quarter is in
the context of a deterioration in net exports as well
as declines in investment and consumption. The
deterioration in net exports is predicated on lower
travel inflows, partly offset by lower goods imports.
For investment, the reduction reflects declines in
both government capital expenditure and private
domestic investment. FDI inflows is anticipated to
improve given the re-start of two projects.11 The fall
in consumption is anticipated given lower incomes
and job losses due to the impact of the novel
coronavirus. This impact is partly offset by growth in
remittances while the increase in private sector
credit is projected to be in line with previous
projections over the forecast horizon (see Monetary
Aggregates).
11 These FDI projects are H10 phase 2 and Amatterra Hotel which
are proceeding on a limited scale due to the COVID-19
pandemic. 12 The previous 8 quarter forecast, which included the December
2020 quarter, was 2.6%. However, the current projection of 4.1
There has been an upward revision to GDP growth
over the near term (March 2021 to December 2021
quarters) relative to the previous forecast.12 This
revision is largely related to Construction,
Agriculture, Forestry & Fishing and Electricity. This
is partly offset by downward revisions to
Manufacture, Transport, Storage & Communication,
Mining & Quarrying and Finance & Insurance
Services. Consistent with the outlook for US GDP
growth, the projected growth for Hotels &
Restaurants remains broadly in line with the previous
forecast. For Construction, the revision reflects the
view that the buoyancy in the sector during the
September 2020 quarter will continue over the next
three quarters. Similarly, the upward revision to the
growth in Electricity reflects higher economic
activity, particularly towards the end of the year.
Finance & Insurance Services reflect trends in the
recent outturns while the lower value-added in
Manufacture is due to a slower than previously
anticipated pace of rebound in food production.
per cent is lower relative to the previous 8 quarter forecast of 4.4
per cent for the March 2021 to December 2022 period.
19
Quarterly Monetary Policy Report February 2021
Bank of Jamaica
4.0 Fiscal Accounts
Recent Developments
For the December 2020 quarter, Central
Government’s operations recorded a fiscal deficit of
$9.0 billion (0.5 per cent of GDP), in contrast to the
surplus of $9.7 billion (0.5 per cent of GDP) for the
December 2019 quarter. Similarly, the primary
surplus for the December 2020 quarter was $15.0
billion (0.8 per cent of GDP), compared to the
primary surplus of $32.0 billion (1.5 cent of GDP)
for the similar period of 2019. The fiscal outturn for
the review period reflected growth in expenditure as
well as lower revenues & grants, relative to the
corresponding period of 2019, both reflecting the
adverse impact of the Covid-19 pandemic.
The performance of Revenues & Grants for the
December 2020 quarter, was mainly attributable to
lower tax revenue partly offset by higher non-tax
revenue receipts. The slower pace of growth in tax
revenues emanated mainly from the production &
consumption and international trade categories and
to a lesser extent income & profit categories.
For the review quarter, increases were evident in all
categories of expenditure. Greater programme
spending was due to allocations for COVID-19
Allocation of Resources for Employees packages.
Higher compensation of employees may have
reflected increased employment of health
professionals to assist in curbing the virus as well as
additional recruitment of security personnel.
The financing requirement for Central Government
for the December 2020 quarter was $113.5 billion
(5.8 per cent of GDP) reflecting the fiscal deficit
noted above and amortization of $104.5 billion (5.3
per cent of GDP). In addition, Central Government
made payments of $1.2 billion (0.1 per cent of GDP)
to the National Water Commission.
The above noted expenses were financed by
domestic and external loan receipts of $98.8 billion
(5.1 per cent of GDP) and $20.8 billion (1.1 per cent
of GDP), respectively. For domestic loans, three
benchmark investment notes (BINs) amounting to
$79.5 billion (4.1 per cent of GDP) were issued to
the domestic capital market during the period. In
addition, Treasury bills issuances amounted to $5.0
billion (0.3 per cent of GDP). External loan receipts
amounted to US$143.1 million (1.1 per cent of
GDP) from multilateral agencies for investment
projects.
Domestic amortization for the December 2020
quarter amounted to $94.5 billion (4.8 per cent of
GDP) mainly reflecting a variable rate BIN of $89.5
billion as well as Treasury bills of $ 5.1 billion for the
quarter. External amortization included payments of
US$65.9 million (0.5 per cent of GDP) and US$1.6
million (0.01 per cent of GDP) to multilateral and
bilateral lending agencies, respectively. In addition,
there was amortization of US$4.9 million (0.04 per
cent of GDP) on loans borrowed from international
commercial banks as well as contingency payments
of US$0.2 million (0.001 per cent of GDP). Against
this background, there was a build-up of $7.1 billion
(0.4 per cent of GDP) in Central Government bank
balances.
20
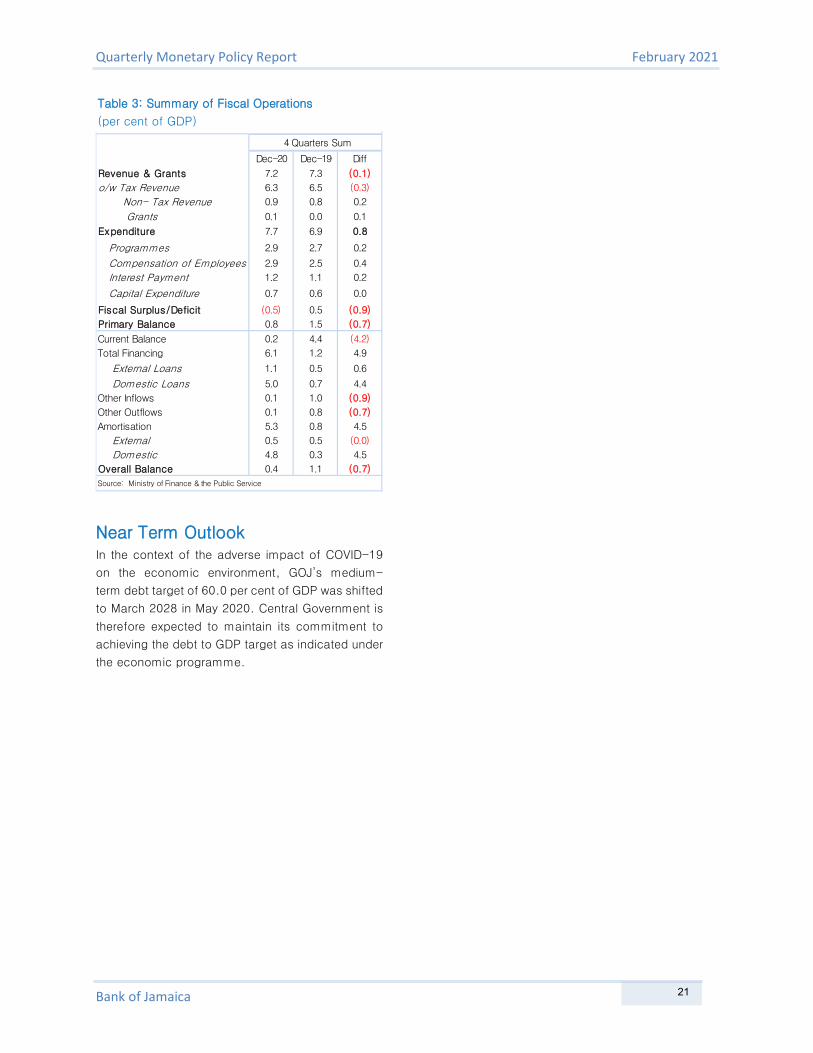
Quarterly Monetary Policy Report February 2021
Bank of Jamaica
Table 3: Summary of Fiscal Operations
(per cent of GDP)
Near Term Outlook In the context of the adverse impact of COVID-19
on the economic environment, GOJ’s medium-
term debt target of 60.0 per cent of GDP was shifted
to March 2028 in May 2020. Central Government is
therefore expected to maintain its commitment to
achieving the debt to GDP target as indicated under
the economic programme.
Dec-20 Dec-19 Diff
Revenue & Grants 7.2 7.3 (0.1)
o/w Tax Revenue 6.3 6.5 (0.3)
Non- Tax Revenue 0.9 0.8 0.2
Grants 0.1 0.0 0.1
Expenditure 7.7 6.9 0.8
Programmes 2.9 2.7 0.2
Compensation of Employees 2.9 2.5 0.4
Interest Payment 1.2 1.1 0.2
Capital Expenditure 0.7 0.6 0.0
Fiscal Surplus/Deficit (0.5) 0.5 (0.9)
Primary Balance 0.8 1.5 (0.7)
Current Balance 0.2 4.4 (4.2)
Total Financing 6.1 1.2 4.9
External Loans 1.1 0.5 0.6
Domestic Loans 5.0 0.7 4.4
Other Inflows 0.1 1.0 (0.9)
Other Outflows 0.1 0.8 (0.7)
Amortisation 5.3 0.8 4.5
External 0.5 0.5 (0.0)
Domestic 4.8 0.3 4.5
Overall Balance 0.4 1.1 (0.7)
4 Quarters Sum
Source: Ministry of Finance & the Public Service
21
Quarterly Monetary Policy Report February 2021
Bank of Jamaica
5.0 Balance of Payments The current account deficit (CAD) of the balance of payments (BOP) is projected to improve over the
next eight quarters (March 2021 – December 2022), relative to the previous forecast, by an average
of US$22.2 million per quarter. This improvement is largely underpinned by an upward revision to the
surplus on the services sub-account. In this context, the CAD as a percentage of GDP is projected
to average 2.8 per cent of GDP over the period FY2020/21 to FY2022/23, lower (better) than the
previous projection of 3.2 per cent of GDP. Over the medium-term (FY2020/21 to FY2025/26) the
CAD is expected to average 2.4 per cent of GDP. The outlook for the gross reserves has improved,
relative to the previous projection, due to a favourable outturn as at December 2020. The adequacy
of reserves has consequently improved in the near-term.
The risks to the projections for the CAD are skewed to the upside due to the possibility of lower visitor arrivals related to more stringent Covid-19 related travel requirements and lower growth in source market countries. The risks to reserves are skewed to the downside.
Recent Developments The current account (CA) of Jamaica’s balance of
payments for the September 2020 quarter
amounted to a surplus of US$70.4 million (0.5 per
cent of GDP), US$208.6 million higher (better) than
the outturn recorded for the September 2019
quarter. This improvement was reflected in all sub-
accounts, with the exception of services.
Relative to the Bank’s projection, the current
account surplus for the September 2020 quarter was
lower (worse) by US$2.6 million. The variance in the
CA was largely underpinned by a lower than
projected improvement on the current transfers sub-
account being partially offset by better than
projected improvements in the merchandise trade,
services and income sub-accounts. The surplus on
the current transfers sub-account was below
projection by US$43.4 million, mainly due to lower
remittance inflows. For the merchandise trade
balance, exports (f.o.b) were US$14.9 million below
1 Imports were below projection primarily due to lower fuel,
consumer goods, capital goods and transport equipment of
US$41.6 million, US$27.3 million, US$11.2 million, US$9.6 million,
respectively, partially offset by higher imports of raw materials of
US$40.2 million. Exports were higher than previously projected,
primarily due to higher than expected non-traditional exports of
US$18.8 million. Regarding the variance on non-traditional
exports, the main component was other non-traditional goods,
particularly food which grew 27.8 per cent for the September 2020
projection while imports were lower by US$51.4
million. The services account was above projection
by US$3.1 million. The income sub-account was
above projection by US$1.1 million.1
For the December 2020 quarter, a current account
deficit of US$24.4 million (0.2 per cent of GDP) is
estimated, US$65.6 million lower (better) than the
previous projection and US$3.8 million higher
(worse than) the outturn for the December 2019
quarter. This deterioration , relative to the previous
year, is reflected primarily in the services sub-
account which was partially offset by improvements
in the merchandise trade balance, current transfers
and the income sub-accounts. The deterioration on
the services balance reflects lower stop-over
arrivals. In contrast, the merchandise trade balance
is estimated to have improved due to a decline in
imports in the context of a slowdown in the domestic
economy and a fall in fuel prices.2 The estimated
quarter relative to the corresponding period of the previous year.
The Services account was higher than previously projected due to
lower transportation outflows in the context of lower than previously
projected imports.
2 Relative to the corresponding period of the previous year,
transport equipment, raw materials and consumer goods declined
by 25.2, 11.1 and 10.1 per cent, respectively. Fuel prices fell by
26.3 per cent.
22
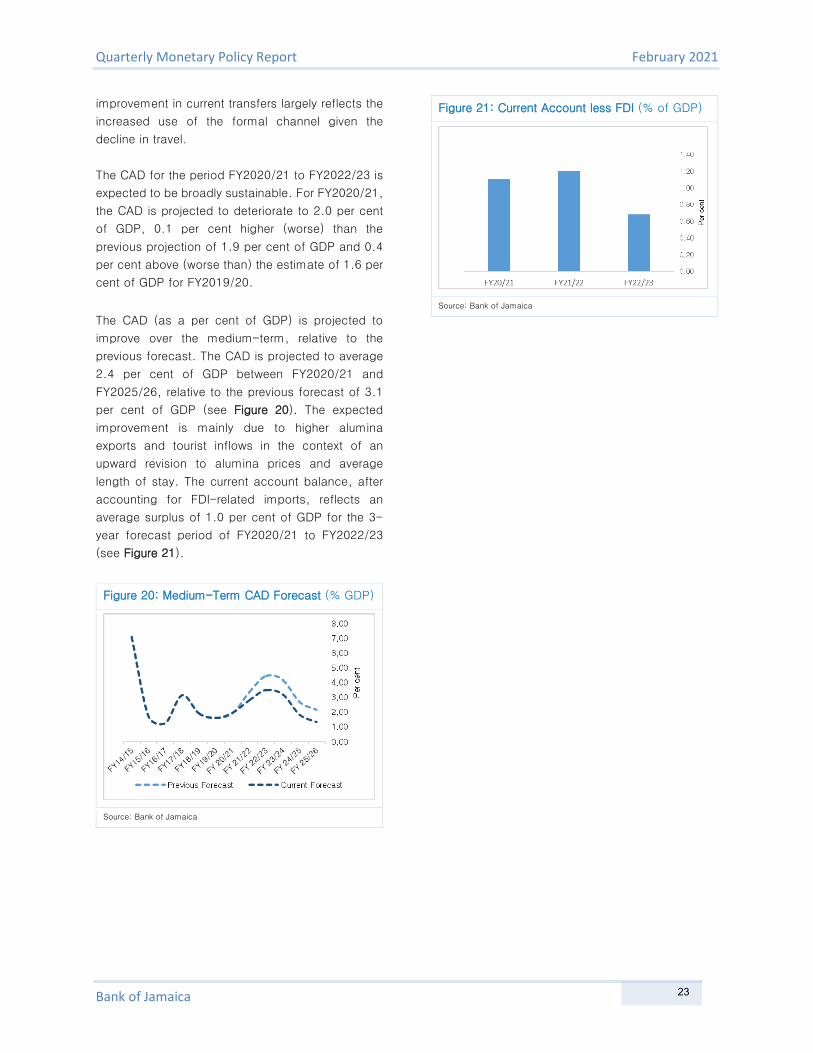
Quarterly Monetary Policy Report February 2021
Bank of Jamaica
improvement in current transfers largely reflects the
increased use of the formal channel given the
decline in travel.
The CAD for the period FY2020/21 to FY2022/23 is
expected to be broadly sustainable. For FY2020/21,
the CAD is projected to deteriorate to 2.0 per cent
of GDP, 0.1 per cent higher (worse) than the
previous projection of 1.9 per cent of GDP and 0.4
per cent above (worse than) the estimate of 1.6 per
cent of GDP for FY2019/20.
The CAD (as a per cent of GDP) is projected to
improve over the medium-term, relative to the
previous forecast. The CAD is projected to average
2.4 per cent of GDP between FY2020/21 and
FY2025/26, relative to the previous forecast of 3.1
per cent of GDP (see Figure 20). The expected
improvement is mainly due to higher alumina
exports and tourist inflows in the context of an
upward revision to alumina prices and average
length of stay. The current account balance, after
accounting for FDI-related imports, reflects an
average surplus of 1.0 per cent of GDP for the 3-
year forecast period of FY2020/21 to FY2022/23
(see Figure 21).
Figure 20: Medium-Term CAD Forecast (% GDP)
Source: Bank of Jamaica
Figure 21: Current Account less FDI (% of GDP)
Source: Bank of Jamaica
23
Quarterly Monetary Policy Report February 2021
Bank of Jamaica
6.0 Monetary Policy & Market Operations BOJ maintained its signal rate during the December 2020 quarter at 0.50 per cent. This decision was
based on the Bank’s assessment that inflation will generally continue to remain within the target of
4.0 per cent to 6.0 per cent over the next two years, notwithstanding the temporary impact on
agricultural prices from rains in the quarter.
In order to ensure the orderly functioning of the foreign exchange market during the December 2020
quarter, BOJ provided liquidity amounting to US$116.3 million via the B-FXITT facility.
Despite the Bank’s FX sales to the market, Jamaican dollar liquidity loosened, during the December
2020 quarter, relative to the preceding quarter.
BOJ maintained its signal rate at 0.5 per cent,
effective 18 December 2020.1 However, money
market rates generally increased, while GOJ
treasuries declined for the December 2020 quarter,
reflective of the uneven distribution of liquidity for
the period.
Liquidity Conditions Liquidity conditions during the December 2020
quarter improved relative to the September 2020
quarter. This was indicated by the maintenance of
average current account balances at Bank of
Jamaica of $67.2 billion by deposit-taking
institutions (DTIs) and primary dealers, above the
average of $48.7 billion for the preceding quarter
and the average level (of $57.3 billion) considered
adequate for the system.
Liquidity conditions over the December 2020 quarter
were more buoyant relative to the projections at the
last assessment. Financial institutions’ (FIs’)
average current account balances for the quarter
were higher than projected by $16.3 billion.2 The
higher than anticipated balances primarily reflected
net injection from BOJ operations of $9.6 billion into
the system during the quarter, which compares to
projected absorption of $8.7 billion. Higher net
injection from BOJ operations largely reflected net
1 Consequently, the SLF rate was maintained at 2.50 per cent
during the review quarter. Effective 18 March 2020, the limit on the
SLF was removed, therefore, the EFR is no longer applicable.
injection from BOJ FX operations of $41.1 billion,
which was $10.1 billion above projection. This
injection was partly offset by absorption through
other BOJ operations of $1.4 billion, which was $8.0
billion weaker than expected, partly due to lower
than expected currency issues. Absorption from
OMOs of $30.0 billion, was largely in line with the
projection. On the other hand, net injection of $8.9
billion through GOJ operations during the December
2020 quarter was $2.0 billion lower than projected.
(see Table 4).
Bank of Jamaica conducted 13 auctions of 30-day
CDs during the review quarter. The average offer
size during the December 2020 quarter was $6.8
billion, above the average of $5.4 billion for the
September 2020 quarter. The increase reflected the
actions of the central bank over the period to
sterilize excess liquidity levels in the financial system
following the maturity of a GOJ VR BIN of $89.5
billion on 07 October 2020. The average offer size
was higher than the average maturities of $5.9 billion
for the quarter. As a result of institutions’ high
demand for the instrument, the average yield on the
30-day CDs for the review quarter was 0.54 per
cent, 8 bps below the average for the September
2020 quarter.
BOJ continued to offer its weekly 14-day repos via
competitive auctions during the December 2020
2 Financial institutions refer to DTIs and primary dealers.
24

Quarterly Monetary Policy Report February 2021
Bank of Jamaica
quarter. Liquidity accessed via 14-day repos during
the quarter averaged $5.9 billion, relative to $11.0
billion in the September 2020 quarter. A total of 13
auctions were held during the review period,
equivalent to the previous quarter. All offers received
subscriptions which reflected an average yield of
1.27 per cent, 2 bps above the average yield in the
preceding quarter.3
Table 4: BOJ Liquidity Facility (J$ Billions)
BOJ Liquidity Flow
(J$ Billions)
Actual Actual Projected Actual Variance
Jun-20 Sep-20 Dec-
20
Dec-
20
Dec-
20
Net BOJ Operations
(Inject/Absorb) 46.6 -3.9 -8.7 9.6 18.3
Open Market
Operations -9.2 -21.9 -30.1 -30.0 0.1
BOJ Repo - (incl. OTROs)
1.0 -3.2 -0.6 1.9 2.4
FR CDs - (incl. 30d cds)
28.8 -3.5 -1.9 -4.2 -2.3
VR CDs 0.0 0.0 0.0 0.0 0.0
USD Indexed Notes
-39.0 -15.2 -27.7 -27.7 0.0
BOJ FX (incl. PSE) 11.0 25.7 30.9 41.1 10.1
BOJ Other 44.8 -7.8 -9.5 -1.4 8.0
o.w. Currency Issue
-11.5 -20.4 -7.1 -5.4 1.7
o.w. Cash Reserve (Com Banks)
5.0 6.8 -2.4 -2.5 0.0
o.w. other 3.4 5.5 0.0 6.5 6.4
GOJ Operations -31.3 -2.9 10.9 8.9 -2.0
Current A/C (+) =
Loosen; (-) =
Tighten
15.3 -6.9 2.3 18.5 16.3
Current A/C
Balance (AvgStock) 37.5 48.7 50.9 67.2 16.3
Notes: (+) = Inject; (-) = Absorb
Source: Bank of Jamaica
Strong foreign currency demand during the
December 2020 quarter and the associated
fluctuations in market conditions necessitated BOJ’s
foreign currency sale of US$116.3 million and the
provision of US$6.0 million via swap arrangements,
respectively. The swap arrangement partially
replaced the US$44.0 million that matured during
the quarter. There was also a small repayment of
USD CDs. There were no new issues of USD CDs
during the review period (see Table 5).
Table 5: Placements & Maturities of BOJ USD
Instruments
July – September 2020 October – December 2020
Placements Maturities Average Placements Maturities Average (US$MN) (US$MN) Rate (%) (US$MN) (US$MN) Rate (%)
3-year - 2.91 - - 0.00 -
5-year - 0.13 - - 0.03 -
TOTAL - 3.04 - - 0.03 -
Source: Bank of Jamaica
3 The decline in funds accessed via the 14-day repo facility was
in the context of increased liquidity, which coincided with the
maturity of the GOJ VR BIN.
25
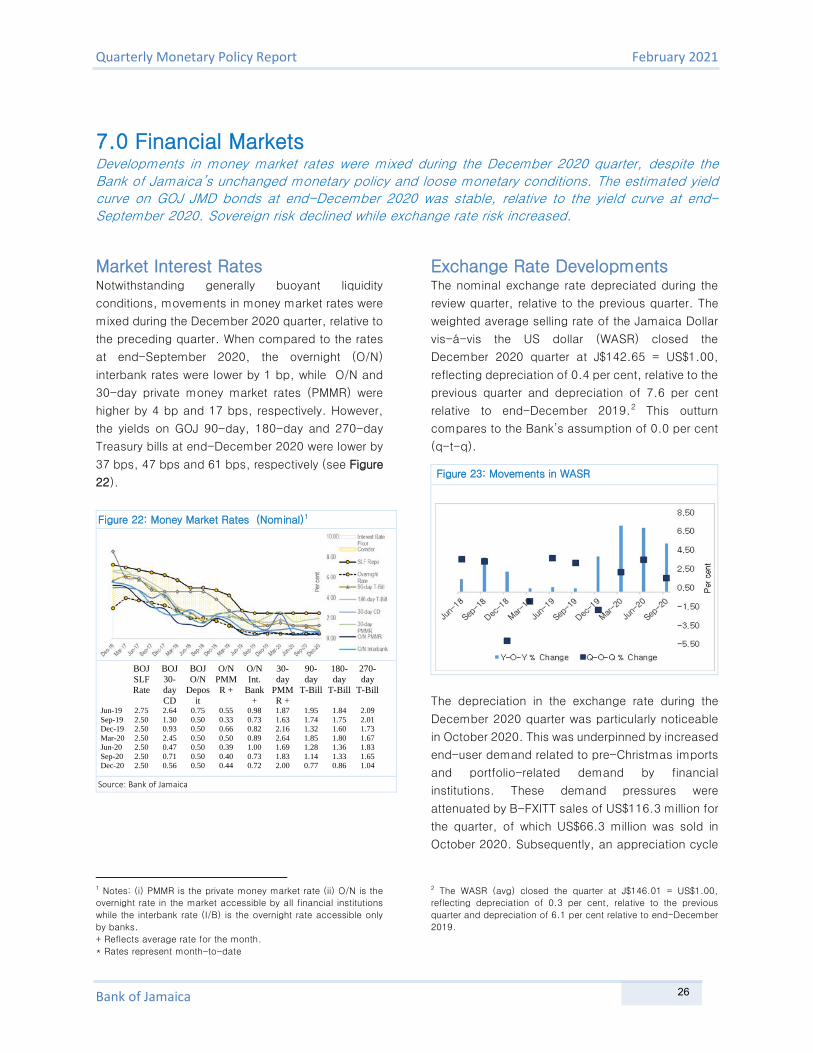
Quarterly Monetary Policy Report February 2021
Bank of Jamaica
7.0 Financial Markets Developments in money market rates were mixed during the December 2020 quarter, despite the Bank of Jamaica’s unchanged monetary policy and loose monetary conditions. The estimated yield curve on GOJ JMD bonds at end-December 2020 was stable, relative to the yield curve at end-September 2020. Sovereign risk declined while exchange rate risk increased.
Market Interest Rates Notwithstanding generally buoyant liquidity
conditions, movements in money market rates were
mixed during the December 2020 quarter, relative to
the preceding quarter. When compared to the rates
at end-September 2020, the overnight (O/N)
interbank rates were lower by 1 bp, while O/N and
30-day private money market rates (PMMR) were
higher by 4 bp and 17 bps, respectively. However,
the yields on GOJ 90-day, 180-day and 270-day
Treasury bills at end-December 2020 were lower by
37 bps, 47 bps and 61 bps, respectively (see Figure
22).
Figure 22: Money Market Rates (Nominal)1
BOJ SLF Rate
BOJ 30-day CD
BOJ O/N
Deposit
O/N PMMR +
O/N Int.
Bank +
30-day
PMMR +
90-day
T-Bill
180-day
T-Bill
270-day
T-Bill
Jun-19 2.75 2.64 0.75 0.55 0.98 1.87 1.95 1.84 2.09 Sep-19 2.50 1.30 0.50 0.33 0.73 1.63 1.74 1.75 2.01 Dec-19 2.50 0.93 0.50 0.66 0.82 2.16 1.32 1.60 1.73 Mar-20 2.50 2.45 0.50 0.50 0.89 2.64 1.85 1.80 1.67 Jun-20 2.50 0.47 0.50 0.39 1.00 1.69 1.28 1.36 1.83 Sep-20 2.50 0.71 0.50 0.40 0.73 1.83 1.14 1.33 1.65 Dec-20 2.50 0.56 0.50 0.44 0.72 2.00 0.77 0.86 1.04
Source: Bank of Jamaica
1 Notes: (i) PMMR is the private money market rate (ii) O/N is the
overnight rate in the market accessible by all financial institutions
while the interbank rate (I/B) is the overnight rate accessible only
by banks.
+ Reflects average rate for the month.
* Rates represent month-to-date
Exchange Rate Developments The nominal exchange rate depreciated during the
review quarter, relative to the previous quarter. The
weighted average selling rate of the Jamaica Dollar
vis-á-vis the US dollar (WASR) closed the
December 2020 quarter at J$142.65 = US$1.00,
reflecting depreciation of 0.4 per cent, relative to the
previous quarter and depreciation of 7.6 per cent
relative to end-December 2019.2 This outturn
compares to the Bank’s assumption of 0.0 per cent
(q-t-q).
The depreciation in the exchange rate during the
December 2020 quarter was particularly noticeable
in October 2020. This was underpinned by increased
end-user demand related to pre-Christmas imports
and portfolio-related demand by financial
institutions. These demand pressures were
attenuated by B-FXITT sales of US$116.3 million for
the quarter, of which US$66.3 million was sold in
October 2020. Subsequently, an appreciation cycle
2 The WASR (avg) closed the quarter at J$146.01 = US$1.00,
reflecting depreciation of 0.3 per cent, relative to the previous
quarter and depreciation of 6.1 per cent relative to end-December
2019.
Figure 23: Movements in WASR
26
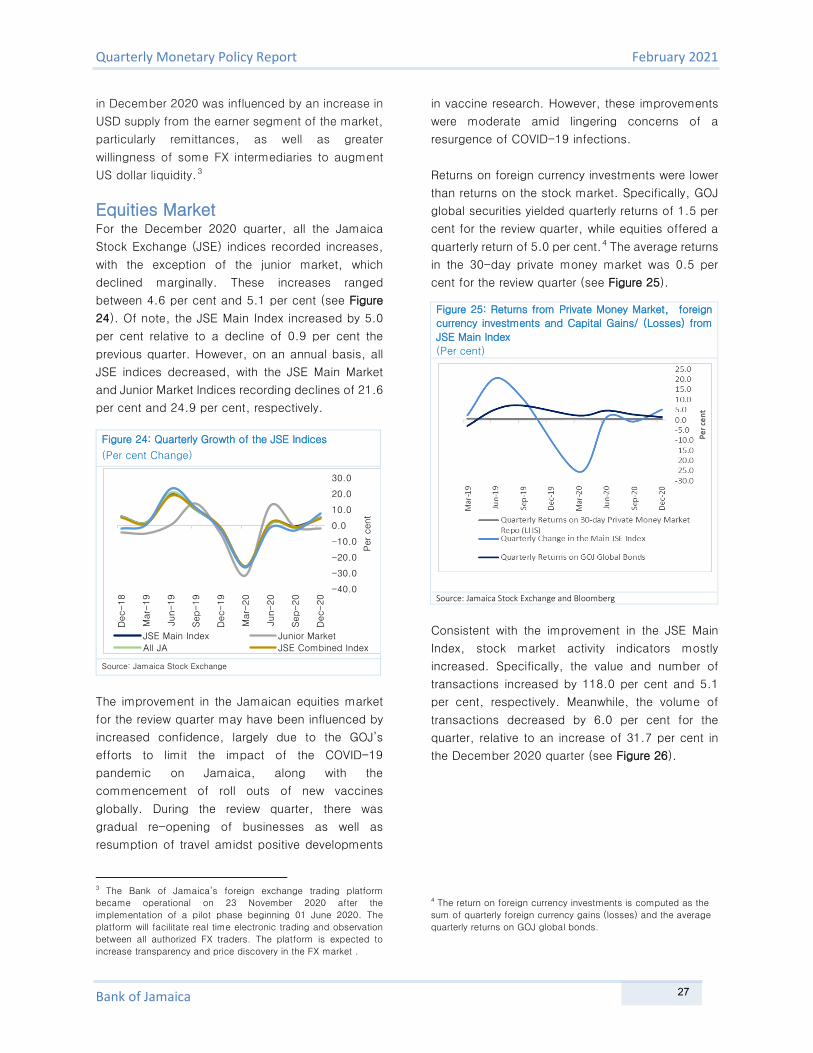
Quarterly Monetary Policy Report February 2021
Bank of Jamaica
in December 2020 was influenced by an increase in
USD supply from the earner segment of the market,
particularly remittances, as well as greater
willingness of some FX intermediaries to augment
US dollar liquidity.3
Equities Market For the December 2020 quarter, all the Jamaica
Stock Exchange (JSE) indices recorded increases,
with the exception of the junior market, which
declined marginally. These increases ranged
between 4.6 per cent and 5.1 per cent (see Figure
24). Of note, the JSE Main Index increased by 5.0
per cent relative to a decline of 0.9 per cent the
previous quarter. However, on an annual basis, all
JSE indices decreased, with the JSE Main Market
and Junior Market Indices recording declines of 21.6
per cent and 24.9 per cent, respectively.
Figure 24: Quarterly Growth of the JSE Indices
(Per cent Change)
Source: Jamaica Stock Exchange
The improvement in the Jamaican equities market
for the review quarter may have been influenced by
increased confidence, largely due to the GOJ’s
efforts to limit the impact of the COVID-19
pandemic on Jamaica, along with the
commencement of roll outs of new vaccines
globally. During the review quarter, there was
gradual re-opening of businesses as well as
resumption of travel amidst positive developments
3 The Bank of Jamaica’s foreign exchange trading platform
became operational on 23 November 2020 after the
implementation of a pilot phase beginning 01 June 2020. The
platform will facilitate real time electronic trading and observation
between all authorized FX traders. The platform is expected to
increase transparency and price discovery in the FX market .
in vaccine research. However, these improvements
were moderate amid lingering concerns of a
resurgence of COVID-19 infections.
Returns on foreign currency investments were lower
than returns on the stock market. Specifically, GOJ
global securities yielded quarterly returns of 1.5 per
cent for the review quarter, while equities offered a
quarterly return of 5.0 per cent.4 The average returns
in the 30-day private money market was 0.5 per
cent for the review quarter (see Figure 25).
Consistent with the improvement in the JSE Main
Index, stock market activity indicators mostly
increased. Specifically, the value and number of
transactions increased by 118.0 per cent and 5.1
per cent, respectively. Meanwhile, the volume of
transactions decreased by 6.0 per cent for the
quarter, relative to an increase of 31.7 per cent in
the December 2020 quarter (see Figure 26).
4 The return on foreign currency investments is computed as the
sum of quarterly foreign currency gains (losses) and the average
quarterly returns on GOJ global bonds.
Dec-18
Mar-
19
Jun-19
Sep-19
Dec-19
Mar-
20
Jun-20
Sep-20
Dec-20
-40.0
-30.0
-20.0
-10.0
0.0
10.0
20.0
30.0
Per
cent
JSE Main Index Junior Market
All JA JSE Combined Index
Figure 25: Returns from Private Money Market, foreign
currency investments and Capital Gains/ (Losses) from
JSE Main Index
(Per cent)
Source: Jamaica Stock Exchange and Bloomberg
27

Quarterly Monetary Policy Report February 2021
Bank of Jamaica
Figure 26: Quarterly Change in the Monthly Volumes,
Values Traded & Number of Transactions (Main JSE
Index) (Per cent)
Source: Jamaica Stock Exchange
The price performance of the stocks on the JSE
Main Index, as measured by the advance to decline
ratio, was 26:14 for the December 2020 quarter.
Of note, stock price appreciation was largely
concentrated among the Financial sector.
Meanwhile, the Manufacturing and Other categories
accounted for most of the declining stocks for the
December 2020 quarter (see Tables 6 and 7)
Table 6: Stock Price Appreciation
Advancing Per cent
Financial
Sygnus Credit Investments Limited
USD 380.15
Eppley Limited 33.97
JMMB Group Limited 14.49
Communication
Radio Jamaica 41.3
Tourism
Ciboney Group 37.50
Other
Margaritaville (Turks) Limited 34.80
Supreme Ventures 24.89
Manufacturing 19.93
Caribbean Cement Company 32.99
Berger Paints (Jamaica) 19.83
Seprod Limited 16.20
Table 7: Stock Price Depreciation
Declining Per cent
Other
138 Student Living Jamaica Limited -19.06
Pulse Investments -3.98
Wigton Windfarm Limited -3.85
Financial
Barita Investments Limited -14.60
Sygnus Credit Investments Limited -12.02
Scotia Group Jamaica -11.42
Proven Investments Limited -7.88
Mayberry Investments Limited -4.00
QWI Investments Limited -3.80
Manufacturing
Kingston Wharves -5.60
28

Quarterly Monetary Policy Report February 2021
Bank of Jamaica
8.0 Monetary Aggregates Growth in the monetary aggregates and credit to the private sector as at December 2020 were faster
than previously projected.
Over the ensuing eight quarters, the average annual growth rate in base money is expected to be
lower than the previous projection, while growth in broad money remains in line. However, the annual
growth rate in private sector credit is expected to be slightly above the previous projection
Money The annual growth in the monetary base as at
December 2020 was 27.9 per cent, relative to the
previous projection of 23.4 per cent and above the
growth of 20.8 per cent at September 2020. This
stronger growth reflected higher than anticipated
current account balances as well as marginally
higher than expected cash reserves. This is in a
context where the growth in currency was in line with
projections.
Table 8: Bank of Jamaica Balance Sheet (Analytical Presentation) Stock (J$MN) Flow (%)
Dec-19 Sep-20 Dec-20 Qtr. –o- Qtr. Y-o-Y
NIR (US$MN) 3,162.54 2,747.49 3,126.13 13.8 -1.2
NIR(J$MN) 419,138.93 389,247.96 445,328.15 14.4 6.2
- Assets 481,237.49 526,087.24 581,364.44 10.5 20.8
- Liabilities -62,098.56 -136,839.28 -136,036.29 -0.6 119.1
Net Domestic Assets -198,185.33 -123,393.84 -162,755.16 -31.9 17.9
- Net Claims on Public Sector 80,983.49 211,632.04 222,068.31 4.9 174.2
- Net Credit to Banks -67,433.60 -66,981.90 -69,050.62 3.1 2.4
- Open Market Operations -45,884.53 -76,564.65 -124,035.72 62.0 170.3
- Other -165,850.68 -191,479.34 -191,737.13 0.1 15.6
-o/w USD FR CDs -27,270.38 -19,618.25 -19,612.57 0.0 -28.1
Monetary Base 220,953.60 265,854.12 282,573.00 6.3 27.9
- Currency Issue 148,863.65 170,033.01 190,488.13 12.0 28.0
- Cash Reserve 45,976.05 37,093.77 39,116.50 5.5 -14.9
- Current Account 26,113.90 58,727.34 52,968.37 -9.8 102.8
Source: Bank of Jamaica
Regarding the sources of the change in the monetary
base at December 2020, there was an increase of
17.9 per cent in the net domestic assets (NDA), the
impact of which was supported by an increase of 6.2
per cent in the Bank of Jamaica’s net international
reserves (NIR) (see Table 10). The growth in the
Jamaica dollar equivalent of the NIR was associated
with a depreciation in the exchange rate, while there
1 The annual increase in net claims on public sector largely
reflected increased holdings of GOJ securities, in addition to lower
Central Government deposits. Increased holdings of GOJ
securities reflected $49.5 billion and $1.4 billion of outright
purchases of GOJ VR BINs and GOJ FR BINs, respectively, on the
was a decline in the USD value of the NIR stock. The
decline in the USD NIR stock was influenced by
outflows from Government of Jamaica, as well as
net B-FXITT sales of US$419.8 million over the year.
These outflows were largely offset by net purchases
via the public sector entities (PSE) facility. The net
claims on public sector contributed to the increase
in the NDA.1
secondary market, and receipt of $21.7 billion in GOJ FR BINs
from Central Government for past due losses. The Bank also
purchased $40.5 billion in GOJ FR BINs directly from the GOJ,
while $20.5 billion in VR BINs matured.
29

Quarterly Monetary Policy Report February 2021
Bank of Jamaica
The expansion in M2J at November 2020 was
underpinned by growth of 11.9 per cent in local
currency deposits, a deceleration relative to the 19.7
per cent recorded at end-September 2020. The
deceleration in the growth in deposits reflected a
slowdown in the growth in demand and savings
deposits, to 17.3 per cent and 17.1 per cent,
respectively, relative to growth of 22.1 per cent and
17.8 per cent in September 2020. In addition, time
deposits declined by 14.2 per cent for the period
relative to a growth of 20.7 per cent in September
2020.
Table 9: Components of Money Supply (M2*)
Percentage Change (%)
Nov-19 Sept-20 Nov-20
Total Money Supply (M2*) 15.6 20.6 17.8
Money Supply (M2J) 19.5 21.1 14.6
Money Supply (M1J) 18.5 24.1 21.0
Currency with the
public 16.5 27.1 26.8
Demand Deposits 19.8 22.1 17.3
Quasi Money 20.5 18.4 9.1
Savings Deposits 16.4 17.8 17.1
Time Deposits 34.0 20.7 -14.2
Foreign Currency Deposits 9.0 19.8 23.8
Source: Bank of Jamaica
Private Sector Credit Growth in private sector loans and advances
moderated relative to the previous quarter. Loans
and advances (including domestic and foreign
currency denominated loans) to the non-financial
private sector by deposit-taking institutions (DTIs)
expanded by 11.5 per cent at November 2020. This
was below the growth of 12.2 per cent as at
September 2020. Relative to GDP, the stock of
private sector loans at November 2020 was 45.4 per
cent compared with 38.8 per cent a year earlier.
Given the deceleration in the expansion of loans and
advances, the improvement in the ratio to was
largely attributed to a slower growth in GDP.
This growth in loans and advances was underpinned
by expansions of 14.7 per cent and 9.2 per cent in
credit to the productive sector and individuals,
respectively. Growth in loans to the productive sector
was mainly attributed to growth in loans to the
Tourism, Other Professional, and Construction and
Land Development.
Table 10: Select Private Sector Financing Indicators
(12-month Percentage Change)
Stock Nov-19 Sep-20 Nov-20
Total DTI 16.8 12.2 11.5
o.w. to
Businesses 17.2 15.7 14.7
o.w. to
Consumers 16.4 9.6 9.2
Stock as a % of Annual GDP
Total DTI 38.8 45.2 45.4
o.w. to
Businesses 16.1 19.3 19.4
o.w. to
Consumers 22.7 25.9 26.1
Source: Bank of Jamaica
30
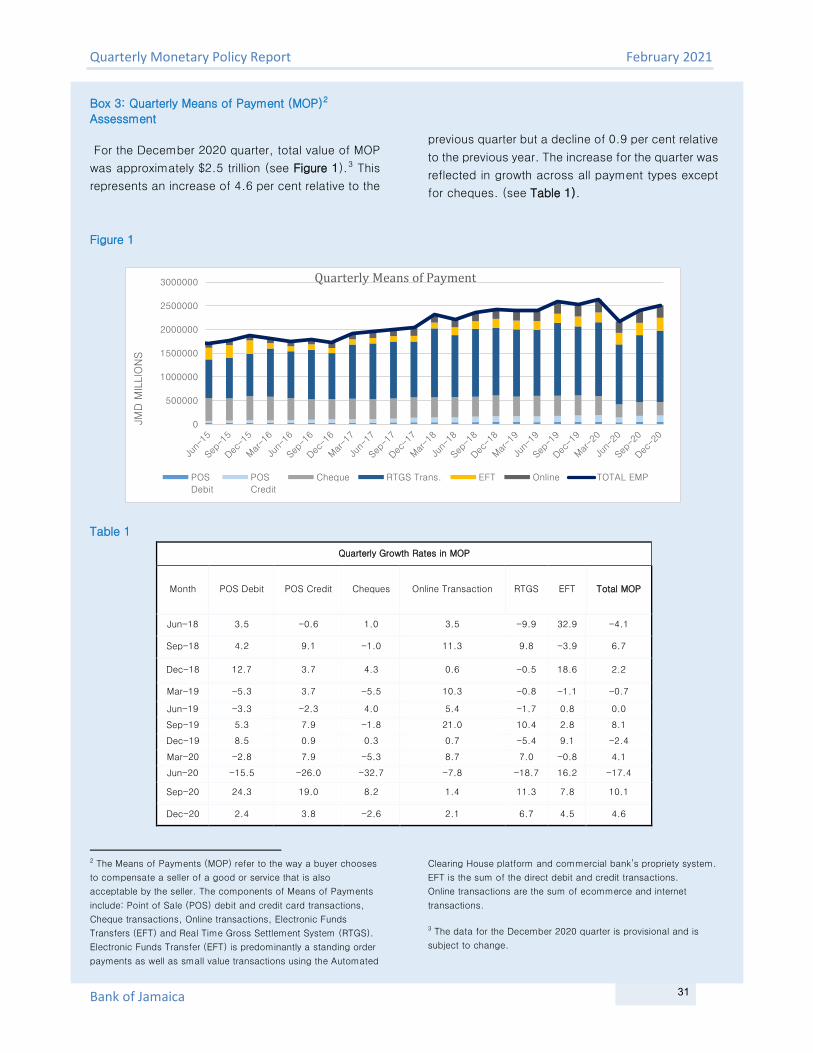
Quarterly Monetary Policy Report February 2021
Bank of Jamaica
Box 3: Quarterly Means of Payment (MOP)2
Assessment
For the December 2020 quarter, total value of MOP
was approximately $2.5 trillion (see Figure 1).3 This
represents an increase of 4.6 per cent relative to the
previous quarter but a decline of 0.9 per cent relative
to the previous year. The increase for the quarter was
reflected in growth across all payment types except
for cheques. (see Table 1).
Figure 1
Table 1
Quarterly Growth Rates in MOP
Month POS Debit POS Credit Cheques Online Transaction RTGS EFT Total MOP
Jun-18 3.5 -0.6 1.0 3.5 -9.9 32.9 -4.1
Sep-18 4.2 9.1 -1.0 11.3 9.8 -3.9 6.7
Dec-18 12.7 3.7 4.3 0.6 -0.5 18.6 2.2
Mar-19 -5.3 3.7 -5.5 10.3 -0.8 -1.1 -0.7
Jun-19 -3.3 -2.3 4.0 5.4 -1.7 0.8 0.0
Sep-19 5.3 7.9 -1.8 21.0 10.4 2.8 8.1
Dec-19 8.5 0.9 0.3 0.7 -5.4 9.1 -2.4
Mar-20 -2.8 7.9 -5.3 8.7 7.0 -0.8 4.1
Jun-20 -15.5 -26.0 -32.7 -7.8 -18.7 16.2 -17.4
Sep-20 24.3 19.0 8.2 1.4 11.3 7.8 10.1
Dec-20 2.4 3.8 -2.6 2.1 6.7 4.5 4.6
2 The Means of Payments (MOP) refer to the way a buyer chooses
to compensate a seller of a good or service that is also
acceptable by the seller. The components of Means of Payments
include: Point of Sale (POS) debit and credit card transactions,
Cheque transactions, Online transactions, Electronic Funds
Transfers (EFT) and Real Time Gross Settlement System (RTGS).
Electronic Funds Transfer (EFT) is predominantly a standing order
payments as well as small value transactions using the Automated
Clearing House platform and commercial bank’s propriety system.
EFT is the sum of the direct debit and credit transactions.
Online transactions are the sum of ecommerce and internet
transactions.
3 The data for the December 2020 quarter is provisional and is
subject to change.
0
500000
1000000
1500000
2000000
2500000
3000000
JMD
MIL
LIO
NS
Quarterly Means of Payment
POS
Debit
POS
Credit
Cheque RTGS Trans. EFT Online TOTAL EMP
31
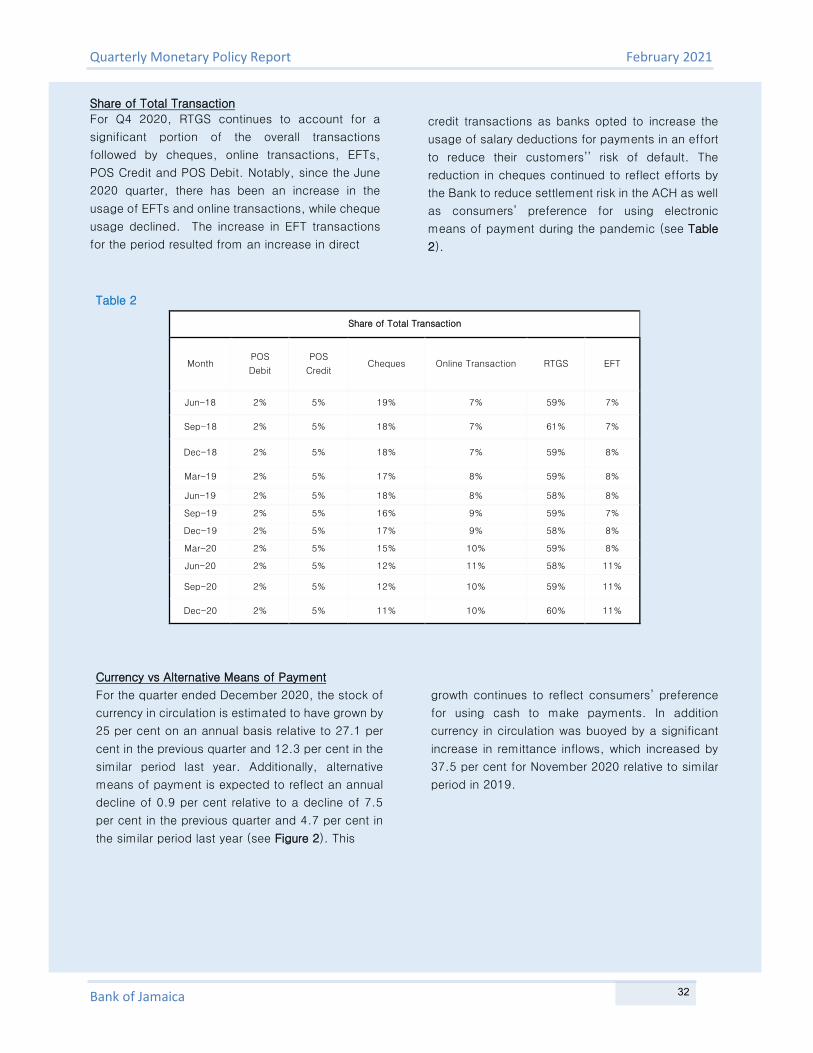
Quarterly Monetary Policy Report February 2021
Bank of Jamaica
Share of Total Transaction
For Q4 2020, RTGS continues to account for a
significant portion of the overall transactions
followed by cheques, online transactions, EFTs,
POS Credit and POS Debit. Notably, since the June
2020 quarter, there has been an increase in the
usage of EFTs and online transactions, while cheque
usage declined. The increase in EFT transactions
for the period resulted from an increase in direct
credit transactions as banks opted to increase the
usage of salary deductions for payments in an effort
to reduce their customers’’ risk of default. The
reduction in cheques continued to reflect efforts by
the Bank to reduce settlement risk in the ACH as well
as consumers’ preference for using electronic
means of payment during the pandemic (see Table
2).
Table 2
Share of Total Transaction
Month POS
Debit
POS
Credit Cheques Online Transaction RTGS EFT
Jun-18 2% 5% 19% 7% 59% 7%
Sep-18 2% 5% 18% 7% 61% 7%
Dec-18 2% 5% 18% 7% 59% 8%
Mar-19 2% 5% 17% 8% 59% 8%
Jun-19 2% 5% 18% 8% 58% 8%
Sep-19 2% 5% 16% 9% 59% 7%
Dec-19 2% 5% 17% 9% 58% 8%
Mar-20 2% 5% 15% 10% 59% 8%
Jun-20 2% 5% 12% 11% 58% 11%
Sep-20 2% 5% 12% 10% 59% 11%
Dec-20 2% 5% 11% 10% 60% 11%
Currency vs Alternative Means of Payment
For the quarter ended December 2020, the stock of
currency in circulation is estimated to have grown by
25 per cent on an annual basis relative to 27.1 per
cent in the previous quarter and 12.3 per cent in the
similar period last year. Additionally, alternative
means of payment is expected to reflect an annual
decline of 0.9 per cent relative to a decline of 7.5
per cent in the previous quarter and 4.7 per cent in
the similar period last year (see Figure 2). This
growth continues to reflect consumers’ preference
for using cash to make payments. In addition
currency in circulation was buoyed by a significant
increase in remittance inflows, which increased by
37.5 per cent for November 2020 relative to similar
period in 2019.
32

Quarterly Monetary Policy Report February 2021
Bank of Jamaica
Figure 2
The components of Means of Payments include:
Point of Sale (POS) debit and credit card
transactions, cheque transactions, online
transactions, Electronic Funds Transfers (EFT) a nd
Real Time Gross Settlement System (RTGS).
Electronic Funds Transfer (EFT) predominantly
include standing order payments as well as small
value transactions using the Automated Clearing
House platform and commercial bank’s propriety
system. EFT is the sum of the direct debit and credit
transactions.
There has been a continuous increase in the use of
alternative means of payment since June 2015. This
trend is a result of an increase in the availability of
technology as well as efforts made by banks to
promote cashless and online transactions.
Notwithstanding, since the June 2020 quarter, there
was a decline in the level of total MOP relative to the
corresponding period in 2019. This reduction may
reflect the impact of job losses as a result of the
Covid-19 pandemic on overall spending in the
economy.
12.3
27.125.0
4.7
-7.5
-0.9
-25.0
-15.0
-5.0
5.0
15.0
25.0
35.0
Chan
ge Y
-T-Y
Growth in Currency v/s Alt Means of Payment
Curr-Circulating TOTAL EMP
33
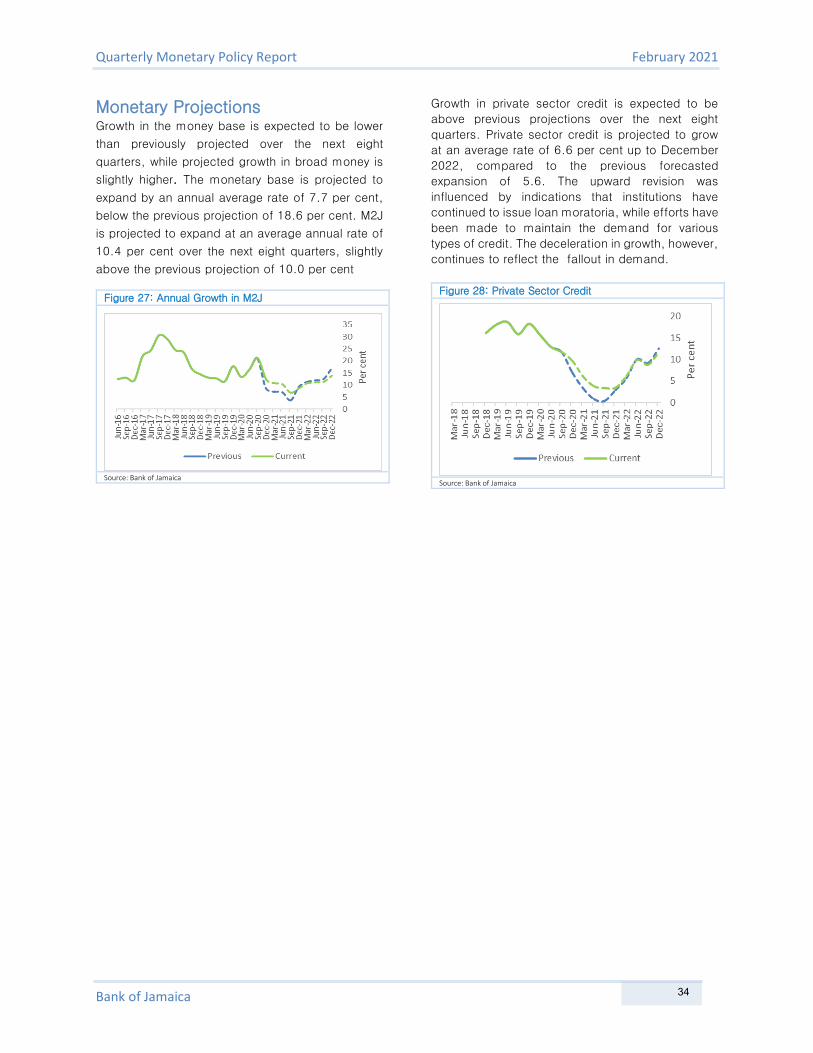
Quarterly Monetary Policy Report February 2021
Bank of Jamaica
Monetary Projections Growth in the money base is expected to be lower
than previously projected over the next eight
quarters, while projected growth in broad money is
slightly higher. The monetary base is projected to
expand by an annual average rate of 7.7 per cent,
below the previous projection of 18.6 per cent. M2J
is projected to expand at an average annual rate of
10.4 per cent over the next eight quarters, slightly
above the previous projection of 10.0 per cent
Figure 27: Annual Growth in M2J
Source: Bank of Jamaica
Growth in private sector credit is expected to be
above previous projections over the next eight
quarters. Private sector credit is projected to grow
at an average rate of 6.6 per cent up to December
2022, compared to the previous forecasted
expansion of 5.6. The upward revision was
influenced by indications that institutions have
continued to issue loan moratoria, while efforts have
been made to maintain the demand for various
types of credit. The deceleration in growth, however,
continues to reflect the fallout in demand.
Figure 28: Private Sector Credit
Source: Bank of Jamaica
34

Quarterly Monetary Policy Report February 2021
Bank of Jamaica
9.0 Conclusion
Lockdowns and other measures to slow the spread
of COVID-19 were tightened in the December 2020
quarter. Consequently, global growth will normalise
at a slower than earlier anticipated pace in the
March 2021 quarter but rebound faster thereafter.
The duration of the global pandemic remains highly
uncertain and there is much risk of a stronger
resurgence of new cases as governments attempt
to restart their economies. The projections for
international commodity prices over the next eight
quarters have nonetheless been revised upwards,
relative to the previous forecast. The Bank
anticipates that external monetary conditions will
remain accommodative.
Inflation is projected to average 5.0 per cent over
the next eight quarters (March 2021 to December
2022), within the target range of 4.0 per cent to 6.0
per cent. This is lower relative to the previous
projections of 5.3 per cent. This revision is primarily
driven by lower agricultural food price inflation and
electricity costs, despite a higher trajectory for
processed foods, energy and transport inflation.
The outlook for GDP growth in the Jamaican
economy has improved relative to the previous
projections, primarily influenced by the revised
outlook for construction. The near-term outlook is
for real GDP to contract in the range 10.0 to 12.0
per cent for FY2020/21 but recover partially in the
range of 4.0 to 8.0 per cent the next year. The
output gap over the near term is broadly in line with
previous forecast. The risks to the forecast for real
GDP growth remain skewed to the downside.
Jamaica’s CAD has improved relative to the
previous forecast and is projected to average 3.2
per cent of GDP over the period FY2020/21 to
FY2025/26. The outlook for the gross reserves has
improved relative to the previous projection mainly
due to the outturn for the December 2020 quarter.
The risks to the projections for the CAD and the
reserves are balanced.
The central bank has maintained its policy rate at
0.50 per cent over the past year. The effects of this
stance are helping to maintain inflation within the
target range 4.0 to 6.0 per cent as well as support
economic activity in the context of the current crisis.
Going forward, the central bank is committed to
ensuring that inflation remains low, stable and
predictable.
35
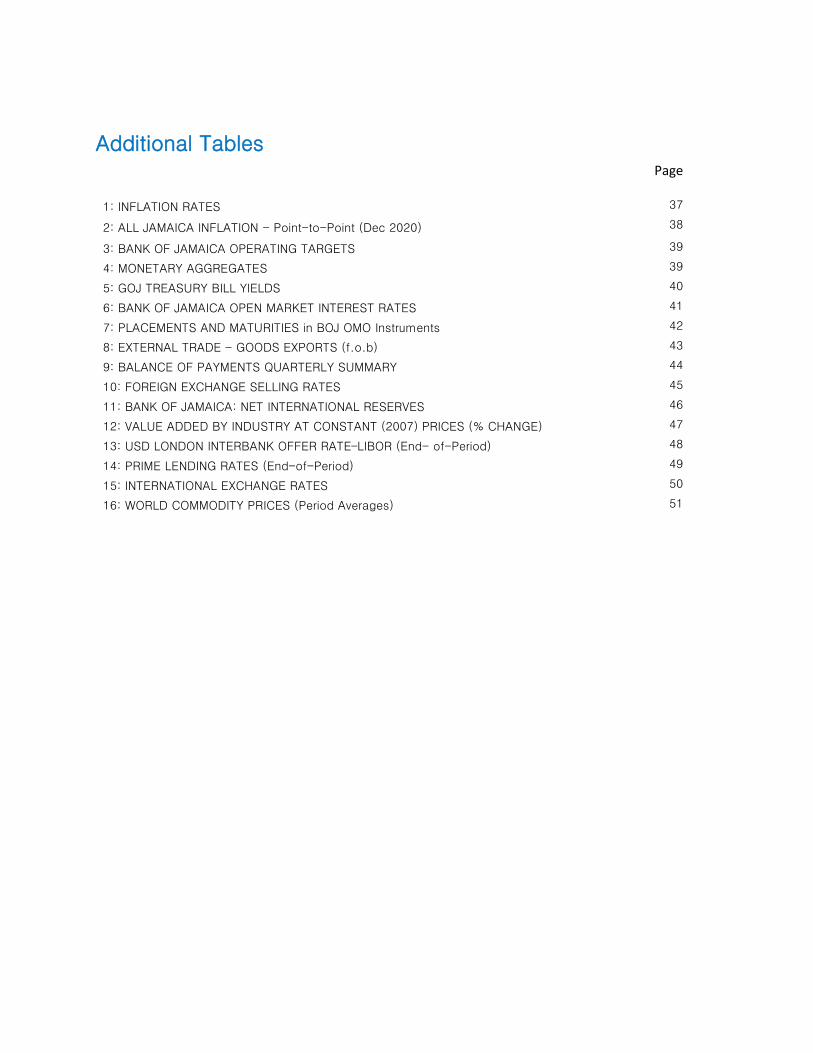
Additional Tables
Page
1: INFLATION RATES 37
2: ALL JAMAICA INFLATION - Point-to-Point (Dec 2020) 38
3: BANK OF JAMAICA OPERATING TARGETS 39
4: MONETARY AGGREGATES 39
5: GOJ TREASURY BILL YIELDS 40
6: BANK OF JAMAICA OPEN MARKET INTEREST RATES 41
7: PLACEMENTS AND MATURITIES in BOJ OMO Instruments 42
8: EXTERNAL TRADE - GOODS EXPORTS (f.o.b) 43
9: BALANCE OF PAYMENTS QUARTERLY SUMMARY 44
10: FOREIGN EXCHANGE SELLING RATES 45
11: BANK OF JAMAICA: NET INTERNATIONAL RESERVES 46
12: VALUE ADDED BY INDUSTRY AT CONSTANT (2007) PRICES (% CHANGE) 47
13: USD LONDON INTERBANK OFFER RATE–LIBOR (End- of-Period) 48
14: PRIME LENDING RATES (End-of-Period) 49
15: INTERNATIONAL EXCHANGE RATES 50
16: WORLD COMMODITY PRICES (Period Averages) 51
1: INFLATION RATES CPI (Point-to-Point) ** Headline Inflation Core Inflation* FY08/09 Jun-08 49.90 23.97 20.27 Sep-08 52.28 25.30 20.99
Dec-08 52.28 16.84 16.61
Mar-09 52.94 12.43 12.98 FY09/10 Jun-09 54.39 8.95 10.29 Sep-09 56.03 7.22 9.77
Dec-09 57.62 10.21 10.28
Mar-10 59.99 13.33 11.60 FY10/11 Jun-10 61.53 13.21 10.99 Sep-10 62.34 11.26 9.40
Dec-10 64.38 11.74 8.65
Mar-11 64.69 7.84 6.57 FY11/12 Jun-11 65.98 7.20 6.67 Sep-11 67.37 8.07 6.99
Dec-11 68.25 6.01 6.86
Mar-12 69.39 7.26 6.97 FY12/13 Jun-12 70.41 6.71 6.91 Sep-12 71.86 6.65 5.59
Dec-12 73.71 8.00 5.44
Mar-13 75.72 9.13 6.30 FY13/14 Jun-13 76.57 8.76 6.26 Sep-13 79.37 10.46 6.95
Dec-13 80.70 9.47 7.38
Mar-14 82.04 8.34 6.54 FY14/15 Jun-14 82.68 7.97 6.10 Sep-14 86.50 8.99 6.72
Dec-14 85.83 6.36 5.97
Mar-15 85.29 3.96 5.51 FY15/16 Jun-15 86.29 4.37 4.81 Sep-15 88.08 1.82 4.00
Dec-15 88.97 3.66 3.51
Mar-16 87.82 2.96 3.04 FY16/17 Jun-16 88.46 2.52 2.76 Sep-16 89.71 1.86 2.49
Dec-16 90.50 1.72 2.31
Mar-17 91.41 4.09 2.43 FY17/18 Jun-17 92.38 4.43 2.61 Sep-17 93.82 4.58 2.87 Dec-17 95.24 5.24 2.83 Mar-18 95.00 3.94 2.68 FY18/19 Jun-18 94.99 2.82 2.43 Sep-18 97.89 4.33 2.79 Dec-18 97.56 2.44 2.46 Mar-19 98.23 3.39 2.54 FY19/20 Jun-19 98.97 4.19 2.69 Sep-19 101.20 3.39 3.64 Dec-19 103.63 6.22 3.19 Mar-20 102.95 5.44 3.42 FY20/21 Jun-20 105.20 6.31 3.38 Sep-20 106.14 4.88 3.78 Dec-20 109.01 5.19 4.06 * Core inflation is measured as headline inflation excluding agriculture and fuel related components of the CPI Basket (CPI-AF) ** STATIN revised the reference basket used to measure the CPI in March 2020
37
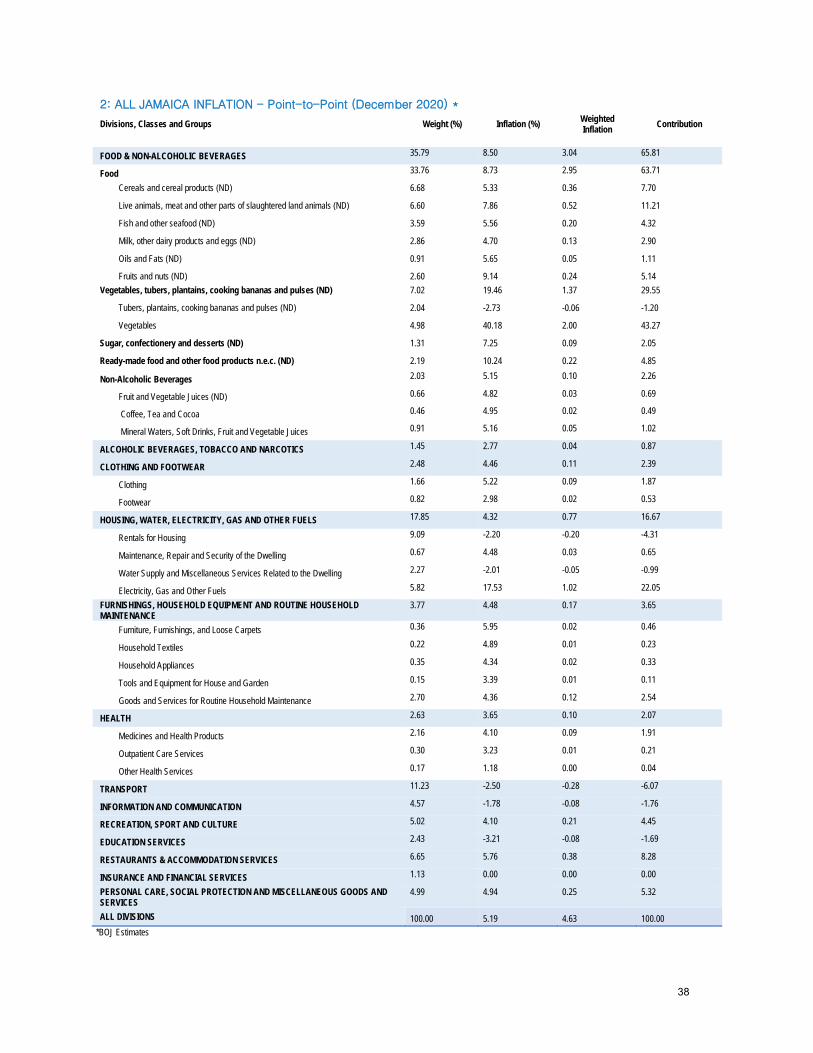
2: ALL JAMAICA INFLATION - Point-to-Point (December 2020) *
Divisions, Classes and Groups Weight (%) Inflation (%) Weighted Inflation Contribution
FOOD & NON-ALCOHOLIC BEVERAGES 35.79 8.50 3.04 65.81
Food 33.76 8.73 2.95 63.71
Cereals and cereal products (ND) 6.68 5.33 0.36 7.70
Live animals, meat and other parts of slaughtered land animals (ND) 6.60 7.86 0.52 11.21
Fish and other seafood (ND) 3.59 5.56 0.20 4.32
Milk, other dairy products and eggs (ND) 2.86 4.70 0.13 2.90
Oils and Fats (ND) 0.91 5.65 0.05 1.11
Fruits and nuts (ND) 2.60 9.14 0.24 5.14 Vegetables, tubers, plantains, cooking bananas and pulses (ND) 7.02 19.46 1.37 29.55
Tubers, plantains, cooking bananas and pulses (ND) 2.04 -2.73 -0.06 -1.20
Vegetables 4.98 40.18 2.00 43.27
Sugar, confectionery and desserts (ND) 1.31 7.25 0.09 2.05
Ready-made food and other food products n.e.c. (ND) 2.19 10.24 0.22 4.85
Non-Alcoholic Beverages 2.03 5.15 0.10 2.26
Fruit and Vegetable Juices (ND) 0.66 4.82 0.03 0.69
Coffee, Tea and Cocoa 0.46 4.95 0.02 0.49
Mineral Waters, Soft Drinks, Fruit and Vegetable Juices 0.91 5.16 0.05 1.02
ALCOHOLIC BEVERAGES, TOBACCO AND NARCOTICS 1.45 2.77 0.04 0.87
CLOTHING AND FOOTWEAR 2.48 4.46 0.11 2.39
Clothing 1.66 5.22 0.09 1.87
Footwear 0.82 2.98 0.02 0.53
HOUSING, WATER, ELECTRICITY, GAS AND OTHER FUELS 17.85 4.32 0.77 16.67
Rentals for Housing 9.09 -2.20 -0.20 -4.31
Maintenance, Repair and Security of the Dwelling 0.67 4.48 0.03 0.65
Water Supply and Miscellaneous Services Related to the Dwelling 2.27 -2.01 -0.05 -0.99
Electricity, Gas and Other Fuels 5.82 17.53 1.02 22.05
FURNISHINGS, HOUSEHOLD EQUIPMENT AND ROUTINE HOUSEHOLD MAINTENANCE
3.77 4.48 0.17 3.65
Furniture, Furnishings, and Loose Carpets 0.36 5.95 0.02 0.46
Household Textiles 0.22 4.89 0.01 0.23
Household Appliances 0.35 4.34 0.02 0.33
Tools and Equipment for House and Garden 0.15 3.39 0.01 0.11
Goods and Services for Routine Household Maintenance 2.70 4.36 0.12 2.54
HEALTH 2.63 3.65 0.10 2.07
Medicines and Health Products 2.16 4.10 0.09 1.91
Outpatient Care Services 0.30 3.23 0.01 0.21
Other Health Services 0.17 1.18 0.00 0.04
TRANSPORT 11.23 -2.50 -0.28 -6.07
INFORMATION AND COMMUNICATION 4.57 -1.78 -0.08 -1.76
RECREATION, SPORT AND CULTURE 5.02 4.10 0.21 4.45
EDUCATION SERVICES 2.43 -3.21 -0.08 -1.69
RESTAURANTS & ACCOMMODATION SERVICES 6.65 5.76 0.38 8.28
INSURANCE AND FINANCIAL SERVICES 1.13 0.00 0.00 0.00
PERSONAL CARE, SOCIAL PROTECTION AND MISCELLANEOUS GOODS AND SERVICES
4.99 4.94 0.25 5.32
ALL DIVISIONS 100.00 5.19 4.63 100.00 *BOJ Estimates
38
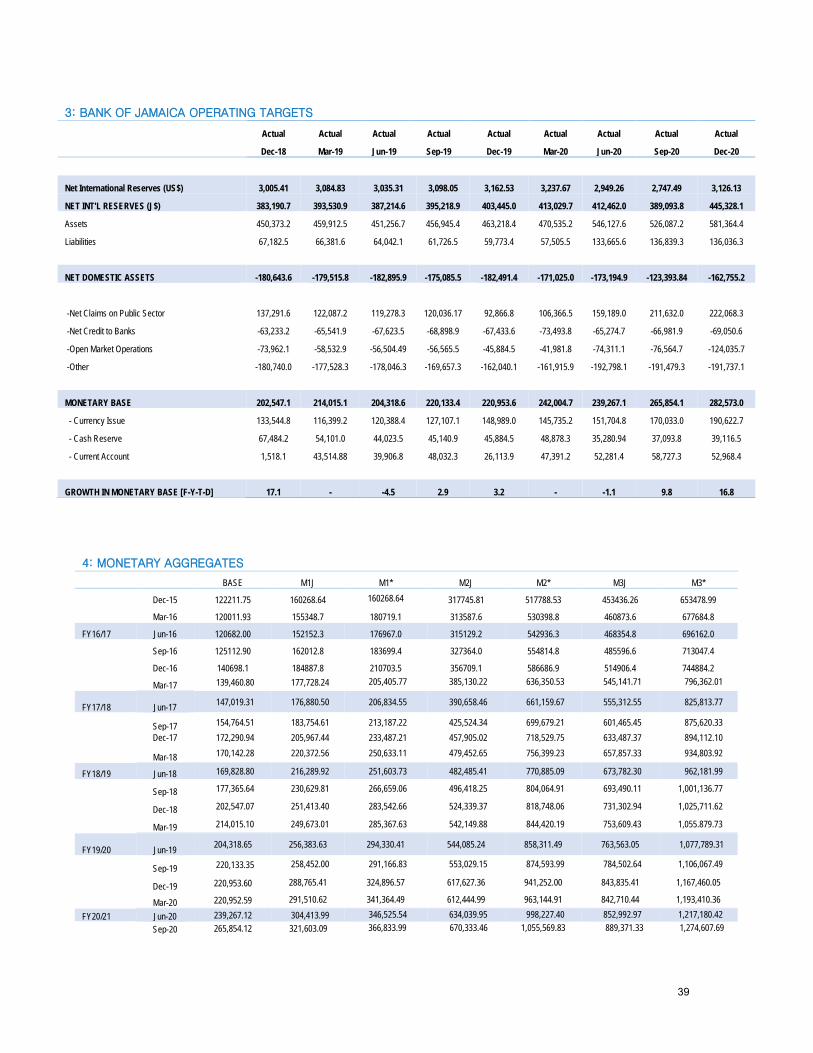
3: BANK OF JAMAICA OPERATING TARGETS
Actual Actual Actual Actual Actual Actual Actual Actual Actual
Dec-18 Mar-19 Jun-19 Sep-19 Dec-19 Mar-20 Jun-20 Sep-20 Dec-20
Net International Reserves (US$) 3,005.41 3,084.83 3,035.31 3,098.05 3,162.53 3,237.67 2,949.26 2,747.49 3,126.13
NET INT'L RESERVES (J$) 383,190.7 393,530.9 387,214.6 395,218.9 403,445.0 413,029.7 412,462.0 389,093.8 445,328.1
Assets 450,373.2 459,912.5 451,256.7 456,945.4 463,218.4 470,535.2 546,127.6 526,087.2 581,364.4
Liabilities 67,182.5 66,381.6 64,042.1 61,726.5 59,773.4 57,505.5 133,665.6 136,839.3 136,036.3
NET DOMESTIC ASSETS -180,643.6 -179,515.8 -182,895.9 -175,085.5 -182,491.4 -171,025.0 -173,194.9 -123,393.84 -162,755.2
-Net Claims on Public Sector 137,291.6 122,087.2 119,278.3 120,036.17 92,866.8 106,366.5 159,189.0 211,632.0 222,068.3
-Net Credit to Banks -63,233.2 -65,541.9 -67,623.5 -68,898.9 -67,433.6 -73,493.8 -65,274.7 -66,981.9 -69,050.6
-Open Market Operations -73,962.1 -58,532.9 -56,504.49 -56,565.5 -45,884.5 -41,981.8 -74,311.1 -76,564.7 -124,035.7
-Other -180,740.0 -177,528.3 -178,046.3 -169,657.3 -162,040.1 -161,915.9 -192,798.1 -191,479.3 -191,737.1
MONETARY BASE 202,547.1 214,015.1 204,318.6 220,133.4 220,953.6 242,004.7 239,267.1 265,854.1 282,573.0
- Currency Issue 133,544.8 116,399.2 120,388.4 127,107.1 148,989.0 145,735.2 151,704.8 170,033.0 190,622.7
- Cash Reserve 67,484.2 54,101.0 44,023.5 45,140.9 45,884.5 48,878.3 35,280.94 37,093.8 39,116.5
- Current Account 1,518.1 43,514.88 39,906.8 48,032.3 26,113.9 47,391.2 52,281.4 58,727.3 52,968.4
GROWTH IN MONETARY BASE [F-Y-T-D] 17.1 - -4.5 2.9 3.2 - -1.1 9.8 16.8
4: MONETARY AGGREGATES BASE M1J M1* M2J M2* M3J M3*
Dec-15 122211.75 160268.64 160268.64 317745.81 517788.53 453436.26 653478.99
Mar-16 120011.93 155348.7 180719.1 313587.6 530398.8 460873.6 677684.8
FY16/17 Jun-16 120682.00 152152.3 176967.0 315129.2 542936.3 468354.8 696162.0
Sep-16 125112.90 162012.8 183699.4 327364.0 554814.8 485596.6 713047.4
Dec-16 140698.1 184887.8 210703.5 356709.1 586686.9 514906.4 744884.2
Mar-17 139,460.80 177,728.24 205,405.77 385,130.22 636,350.53 545,141.71 796,362.01 FY17/18 Jun-17 147,019.31 176,880.50 206,834.55 390,658.46 661,159.67 555,312.55 825,813.77
Sep-17 154,764.51 183,754.61 213,187.22 425,524.34 699,679.21 601,465.45 875,620.33 Dec-17 172,290.94 205,967.44 233,487.21 457,905.02 718,529.75 633,487.37 894,112.10
Mar-18 170,142.28 220,372.56 250,633.11 479,452.65 756,399.23 657,857.33 934,803.92
FY18/19 Jun-18 169,828.80 216,289.92 251,603.73 482,485.41 770,885.09 673,782.30 962,181.99
Sep-18 177,365.64 230,629.81 266,659.06 496,418.25 804,064.91 693,490.11 1,001,136.77
Dec-18 202,547.07 251,413.40 283,542.66 524,339.37 818,748.06 731,302.94 1,025,711.62
Mar-19 214,015.10 249,673.01 285,367.63 542,149.88 844,420.19 753,609.43 1,055.879.73
FY19/20 Jun-19 204,318.65 256,383.63 294,330.41 544,085.24 858,311.49 763,563.05 1,077,789.31
Sep-19 220,133.35 258,452.00 291,166.83 553,029.15 874,593.99 784,502.64 1,106,067.49
Dec-19 220,953.60 288,765.41 324,896.57 617,627.36 941,252.00 843,835.41 1,167,460.05
Mar-20 220,952.59 291,510.62 341,364.49 612,444.99 963,144.91 842,710.44 1,193,410.36
FY20/21 Jun-20 239,267.12 304,413.99 346,525.54 634,039.95 998,227.40 852,992.97 1,217,180.42 Sep-20 265,854.12 321,603.09 366,833.99 670,333.46 1,055,569.83 889,371.33 1,274,607.69
39
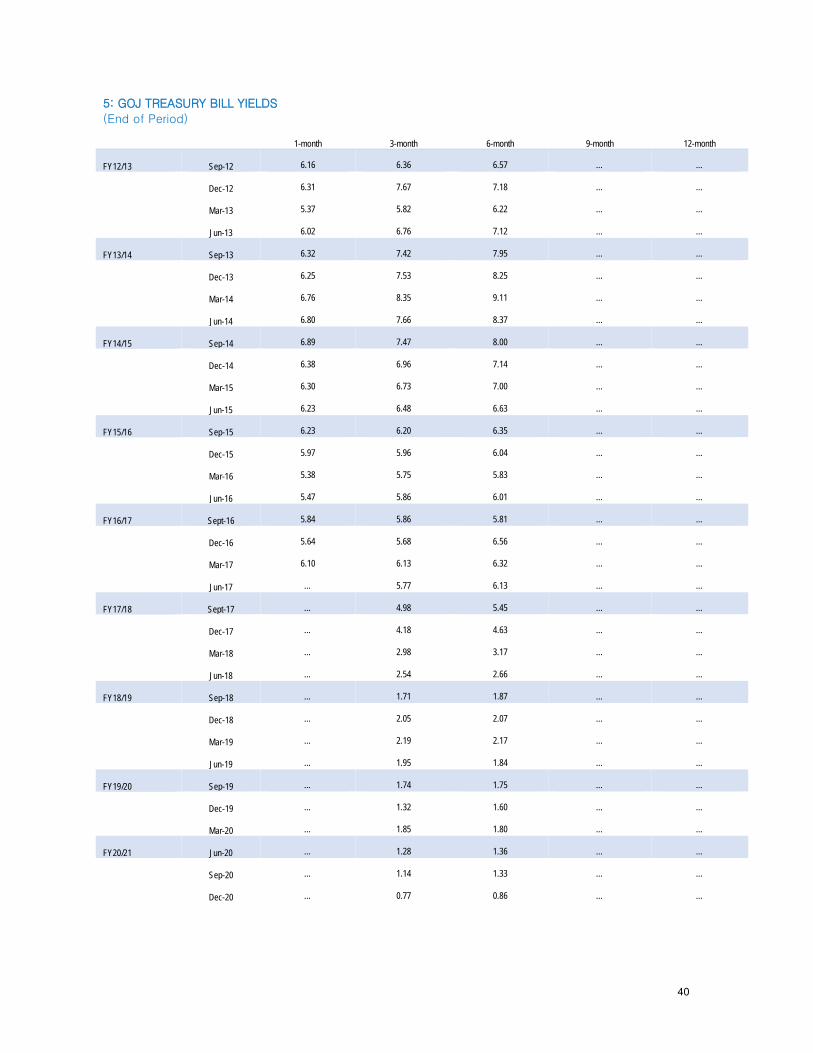
5: GOJ TREASURY BILL YIELDS
(End of Period)
1-month 3-month 6-month 9-month 12-month
FY12/13 Sep-12 6.16 6.36 6.57 … …
Dec-12 6.31 7.67 7.18 … …
Mar-13 5.37 5.82 6.22 … …
Jun-13 6.02 6.76 7.12 … …
FY13/14 Sep-13 6.32 7.42 7.95 … …
Dec-13 6.25 7.53 8.25 … …
Mar-14 6.76 8.35 9.11 … …
Jun-14 6.80 7.66 8.37 … …
FY14/15 Sep-14 6.89 7.47 8.00 … …
Dec-14 6.38 6.96 7.14 … …
Mar-15 6.30 6.73 7.00 … …
Jun-15 6.23 6.48 6.63 … …
FY15/16 Sep-15 6.23 6.20 6.35 … …
Dec-15 5.97 5.96 6.04 … …
Mar-16 5.38 5.75 5.83 … …
Jun-16 5.47 5.86 6.01 … …
FY16/17 Sept-16 5.84 5.86 5.81 … …
Dec-16 5.64 5.68 6.56 … …
Mar-17 6.10 6.13 6.32 … …
Jun-17 … 5.77 6.13 … …
FY17/18 Sept-17 … 4.98 5.45 … …
Dec-17 … 4.18 4.63 … …
Mar-18 … 2.98 3.17 … …
Jun-18 … 2.54 2.66 … …
FY18/19 Sep-18 … 1.71 1.87 … …
Dec-18 … 2.05 2.07 … …
Mar-19 … 2.19 2.17 … …
Jun-19 … 1.95 1.84 … …
FY19/20 Sep-19 … 1.74 1.75 … …
Dec-19 … 1.32 1.60 … …
Mar-20 … 1.85 1.80 … …
FY20/21 Jun-20 … 1.28 1.36 … …
Sep-20 … 1.14 1.33 … …
Dec-20 … 0.77 0.86 … …
40

6: BANK OF JAMAICA OPEN MARKET INTEREST RATES
(End of Period) 30 days 60 days 90 days 120 days 180 days 270 days 365 days
Mar-12 6.25 … … … … … …
FY12/13 Jun-12 6.25 … … … … … …
Sep-12 6.25 … … … … … …
Dec-12 6.25 … … … … … …
Mar-13 5.75 … … … … … …
FY13/14 Jun-13 5.75 … … … … … …
Sep-13 5.75 … … … … … …
Dec-13 5.75 … … … … … …
Mar-14 5.75 … … … … … …
FY14/15 Jun-14 5.75 … … … … … …
Sep-14 5.75 … … … … … …
Dec-14 5.75 … … … … … …
Mar-15 5.75 … … … … … …
FY15/16 Jun-15 5.50 … … … … … …
Sep-15 5.25 … … … … … …
Dec-15 5.25 … … … … … …
Mar-16 5.25 … … … … … …
FY16/17 Jun-16 5.00 … … … … … …
Sep-16 5.00 … … … … … …
Dec-16 5.00 … … … … … …
Mar-17 5.00 … … … … … …
FY17/18 Jun-17 4.75 … … … … … …
Sep-17 4.50 … … … … … …
Dec-17 4.00 … … … … … …
Mar-18 3.50 … … … … … …
FY18/19 Jun-18 3.00 … … … … … …
Sep-18 3.00 … … … … … …
Dec-18 3.00 … … … … … …
Mar-19 3.00 … … … … … …
FY19/20 Jun-19 1.25 … … … … … …
Sep-19 1.25 … … … … … …
Dec-19 1.00 … … … … … …
Mar-20 1.00 … … … … … …
FY20/21 Jun-20 1.00 … … … … … …
Sep-20 1.00 … … … … … …
Dec-20 1.00 … … … … … …
41

7: Placements and Maturities* in BOJ OMO Instruments April - June 2020 July - September 2020 October - December 2020 Maturities Placements Average Maturities Placements Average Maturities Placements Average (J$MN) (J$MN) Yield (%) (J$MN) (J$MN) Yield (%) (J$MN) (J$MN) Yield (%)
30-day CD 65.2 51.5 0.84 65.0 76.0 0.62 74.5 88.5 0.54
272-day VR CD 0 0 0 0 0 0
365-day VR CD 0 0 0 0 0 0
548-day VR CD 0 0 0 0 0 0
729-day VR CD 0 0 0 0 0 0
272-day FR CD 0 0 0 0 0 0
365-day FR CD 0 0 0 0 0 0
272-day FR USD IB 0 24.0 0 0 0 0
365-day FR USD IB 0 0 0 0 0 0
540-day FR USD IB 0 22.7 0 0 0 0
730-day FR USD IB 0 0 15.0 29.7 0 0
1095-day FR USD IB 0 23.9
Repos 40.2 32.8 49.6 65.8 86.5 76.9 Maturities Placements Average Maturities Placements Average Maturities Placements Average (US$MN) (US$MN) Yield (%) (US$MN) (US$MN) Yield (%) (US$MN) (US$MN) Yield (%)
1-year FR USD CD 0 0 0 0 0 0
2-year FR USD CD 0 0 0 0 0 0
3-year FR USD CD 0 0 2.91 0 0 0
4-year FR USD CD 0 0 0 0 0 0
5-year FR USD CD 10.7 0 0.13 0 0.03 0
7-year FR USD CD 0 0 0 0 0 0
TOTAL 10.7 0 3.04 0 0.03 0
42

8: EXTERNAL TRADE – GOODS EXPORTS (f.o.b)
(Flows – US$MN)
Bauxite Alumina Sugar Bananas Other
Traditional Non-Traditional Other Total
Goods Exports
FY12/13 131.9 516.7 54.8 0.0 80.8 707.1 252.9 1744.1 Jun-12 31.8 132.4 37.5 0.0 22.3 126.8 66.7 417.5 Sep-12 34.7 130.7 0.5 0.0 20.4 162.3 58.6 407.1
Dec-12 32.4 117.2 0.0 0.0 19.3 223.5 57.9 450.3 Mar-13 33.0 136.4 16.8 0.0 18.8 194.5 69.7 469.2 FY13/14 125.0 526.0 53.7 0.0 70.9 455.9 260.3 1492.0 Jun-13 31.6 127.0 36.3 0.0 23.5 104.0 62.4 384.8 Sep-13 30.6 117.6 0.0 0.0 18.5 120.3 75.8 362.8 Dec-13 32.8 142.7 0.0 0.0 13.8 118.7 55.4 363.4 Mar-14 30.0 138.7 17.4 0.0 15.1 112.9 66.8 381.0
FY14/15 136.5 522.9 55.5 0.2 65.8 395.6 225.6 1402.2
Jun-14 34.4 108.6 26.5 0.0 21.0 96.1 69.2 355.9
Sep-14 33.4 151.6 11.9 0.1 16.6 99.3 62.1 375.0
Dec-14 33.4 130.4 0.0 0.1 13.6 106.8 49.2 333.5
Mar-15 35.3 132.3 17.1 0.1 14.5 93.4 45.1 337.9
FY15/16 116.4 479.8 36.9 0.3 69.9 317.8 158.3 1178.7
Jun-15 32.0 143.8 23.6 0.1 21.9 80.4 45.2 347.0
Sep-15 33.8 114.5 13.1 0.1 19.2 71.0 31.9 283.6
Dec-15 23.9 116.4 0.2 0.1 13.4 84.2 38.8 277.0
Mar-16 26.6 105.1 0.0 0.1 15.4 82.2 42.3 271.1
FY16/17 80.5 472.3 17.7 0.4 76.9 407.3 191.0 1246.1
Jun-16 26.7 126.6 9.0 0.1 26.9 90.7 55.2 335.3
Sep-16 20.6 102.7 4.8 0.1 20.6 93.0 41.0 282.7
Dec-16 17.9 109.6 0.3 0.1 13.0 108.4 49.9 299.1
Mar-17 15.3 133.4 3.6 0.1 16.5 115.2 44.9 328.9
FY17/18 94.5 641.9 11.3 0.7 65.8 436.1 205.3 1455.6
Jun-17 19.7 128.4 8.8 0.1 18.7 108.8 56.3 340.8
Sep-17 19.4 142.5 1.7 0.1 18.9 95.8 43.8 322.3
Dec-17 29.4 148.2 0.3 0.1 15.1 119.1 46.6 358.8
Mar-18 25.9 222.9 0.5 0.3 13.2 112.3 58.6 433.7
FY18/19 94.7 1136.8 15.8 0.5 68.4 424.8 232.3 1973.2
Jun-18 25.3 300.8 3.9 0.1 19.5 99.0 58.9 507.5
Sep-18 23.2 328.5 11.3 0.1 21.3 100.6 52.5 537.4
Dec-18 25.9 270.0 0.3 0.1 14.0 112.6 59.4 482.3
Mar-19 20.3 237.5 0.4 0.1 13.5 112.6 61.5 445.9
FY19/20+ 88.5 601.3 10.2 0.6 81.7 542.5 189.8 1514.6
Jun-19+ 26.1 214.6 6.4 0.1 20.8 117.9 50.7 436.6
Sep-19+ 22.5 169.4 3.0 0.1 24.0 120.2 46.8 386.0
Dec-19+ 21.1 113.0 0.4 0.1 18.2 122.0 44.5 319.4
Mar-20+ 18.7 104.3 0.4 0.2 18.8 159.8 44.4 346.6 FY20/21 47.6 202.1 6.2 0.4 42.9 223.4 24.6 547.2 Jun-20 27.3 94.0 6.0 0.2 19.3 106.2 7.4 260.5
Sep-20 20.3 108.1 0.2 0.2 23.6 117.2 17.2 286.7 + Revision
43
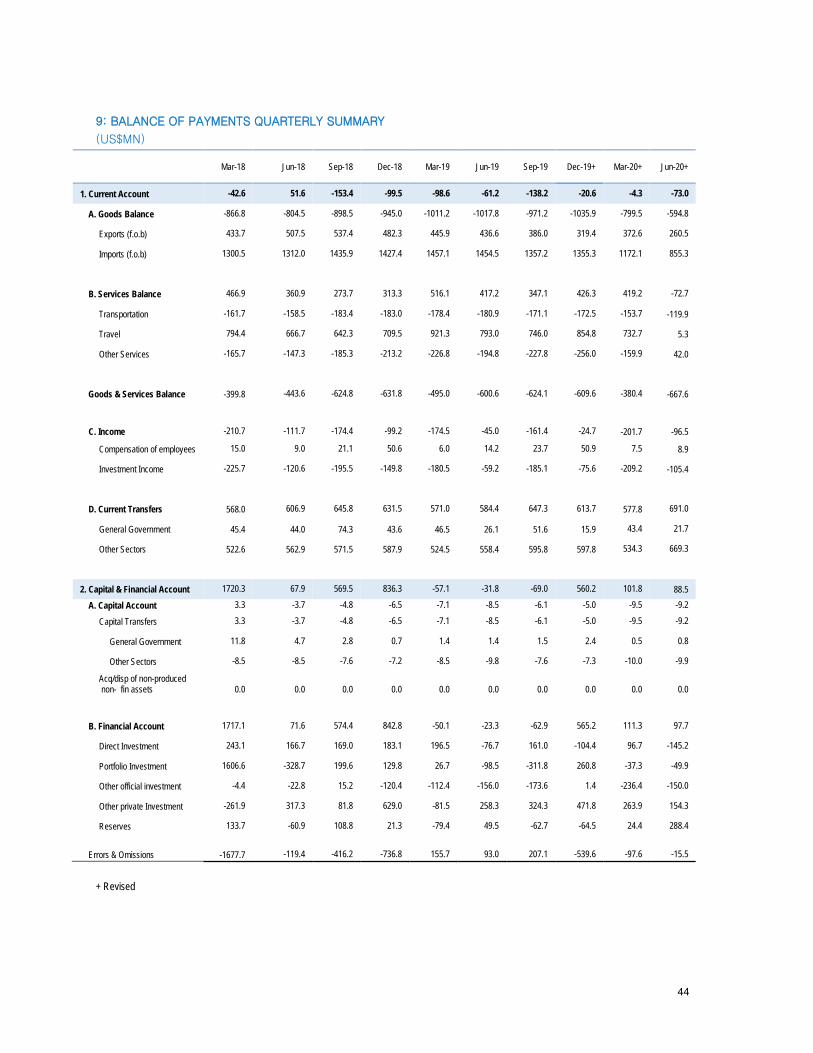
9: BALANCE OF PAYMENTS QUARTERLY SUMMARY
(US$MN)
Mar-18
Jun-18
Sep-18
Dec-18
Mar-19
Jun-19
Sep-19
Dec-19+
Mar-20+
Jun-20+
1. Current Account -42.6 51.6 -153.4 -99.5 -98.6 -61.2 -138.2 -20.6 -4.3 -73.0
A. Goods Balance -866.8 -804.5 -898.5 -945.0 -1011.2 -1017.8 -971.2 -1035.9 -799.5 -594.8
Exports (f.o.b) 433.7 507.5 537.4 482.3 445.9 436.6 386.0 319.4 372.6 260.5
Imports (f.o.b) 1300.5 1312.0 1435.9 1427.4 1457.1 1454.5 1357.2 1355.3 1172.1 855.3
B. Services Balance 466.9 360.9 273.7 313.3 516.1 417.2 347.1 426.3 419.2 -72.7
Transportation -161.7 -158.5 -183.4 -183.0 -178.4 -180.9 -171.1 -172.5 -153.7 -119.9
Travel 794.4 666.7 642.3 709.5 921.3 793.0 746.0 854.8 732.7 5.3
Other Services -165.7 -147.3 -185.3 -213.2 -226.8 -194.8 -227.8 -256.0 -159.9 42.0
Goods & Services Balance -399.8 -443.6 -624.8 -631.8 -495.0 -600.6 -624.1 -609.6 -380.4 -667.6
C. Income -210.7 -111.7 -174.4 -99.2 -174.5 -45.0 -161.4 -24.7 -201.7 -96.5
Compensation of employees 15.0 9.0 21.1 50.6 6.0 14.2 23.7 50.9 7.5 8.9
Investment Income -225.7 -120.6 -195.5 -149.8 -180.5 -59.2 -185.1 -75.6 -209.2 -105.4
D. Current Transfers 568.0 606.9 645.8 631.5 571.0 584.4 647.3 613.7 577.8 691.0
General Government 45.4 44.0 74.3 43.6 46.5 26.1 51.6 15.9 43.4 21.7
Other Sectors 522.6 562.9 571.5 587.9 524.5 558.4 595.8 597.8 534.3 669.3
2. Capital & Financial Account 1720.3 67.9 569.5 836.3 -57.1 -31.8 -69.0 560.2 101.8 88.5
A. Capital Account 3.3 -3.7 -4.8 -6.5 -7.1 -8.5 -6.1 -5.0 -9.5 -9.2
Capital Transfers 3.3 -3.7 -4.8 -6.5 -7.1 -8.5 -6.1 -5.0 -9.5 -9.2
General Government 11.8 4.7 2.8 0.7 1.4 1.4 1.5 2.4 0.5 0.8
Other Sectors -8.5 -8.5 -7.6 -7.2 -8.5 -9.8 -7.6 -7.3 -10.0 -9.9
Acq/disp of non-produced non- fin assets
0.0
0.0
0.0
0.0
0.0
0.0
0.0
0.0
0.0
0.0
B. Financial Account 1717.1 71.6 574.4 842.8 -50.1 -23.3 -62.9 565.2 111.3 97.7
Direct Investment 243.1 166.7 169.0 183.1 196.5 -76.7 161.0 -104.4 96.7 -145.2
Portfolio Investment 1606.6 -328.7 199.6 129.8 26.7 -98.5 -311.8 260.8 -37.3 -49.9
Other official investment -4.4 -22.8 15.2 -120.4 -112.4 -156.0 -173.6 1.4 -236.4 -150.0
Other private Investment -261.9 317.3 81.8 629.0 -81.5 258.3 324.3 471.8 263.9 154.3
Reserves 133.7 -60.9 108.8 21.3 -79.4 49.5 -62.7 -64.5 24.4 288.4
Errors & Omissions -1677.7 -119.4 -416.2 -736.8 155.7 93.0 207.1 -539.6 -97.6 -15.5
+ Revised
44

10: FOREIGN EXCHANGE SELLING RATES
(J$ per unit of foreign currency – end of period)
US$ Can$ GBP ₤
Dec-11 86.6000 84.2000 134.4400
Mar-12 87.3000 87.6500 139.2800 FY12/13 Jun-12 88.7000 86.7100 138.6600
Sep-12 89.9300 91.4200 145.3900 Dec-12 92.9800 93.3100 152.6400
Mar-13 98.8900 97.9900 151.9000 FY13/14 Jun-13 101.3800 96.7000 154.4800
Sep-13 103.6000 100.7100 167.1600
Dec-13 106.3800 99.7200 175.8400
Mar-14 109.5700 98.9300 181.7700 FY14/15 Jun-14 112.2022 103.1802 191.8988
Sep-14 112.6662 101.0142 180.2393
Dec-14 114.6607 97.6896 177.6759
Mar-15 115.0435 90.6202 169.9738
FY15/16 Jun-15 116.9832 93.8399 183.7774 Sep-15 119.0553 88.6177 180.1478 Dec-15 120.4150 84.9062 177.1179 Mar-16 122.0421 92.5223 173.4625 FY16/17 Jun-16 126.3835 97.8795 169.8517 Sept-16 128.2704 97.3084 166.7776 Dec-16 128.4404 95.8778 157.4208 Mar-17 128.6672 97.1686 159.5670 FY17/18 Jun-17 128.6228 99.3865 166.5811 Sep-17 129.9127 105.0988 173.8791 Dec-17 125.0004 97.3947 167.0275 Mar-18 125.9850 97.1994 178.1109 FY18/19 Jun-18 130.3918 100.0079 172.9757 Sep-18 134.6486 103.7023 178.1844
Dec-18 127.7162 91.5382 159.0355
Mar-19 126.4666 95.8862 165.5342
FY19/20 Jun-19 131.0682 101.8648 168.0812 Sep-19 135.1591 102.3052 166.1363 Dec-19 132.5690 100.1539 171.6232 Mar-20 135.3908 95.3267 169.1721 FY20/21 Jun-20 140.0111 105.1658 177.1609 Sep-20 142.1048 107.7533 185.5508 Dec-20 142.6493 111.4117 193.6657
45

11: BANK OF JAMAICA: NET INTERNATIONAL RESERVES
(End-of-Point)
(US$MN) (US$MN) (US$MN) Weeks of Imports
Gross Foreign
Assets Gross Foreign Liabilities International Reserves (Net) Goods Goods & Services
FY12/13 Jun-13 1,881.10 877.90 1,003.20 16.70 12.60
Sep-13 1,713.50 803.40 910.10 15.80 11.90
Dec-13 1,817.60 769.70 1,047.90 17.30 12.80
Mar-14 2,048.60 745.00 1,303.60 19.10 14.40
FY14/15 Jun-14 2,016.53 640.40 1,376.13 20.19 14.57
Sep-14 2,715.25 514.68 2,200.57 27.79 19.66
Dec-14 2,473.01 471.92 2,001.09 26.31 18.41
Mar-15 2,689.74 396.06 2,293.68 28.61 20.02
FY15/16 Jun-15 2,537.27 420.76 2,116.51 29.00 19.83
Sep-15 2,890.45 448.57 2,441.88 32.34 22.39
Dec-15 2,890.45 479.82 2,437.01 34.61 23.45
Mar-16 2,894.31 478.77 2,415.53 34.38 23.30
FY16/17 Jun-16 2,819.90 554.77 2,265.13 32.66 19.36
Sep-16 3,056.16 593.15 2,463.01 36.30 24.60
Dec-16 3,291.47 -572.10 2,719.37 38.40 22.27
Mar-17 3,323.89 -554.72 2,769.17 38.78 22.49
FY17/18 Jun-17 3,185.65 -568.84 2,616.81 35.44 20.54
Sep-17 3,714.94 -577.80 3,137.14 40.87 23.70
Dec-17 3,781.17 -572.88 3,208.29 38.83 22.78
Mar-18 3,656.91 -582.35 3,074.57 35.83 21.29
FY18/19 Jun-18 3,687.40 -551.91 3,135.49 32.49 19.80
Sep-18 3,568.84 -542.12 3,026.72 33.14 19.67
Dec-18 3,532.04 -526.63 3005.41 32.80 19.47
Mar-19 3,605.18 -520.35 3,084.83 35.54 20.50
FY19/20 Jun-19 3,537.33 -502.02 3,035.31 32.88 22.62
Sep-19 3,581.92 -483.86 3,098.05 33.45 22.82
Dec-19 3,631.09 -468.55 3,152.53 33.80 22.94
Mar-20 3,688.45 -450.78 3,237.67 34.27 23.22
FY20/21 Jun-20 3,905.02 -955.76 2,949.26 56.33 38.15
Sep-20 3,713.37 -965.88 2,747.49 53.56 36.28
Dec-20 4,081.09 -954.95 3,126.13 53.95 38.81
46
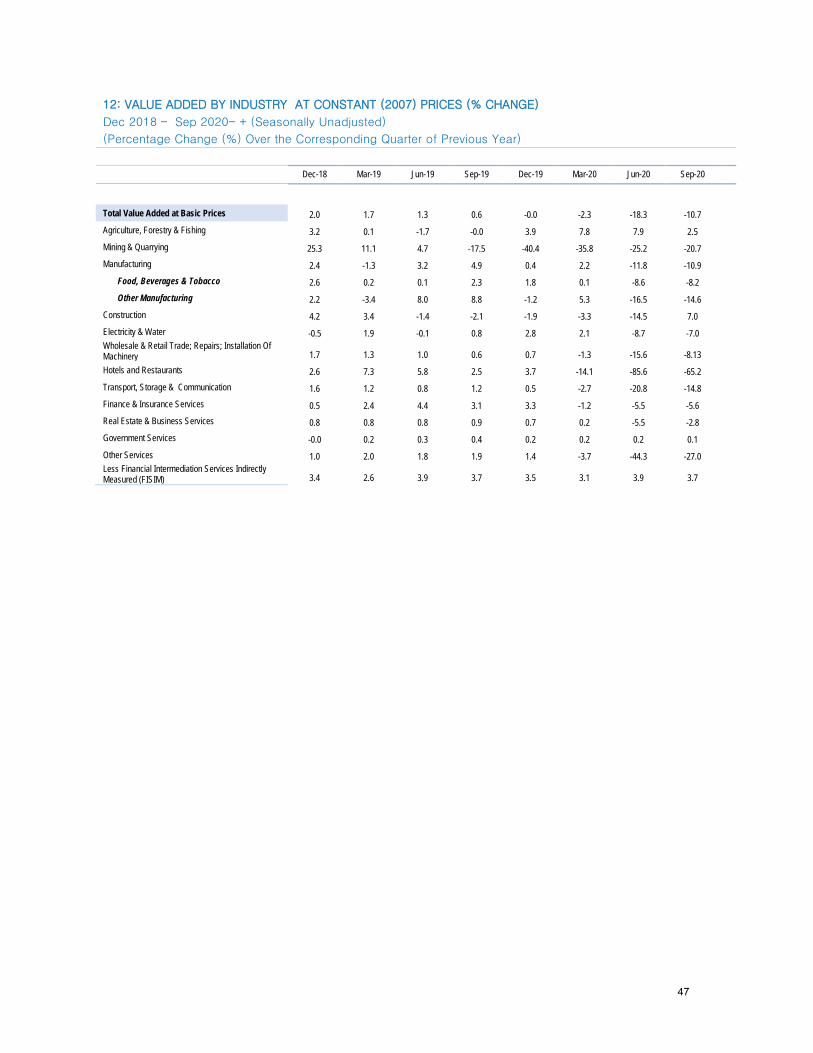
12: VALUE ADDED BY INDUSTRY AT CONSTANT (2007) PRICES (% CHANGE)
Dec 2018 – Sep 2020- + (Seasonally Unadjusted)
(Percentage Change (%) Over the Corresponding Quarter of Previous Year)
Dec-18 Mar-19 Jun-19 Sep-19 Dec-19 Mar-20 Jun-20 Sep-20
Total Value Added at Basic Prices 2.0 1.7 1.3 0.6 -0.0 -2.3 -18.3 -10.7 Agriculture, Forestry & Fishing 3.2 0.1 -1.7 -0.0 3.9 7.8 7.9 2.5 Mining & Quarrying 25.3 11.1 4.7 -17.5 -40.4 -35.8 -25.2 -20.7 Manufacturing 2.4 -1.3 3.2 4.9 0.4 2.2 -11.8 -10.9 Food, Beverages & Tobacco 2.6 0.2 0.1 2.3 1.8 0.1 -8.6 -8.2 Other Manufacturing 2.2 -3.4 8.0 8.8 -1.2 5.3 -16.5 -14.6 Construction 4.2 3.4 -1.4 -2.1 -1.9 -3.3 -14.5 7.0 Electricity & Water -0.5 1.9 -0.1 0.8 2.8 2.1 -8.7 -7.0 Wholesale & Retail Trade; Repairs; Installation Of Machinery 1.7 1.3 1.0 0.6 0.7 -1.3 -15.6 -8.13 Hotels and Restaurants 2.6 7.3 5.8 2.5 3.7 -14.1 -85.6 -65.2 Transport, Storage & Communication 1.6 1.2 0.8 1.2 0.5 -2.7 -20.8 -14.8 Finance & Insurance Services 0.5 2.4 4.4 3.1 3.3 -1.2 -5.5 -5.6 Real Estate & Business Services 0.8 0.8 0.8 0.9 0.7 0.2 -5.5 -2.8 Government Services -0.0 0.2 0.3 0.4 0.2 0.2 0.2 0.1 Other Services 1.0 2.0 1.8 1.9 1.4 -3.7 -44.3 -27.0 Less Financial Intermediation Services Indirectly Measured (FISIM) 3.4 2.6 3.9 3.7 3.5 3.1 3.9 3.7
47
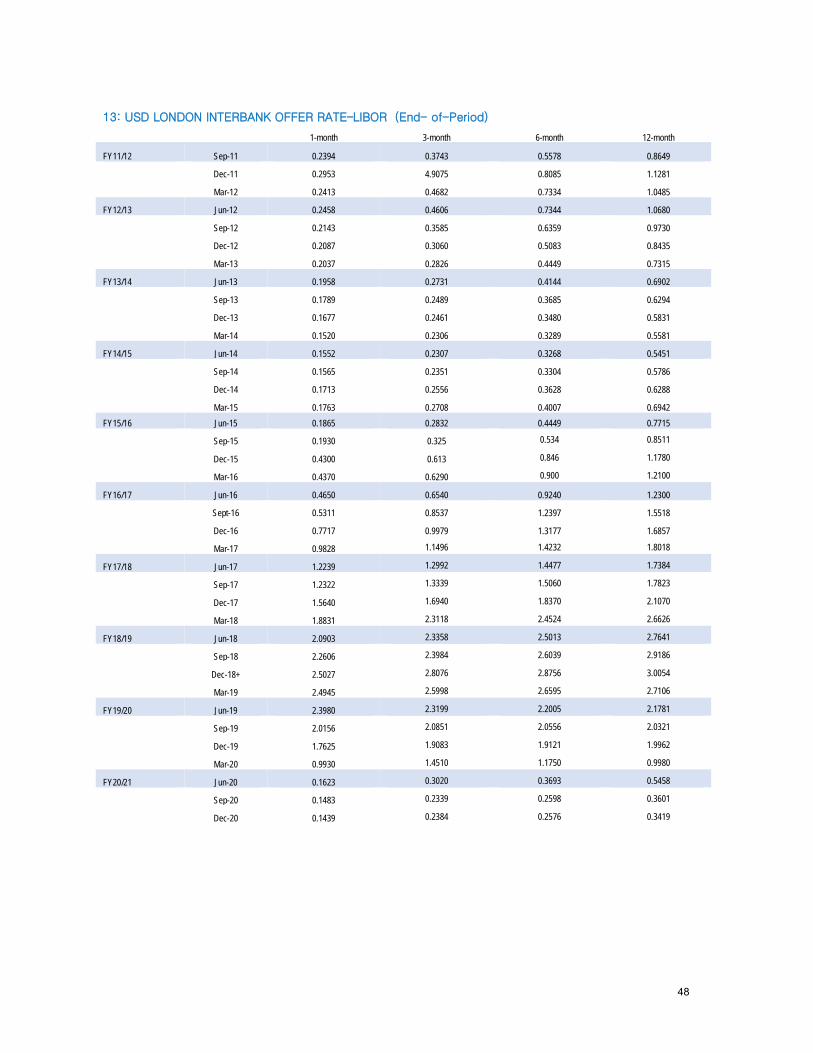
13: USD LONDON INTERBANK OFFER RATE–LIBOR (End- of-Period)
1-month 3-month 6-month 12-month
FY11/12 Sep-11 0.2394 0.3743 0.5578 0.8649
Dec-11 0.2953 4.9075 0.8085 1.1281
Mar-12 0.2413 0.4682 0.7334 1.0485
FY12/13 Jun-12 0.2458 0.4606 0.7344 1.0680
Sep-12 0.2143 0.3585 0.6359 0.9730
Dec-12 0.2087 0.3060 0.5083 0.8435
Mar-13 0.2037 0.2826 0.4449 0.7315
FY13/14 Jun-13 0.1958 0.2731 0.4144 0.6902
Sep-13 0.1789 0.2489 0.3685 0.6294
Dec-13 0.1677 0.2461 0.3480 0.5831
Mar-14 0.1520 0.2306 0.3289 0.5581
FY14/15 Jun-14 0.1552 0.2307 0.3268 0.5451
Sep-14 0.1565 0.2351 0.3304 0.5786
Dec-14 0.1713 0.2556 0.3628 0.6288
Mar-15 0.1763 0.2708 0.4007 0.6942 FY15/16 Jun-15 0.1865 0.2832 0.4449 0.7715
Sep-15 0.1930 0.325 0.534 0.8511
Dec-15 0.4300 0.613 0.846 1.1780
Mar-16 0.4370 0.6290 0.900 1.2100
FY16/17 Jun-16 0.4650 0.6540 0.9240 1.2300
Sept-16 0.5311 0.8537 1.2397 1.5518
Dec-16 0.7717 0.9979 1.3177 1.6857
Mar-17 0.9828 1.1496 1.4232 1.8018
FY17/18 Jun-17 1.2239 1.2992 1.4477 1.7384
Sep-17 1.2322 1.3339 1.5060 1.7823
Dec-17 1.5640 1.6940 1.8370 2.1070
Mar-18 1.8831 2.3118 2.4524 2.6626
FY18/19 Jun-18 2.0903 2.3358 2.5013 2.7641
Sep-18 2.2606 2.3984 2.6039 2.9186
Dec-18+ 2.5027 2.8076 2.8756 3.0054
Mar-19 2.4945 2.5998 2.6595 2.7106
FY19/20 Jun-19 2.3980 2.3199 2.2005 2.1781
Sep-19 2.0156 2.0851 2.0556 2.0321
Dec-19 1.7625 1.9083 1.9121 1.9962
Mar-20 0.9930 1.4510 1.1750 0.9980
FY20/21 Jun-20 0.1623 0.3020 0.3693 0.5458
Sep-20 0.1483 0.2339 0.2598 0.3601
Dec-20 0.1439 0.2384 0.2576 0.3419
48
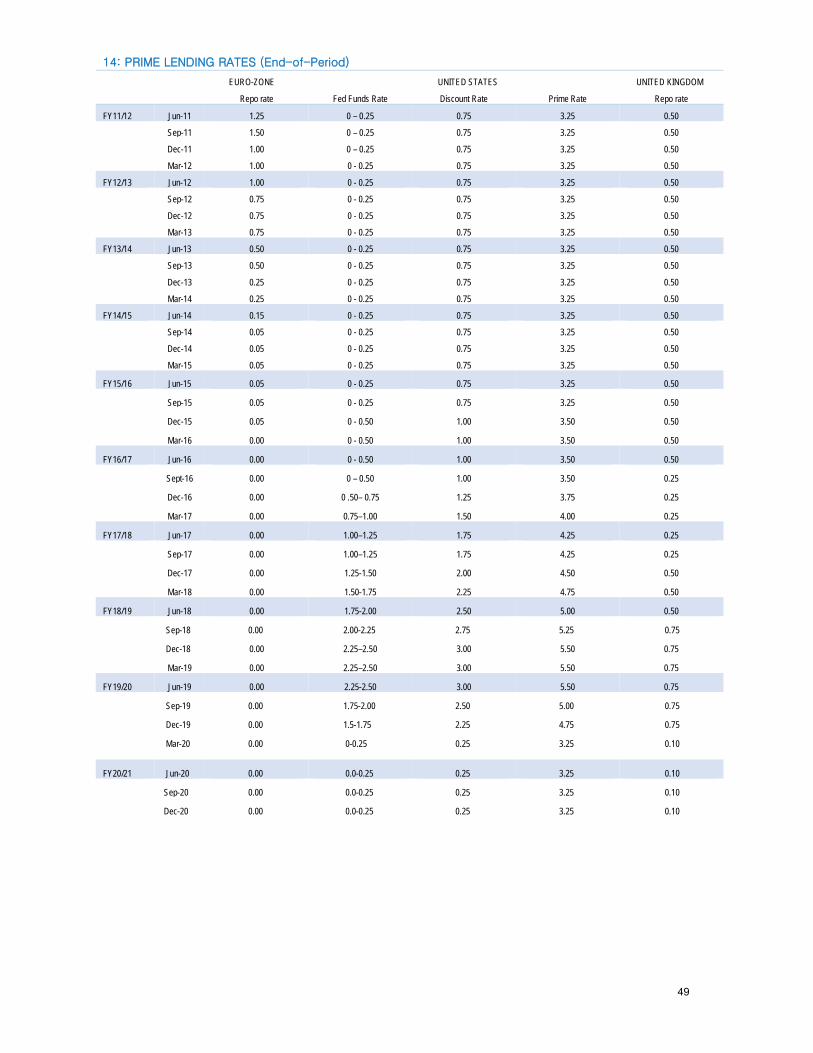
14: PRIME LENDING RATES (End-of-Period)
EURO-ZONE UNITED STATES UNITED KINGDOM
Repo rate Fed Funds Rate Discount Rate Prime Rate Repo rate
FY11/12 Jun-11 1.25 0 – 0.25 0.75 3.25 0.50
Sep-11 1.50 0 – 0.25 0.75 3.25 0.50
Dec-11 1.00 0 – 0.25 0.75 3.25 0.50
Mar-12 1.00 0 - 0.25 0.75 3.25 0.50
FY12/13 Jun-12 1.00 0 - 0.25 0.75 3.25 0.50
Sep-12 0.75 0 - 0.25 0.75 3.25 0.50
Dec-12 0.75 0 - 0.25 0.75 3.25 0.50
Mar-13 0.75 0 - 0.25 0.75 3.25 0.50
FY13/14 Jun-13 0.50 0 - 0.25 0.75 3.25 0.50
Sep-13 0.50 0 - 0.25 0.75 3.25 0.50
Dec-13 0.25 0 - 0.25 0.75 3.25 0.50
Mar-14 0.25 0 - 0.25 0.75 3.25 0.50
FY14/15 Jun-14 0.15 0 - 0.25 0.75 3.25 0.50
Sep-14 0.05 0 - 0.25 0.75 3.25 0.50
Dec-14 0.05 0 - 0.25 0.75 3.25 0.50
Mar-15 0.05 0 - 0.25 0.75 3.25 0.50
FY15/16 Jun-15 0.05 0 - 0.25 0.75 3.25 0.50
Sep-15 0.05 0 - 0.25 0.75 3.25 0.50
Dec-15 0.05 0 - 0.50 1.00 3.50 0.50
Mar-16 0.00 0 - 0.50 1.00 3.50 0.50
FY16/17 Jun-16 0.00 0 - 0.50 1.00 3.50 0.50
Sept-16 0.00 0 – 0.50 1.00 3.50 0.25
Dec-16 0.00 0 .50– 0.75 1.25 3.75 0.25
Mar-17 0.00 0.75–1.00 1.50 4.00 0.25
FY17/18 Jun-17 0.00 1.00–1.25 1.75 4.25 0.25
Sep-17 0.00 1.00–1.25 1.75 4.25 0.25
Dec-17 0.00 1.25-1.50 2.00 4.50 0.50
Mar-18 0.00 1.50-1.75 2.25 4.75 0.50
FY18/19 Jun-18 0.00 1.75-2.00 2.50 5.00 0.50
Sep-18 0.00 2.00-2.25 2.75 5.25 0.75
Dec-18 0.00 2.25–2.50 3.00 5.50 0.75
Mar-19 0.00 2.25–2.50 3.00 5.50 0.75
FY19/20 Jun-19 0.00 2.25-2.50 3.00 5.50 0.75
Sep-19 0.00 1.75-2.00 2.50 5.00 0.75
Dec-19 0.00 1.5-1.75 2.25 4.75 0.75
Mar-20 0.00 0-0.25 0.25 3.25 0.10
FY20/21 Jun-20 0.00 0.0-0.25 0.25 3.25 0.10
Sep-20 0.00 0.0-0.25 0.25 3.25 0.10
Dec-20 0.00 0.0-0.25 0.25 3.25 0.10
49
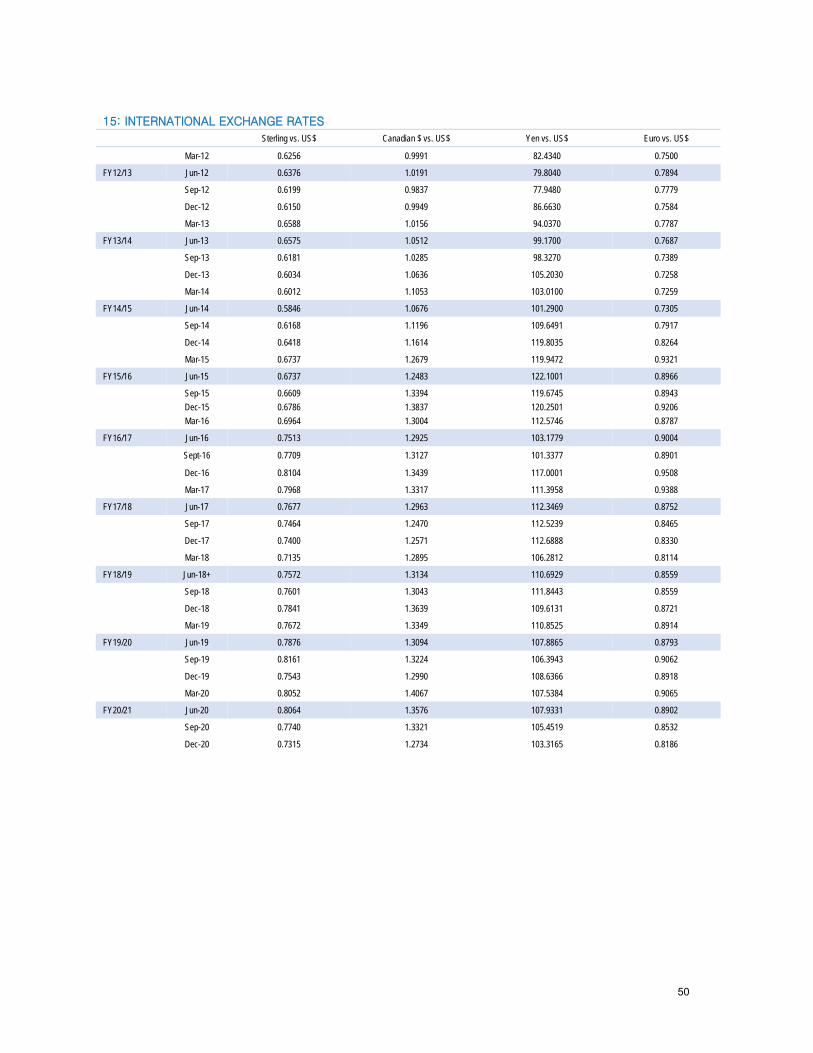
15: INTERNATIONAL EXCHANGE RATES
Sterling vs. US$ Canadian $ vs. US$ Yen vs. US$ Euro vs. US$
Mar-12 0.6256 0.9991 82.4340 0.7500
FY12/13 Jun-12 0.6376 1.0191 79.8040 0.7894
Sep-12 0.6199 0.9837 77.9480 0.7779
Dec-12 0.6150 0.9949 86.6630 0.7584
Mar-13 0.6588 1.0156 94.0370 0.7787
FY13/14 Jun-13 0.6575 1.0512 99.1700 0.7687
Sep-13 0.6181 1.0285 98.3270 0.7389
Dec-13 0.6034 1.0636 105.2030 0.7258
Mar-14 0.6012 1.1053 103.0100 0.7259
FY14/15 Jun-14 0.5846 1.0676 101.2900 0.7305
Sep-14 0.6168 1.1196 109.6491 0.7917
Dec-14 0.6418 1.1614 119.8035 0.8264
Mar-15 0.6737 1.2679 119.9472 0.9321
FY15/16 Jun-15 0.6737 1.2483 122.1001 0.8966
Sep-15 0.6609 1.3394 119.6745 0.8943 Dec-15 0.6786 1.3837 120.2501 0.9206 Mar-16 0.6964 1.3004 112.5746 0.8787
FY16/17 Jun-16 0.7513 1.2925 103.1779 0.9004
Sept-16 0.7709 1.3127 101.3377 0.8901
Dec-16 0.8104 1.3439 117.0001 0.9508
Mar-17 0.7968 1.3317 111.3958 0.9388
FY17/18 Jun-17 0.7677 1.2963 112.3469 0.8752
Sep-17 0.7464 1.2470 112.5239 0.8465
Dec-17 0.7400 1.2571 112.6888 0.8330
Mar-18 0.7135 1.2895 106.2812 0.8114
FY18/19 Jun-18+ 0.7572 1.3134 110.6929 0.8559
Sep-18 0.7601 1.3043 111.8443 0.8559
Dec-18 0.7841 1.3639 109.6131 0.8721
Mar-19 0.7672 1.3349 110.8525 0.8914
FY19/20 Jun-19 0.7876 1.3094 107.8865 0.8793
Sep-19 0.8161 1.3224 106.3943 0.9062
Dec-19 0.7543 1.2990 108.6366 0.8918
Mar-20 0.8052 1.4067 107.5384 0.9065
FY20/21 Jun-20 0.8064 1.3576 107.9331 0.8902
Sep-20 0.7740 1.3321 105.4519 0.8532
Dec-20 0.7315 1.2734 103.3165 0.8186
50

16: WORLD COMMODITY PRICES (Period Averages)
CRUDE OIL PRICES FOOD North Sea Brent
(US$/barrel – f.o.b.) West Texas Intermediate
(US$/barrel – f.o.b.) Wheat
(US$/mt, Average Winter) Coffee
(USc/kg, Arabica brand) FY11/12 Jun-11 117.10 102.56 320.60 636.54
Sep-11 112.48 89.76 293.06 597.37
Dec-11 109.29 94.06 265.07 536.18
Mar-12 118.60 102.94 268.88 486.95
FY12/13 Jun-12 108.86 93.50 260.39 400.35
Sep-12 109.95 92.22 341.46 399.96
Dec-12 110.45 88.19 346.48 357.12
Mar-13 112.91 94.40 309.51 335.49
FY13/14 Jun-13 103.01 94.23 294.50 319.86
Sep-13 110.10 105.83 281.76 298.23
Dec-13 109.41 97.48 292.20 276.82
Mar-14 107.88 98.67 280.67 382.67
FY14/15 Jun-14 109.78 102.98 292.86 467.06
Sep-14 102.08 97.07 238.17 455.92
Dec-14 76.01 73.16 248.61 464.59
Mar-15 53.93 48.63 231.09 389.21
FY15/16 Jun-15 62.10 57.97 210.64 354.39
Sep-15 50.03 51.52 189.86 336.22
Dec-15 43.41 42.18 190.10 327.74
Mar-16 34.36 33.45 190.23 330.86
FY16/17 Jun-16 45.95 45.50 183.79 346.71
Sept-16 45.80 44.94 156.02 378.80
Dec-16 50.08 49.29 156.18 385.71
Mar-17 54.12 51.91 165.66 364.09
FY17/18 Jun-17 50.25 48.28 177.79 329.68
Sep-17 51.74 48.20 183.94 327.83
Dec-17 61.47 55.40 177.43 307.79
Mar-18 66.95 62.87 190.71 301.42
FY18/19 Jun-18 74.49 67.88 210.30 296.87
Sept-18 75.48 69.50 215.61 277.04
Dec-18 67.37 58.81 211.01 295.09 Mar-19 63.27 54.90 212.06 279.84
FY19/20 Jun-19 68.34 59.81 204.21 272.94
Sept-19 61.86 56.45 195.06 287.03
Dec-19 62.65 56.96 214.61 311.92 Mar-20 50.53 46.17 227.33 312.86
FY20/21 Jun-20 31.43 27.85 209.22 327.55
Sep-20 42.72 40.93 205.47 350.23 Dec-20 44.52 42.66 223.26 337.70
51
Glossary
Quarterly Monetary Policy Report
Glossary
Amortization: The repayment of a loan in installments over an agreed period of time.
Base Money: The sum of notes and coins held by the public and the cash reserves of commercial banks (including both their
holding of cash and their deposits at the central bank). The monetary base is the operating target used in the BOJ monetary policy
framework and can be controlled through open market operations. Changes in the monetary base emanate from sources within the
net domestic assets (NDA) as well as the net international reserves (NIR).
Basis Point (bp): This is a unit of percentage measure which is equal to one hundredth of one percent ( 0.01% = 1bp). Basis points
is commonly used when discussing interest rates and fixed income securities.
Bond Market: The domestic bond market primarily captures debt instruments offered by the Central Government to fund its budgetary
needs.
Brexit: Brexit has become the abbreviated way of refering to the United Kingdon (UK) leaving the European Union (EU) it combines
the words British and exit. The referndum where citizens of the UK voted to exit the EU took place on the June 23, 2016.
Cash Reserve Requirement: The requirement by law that a percentage of deposit liabilities of deposit-taking institutions must be
held as interest free deposits at the Central Bank.
Core Inflation: Also called Underlying Inflation. It is that part of overall inflation that can be attributed to changes in base money.
Central Banks typically try to control core inflation because there are some parts of inflation that are outside of their control. One
example of this is the effect of changes in oil prices.
Credit: Loans extended by banks, building societies and other financial institutions.
Currency Issue: refers to Jamaican notes and coins in the hands of the public (currency in circulation) in addition to notes and coins
held by financial institutions in their vaults (vault cash). Bank of Jamaica redeems (buys) or issues (sells) notes and coins to financial
institutions when institutions have a demand for cash. The difference between currency issued and that which is redeemed during
a period of time is referred to as net currency issue.
Exchange rate (nominal): The number of units of one currency offered in exchange for another. For example a Jamaica dollar/
United States dollar exchange rate of ‘forty two dollars to one’ indicates that forty-two Jamaican dollars are needed to obtain one
United States dollar.
Exchange rate pass-through: The effect of exchange rate changes on one or more of the following: import and export prices,
consumer prices, investments and trade volumes.
Export Price Index: The export price index (EPI) is a weighted index of the prices of goods and services sold by residents of a country
to foreign buyers.
Foreign exchange cash demand/supply: The amount of foreign exchange purchased by market participants from the authorized
dealers and cambios, while cash supply/inflows is the amount sold to the Bank of Jamaica, authorized dealers and cambios by
market participants, private institutions and multilateral agencies.
Financial Programme: An integrated system of macroeconomic accounts and behavioural relationships defining the set of monetary,
fiscal and exchange rate policy measures designed to achieve specified macroeconomic targets.
52

Quarterly Monetary Policy Report Glossary
Financial Asset: An instrument issued by an institution (e.g. BOJ) that provides economic benefits, by (1) generating interest income
or net profits and (2) acting as a store of value. These benefits are created through a formal/informal borrowing/lending relationship.
Most common types of financial assets are money and credit.
Fiscal deficit: The excess of the Government’s expenditure over its revenue for a given period of time.
Fiscal Year: The twelve months beginning in April. Thus fiscal year 2000/2001 refers to the period April 2000 to March 2001.
Government Securities: Debt instruments issued by the Ministry of Finance either to bridge timing gaps between revenue and
expenditure or to cover any excess of expenditure over revenue. These securities include short-term instruments such as Treasury
Bills and more long-term ones like Local Registered Stock, or Debentures.
Gross Domestic Product (GDP): This is the total value of all goods and services produced within an economy over a particular time
period –either a year or three months.
Import Price Index: The import price index (IPI) is a weighted index of the prices of goods and services purchased by residents of
a country from foreign sellers.
Inflation: refers to the change in the general price level. In Jamaica, this is defined as the change in the Consumer Price Index (CPI)
calculated and published by the Statistical Institute of Jamaica.
Intermediate Target: An intermediate target of policy. e.g. the money supply or the exchange rate, has three main characteristics.
It is not directly determined by the Central Bank, it responds, however, to a stimulus that the Central Bank can vary, and its behaviourshould be closely related to the ultimate target-inflation.
Jamaica Central Securities Depository (JCSD): The Principal function of the JCSD is to provide for relatively risk-free settlement
of share transactions. It accomplishes this by employing an electronic, book-entry system for registering changes of ownership
of securities which eliminates the need for physical certificates. The JCSD also provides vaulting facilities for the safekeeping of
certificates.
JSE Indices: The JSE Index comprises all Ordinary Companies on the Main Market. The JSE Combined Index comprises all Ordinary
Companies on the Main Market and Junior Market. The JSE All Jamaican Composite Index comprises of only Jamaican Companies
on the Main Market. The JSE Select Index comprises the JSE’s 15 most liquid Securities on the Main Market. The JSE Cross Listed
Index is comprised of only foreign companies on the Main Market. The Junior Index comprises all Ordinary Companies on the Junior
Stock Market.
Liquid Asset: An asset is considered liquid if it can be easily and with little or no loss converted to cash. The liquid assets of
commercial banks in Jamaica include notes and coins, short-term deposits at the Bank of Jamaica, GOJ Treasury Bills, Local
Registered Stock maturing within 270 days and any GOJ security designated by the Ministry of Finance.
Money: Anything that is generally accepted in exchange for goods and services and for the payment of debt. (e.g. example, notes
and coins.). Hence money is said to be a medium of exchange. Money also serves as a means of storing wealth as well as a
standard of and unit of accounting for financial values and flows.
Money Multiplier: This defines the relationship between the monetary base (M0) and the money supply and is usually calculated as
the ratio of M3 to M0. It measures the maximum amount of money that can be created by the banking system given the provision of
an additional dollar to the system by the central bank. The money multiplier implies that when the central bank conducts monetary
policy in such a way as to increase the monetary base, the overall expansion in the money supply is a multiple of this initial increase.
This is also true if the central bank reduces the monetary base.
53

Glossary
Quarterly Monetary Policy Report
Money Supply: This is the stock of instruments or assets formally designated as money in a particular economy. There are
alternative measures of money supply both within and between countries. In Jamaica, the measurements of money that are
calculated and published are:
M1: Notes and coins in circulation + Demand Deposits
M2: M1+ Time and savings deposits
M3: M2 + Other Deposits.
A ‘J’ indicates that the components are Jamaican dollar liabilities only and an ‘*’ indicates that the components also include foreign
currency liabilities of the banking system.
Monetary Base: See Base Money
Monetary policy framework: This defines the transmission process through which policy actions taken by the Central Bank make an
impact on the final target - inflation. The components of a monetary policy framework are policy instruments, operating targets,
intermediate targets, and the ultimate goal/objective.
Monetary Policy Instruments: These are instruments used by the Central Bank to influence the money supply and credit. They include
open market operations and the reserve requirement ratio.
Net Domestic Assets: The difference between the monetary base and the NIR. It is comprised of the Bank’s net claims on the public
sector, mainly Central Government, open market operations liabilities and net claims on commercial banks and other financial
institutions.
Open Market Operations (OMO): Money market trading between the Bank of Jamaica and authorized dealers with the intention of
influencing money and credit in the financial system. OMO involves outright sale or purchase of GOJ securities from the stock of
securities held by BOJ, and/or repurchase and reverse repurchase transactions.
Operating Rate: The percentage of total production capacity of some entity, such as a country or a company that is being utilized
at a given time.
Operating Target: An operating target of policy e.g. the monetary base and interest rates, is influenced directly by the Central Bank
and is adjusted by the Bank in order to bring about the desired impact on its policy target.
Primary Dealer (PD): The set of intermediaries through which BOJ conducts open market operations. In developed country markets,
PD’s underwrite government issues as well as participate in block transactions with the central bank.
Public Sector Entities (PSE) Foreign Exchange Facility: A foreign exchange surrender facility for public sector entities which seeks
to centralize foreign currency demand. Under this facility Commercial Banks, Authorized Dealers and Cambios agreed to surrender
amounts in addition to the pre-existing requirements.
Quasi-Fiscal Costs: The cost to the central bank of sterilizing the liquidity effects of capital inflows.
Quasi-money: Savings Deposits plus Time Deposit.
Real Appreciation: An increase in the volume of foreign goods that can be bought with a unit of domestic currency; alternatively
it is a decrease in the volume of domestic goods that can be purchased with a unit of foreign currency. Thus, a real appreciation
makes exports less attractive and imports relatively cheaper. This may ensue from a nominal appreciation, which is the rise in the
unit price of the currency, or a greater increase in domestic prices relative to foreign prices, or both.
54

Quarterly Monetary Policy Report Glossary
Real Exchange Rate: The price of one country’s currency in terms of another, adjusted for the inflation differential between the
countries.
Real interest rate: This represents the rate of return on assets after accounting for the effects of inflation on the purchasing power
of the return. It is calculated by adjusting the nominal interest rate by the inflation rate.
Repurchase Agreement (repo): The purchase of a security from a primary dealer who agrees to repurchase the same at a specified
rate and an agreed future date.
Reserve Requirement: refers to the portion of deposit liabilities that financial institutions may not lend and have to retain either as
liquid assets or on deposit at the Bank of Jamaica.
Reverse Repurchase Agreements: An agreement whereby the Central Bank sells a security that it owns and agrees to buy back same
at a specified rate at an agreed future date.
Securities: Legal documents giving entitlement to property ownership, or claim on income e.g. bonds and stocks.
Signal Rate: Effective 1 July 2017, the Bank of Jamaica policy rate is the interest rate paid on overnight deposits held by deposit-takingiinstitutions ("DTIs") at Bank of Jamaica.
Special Drawing Right: The SDR is an interest-bearing international reserve asset created by the IMF to supplement the official
reserves of member countries.
Statutory Cash Reserves: That portion of deposit liabilities of deposit-taking institution, which by a statutorily based stipulation, must
be held as interest-free deposits at the Central Bank.
Sterilization: The use of open market operations to prevent intervention in the foreign exchange market from changing the monetary
base. With sterilization, any purchase of foreign exchange is accompanied by an equal-value sale of domestic bonds and vice
versa.
Time deposit: A bank account based on a contractual arrangement between the deposit taking institution and the depositor where
both parties agree to a pre-determined interest rate and maturity date, on which deposits earn interest and premature withdrawals
from which require advance notice.
Terms of Trade: An index of the ratio of export prices to the index of import prices. An improvement in the terms of trade follows
if export prices rise more quickly than import prices.
Tourism Implicit Price Index: a measure of prices in the tourism industry as reflected by average daily expenditure per tourist.
55

List of Boxes
QMPR ISSUE LIST OF BOXES
Oct – Dec 2000 1 Sovereign Credit Ratings & Outlook
2 E-Gate & The Foreign Exchange Market
3 The International Oil Market: Recent Developments and Outlook
4 Jamaica’s IMF Staff Monitored Programme (SMP)
Jan – Mar 2001 5 Core Inflation in Jamaica – Concept & Measurement
6 Highlights of the IMF 2001 Article IV Consultation
Apr – Jun 2001 7 Jamaica’s Banking Sector Recovery – An Overview
8 Jamaica’s Sovereign Credit Ratings – An Update
9 Highlights of the IMF’s May 2001 Article IV Consultation
Jul – Sep 2001 10 Innovations in Jamaica’s Payment System
11 Expanding the Role of Equity Finance in Jamaica: Some Perspectives
12 The US Economy: Recent Trends and Prospects
Oct – Dec 2001 13 The Performance of Remittances in the Jamaican Economy: 1997 - 2001
14 Tourism and the Jamaican Economy: Pre & Post 11 September 2001
15 World Trade Organization (WTO): Outcome of the Fourth Ministerial Conference in Doha. Qatar
and the Possible Implications for Jamaica
Jan – Mar 2002 16 Commercial Bank Probability: January to December 2001
17 Regional Disparities in Jamaica’s Inflation – 1997/98 to 2001/02
18 The Argentina Debt Crisis & Implications for Jamaica
19 General Data Dissemination Standards
Apr – Jun 2002 20 The Automated Clearing House: Implications for the Payment System
21 Macroeconomic Implications of Cross Border Capital Flows: Some Scenarios
22 Performance of Remittances in the Latin American and Caribbean Region – 1997 to 2001
Jul – Sep 2002 23 Building Societies’ New Mortgage Loans: July 2001 – June 2002
24 An Overview of the CARICOM Single Market and Economy (CSME)
Oct – Dec 2002 25 The Profitability of the Banking System: 1991 - 2002
26 Interest Rates Spreads in Jamaica: 1995 - 2002
27 Implications of the International Accounting Standards (IAS) for Financial Systems and
Financial Stability
Jan – Mar 2003 28 Opportunities for Savings and Investments in Jamaica: Financial Intermediaries and Financial
Instruments
29 The CPI and the GDP Deflator: Concepts and Applications
Apr – Jun 2003 30 The Concept and Measurement of External Competitiveness
31 Exchange Rate Pass-Through in the Jamaican Economy
Jul – Sep 2003 32 The International Investment Position
33 The Fifth WTO Ministerial Conference: Implications for Future Trading Negotiations
Oct – Dec 2003 34 The Monetary Policy Committees: International Precedents and Macroeconomic Context
35 Macroeconomic Determinants of Nominal Interest Rate
Jan – Mar 2004 36 Recent Trends and Prospects in the Balance of Payments
37 The Exchange Rate Regime and Monetary Policy
Apr – Jun 2004 38 Preserving Financial Stability
39 Financial Sector Assessment Programme
40 Jamaica’s Current Relationship with the IMF
Jul – Sep 2004 41 Recent Developments in Crude Oil Prices
42 Implications of Higher Crude Oil Prices for the Balance of Payments and Inflation
Oct – Dec 2004 43 Recent Trends in Foreign Direct Investment
56

44 Exploring the Jamaican Foreign Exchange Market Dynamics: 2001 – 2004 (Special Feature)
Jan – Mar 2005 45 The BOJ Macroeconomic Stress Testing Programme and Financial Stability
46 Issues of Foreign Reserve Adequacy
Apr – Jun 2005 47 Credit Bureaux and Financial Market Efficiency
48 Trends in Labour Productivity
Jul – Sep 2005 49 Inflation in Selected Caribbean Countries
50 International Developments (Special Feature)
Oct – Dec 2005 51 Payment Systems Reform
Jan – Mar 2006 52 The IMF’s Code of Good Practices on Transparency on Monetary policy: A Summary of the
IMF’s Assessment Report on Jamaica
Apr – Jun 2006 53 Trends in Private Sector Credit: FY2001/02 to FY2005/06
54 Exploring the Interest Rate Differential between Jamaica Dollar and US Dollar Denominated
Assets: Jan 2001 – June 2006
55 Jamaica Labour Market: Trends and Key Indicators – 1996 to 2005
Jul – Sep 2006 56 Labour Market Update – June 2006
57 The Special (Upper Income) Consumer Price Index
58 Jamaica Interim Staff Report Under Intensified Surveillance: Executive Summary
Oct – Dec 2006 59 Factors Influencing the Demand for Currency Issued by the BOJ & the Impact of Currency
Demand on the Balance Sheet of Financial Institutions
Jan – Mar 2007 60 Jamaica’s Financial Programme
61 Inflation Expectation Survey
62 The Producer’s Price Index
Apr – Jun 2007 63 Measuring Core Inflation: Emerging Issues
Jul – Sep 2007 64 The Turbulence in the US Subprime Mortgage Market
65 The Revised Consumer Price Index
Oct – Dec 2007 66 Trends in Jamaica’s Fuel Demand
67 Trends in Inflation
68 The EU-CARIFORUM Economic Partnership Agreement
Jan – Mar 2008 69 Impact of a Potential US Recession on the Jamaican Economy
70 Recent Trends in International Commodity Prices
Apr – Jun 2008 71 Global Monetary Policy Response to Spiralling Commodity Prices
Jan – Mar 2009 72 BOJ’s Monetary Policy Response to the Global Financial Crisis
73 The Transmission of Monetary Policy in Jamaica
74 Monetary Policy, Economic Growth and Inflation
Apr – Jun 2009 75 The International Monetary Fund (IMF) and Jamaica’s Experience with the IMF
Jul – Sep 2009 76 Fiscal Responsibility Frameworks/Fiscal Rules
Oct – Dec 2009 77 Bank of Jamaica Liquidity Support to the Government: November 2009 – January 2010
78 The Dynamics of Jamaica’s Interest Rate
79 Jamaica’s Medium-Term Economic & Financial Programme: FY2009/10 – FY2013/14
Jan – Mar 2010 80 Jamaica’s Inflation: How Much is Enough?
81 The Jamaica Debt Exchange
Apr – Jun 2010 82 Exchange Rates and External Price Competitiveness
83 Adequacy of the BOJ’s Gross International Reserves
Jul – Sep 2010 84 Preserving Financial Stability (revisited)
85 Credit Bureaux and the Efficiency of Credit Markets (updated)
Oct – Dec 2010 86 An Inflation Targeting Framework for Jamaica
Jan – Mar 2011 87 The Middle East and North Africa (MENA) Crisis and its Implication for the Jamaican Economy
Apr – Jun 2011 88 Evolution of the European Debt Crisis & its Impact on Jamaica
Jul – Sep 2011 89 Electronic Small-Value Retail Payments: Recent Trends and the Relationship with Economic
Growth
Oct – Dec 2011 90 Productivity and Growth
Jan – Mar 2012 91 External Competitiveness in Jamaica
Apr – Jun 2012 92 The Importance of Managing Inflation Expectations
57

Jul – Sep 2012 93 A Preliminary Assessment of the Impact of Hurricane Sandy on Prices – Results from a Field
Survey
Oct – Dec 2012 94 Fiscal Expenditure Multipliers and Economic Growth
Jan – Mar 2013 95 Jamaica’s Medium-Term Economic & Financial Programme: FY2013/14 – FY2017/18
Apr – Jun 2013 96 The Evolution of the Jamaica Dollar Liquidity and its Impact on Money Market Rates: January
to June 2013
97 Recent Trends and Developments in Remittances
Jan – Mar 2014 98 The Bank of Jamaica’s Quarterly Credit Conditions Survey (recurrent)
Apr – Jun 2014 99 Jamaica’s Macroeconomic Programme under the EFF (recurrent)
100 Monetary Policy Transmission Mechanism (recurrent)
Jul – Sept 2014 101 Changes to the Liquidity Management Framework for Deposit-taking Institutions
Oct – Dec 2014 102 Recent Developments in Crude Oil Prices
Jan – Mar 2014 103 An Examination of Current Account Financing from the BPM6 Perspective
Jul – Sept 2015 104 Inflation Differential
105 Trends in selected measures of Labour Productivity
Oct – Dec 2015 106 Impact of Increases in the Federal Funds Rate on the Jamaican Economy
107 A technical examination of the recent stock market appreciation
Jan – Mar 2016 108 Macroeconomic Model (MonMod) Component Contribution to Inflation (recurrent)
109 Businesses’ Inflation Expectations Survey (recurrent)
Apr – Jun 2016 110 Implication of “Brexit on the Jamaican Economy”
111 Corporate Securities
Jul – Sep 2016 112 Strengthening Monetary Transmission, Fine-tuning BOJ Interest Rate Corridor
113 Developments and Trends in Credit Reporting in Jamaica
Oct – Dec 2016 114 Recent Developments and Prospects for the International Oil Market
115 Jamaica’s Macroeconomic Programme under the new SBA (recurrent)
Jan – Mar 2017 116 A Review of the Performance of Government of Jamaica Global Bonds
117 BOJ Signals Upgrade of FX Market Operations
Apr – Jun 2017 118 BOJ’s New Foreign Exchange Intervention & Trading Tool
119 Analysis of the improving Trend in DTIs’ Non-Performing Loans for the Five Years ended
December 2016
Oct – Dec 2017 120 Global Economic Growth in Selected Economies
Apr – Jun 2018 121 Why Inflation was Lower than Target
122 Moody’s Investors Service Rating Action
Oct – Dec 2018 123 Recent Developments and Prospects for the International Oil Market
124 Economic Growth in Selected Economies (recurrent)
125 Credit Conditions Survey (recurrent)
Apr – Jun 2019 126 The impact of Jamaica’s transition to LNG on electricity rates
Jan – Mar 2020 127 Assessment of the COVID-19 Epidemiological Curve
Apr – Jun 2020 128 The New Consumer Price Index
129 COVID-19 Developments
Jul – Sep 2020 130 The Impact of Regulated Price Increases on Inflation
Oct – Dec 2020 131 Quarterly Means of Payment Assessment
58