february 22, 2001 alaskan pipeline meeting agenda introduction to enron & el paso assessing the...
TRANSCRIPT

February 22, 2001
Alaskan Pipeline Meeting
Agenda
Introduction to Enron & El Paso
Assessing the Alaskan Gas Impact
Enron & El Paso Value Added

Enron Overview
$74 Billion Corporation headquartered in Houston, Texas
Largest Wholesale Marketer of Natural Gas
Largest Wholesale Marketer of Electricity
Owner/Operator of Major US Natural Gas Pipelines
Northern Natural Gas
TransWestern Pipeline
Northern Border (operator/partial owner)
Florida Gas Transmission (operator/partial owner)
Bridgeline Holdings (partial owner)
Owner/Operator of Electric Generation Worldwide6000 MW in US
5400 MW internationally

Enron Interstate Pipelines
Transwestern
Northern Natural
Northern Border
Florida Gas

El Paso/Coastal Overview
Merger received FTC approval January 29, 2001
$50+ Billion Corporation headquartered in Houston, Texas
Largest U.S. Owner/Operator of Major InterstatesTennessee Gas Pipeline
ANR
El Paso Natural Gas
SONAT
Colorado Interstate
Florida Gas Transmission (partial owner)
Portland (partial owner)
Great Lakes (partial owner)
Alliance (partial owner)
Largest US Storage Owner/Operator
Second largest US Gas Wholesale Marketer

Current El Paso Interstate Pipelines
El PasoCoastal

Combined Enron and El PasoInterstate Pipelines
El PasoCoastalEnronEnron/El Paso

Enron & El Paso Combined Presence
Over 95,000 miles of pipe in U.S.
27 Bcf/d interstate transport
39 Bcf/d gas marketed in U.S.
10,700 MW of U.S. electric generation
757 MM MWhs marketed
615 Bcf of storage working gas
11 Bcf/d storage deliverability

Assessing the Alaskan Gas Impact
Current Forecasts
Big Bang Growth Case
Impact of Alaska Gas Arriving in 2010
Impact of Alaska Gas Arriving in 2007

2010 Demand Forecasts
(Tcf) GRI NPC Gov't* WEFA
US (incl exports to Mexico) 29.5 29.4 28.8 28.3
Canada 3.3 3.5 4.3 3.7
"North America" 32.8 32.9 33.1 32.0
Bcfd 89.9 90.1 90.7 87.7
* EIA's AEO 2001 and NEB's Supply/Demand to 2025
(Tcf) GRI NPC Gov't* WEFA
US (incl exports to Mexico) 29.5 29.4 28.8 28.3
Canada 3.3 3.5 4.3 3.7
"North America" 32.8 32.9 33.1 32.0
Bcfd 89.9 90.1 90.7 87.7
* EIA's AEO 2001 and NEB's Supply/Demand to 2025

Volatility in Forecasts
Forecasts for 2010
27.5
28.0
28.5
29.0
29.5
30.0
1997 1998 1999 2000 2001
Forecast Year
Tcf
EIA
GRI
U.S. Only
Forecasts for 2010
27.5
28.0
28.5
29.0
29.5
30.0
1997 1998 1999 2000 2001
Forecast Year
Tcf
EIA
GRI
U.S. Only

Forecasts for Electric Gen Growing
3400
3500
3600
3700
3800
3900
4000
4100
4200
4300
1999 2000 2001 2002 2003 2004 2005 2006 2007 2008 2009
Forecast Year
Mil
lio
ns
of
MW
h
1991 1992
1993 1994
1995 1996
1997 1998
1999 2000
2001
U.S. Only
3400
3500
3600
3700
3800
3900
4000
4100
4200
4300
1999 2000 2001 2002 2003 2004 2005 2006 2007 2008 2009
Forecast Year
Mil
lio
ns
of
MW
h
1991 1992
1993 1994
1995 1996
1997 1998
1999 2000
2001
U.S. Only
Source: NERC Load & Resource Reports

Big Bang Growth Case
EEA Model used as Base StructureEngine for GRI and Other Forecasts
1998 Base Data
North American PerspectiveUpdated Projections of Canadian Demand
Net Mexico Demand
Exogenous ModificationsLNG, Sable Island
Alaskan Supply
Unconstrained Supply

Big Bang Growth Case
23.2
26.5
9.9
7.20.1
29.2
32.8
24.2
9.61.0
1998 Growth 2010
Mexico
L, P & F
Electric
Industrial
R&C
96.8
66.9
6.3 / 1.9%
14.3 / 8.1%
.9 / >100%
Growth/CAGR29.9 / 3.0%
6.0 / 1.6%
2.4 / 2.5%
Bcfd
23.2
26.5
9.9
7.20.1
29.2
32.8
24.2
9.61.0
1998 Growth 2010
Mexico
L, P & F
Electric
Industrial
R&C
96.8
66.9
6.3 / 1.9%
14.3 / 8.1%
.9 / >100%
Growth/CAGR29.9 / 3.0%
6.0 / 1.6%
2.4 / 2.5%
Bcfd

U.S. GDP grows at 2.5% per year
North American electric demand grows at 1.9% per year
Industrial production grows at 3% per year
Canadian GDP grows at 3% per year through 2005,
then slows to 2% per year thereafter
Canadian Tar Sands production’s demand for gas grows to 1 Bcfd
by 2010
RACC declines to $22.58/bbl by end of 2002 and
grows at 1.5% per year (nominal) thereafter
Background Assumptions

Major Predictions
Coal generation capacity flat
Exports to Mexico grow to 1.0 Bcfd by 2005 and
remain flat thereafter
LNG imports exceed 3.5 Bcfd by 2010
Sable Island production up to 2 Bcfd by 2010

Major Projections
Gas grows at 3% per yearAlaska gas increases demand by 2.6 Bcfd (excluding LP&F impact)
Nominal prices at Henry Hub peak at $4.35 during the forecast period
$4.99
$3.65
$4.46
$3.60 $3.48
$2.76
$4.18 $4.28
$4.53
$5.18
$4.66
$2.00
$2.50
$3.00
$3.50
$4.00
$4.50
$5.00
$5.50
2001 2002 2003 2004 2005 2006 2007 2008 2009 2010
Henry Hub Chicago AECO-C
$4.99
$3.65
$4.46
$3.60 $3.48
$2.76
$4.18 $4.28
$4.53
$5.18
$4.66
$2.00
$2.50
$3.00
$3.50
$4.00
$4.50
$5.00
$5.50
2001 2002 2003 2004 2005 2006 2007 2008 2009 2010
Henry Hub Chicago AECO-C

Big Bang Demand Case
Tcf Bcfd
GRI 2000 Baseline 32.8 89.9
+ Exports to Mexico 0.1 0.4
+ Electric Growth 0.2 0.5
+ Canadian Demand 1.2 3.2
Big Bang Demand 34.3 93.9
+ Fuel Switching 0.9 2.6
+ Lease, Plant & Fuel 0.1 0.3
Big Bang Demand w/ Alaska 35.3 96.8
Tcf Bcfd
GRI 2000 Baseline 32.8 89.9
+ Exports to Mexico 0.1 0.4
+ Electric Growth 0.2 0.5
+ Canadian Demand 1.2 3.2
Big Bang Demand 34.3 93.9
+ Fuel Switching 0.9 2.6
+ Lease, Plant & Fuel 0.1 0.3
Big Bang Demand w/ Alaska 35.3 96.8

Mexico
2.7% AAGR in demand for natural
gas from 1991 to 1997
Total gas demand forecasted to
grow 5.3 Bcfd by 2008Annual growth rate exceeding 9%
Electric Sector expected to grow at a
rate exceeding 20% – 2.5 Bcfd 0
1000
2000
3000
4000
5000
6000
7000
8000
9000
10000
19
99
20
00
20
01
20
02
20
03
20
04
20
05
20
06
20
07
20
08
MMCFD
Residential and Transport
Industrial
Electric Sector
Oil and Petrochemical
0
1000
2000
3000
4000
5000
6000
7000
8000
9000
10000
19
99
20
00
20
01
20
02
20
03
20
04
20
05
20
06
20
07
20
08
MMCFD
Residential and Transport
Industrial
Electric Sector
Oil and Petrochemical
Source: Natural Gas Market Perspective 1999-2008, Ministry of Energy.
Race between gas infrastructure investment and electric
generation
Production estimated grow at 7%
rate1998 Production = 1.26 Tcf or 3.5 Bcfd
Over 78% located in southern regions

Mexico Will Continue toRely on Natural Gas Imports
Source: Natural Gas Market Perspective 1998-2007 & 1999-2008, Ministry of Energy.
Balance (supply less demand)M
MC
FD
Balance with investment Balance without investment
500
0
500
1000
1500
2000
2500
3000
3500
20
02
20
03
20
04
20
05
20
06
20
07
20
08
19
99
20
00
20
01
Mexico’s demand for U.S. gas modeled to grow to 1 Bcfd by
2005 and remain flat thereafter

U.S & Canadian ElectricLoad Growth
4,000
4,200
4,400
4,600
4,800
5,000
5,200
5,400
5,600
5,800
1999 2010
TWh
4,000
5,800
4,900
4,200
4,000
4,200
4,400
4,600
4,800
5,000
5,200
5,400
5,600
5,800
1999 2010
TWh
4,000
5,800
4,900
4,200
4,9339.0 / 24.7
3.9 / 10.7
Big BangTcf / Bcfd
Load Growth per NERC 2000 ES&D; Reliability Assessment
Base Projection 1.9% / yr
Upper Band 3.4% / y
r
Lower Band .4% / yr

Canadian Natural Gas Demandby 2010
Total Canadian demand in 1999 was 8.0 Bcfd
NEB forecasts consumption in 2010 at 4.3 Tcf or
11.8 BcfdAnnual GDP growth of 3% through 2005, decelerating to 2%
thereafter
40% of growth occurs in eastern provinces
(Ontario, Quebec and Maritimes)
Oil Sands production now estimated by NEB to
require 1 Bcfd of natural gas by 2010.6 Bcfd included in NEB June ’99 forecast
Sources: Statistics Canada websiteNEB, Canadian Energy, Supply & Demand to 2025; June 1999NEB, Canada’s Oil Sands; October 2000

Demand Response
29.2
32.6
21.9
9.3
1.0
29.2
32.8
24.2
9.61.0
2010 w/o Alaska Gas Demand Response 2010 w/ Alaska Gas
Mexico
L, P & F
Electric
Industrial
R&C
96.893.9
.3
2.3
.3
2.9
29.2
32.6
21.9
9.3
1.0
29.2
32.8
24.2
9.61.0
2010 w/o Alaska Gas Demand Response 2010 w/ Alaska Gas
Mexico
L, P & F
Electric
Industrial
R&C
96.893.9
.3
2.3
.3
2.9

Big Bang Supply in 2010
GRI Big
Bang
Lower 48 67.4 61.7
Alaska 1.8 5.5
WCSB 19.9 22.3
Eastern Canada 0.7 2.2
LNG 0.4 3.5
Storage, Balancing (0.3) 1.5
Big Bang Supply 90.0 96.7
BCFD
GRI Big
Bang
Lower 48 67.4 61.7
Alaska 1.8 5.5
WCSB 19.9 22.3
Eastern Canada 0.7 2.2
LNG 0.4 3.5
Storage, Balancing (0.3) 1.5
Big Bang Supply 90.0 96.7
BCFD

LNG
700 Tcf of Stranded Gas
Estimated worldwide LNG export capability in 2010 up to 12 Tcf
/ yr
LNG landed cost in U.S. $3.00 to $3.50 / MMBtu
U.S. LNG receiving terminals’ sendout capacityCurrent/ w/ Economically Big
Service Initial Expandable BangDate Capacity Capacity Flow
Distrigas Active 450 740 600
Cove Point Early 2002 1000 1800 1200
Elba Island Early 2002 540 790 600
CMS Trunkline Active 700 1200 800
Baja California 2005 700 700 350
Bahamas, Seattle, N Carolina . . . ???
LNG imports in 2010 will exceed 3.5 Bcfd

Sable Island
Sable Island production will reach 2.2 Bcfd by 2010
.2
.4.2.4
.2
.6
.2
.6
.2
.2
.7
.4
.2
.7
.8
1.0
2.2
0.0
0.5
1.0
1.5
2.0
2.5
Bcfd
2001 2002 2003 2004 2005 2006 2007 2010
Domestic Export Panuke
Ziff Energy Big Bang Case
.2
.4.2.4
.2
.6
.2
.6
.2
.2
.7
.4
.2
.7
.8
1.0
2.2
0.0
0.5
1.0
1.5
2.0
2.5
Bcfd
2001 2002 2003 2004 2005 2006 2007 2010
Domestic Export Panuke
Ziff Energy Big Bang Case

Snapshot of 35 Tcf
World in 2010

Excludes Lease, Plant & Fuel
Major Demand Growth (1998-2010)
8.212.4
4.2
Northeast
5.17.2
2.1
California
6.09.3
3.3
Canada
8.512.1
3.6
Midwest
3.66.7
3.1
Southeast
3.75.5
1.7
Central
14.517.1
2.6
WSC
59.786.3
26.6
Legend (Bcfd)
19
98
20
10

66.895.9
29.1
Legend (Bcfd)
19
98
20
10
Supply Response (1998 – 2010)
14.220.2
5.2
GOM
1.25.5 4.3
Alaska
12.815.6
2.9
Tx/La
16.6
22.3
5.8
WCSB
0.0 2.2 2.2
Maritimes
3.27.7
4.5
Rockies
0.23.2 3.0
LNG
0.0 0.4 0.4
LNG
Bcfd
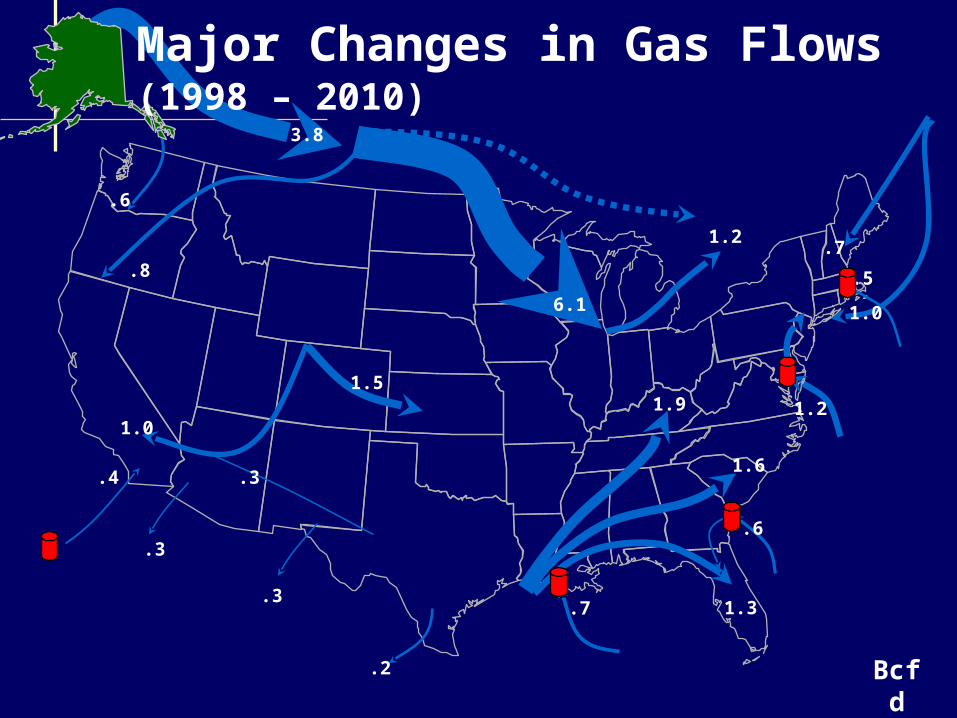
Major Changes in Gas Flows(1998 – 2010)
3.8
6.1
1.0
1.3
.7
1.0
1.6
1.9 1.2
.2
.3
1.2
1.5
.4
.7
.6
.8 .5
.6
.3
.3

Pipeline Infrastructure Required to Move 35 Tcf
4.0
1.1
1.3
.4
1.1
.8
1.2
.3
.5
1.0
1.1
.6
.5
.5
Offshore connections
.9
* Alliance capacity shown wet
.9
5.7 *
9.0
.9
1.5 * .7
.2
.7
2.5

NoCal3.35
AECO-C2.76
Chicago3.65
Henry3.65
Opal3.16
Gas PricesBasis
New York4.57
Gas Prices & Basis(35 Tcf in 2010 – Nominal $)
.49
.59 .89
.00.92
2009 2010 2009 2010
AECO-C 3.48 2.76 2.73 2.11
Chicago 4.66 3.65 3.65 2.79
Henry Hub 4.28 3.65 3.35 2.79
Nominal 1999$
2009 2010 2009 2010
AECO-C 3.48 2.76 2.73 2.11
Chicago 4.66 3.65 3.65 2.79
Henry Hub 4.28 3.65 3.35 2.79
Nominal 1999$
1.81

Impact of Alaskan Gas in 2010:35 Tcf Market
2.9 Bcfd Demand Response
$1.00 Temporary Depression in Chicago
Price
More Infrastructure Needed from Western
Canada to California and to Chicago1.8 Bcf to California
4.2 Bcf to Chicago

Impact of Alaskan Gas in 2007:33 Tcf Market
2.9 Bcfd Demand Response
Demand at 35 Tcf by 2010
$1.00 Temporary Depression in Chicago
Price
Recovers by 2010
More Infrastructure Needed from Western Canada
to California and to Chicago
1.3 Bcf to California
4.2 Bcf to Chicago

NoCal3.14
AECO-C2.73
Chicago3.26
Henry3.23
Opal2.41
New York5.08
Gas Prices & Basis(33 Tcf in 2007 – Nominal $)
.85
.41 .53
.031.85
2.35
Gas PricesBasis
2006 2007 2008 2010
AECO-C 3.42 2.73 2.90 3.45
Chicago 4.26 3.26 3.41 4.15
Henry Hub 3.94 3.23 3.40 4.15
2006 2007 2008 2010
AECO-C 3.42 2.73 2.90 3.45
Chicago 4.26 3.26 3.41 4.15
Henry Hub 3.94 3.23 3.40 4.15

Summary
Demand Will Follow Supply
Adequate Netback to Alaska
Significant “B to C” Infrastructure Needed
AECO Hub is Gateway to East / West Optionality
New York via TransCanada
Chicago via Alliance, Northern Border
California via PGT
Continuous Market Intelligence Critical Given
Dynamic Markets

El Paso and Enron
Value Added

Why are we Interested?
Strategic Focus on the North
Development of New Gas Supply
Increase clean BTU supplies to N. America
Allow market growth
Improve utilization of existing pipeline grid
Opportunities for New Investment
Significant N. American Pipeline Project
A Core Competency – “It’s What We Do For A
Living!”

How Can We Add Value?
U.S. Political/Regulatory Expertise
FERC
Environmental Agencies
Governmental Players
Successful Market Players
Trading/Marketing/Risk Management
Consumers - Power Plants (~13,000 MW/~2.2 Bcfd)
Enron currently owns 6000 MW in US
Market Access
Involved in all major U.S. markets
Excellent relationships with consumers
Owner of significant import capacity

How Can We Add Value?
EPC Expertise
Physical Operating Capability
Recognized “Best in Class”
Existing Infrastructure
Economies of Scale
Widely Respected “Industry Innovators”
Source of Equity
Management Commitment

Conclusions
Demand Will Be There IF Confidence in
Supply Maintained
Pricing Levels in 2007 – 2010 Appear to
Support Alaskan Gas
El Paso & Enron Can Supply Considerable
Pipeline & Market Expertise