fed balancing act jobs growth, inflation and
TRANSCRIPT

STRINGERAsset Management
1For Financial Professionals Only
STRINGERAsset Management
March 2022 OutlookHow the U.S. Economy is Sheltered From Global Risks
-- For Financial Professionals Only --Stringer Asset Management, LLC | Email: [email protected] | Phone: 901-800-2956

STRINGERAsset Management
2For Financial Professionals Only
Agenda
» Preliminary Performance
» Broad Outlook
» Favored Choices
» The Cash Indicator
STRINGERAsset Management
3For Financial Professionals Only
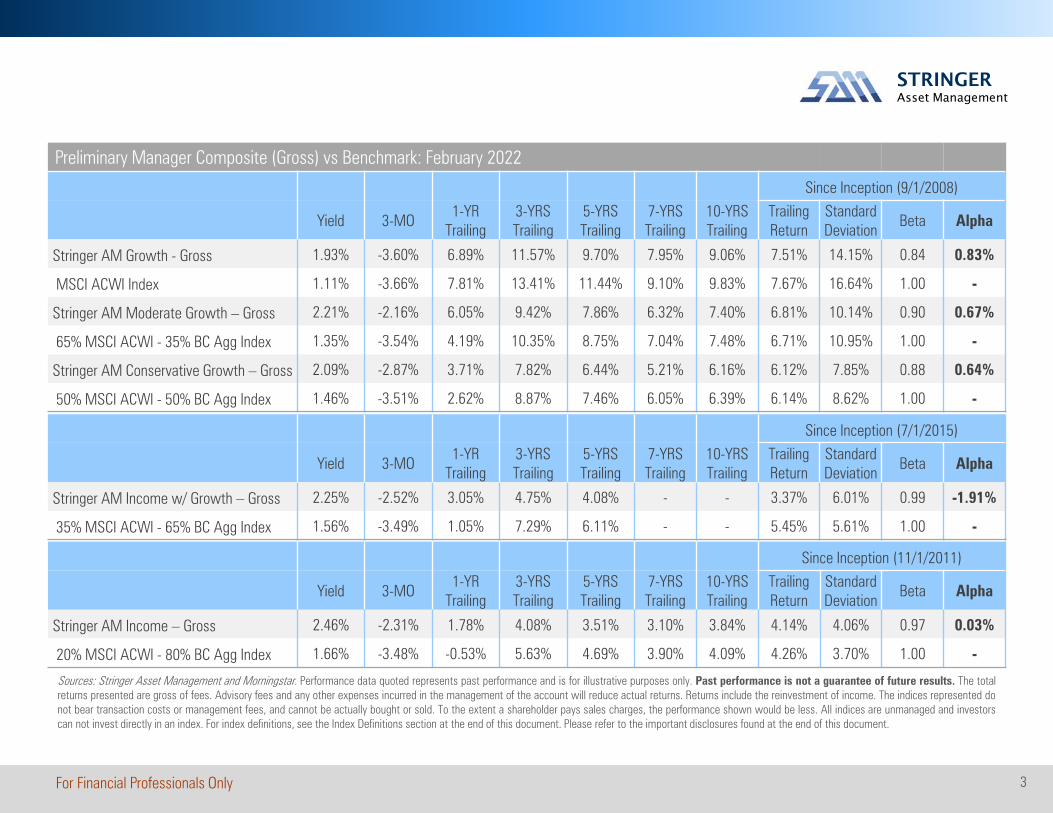
Preliminary Manager Composite (Gross) vs Benchmark: February 2022
Since Inception (9/1/2008)
Yield 3-MO1-YR
Trailing3-YRS Trailing
5-YRS Trailing
7-YRS Trailing
10-YRS Trailing
Trailing Return
Standard Deviation
Beta Alpha
Stringer AM Growth - Gross 1.93% -3.60% 6.89% 11.57% 9.70% 7.95% 9.06% 7.51% 14.15% 0.84 0.83%
MSCI ACWI Index 1.11% -3.66% 7.81% 13.41% 11.44% 9.10% 9.83% 7.67% 16.64% 1.00 -
Stringer AM Moderate Growth – Gross 2.21% -2.16% 6.05% 9.42% 7.86% 6.32% 7.40% 6.81% 10.14% 0.90 0.67%
65% MSCI ACWI - 35% BC Agg Index 1.35% -3.54% 4.19% 10.35% 8.75% 7.04% 7.48% 6.71% 10.95% 1.00 -
Stringer AM Conservative Growth – Gross 2.09% -2.87% 3.71% 7.82% 6.44% 5.21% 6.16% 6.12% 7.85% 0.88 0.64%
50% MSCI ACWI - 50% BC Agg Index 1.46% -3.51% 2.62% 8.87% 7.46% 6.05% 6.39% 6.14% 8.62% 1.00 -
Since Inception (11/1/2011)
Yield 3-MO1-YR
Trailing3-YRS Trailing
5-YRS Trailing
7-YRS Trailing
10-YRS Trailing
Trailing Return
Standard Deviation
Beta Alpha
Stringer AM Income – Gross 2.46% -2.31% 1.78% 4.08% 3.51% 3.10% 3.84% 4.14% 4.06% 0.97 0.03%
20% MSCI ACWI - 80% BC Agg Index 1.66% -3.48% -0.53% 5.63% 4.69% 3.90% 4.09% 4.26% 3.70% 1.00 -
Sources: Stringer Asset Management and Morningstar. Performance data quoted represents past performance and is for illustrative purposes only. Past performance is not a guarantee of future results. The totalreturns presented are gross of fees. Advisory fees and any other expenses incurred in the management of the account will reduce actual returns. Returns include the reinvestment of income. The indices represented donot bear transaction costs or management fees, and cannot be actually bought or sold. To the extent a shareholder pays sales charges, the performance shown would be less. All indices are unmanaged and investorscan not invest directly in an index. For index definitions, see the Index Definitions section at the end of this document. Please refer to the important disclosures found at the end of this document.
Since Inception (7/1/2015)
Yield 3-MO1-YR
Trailing3-YRS Trailing
5-YRS Trailing
7-YRS Trailing
10-YRS Trailing
Trailing Return
Standard Deviation
Beta Alpha
Stringer AM Income w/ Growth – Gross 2.25% -2.52% 3.05% 4.75% 4.08% - - 3.37% 6.01% 0.99 -1.91%
35% MSCI ACWI - 65% BC Agg Index 1.56% -3.49% 1.05% 7.29% 6.11% - - 5.45% 5.61% 1.00 -
STRINGERAsset Management
4For Financial Professionals Only
0%
2%
4%
6%
8%
10%
0% 5% 10% 15% 20%
StringerAM Growth (Gross) - Sept. 2008
MSCI ACWI Index
StringerAM Moderate Growth (Gross) - Sept. 2008
65% MSCI ACWI - 35% Bloomberg Barclays U.S. Agg Index
StringerAM Conservative Growth (Gross) - Sept. 2008
50% MSCI ACWI - 50% Bloomberg Barclays U.S. Agg Index
StringerAM Income (Gross) - Nov. 2011
20% MSCI ACWI - 80% Bloomberg Barclays U.S. Agg Index
Annualized Return
Standard Deviation
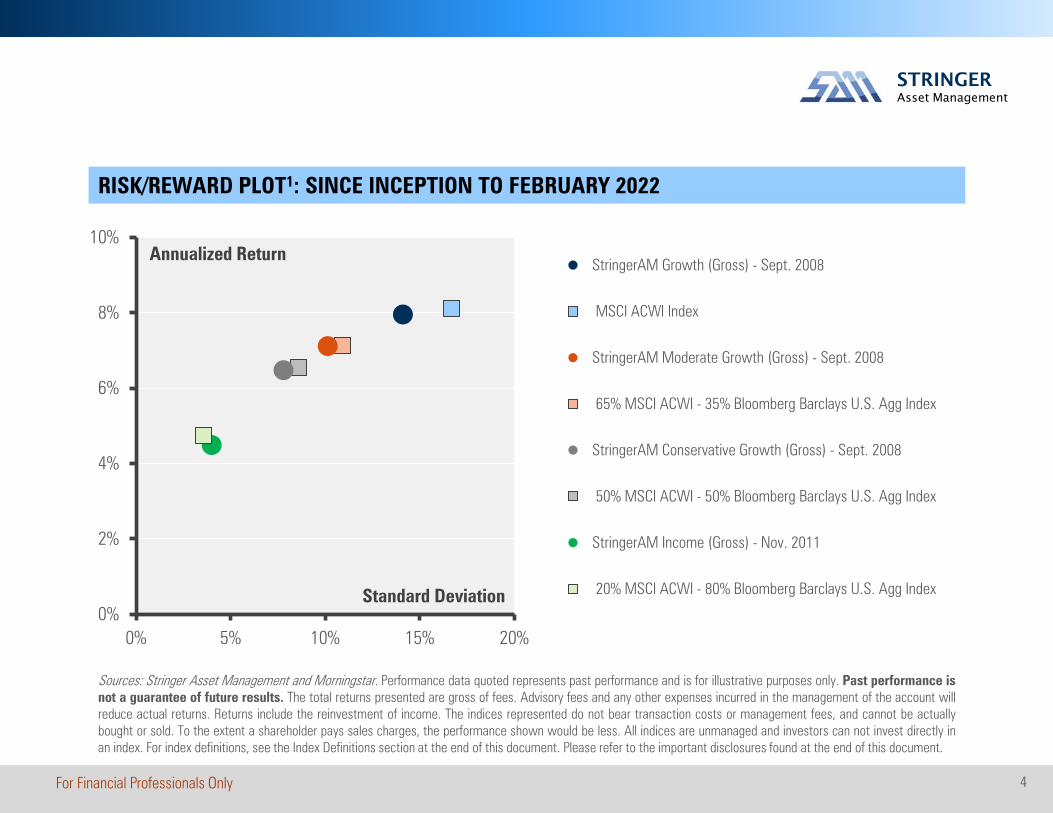
RISK/REWARD PLOT1: SINCE INCEPTION TO FEBRUARY 2022
Sources: Stringer Asset Management and Morningstar. Performance data quoted represents past performance and is for illustrative purposes only. Past performance isnot a guarantee of future results. The total returns presented are gross of fees. Advisory fees and any other expenses incurred in the management of the account willreduce actual returns. Returns include the reinvestment of income. The indices represented do not bear transaction costs or management fees, and cannot be actuallybought or sold. To the extent a shareholder pays sales charges, the performance shown would be less. All indices are unmanaged and investors can not invest directly inan index. For index definitions, see the Index Definitions section at the end of this document. Please refer to the important disclosures found at the end of this document.

STRINGERAsset Management
5For Financial Professionals Only
√ Preliminary Performance
» Broad Outlook
» Favored Choices
» The Cash Indicator
Agenda

STRINGERAsset Management
6For Financial Professionals Only
0
3 4
17
22
32
27
12
5
2 1 1 01 2
5
15
24 24 25
15
8
3
0
31
0
5
10
15
20
25
30
35
-2% to0%
0% to2%
2% to4%
4% to6%
6% to8%
8% to10%
10% to12%
12% to14%
14% to16%
16% to18%
18% to20%
20% to22%
22% to24%
Stringer AM: Growth Composite (gross) MSCI ACWI Index
Taking Investment Strategies to the Next Level Witha Focus on Behavioral Finance
Number ofOccurrences
Source: Morningstar. This material is for informational purpose only. Opinions and forecasts expressed herein may not actually occur. Past performance is not indicative offuture results. The indices represented do not bear transaction costs or management fees, and cannot be actually bought or sold. To the extent a shareholder pays salescharges, the performance shown would be less. All indices are unmanaged and investors can not invest directly in an index. For definitions, see the Index Definitions andStatistical Definitions sections at the end of this document.
36-Month Rolling Return Histogram
Lower volatility eases the ride, delivers consistency, reduces uncertainty, and
increases confidence.

STRINGERAsset Management
7For Financial Professionals Only
» While we are closely following the Ukrainian crisis dominating the headlines, we believe the economiceffects, at least in the U.S., will ultimately pale in comparison to the humanitarian impact we areseeing.
» Though geopolitical risks and global unrest can roil markets, a historical perspective and a robustinvestment process can help guide investors through volatility and inform our decisions.
» The U.S. economy is one of the most diverse and independent economies in the world.
» Today, the lack of reliance on foreign trade extends to the U.S. energy complex as well.
» Additionally, the decline in household spending on energy over the decades means there is littleeconomic risk from the recent price spike.
» Recessions typically begin with a U.S. Federal Reserve (Fed) policy error.
» Therefore, Fed policy is far more important than oil to our economic outlook.
» As reflected in the strong jobs growth, the low number of layoffs, and the high number of open jobs,the U.S. economy still has plenty of momentum to weather headwinds coming from COVID, oil prices,geopolitical risks, and shifts in Fed policy.
» The CI has moved higher that historical average levels, which reflects stresses in both equity andcredit markets, but remains below the levels that would indicate that markets are breaking down.
» The recent equity market declines provide attractive investment opportunities in our view.
BROAD OUTLOOK

STRINGERAsset Management
8For Financial Professionals Only
0%
25%
50%
75%
100%
'15 '16 '17 '18 '19 '20
Canada China France Germany Italy Japan UK U.S.
Trade As A % Of GDP
» The U.S. economy is one of the most independent economies in the world.
» Among the Organization for Economic Cooperation and Development (OECD) members,no country relies less on the foreign trade of goods and services than the U.S. relativeto the size of their respective economies.
» The lack of foreign trade relative to the size of the overall economy helps shelter theU.S. from stresses overseas.
Source: The World Bank
STRINGERAsset Management
9For Financial Professionals Only
0%
2%
4%
6%
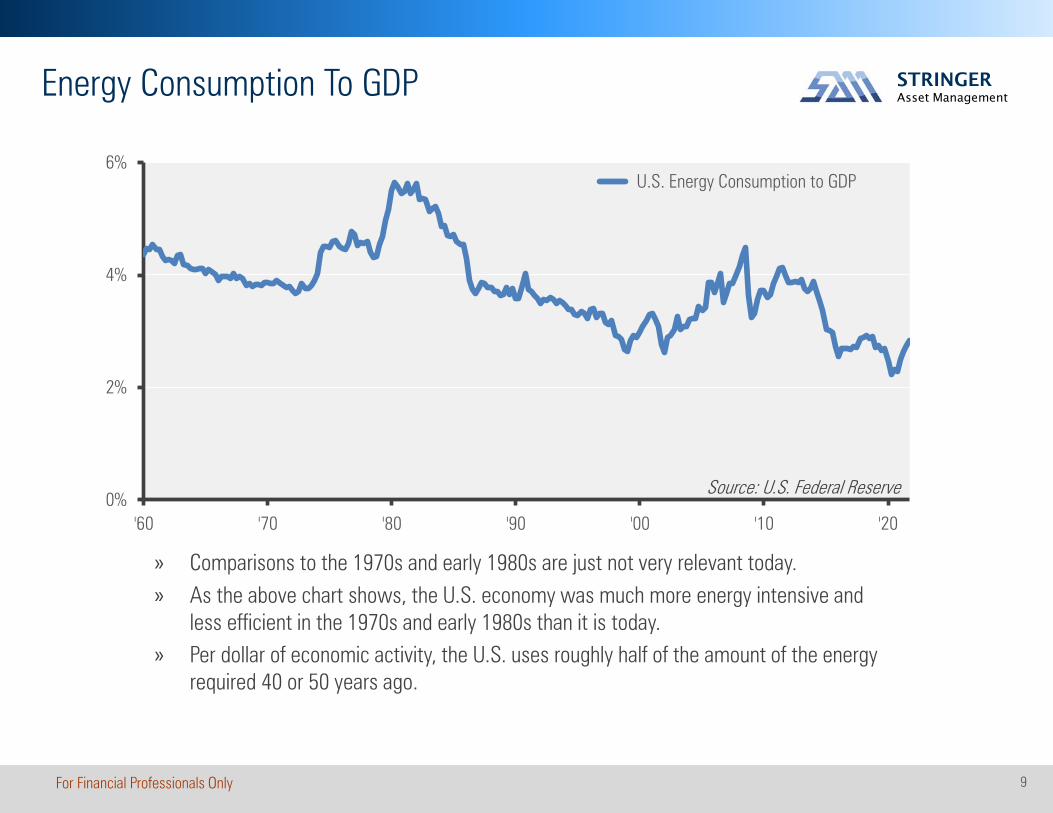
'60 '70 '80 '90 '00 '10 '20
U.S. Energy Consumption to GDP
Source: U.S. Federal Reserve
» Comparisons to the 1970s and early 1980s are just not very relevant today. » As the above chart shows, the U.S. economy was much more energy intensive and
less efficient in the 1970s and early 1980s than it is today. » Per dollar of economic activity, the U.S. uses roughly half of the amount of the energy
required 40 or 50 years ago.
Energy Consumption To GDP

STRINGERAsset Management
10For Financial Professionals Only
0%
4%
8%
12%
'60 '70 '80 '90 '00 '10 '20
U.S. Energy Consumption As % of Total
Source: U.S. Federal Reserve
» The same can be said of household spending on energy. » While no one likes to pay more at the pump, spending on energy relative to total
personal consumption has fallen from nearly 10% in June 1981 to just over 4% in January 2022.
Energy Consumption As A % Of Total Consumption

STRINGERAsset Management
11For Financial Professionals Only
-10
0
10
20
30
'50 '60 '70 '80 '90 '00 '10 '20
Crude Oil Coal Charcoal Coal Natural Gas Petro xBiofuels
Source: U.S. Energy Information Administration
» In fact, according to the U.S. Energy Information Administration, the U.S. was a net exporter of petroleum products and natural gas, as well as coal and coal charcoal in 2020.
» The U.S. imported only a negligible amount of crude oil on net.
U.S. Energy Net Imports in Quadrillion BTUs

STRINGERAsset Management
12For Financial Professionals Only
$8
$13
$18
$23
'12 '13 '14 '15 '16 '17 '18 '19 '20 '21 '22
M2 Money Stock Pre-COVID Trend
Source: U.S. Federal Reserve and Stringer Asset Management
» The Fed is likely well behind the curve on interest rate increases and QT.
» We estimate that there is approximately $4.5 trillion of excess liquidity (money) sloshing around the U.S. economy looking for productive uses.
» That amounts to nearly 20% of the size of the U.S. economy.
» We think that so much excess liquidity is inflationary, but also creates a sizable cushion to soften blows to the economy.
M2 Money Stock & Trend
Our estimate of $4.5 trillion in excess liquidity

STRINGERAsset Management
13For Financial Professionals Only
√ Preliminary Performance
√ Broad Outlook
» Favored Choices
» The Cash Indicator
Agenda

STRINGERAsset Management
14For Financial Professionals Only
EQUITYU.S. » financials, health care, information technology, small cap value
Global » low volatility, natural resources, quality
FIXED INCOME short and intermediate-duration asset-backed and mortgage-backed securities
ALTERNATIVES multi-sector income, put option overlay strategies, senior loans
This material is for informational purpose only. Investments discussed may not be suitable for all investors. No part of theauthors’ compensation was, is, or will be directly or indirectly related to the specific views contained in this report. Informationprovided is obtained from sources deemed to be reliable; but is not represented as complete, and its accuracy is notguaranteed. The information and opinions given are subject to change at any time, based on market and other conditions, andare not recommendations of or solicitations to buy or sell any security. Opinions and forecasts expressed herein may not actuallyoccur. Past performance is not indicative of future results. The securities identified and described may notrepresent all of the securities purchased, sold or recommended for client accounts. The reader should not assumethat an investment in the securities identified was or will be profitable.
INVESTMENT OUTLOOK SUMMARY | FAVORED CHOICES

STRINGERAsset Management
15For Financial Professionals Only
√ Preliminary Performance
√ Broad Outlook
√ Favored Choices
» The Cash Indicator
Agenda

STRINGERAsset Management
16For Financial Professionals Only
10
60
110
160
'87 '92 '97 '02 '07 '12 '17 '22
Cash Indicator 25% Cash Raise 50% Cash Raise
Source: Bloomberg and Stringer Asset Management
The Cash Indicator
» The Cash Indicator (CI) process has been useful for helping us judge volatility especiallyin times of crisis.
» After months of suggesting market complacency, the CI has moved higher thathistorical average levels, which reflects stresses in both equity and credit markets.
» However, the CI remains below the levels that would indicate that markets are breakingdown.
» Therefore, we remain fully invested and view market declines as an opportunity.
3/12/22:50.55
Current:50.55
Cash Indicator
Long-Term Median
40
25% Cash Raise
54
50% Cash Raise100

STRINGERAsset Management
17For Financial Professionals Only
Let Us Be Your ‘Easy Button’
For more information:
Jonathan Bernstein (713) 339-0598 | [email protected]

STRINGERAsset Management
18For Financial Professionals Only

STRINGERAsset Management
19For Financial Professionals Only
Performance:Stringer Asset Management LLC is a registered investment adviser that generally provides services through model portfolios on a sub-advisory business. The firm primarily allocatesclient’s investment management assets among exchange-traded funds (“ETFs”) and secondarily among mutual funds. A fully compliant GIPS presentation along with a complete list anddescription of all composites is available at www.stringeram.com or by calling 901-800-2956. Stringer Asset Management LLC claims compliance with the Global Investment PerformanceStandards (GIPS®).
Past performance is not indicative of future results. The investment return and principal value of an investment will fluctuate so that an investor’s shares when redeemed may beworth more or less than their original cost. Current performance may be higher or lower than the performance data quoted. Advisory fees and any other expenses incurred in themanagement of the account will reduce actual returns. The performance of any individual portfolio may not be considered comparable to the Composite performance.
The Growth Composite includes all portfolios that mainly invest in equity and alternative ETFs selected from the global investment opportunity set. The Growth Composite has riskcharacteristics similar to that of the broad equity market and include but are not limited to equity risk, international investing risk and capitalization risk. The total returns presented aregross and net of fees. Advisory fees and any other expenses incurred in the management of the account will reduce actual returns. The benchmark is the MSCI ACWI Index rebalancedquarterly as of January 1, 2016. The benchmark is market-cap weighted and is composed of several country-specific indices. Sources of foreign exchange rates may be different betweenthe composite and the benchmark; however, there have not been material differences to date. Prior to January 1, 2016, the benchmark was the MSCI World Index rebalanced quarterly.Prior to January 1, 2015, the blended benchmark was 70% Russell 3000 Index and 30% MSCI ACWI xUS Index rebalanced quarterly. In both cases, the benchmark was retroactivelychanged to more closely follow our investment strategy. The index represented does not bear transaction costs or management fees, and cannot be actually bought or sold. It is notpossible to invest directly in an index. For index definitions, see the Index Definitions section at the end of this document. The U.S. Dollar is the currency used to express performance.Material use of leverage, derivatives and short positions are not used in this composite.
The Moderate Growth Composite includes all portfolios that mainly invest the majority of their assets in equity exchange-traded funds but also includes fixed income and alternative ETFsselected from the global investment opportunity set. The Moderate Growth Composite has risk characteristics lower than that of the broad equity market and include but are not limited toequity risk, international investing risk and credit risk. The total returns presented are gross and net of fees. Advisory fees and any other expenses incurred in the management of theaccount will reduce actual returns. The benchmark is a blend of 65% MSCI ACWI Index and 35% Barclays U.S. Aggregate Bond Index rebalanced quarterly as of January 1, 2016. Thebenchmark is market-cap weighted and is composed of several country-specific indices. Sources of foreign exchange rates may be different between the composite and the benchmark;however, there have not been material differences to date. Prior to January 1, 2016, the blended benchmark was 65% MSCI World Index and 35% Barclays U.S. Aggregate Bond Indexrebalanced quarterly. Prior to January 1, 2015, the blended benchmark was 45% Russell 3000 Index, 20% MSCI ACWI xUS Index and 35% Barclays U.S. Aggregate Bond Index rebalancedquarterly. In both cases, the benchmark was retroactively changed to more closely follow our investment strategy. The index represented does not bear transaction costs or managementfees, and cannot be actually bought or sold. It is not possible to invest directly in an index. For index definitions, see the Index Definitions section at the end of this document. The U.S.Dollar is the currency used to express performance. Material use of leverage, derivatives and short positions are not used in this composite.
Disclosures

STRINGERAsset Management
20For Financial Professionals Only
Disclosures
Performance (continued):The Conservative Growth Composite includes all portfolios that invest their assets in equity, fixed income and alternative exchange-traded funds selected from the global investmentopportunity set. The Conservative Growth Composite has risk characteristics lower than that of the broad equity market and include but are not limited to equity risk, international investingrisk and credit risk. The total returns presented are gross and net of fees. Advisory fees and any other expenses incurred in the management of the account will reduce actual returns. Thebenchmark is a blend of 50% MSCI ACWI Index and 50% Bloomberg Barclays U.S. Aggregate Bond Index rebalanced quarterly as of January 1, 2016. The benchmark is market-capweighted and is composed of several country-specific indices. Sources of foreign exchange rates may be different between the composite and the benchmark; however, there have notbeen material differences to date. Prior to January 1, 2016, the blended benchmark was 50% MSCI World Index and 50% Barclays U.S. Aggregate Bond Index rebalanced quarterly. Priorto January 1, 2015, the blended benchmark was 35% Russell 3000 Index, 15% MSCI ACWI xUS Index and 50% Barclays U.S. Aggregate Bond Index rebalanced quarterly. In both cases,the benchmark was retroactively changed to more closely follow our investment strategy. The index represented does not bear transaction costs or management fees, and cannot beactually bought or sold. It is not possible to invest directly in an index. For index definitions, see the Index Definitions section at the end of this document. The U.S. Dollar is the currencyused to express performance. Material use of leverage, derivatives and short positions are not used in this composite.
The Income with Growth Composite includes all portfolios that invest their assets in equity, fixed income and alternative exchange-traded funds selected from the global investmentopportunity set. The Income with Growth Composite has risk characteristics lower than that of the broad equity market and include but are not limited to equity risk, international investingrisk and credit risk. The total returns presented are gross of fees. Advisory fees and any other expenses incurred in the management of the account will reduce actual returns. Thebenchmark is a blend of 35% MSCI ACWI Index and 65% Bloomberg Barclays U.S. Aggregate Bond Index rebalanced quarterly. The benchmark is market-cap weighted and is composed ofseveral country-specific developed market indices. Sources of foreign exchange rates may be different between the composite and the benchmark; however, there have not been materialdifferences to date. The index represented does not bear transaction costs or management fees, and cannot be actually bought or sold. It is not possible to invest directly in an index. Forindex definitions, see the Index Definitions section at the end of this document. The U.S. Dollar is the currency used to express performance. Material use of leverage, derivatives and shortpositions are not used in this composite. As of 12/30/16, the Conservative Composite was renamed the Income with Growth Composite.
The Income Composite includes all portfolios that invest their assets in equity, fixed income and alternative exchange-traded funds selected from the global investment opportunity set.The Income Composite has risk characteristics lower than that of the broad equity market and include but are not limited to equity risk, international investing risk and credit risk. The totalreturns presented are gross and net of fees. Advisory fees and any other expenses incurred in the management of the account will reduce actual returns. The benchmark is a blend of 20%MSCI ACWI Index and 80% Bloomberg Barclays U.S. Aggregate Bond Index rebalanced quarterly as of January 1, 2016. The benchmark is market-cap weighted and is composed ofseveral country-specific indices. Sources of foreign exchange rates may be different between the composite and the benchmark; however, there have not been material differences todate. Prior to January 1, 2016, the benchmark was a blend of 20% MSCI World Index and 80% Barclays U.S. Aggregate Bond Index rebalanced quarterly. The benchmark was retroactivelychanged to more closely follow our investment strategy. The index represented does not bear transaction costs or management fees, and cannot be actually bought or sold. It is notpossible to invest directly in an index. For index definitions, see the Index Definitions section at the end of this document. The U.S. Dollar is the currency used to express performance.Material use of leverage, derivatives and short positions are not used in this composite.

STRINGERAsset Management
21For Financial Professionals Only
Index Definitions:Bloomberg Barclays U.S. Aggregate Bond Index – This Index provides a measure of the U.S. investment grade bond market, which includes investment grade U.S.Government bonds, investment grade corporate bonds, mortgage pass-through securities and asset-backed securities that are publicly offered for sale in the UnitedStates. The securities in the Index must have at least 1 year remaining to maturity. In addition, the securities must be denominated in US dollars and must be fixedrate, nonconvertible and taxable.
MSCI ACWI (Net) Index – This Index is a free float-adjusted market capitalization weighted index that is designed to measure the equity market performance ofdeveloped and emerging markets. The MSCI ACWI Index consists of 23 developed and 23 emerging market country indexes. Net total return includes thereinvestment of dividends after the deduction of withholding taxes, using a tax rate applicable to non-resident institutional investors who do not benefit from doubletaxation treaties.
S&P 500 Index – This Index is a capitalization-weighted index of 500 stocks. The Index is designed to measure performance of a broad domestic economy throughchanges in the aggregate market value of 500 stocks representing all major industries.
Disclosures

STRINGERAsset Management
22For Financial Professionals Only
Statistical Definitions:Standard deviation – A statistical measure of volatility, standard deviation is often used as an indicator of the ‘risk’ associated with a return series. Standarddeviation of return measures the average deviations of a return series from its mean. A large standard deviation implies that there have been large swings in thereturn series of the manager.
Alpha – Alpha is a measure of risk (beta)-adjusted return. Alpha measures the difference between a portfolio’s actual returns and what it might be expected todeliver based on its level of risk. In an ideal sense, higher risk should equate to higher return. A positive alpha means the fund has beaten expectations. A negativealpha means that the fund has failed to match performance given its level of risk. If two managers have the same return, but one has a lower beta, that managerwould have a higher alpha.
Beta – This represents the systematic risk of a portfolio and measures its sensitivity to a benchmark. A portfolio with a beta of one is considered to be as risky asthe benchmark and would therefore provide expected returns equal to those of the market benchmark during both up and down periods. A portfolio with a beta oftwo would move approximately twice as much as the benchmark.
Yield – Portfolio and benchmark yields are calculated using a harmonic weighted average of the net dividends per share during the past 12 months for each holdingas of the date identified at their respective target weighting.
Disclosures
STRINGERAsset Management
23For Financial Professionals Only
Principal Risks:Allocation risk – The performance of the portfolio relative to its benchmark will depend largely on the decisions to strategic asset allocation and tactical adjustments made to the asset allocation. Attimes, judgments as to the asset classes in which the portfolio should invest may prove to be wrong, as some asset classes may perform worse than others or the equity markets generally fromtime to time or for extended periods of time. Market risk – The value of securities in the portfolio may decline due to daily fluctuations in the securities markets, including fluctuation in interest rates,national and international economic conditions and general equity market conditions. Management style risk – To the extent the portfolio focuses on a particular style of stocks, such as growth orvalue, its performance may at times be better or worse than that of similar portfolios with other focuses or that have a broader investment style. Business and sector risk – From time to time, aparticular set of circumstances may affect a particular industry or certain companies within an industry, while having little or no impact on other industries or other companies within the industry.Large company risk – The portfolio may invest in larger, more established companies, which may be unable to respond quickly to new competitive challenges such as changes in consumer tastes orinnovative smaller competitors. Also, large companies are sometimes unable to attain the high growth rates of successful, smaller companies, especially during extended periods of economicexpansions. Mid-sized company risk – The portfolio may invest in mid-cap companies, which may be more vulnerable to adverse business or economic events than larger, more establishedcompanies. In particular, these mid-sized companies may pose additional risks, including liquidity risk, because these companies tend to have limited product lines, markets and financial resources,and may depend upon a relatively small management group. Small company risk – The portfolio may invest in smaller companies, which generally have less experienced management teams, servesmaller markets, and find it more difficult to obtain financing for growth or potential development than larger companies. Real Estate Investment Trust (“REIT”) risk – The portfolio may invest in ETFsor other pooled investment vehicles that invest in REITs. REITs are susceptible to the risks associated with investing in real estate generally, including, among others, declines in the value of realestate, lack of ability to access the credit markets and defaults by borrowers or tenants. Commodities risk – The portfolio may invest in ETFs or other pooled investment vehicles that invest incommodities, such as raw materials or agricultural products. Commodities are tied to future market values and future income and are vulnerable to adverse movements in prices and exchangerates. Additionally, the price of commodities may be affected by geopolitical changes and relations. Credit risk – An issuer of debt securities may not make timely payments of principal and interest.Debt securities risk – Increases in interest rates typically lower the value of debt securities held by the portfolio. Investments in debt securities include credit risk. There is also the risk that a bondissuer may “call,” or repay its high yielding bonds before their maturity dates. Debt securities subject to prepayment can offer less potential for gains during a declining interest rate environment andsimilar or greater potential for loss in a rising interest rate environment. Limited training opportunities for certain debt securities may make it more difficult to sell or buy a security at a favorable priceor time. High yield securities risk – Investments in high yield fixed income securities, also known as “junk bonds”, involve a greater risk of default and are subject to a substantially higher degree ofcredit risk or price fluctuations than other types of debt securities. Interest rate risk – Increases in interest rates typically lower the present value of a company’s future earnings stream.Accordingly, stock prices will generally decline when investors anticipate or experience rising interest rates. Issuer risk – The value of an individual security or particular type of security can be morevolatile and thus perform differently than the market as a whole. Shares of other investment companies and ETFs risk – Investors will indirectly bear fees and expenses charged by the underlyingfunds in which the portfolio may invest in addition to the portfolio’s direct fees and expenses and, as a result, the cost of investing in the portfolio will generally be higher than the cost of investingdirectly in the underlying fund shares. Investments in ETFs bear the risk that the market price of the ETF’s shares may trade at a discount to their net asset value or that an active trading market foran ETF’s shares may not develop or be maintained. Non-diversified fund risk – A non-diversified fund is generally subject to the risk that a large loss in an individual issue will cause a greater loss forthe fund than it would if the fund was required to hold a larger number of securities or smaller positions. Foreign exposure risk – Foreign markets, particularly emerging markets, can be more volatilethan the U.S. market due to increased risks of adverse issuer, political, regulatory, or economic developments. Foreign currency risk – The value of an investment denominated in a foreign currencywill decline in dollar terms if that currency weakens against the dollar. Additionally, certain countries may utilize formal or informal currency-exchange controls or “capital controls.” Such controlsmay also affect the value of the portfolio’s holdings. U.S. Government and U.S. agency obligations risk – There can be no assurance that the U.S. Government would provide financial support to itsagencies or instrumentalities (including government-sponsored enterprises) that issue or guarantee certain securities where it is not obligated to do so.
Disclosures

STRINGERAsset Management
24For Financial Professionals Only
5050 Poplar Avenue, Suite 1103Memphis, TN 38157Phone: (901) 800-2956Fax: (901) 800-2976Email: [email protected]