federal aid job progress reports catnip reservoir …€¦ · figure 2 depicts the lct length...
TRANSCRIPT

NEVADA DEPARTMENT OF WILDLIFE STATEWIDE FISHERIES MANAGEMENT
FEDERAL AID JOB PROGRESS REPORTS
F-20-54 2018
CATNIP RESERVOIR WESTERN REGION

NEVADA DEPARTMENT OF WILDLIFE, FISHERIES DIVISION ANNUAL PROGRESS REPORT
Table of Contents
Contents Page
SUMMARY ...................................................................................................................... 1
BACKGROUND .............................................................................................................. 1
OBJECTIVES .................................................................................................................. 2
PROCEDURES ............................................................................................................... 2 FINDINGS ....................................................................................................................... 3
MANAGEMENT REVIEW ............................................................................................... 8
RECOMMENDATIONS ................................................................................................... 9
REFFERENCES ............................................................................................................. 9

1
NEVADA DEPARTMENT OF WILDLIFE, FISHERIES DIVISION ANNUAL PROGRESS REPORT
State: Nevada Project Title: Statewide Fisheries Program Job Title: Catnip Reservoir Period Covered: January 1, 2018 through December 31, 2018
SUMMARY
Catnip Reservoir provided angling opportunity during the open fishing season from June 9 to November 15, 2018. The voluntary Angler Drop-Box Survey documented that 29 anglers caught 91 Lahontan cutthroat trout. The Mail-in Angler Questionnaire Survey information for 2017 was received and estimated 113 anglers fished for 186 days and caught 319 fish for a success rate of 1.72 fish per day. Catnip Reservoir was completely full in the spring of 2018, with the water level dropping slightly throughout the summer and fall. An electroshocking survey was conducted on May 30, 2018 to monitor the population of Lahontan cutthroat trout (LCT) in the reservoir.
Catnip Reservoir is managed under the Coldwater Quality Fishery Concept. This management strategy applies to waterbodies that produce fish with significant growth characteristics and contain fish of a size anglers prefer to catch. Anglers should be able to catch trout larger than the 8.0 to 10.0 inches stocked size, but smaller than a “Trophy” fish. Management of this resource is directed towards wild fish or stocked fish that grow a significant portion of their size in the wild environment. Fish should not be stocked at a large size to create this fishery. Special management regulations may be appropriate to reduce harvest and allow fish to grow larger. Catnip Reservoir is open to fishing on the second Saturday in June through November 15. The limit is 1-trout and only artificial lures with single barbless hooks may be used.
BACKGROUND Catnip Reservoir is located in northern Washoe County on the Sheldon National
Wildlife Refuge, approximately 46 miles west of Denio Junction. It is situated at an elevation of 5,791 feet and the surrounding land is characterized by sagebrush-steppe interspersed with rim rock and mountain mahogany. The reservoir covers 22 surface acres and originally stored 220 acre-feet of water. The capacity of Catnip Reservoir has declined over time due to sediment input from Catnip Creek. Catnip Reservoir was constructed in 1910 primarily to store irrigation water for the IXL Ranch.
Lahontan cutthroat trout from Heenan Lake, CA (Independence Lake strain) were
initially stocked in Catnip Reservoir in 1947. LCT is currently the only fish species present in the reservoir. Initially, the fishery was utilized as a broodstock and, for a while, the spawning operation was productive. The first egg take took place in 1959 and continued annually until 2002. Pyramid Lake strain, Walker Lake strain, and Independence Lake strain cutthroat trout were emphasized in the later years of operation.

2
Over the years, there has been a diminished need for cutthroat trout, so the broodstock was used to produce hybrid trout. Cutthroat trout from Catnip Reservoir were crossed with rainbow trout from Big Springs Reservoir to produce cuttbow trout. Eggs taken were transferred to a state hatchery where they were reared to a catchable-size and stocked in recreational fisheries around northern Nevada. Since 2001, springs feeding Big Springs Reservoir began flowing intermittently and now the reservoir rarely holds enough water for fish. Spawning operations have not occurred since 2002.
A number of LCT strains (including Walker, Pyramid, Independence, and Marlette)
have been stocked in Catnip Reservoir due to changing egg sources and stocking programs. There has been no discern for genetic continuity during artificial spawning operations and subsequent stocking, therefore, it is likely a mixed strain of LCT exists since spawning occurs naturally in Catnip Creek. In 2009, 3,040 Pilot Peak strain LCT (cultured by FWS) were stocked in Catnip Reservoir for sport fisheries management and recovery purposes. The amount of wild trout production from Catnip Creek is unknown.
OBJECTIVES
• Conduct a general assessment of angler use, success, and harvest through
opportunistic angler contacts, angler drop-box surveys, and mail-in angler questionnaire data.
• Maintain the angler information center and angler drop-box. • Coordinate fisheries management activities with the USFWS Sheldon NWR during the
annual coordination meeting. • Monitor the population and body condition (relative weight) of LCT by conducting 4
net-nights of gill netting.
PROCEDURES
Conduct a general assessment of angler use, success, and harvest through opportunistic angler contacts, return of angler drop-box surveys, and mail-in angler questionnaire data. Angler use, success, and harvest were assessed using data from volunteer angler drop-boxes, on-site angler contacts, and mail-in angler questionnaire. A drop-box located near the Angler Information Center (AIC) collected basic creel information and assessed angler satisfaction. Angler questionnaire data was derived from a 2017 survey mailed to 30,000 anglers purchasing a Nevada fishing license.
Maintain the angler information center and angler drop-box when on site.
During each visit, the angler drop-box was assessed for maintenance needs. The AIC was updated in May with current data about fishing at the lake.
Coordinate fisheries management activities with U.S. Fish and Wildlife
Service. A meeting was attended in February and several phone calls and emails were exchanged with USFWS staff to coordinate fisheries management activities for Catnip Reservoir and Catnip Creek.

3
Monitor the population and body condition (relative weight) of LCT by conducting 4 net-nights of gill netting. An electroshocking survey was conducted instead of gill netting to monitor the population and body condition of LCT in Catnip Reservoir on May 30, 2018. Population assessments help examine whether fisheries are attaining management objectives, while a fish body condition index can be used to examine individual fish or cohorts of fish.
FINDINGS
Conduct a general assessment of angler use, success, and harvest through
opportunistic angler contacts, return of angler drop-box surveys and mail-in angler questionnaire data. Catnip Reservoir was stocked with 1,004 Pyramid Lake strain LCT on May 14, 2018. The water temperature was 64°F, road access was good, and the reservoir was at 100% capacity during this stocking event. A five-year stocking history is provided in Table 1.
Table 1. Catnip Reservoir 5-Year Stocking History, 2014-2018.
Year Species Strain Number Stocked
Pounds Stocked
Average Size (inches)
Annual Total Stocked Number Pounds
2018 LCT Pyramid 1,004 140 7.0 1,004 140
2017 LCT Pyramid 2,001 192 6.2 2,001 192
2016 LCT Pyramid 1,493 295 7.9 1,493 295
2015 LCT Pyramid 2,509 325 7.4 2,509 325
2014* ----- ----- ------ ------ ------ ----- ----- *-----No fish were stocked
Opportunistic angler surveys were conducted during each site visit to Catnip
Reservoir. Catnip Reservoir is a remote reservoir and the number of angler contacts is generally low. Only two anglers were contacted on opening weekend in 2018 and information is summarized in Table 2.
Table 2. Catnip Reservoir Opportunistic Angler Creel Surveys
Month Survey Days Anglers Angler Hours LCT LCT/Angler LCT/Hour June 2 2 4 5 2.5 1.25 July 1 0 September 1 0 October 1 0 November 1 0 Summary 6 2 4 5 2.5 1.25
The angler drop-box survey documented 29 anglers caught 91 LCT in 2018, which was an increase from 2017 when 10 anglers only caught 13 LCT. Figure 1 summarizes the five-year angler satisfaction ratings for the Catnip Reservoir angler drop-box survey. The survey asked participants to rate their fishing day on a scale of -2.0 (highly dissatisfied) to +2.0 (highly satisfied) for three categories: “overall experience,” “size of fish,” and “number of fish.”

4
Figure 1. Five-year angler satisfaction ratings (2014 to 2018) for Catnip Reservoir. The 2018 average angler satisfaction-rating scores were +0.99 for “overall experience,” 1.08 for “size of trout,” and 0.76 for “number of trout caught.” The five-year average for these three categories is 1.22 for “overall experience,” 1.17 for “size of trout,” and 0.79 for “number of trout caught.” The 2018 monthly breakdown of angler satisfaction is summarized in Table 3.
Table 3. The 2018 Catnip Reservoir Monthly Angler Use and Success Data: Drop-Box Data.
Month # of Anglers
# of Angler Hours
Angler Satisfaction LCT Caught
LCT Harvested
LCT/ Angler
LCT/ Hour Angling
Experience Size No.
June 6 47 0.33 1.33 0.5 21 0 3.5 0.45 August 1 3 1 2 1 4 0 4 1.33
September 7 12.5 1.57 1.22 1.57 35 5 5 2.8 October 14 29.25 1.07 0.86 0.71 31 2 2.21 1.06
November 1 3 1 0 0 0 0 0 0 Summary 29 94.75 0.99 1.08 0.76 91 7 2.45 0.94
Figure 2 depicts the LCT length frequency from 2018 and the five-year average of
LCT length frequency. The majority of LCT caught in 2018 measured between 12 and 20 inches. The most common size class in 2018, with 23 LCT being reported, was 18 to 19.9 inches in length. The mail in, angler questionnaire for 2017 estimated 113 anglers fished for 186 days and caught 319 fish for a success rate of 1.65 fish per day. In 2017, angler success was well below the five-year average of 7.60 fish per day. Table 4 and Figures 3 and 4 summarize the angler questionnaire data from 2013 to 2017.
-2
-1.5
-1
-0.5
0
0.5
1
1.5
2
2014 2015 2016 2017 2018 5 yearaverage
RATI
NG
YEAR
Angler Satisfaction Ratings Catnip Reservoir
OverallExperience
Size of Fish
Number of Fish

5
Figure 2. Catnip Reservoir LCT Length Frequency: Drop-Box Data, 2018. Table 4. Catnip Reservoir Five-Year Mail-in Angler Questionnaire Data, 2013 to 2017.
Year Anglers Days LCT Caught LCT/Day LCT/Angler Days/Angler 2013 45 150 874 5.83 19.3 3.01 2014 11 28 368 13.3 32.06 1.93 2015 161 538 2,777 5.16 17.22 1.9 2016 50 123 865 7.02 17.14 2.3 2017 113 186 319 1.65 2.83 1.72
5 Year Average 63.2 187.8 1,110 7.60 19.87 2.26
Figure 3. The 5-year average catch rate from the Mail-in Angler Questionnaire Survey.
0
10
20
30
40
50
60
70
<10” 10-11.9” 12-13.9” 14-15.9” 16-17.9” 18-19.9” 20-21.9” >22”
Num
ber o
f LCT
LCT Length Frequency
2018
5-year Average
5.83
13.3
5.16
7.02
1.656.592
0
2
4
6
8
10
12
14
2013 2014 2015 2016 2017
FISH
PER
DAY
YEAR
CATNIP RESERVOIR 2013-2017
Fish/Day
5 Year Average
6
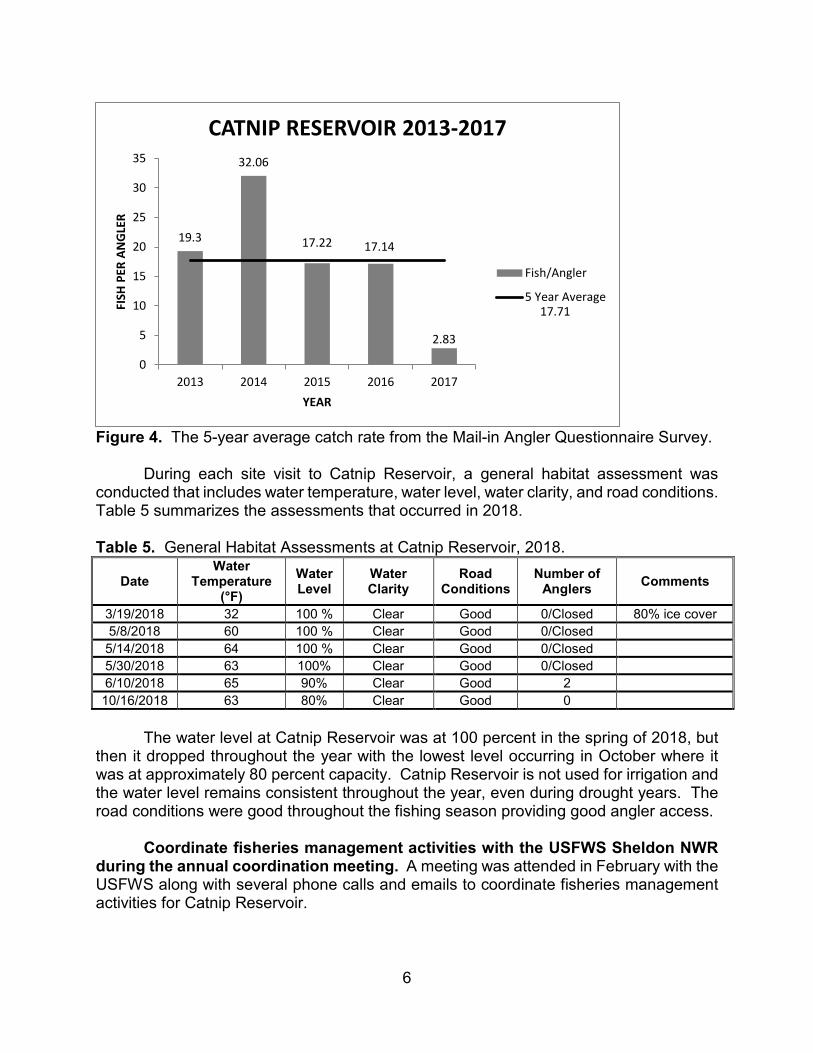
Figure 4. The 5-year average catch rate from the Mail-in Angler Questionnaire Survey.
During each site visit to Catnip Reservoir, a general habitat assessment was
conducted that includes water temperature, water level, water clarity, and road conditions. Table 5 summarizes the assessments that occurred in 2018.
Table 5. General Habitat Assessments at Catnip Reservoir, 2018.
Date Water
Temperature (°F)
Water Level
Water Clarity
Road Conditions
Number of Anglers Comments
3/19/2018 32 100 % Clear Good 0/Closed 80% ice cover 5/8/2018 60 100 % Clear Good 0/Closed 5/14/2018 64 100 % Clear Good 0/Closed 5/30/2018 63 100% Clear Good 0/Closed 6/10/2018 65 90% Clear Good 2 10/16/2018 63 80% Clear Good 0
The water level at Catnip Reservoir was at 100 percent in the spring of 2018, but
then it dropped throughout the year with the lowest level occurring in October where it was at approximately 80 percent capacity. Catnip Reservoir is not used for irrigation and the water level remains consistent throughout the year, even during drought years. The road conditions were good throughout the fishing season providing good angler access.
Coordinate fisheries management activities with the USFWS Sheldon NWR
during the annual coordination meeting. A meeting was attended in February with the USFWS along with several phone calls and emails to coordinate fisheries management activities for Catnip Reservoir.
19.3
32.06
17.22 17.14
2.83
17.71
0
5
10
15
20
25
30
35
2013 2014 2015 2016 2017
FISH
PER
AN
GLE
R
YEAR
CATNIP RESERVOIR 2013-2017
Fish/Angler
5 Year Average

7
Monitor the population and body condition (relative weight) of LCT by conducting 4 net-nights of gill netting. An electroshocking survey was used instead of gill netting to monitor the LCT population on May 30, 2018. A total of 22 LCT were captured (5,041 seconds total elapsed shocking time), which resulted in a 15.7 fish/hour catch rate. The LCT averaged 329.5 mm in length. This was the first time Catnip Reservoir was electroshocked, so there is no data to compare with this survey. The perimeter of the lower two thirds of the reservoir was electroshocked (Figure 5).
Figure 5. Green line indicates the path electroshocked at Catnip Reservoir May 30, 2018. Eleven LCT over 300 mm in length (11.8 in) were weighed in order to obtain a
body condition measure. Relative weight is an index that is calculated as follows:
Wr = (W/Ws)*100
Where W is the individual weight of a fish, Ws is the length-specific standard weight predicted from a weight-length regression developed to represent a species across a geographic range. The standard weight equation (Ws) used in this analysis for cutthroat trout was developed by Kruse and Hubert (1997). The relative weight index uses 100 as a benchmark for the standard body condition of fish. Measures that are over 100 are considered good condition and measures less than 100 are considered to be in poorer condition with severity depending on the distance from the benchmark of 100 (Guy and Brown, 2007).

8
The relative weight index for the eleven fish that were weighed ranged from 73.4 to 132.8, with the average being 96.15 (Table 6). The average relative weight for LCT surveyed in 2018 was near the benchmark of 100. Table 6. Body condition measures of LCT Catnip Reservoir, 2018.
Catnip Reservoir 2018
Species Observed
Lengths (mm) Observed
Weights (g) Standard Weight* Relative Weight Index LCT 535 1680 1689.3 99.44947611 LCT 535 1330 1689.3 78.73083526 LCT 518 1190 1547.3 76.90816261 LCT 490 1710 1288.1 132.7536682 LCT 368 540 541.3 99.75983743 LCT 346 490 436.2 112.3337918 LCT 490 1025 1288.1 79.57456719 LCT 367 580 541.3 107.149455 LCT 475 1275 1170.2 108.9557341 LCT 370 480 541.3 88.67541105 LCT 360 365 497.5 73.36683417
Average 96.15 *Standard weights obtained from Kruse and Hubert 1997.
MANAGEMENT REVIEW
The 2018 contact angler surveys and drop-box results indicated the fishery did meet the guidelines of the Quality Fishery Management Concept, which suggests, “Success rates should be between 0.30 and 1.25 fish per hour and 2.0 to 3.5 fish per angler day with the opportunity to catch fish larger than average size for the species.” Anglers reported catching 1.25 fish per hour and 2.5 fish per angler during the angler contact surveys and 0.94 fish per hour and 2.45 fish per angler in the angler drop-box survey. This was a vast improvement in angler success from 2017, where angler success rates reported in the angler drop-box surveys and mail-in angler questionnaire survey were well below the angler success rates recommended in the Quality Fishery Management Concept. The most likely explanation for the decrease in angler catch rates in 2017 could be related to the spawn migration where LCT moved up Catnip Creek to spawn and became trapped in isolated pools when the water flow decreased. It appears that annual stocking of LCT has helped this fishery rebound from the downswing in angler success observed in 2017.
Angler satisfaction ratings from the angler drop-box surveys for 2018 were all
positive and just below the five-year average for the three angler satisfaction categories. The 2018 satisfaction results were higher than the 2017 results in which the fishery received negative ratings for the “number of fish” and “size of fish.” This is comparable to the mail-in angler questionnaire and angler drop-box angler success rates that were observed in 2017 and described above.

9
Catnip Reservoir was electroshocked for the first time in 2018. The CPUE for this survey was 15.7 LCT/hour. For a Quality Fishery Concept, trout abundance during an electroshocking survey generally falls between 6.0 and 53.0 trout/hour for most similar waters of the state. The electroshocking survey data for trout in Catnip Reservoir fell within this range. A subset of LCT was also weighed during the electroshocking survey to determine body condition. LCT from Catnip Reservoir averaged 96.15, which is just below the benchmark of 100. It is recommended that an electroshocking survey be used to assess the population of LCT in Catnip Reservoir in the future. Replicating the electroshocking survey each year will allow for monitoring trends in population and body condition of LCT in Catnip Reservoir.
RECOMMENDATIONS • Conduct a general assessment of angler use, success, and harvest through
opportunistic angler contacts, return of angler drop-box surveys, and mail-in, angler questionnaire data.
• Maintain the angler information center and angler drop-box when on site. • Coordinate fisheries management activities with the USFWS. • Monitor the population and body condition (relative weight) of LCT by an
electroshocking survey.
REFERENCES
Guy, C.S. and M. Brown. 2007. Analysis and interpretation of Freshwater Fisheries Data. American Fisheries Society. Bethesda Maryland.
Kruse, C.G. and W.A. Hubert, 1997. Proposed standard weight (Ws) equation for interior
cutthroat trout. North American Journal of Fisheries Management. 17:784-790.
Prepared By: Brad Bauman Fisheries Biologist, Western Region Date: December 18, 2018