federal cost of a national pharmacare program mandate of the parliamentary budget officer (pbo) is...
TRANSCRIPT
Federal Cost of a National Pharmacare
Program
Ottawa, Canada 28 September 2017 www.pbo-dpb.gc.ca
The mandate of the Parliamentary Budget Officer (PBO) is to provide independent analysis to Parliament on the state of the nation’s finances, the Government’s estimates and trends in the Canadian economy; and, upon request from a committee or parliamentarian, to estimate the financial cost of any proposal for matters over which Parliament has jurisdiction.
Any analysis of QuintilesIMS data is independently arrived at by PBO on the basis of the data and other information and QuintilesIMS is not responsible for any reliance by recipients of the data or any analysis thereof. Parts of this report are based on data and information provided by the Canadian Institute for Health Information. However, the analyses, conclusions, opinions and statements expressed herein are those of the author and not necessarily those of the Canadian Institute for Health Information.
This analysis is based on Statistics Canada’s Social Policy Simulation Database and Model. The assumptions and calculations underlying the simulation results were prepared by PBO and the responsibility for the use and interpretation of these data is entirely that of the author.
PBO wishes to acknowledge individuals from the Patented Medicine Prices Review Board, the Canadian Life and Health Insurance Association, Health Canada, QuintilesIMS, the Canadian Institute for Health Information and other individuals and organizations who graciously provided information and clarifications. PBO thanks the Quebec Ministry of Health and Social Services for providing the Régie de l’assurance maladie List of Medications.
The Parliamentary Budget Office also wishes to acknowledge and thank the following individuals for their peer review of this report:
Kathy Lee, Program Lead, Pharmaceuticals, Canadian Institute for Health Information, Ottawa;
Jordan Hunt, Manager, Pharmaceuticals, Canadian Institute for Health Information, Ottawa;
Marc-André Gagnon PhD, Associate Professor, School of Public Policy and Administration, Carleton University, Ottawa;
Damien Contandriopoulos, BSc, MSc, PhD, Full Professor, Faculty of Nursing, Université de Montréal, Montreal; and,
Nevzeta Bosnic, Senior Economist, Patented Medicine Prices Review Board, Ottawa.
Please note that the analyses and conclusions in this document do not necessarily reflect those of the individuals or organizations mentioned above.

This report was prepared by the staff of the Parliamentary Budget Officer. Carleigh Busby wrote the report. Jason Jacques, Mark Mahabir and Nigel Wodrich contributed to the analysis. Mostafa Askari provided comments. Nancy Beauchamp and Jocelyne Scrim assisted with the preparation of the report for publication. Please contact [email protected] for further information.
Jean-Denis Fréchette Parliamentary Budget Officer
Table of Contents Executive Summary 1
1. Overall Drug Spending in Canada 5
1.1. Federal Government 10 1.2. Sub-national Public Drug Plans 12 1.3. Private Drug Plans 17 1.4. Out-of-Pocket Expenses and the Uninsured 19 1.5. Drug Prices in Canada 28
2. Scope of National Pharmacare Plan 31
3. What would change? 33
3.1. Behavioural Impacts 35 3.2. The Cost of Co-payment Exemptions 38 3.3. Therapeutic Mix or Drug Market Composition 40 3.4. Price of drugs 41 3.5. Markups and Fees 42 3.6. Total Net Federal Cost 42 3.7. Overall Drug Spending with Pharmacare 43
4. Projections 45
4.1. Context 45 4.2. Results 46
Sensitivity Analysis 48 Appendix A:
Data 54 Appendix B:
Pricing Methodology 56 Appendix C:
Co-payment Exemption Methodology 60 Appendix D:
Methodology – Generic Substitution 64 Appendix E:
Projection Methodology 66 Appendix F:
Drug Cost Containment Strategies 70 Appendix G:
Provincial Drug Plans Overview 73 Appendix H:
Notes 78
Federal Cost of a National Pharmacare Program
1
Executive Summary In September 2016, the House of Commons Standing Committee on Health asked the Parliamentary Budget Officer (PBO) to provide a cost estimate of implementing a national Pharmacare program.
The Committee provided the program’s framework, including the inclusive list of drugs to be covered by Pharmacare based on Quebec’s formulary, eligibility requirements, co-payment levels, and eligibility requirements for co-payment exemptions.
This paper estimates the cost to the federal government of implementing this particular framework for Pharmacare. It incorporates PBO’s assumptions of the potential savings resulting from a stronger position for drug price negotiations, consumption or behavioural responses of providing coverage, and potential changes in the drug market composition.
In addition, this paper provides five-year projections of these federal costs. However, the costs associated with a single administrator of drug benefit claims when compared to multiple administrators both public and private are not considered.
PBO estimates that roughly $28.5 billion was spent on prescription drugs in 2015. Of this, just under half ($13.1 billion) was paid for by public insurance plans, followed by private insurance plans ($10.7 billion) and individuals ($4.7 billion).
While spending on drugs has grown rapidly (5.1 per cent annually from 2004 to 2014), many Canadians are still unable to obtain necessary drugs because of their cost.1 This includes an estimated 2 per cent of Canadians who lack drug insurance coverage and 10 per cent of Canadians who have coverage, but lack the financial means to pay for their prescriptions. Of the $28.5 billion in estimated pharmaceutical expenses in 2015-16, $24.6 billion would be eligible for a national Pharmacare program. These are costs currently incurred by governments ($11.9 billion), private insurance plans ($9.0 billion), and patients ($3.6 billion).
The remaining $3.9 billion was spent on drugs not listed on Quebec’s public drug plan formulary (an inclusive list of drugs eligible for reimbursement by an insurance plan), and are assumed to continue to be consumed at current levels, with current prices.
After accounting for pricing and consumption changes, PBO estimates total drug spending under a national Pharmacare program would amount to
Federal Cost of a National Pharmacare Program
2
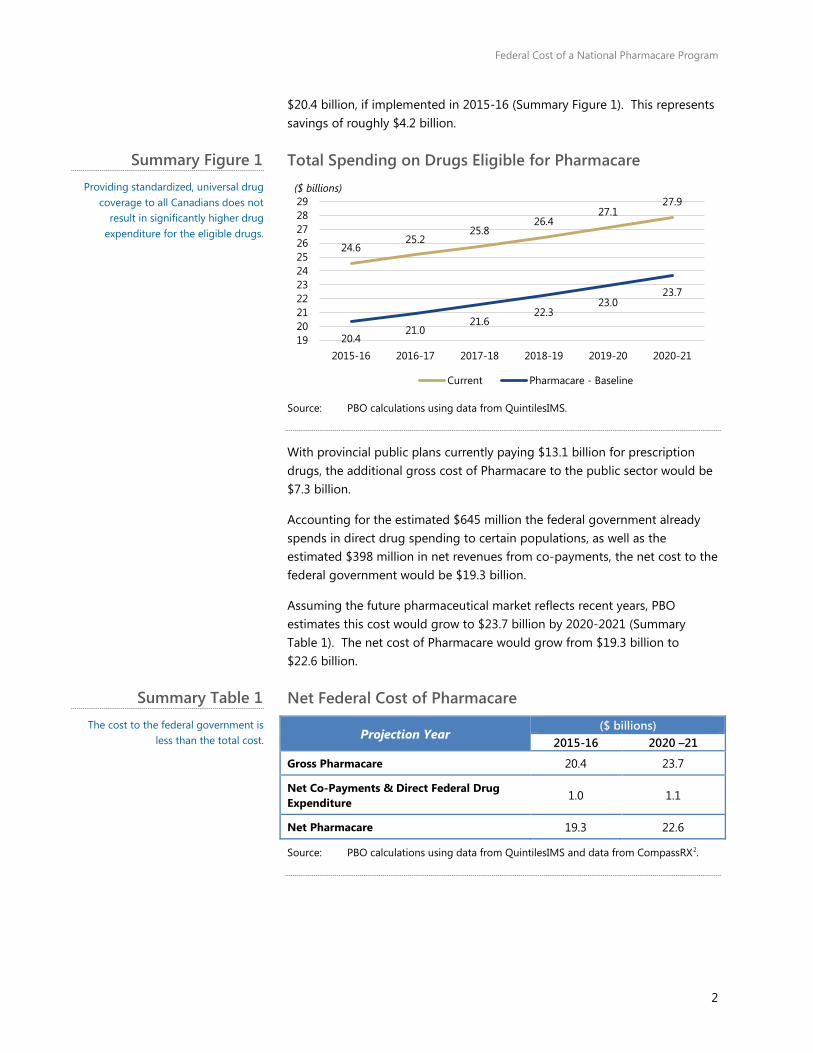
$20.4 billion, if implemented in 2015-16 (Summary Figure 1). This represents savings of roughly $4.2 billion.
Total Spending on Drugs Eligible for Pharmacare
Source: PBO calculations using data from QuintilesIMS.
With provincial public plans currently paying $13.1 billion for prescription drugs, the additional gross cost of Pharmacare to the public sector would be $7.3 billion.
Accounting for the estimated $645 million the federal government already spends in direct drug spending to certain populations, as well as the estimated $398 million in net revenues from co-payments, the net cost to the federal government would be $19.3 billion.
Assuming the future pharmaceutical market reflects recent years, PBO estimates this cost would grow to $23.7 billion by 2020-2021 (Summary Table 1). The net cost of Pharmacare would grow from $19.3 billion to $22.6 billion.
Net Federal Cost of Pharmacare
Projection Year ($ billions)
2015-16 2020 –21
Gross Pharmacare 20.4 23.7
Net Co-Payments & Direct Federal Drug Expenditure 1.0 1.1
Net Pharmacare 19.3 22.6
Source: PBO calculations using data from QuintilesIMS and data from CompassRX2.
24.6 25.2
25.8 26.4
27.1 27.9
20.4 21.0
21.6 22.3
23.0 23.7
1920212223242526272829
2015-16 2016-17 2017-18 2018-19 2019-20 2020-21
($ billions)
Current Pharmacare - Baseline
Summary Figure 1 Providing standardized, universal drug
coverage to all Canadians does not result in significantly higher drug
expenditure for the eligible drugs.
Summary Table 1 The cost to the federal government is
less than the total cost.

Federal Cost of a National Pharmacare Program
3
If one assumes the entirety of federal spending on employees’ drug insurance benefits represents drugs listed on the Quebec public drug plan formulary, the net cost is further reduced by an estimated $658 million to $18.6 billion in 2015-16. 3,4,5
Patient’s out-of-pocket expenditures for drugs other than those listed as exceptional are expected to decrease by 69 to 100 per cent depending on eligibility for co-payment exemptions, or roughly 90 per cent on average.6 These savings are greater when considering patients would no longer pay premiums to their drug insurance provider under Pharmacare.
These findings suggest that Pharmacare could reduce drug expenditures for the drugs listed on Quebec’s public drug plan formulary, while ensuring standardized access to these drugs. However, the growth rate of the net cost of Pharmacare is projected to slightly exceed that of current net drug expenditures for drugs listed on Quebec’s formulary, owing to greater access by patients to medically necessary prescriptions.
The following factors are responsible for an initial decrease in costs:
• A stronger negotiating position for government in establishing drug prices to obtain at least the lowest price currently obtained by public and private insurance plans in Canada, and an additional 25 per cent universal discount;
• Universal application of generic drug substitution levels observed in public coverage to the private sector, where generic drug alternatives exist;
• Public coverage of Quebec formulary drugs only, and not all drugs; and;
• A small revenue offset from applying a $5 co-payment for each brand-name prescription.
Two offsetting factors would increase expenses:
• Lower drug costs for patients at the point of sale will increase aggregate consumption;
• Expanded public coverage – both previously uninsured individuals and those with improved coverage under the public program – will increase total consumption.
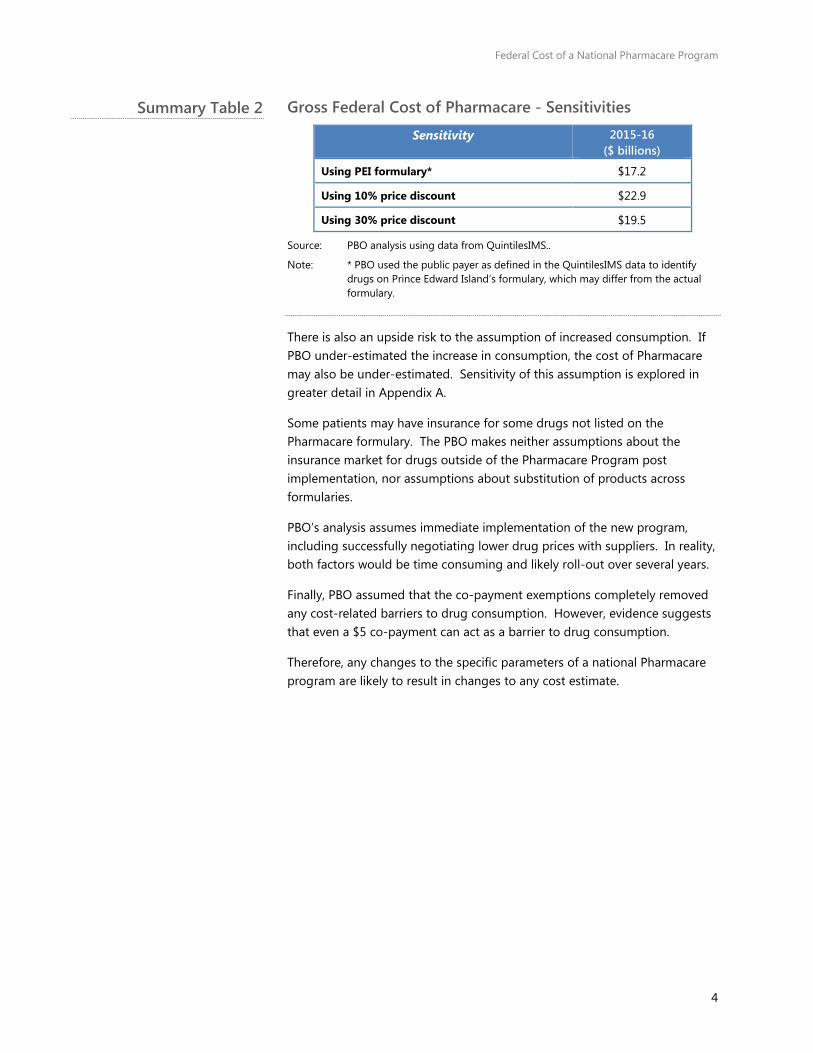
PBO’s results are sensitive to several assumptions. For savings, the key assumptions are the direct price reductions via negotiations and the indirect price reductions obtained through expanded use of generic substitution. For example, if the federal government is only able to secure a universal price discount of 10 per cent, the gross cost would be $22.9 billion rather than $20.4 billion. Additionally, using different formularies will also change the cost estimate. For example, if instead a National Pharmacare program insured drugs listed on Prince Edward Island’s (PEIs) formulary, the gross cost would be an estimated $17.2 billion.
Federal Cost of a National Pharmacare Program
4
Gross Federal Cost of Pharmacare - Sensitivities
Sensitivity 2015-16 ($ billions)
Using PEI formulary* $17.2
Using 10% price discount $22.9
Using 30% price discount $19.5
Source: PBO analysis using data from QuintilesIMS..
Note: * PBO used the public payer as defined in the QuintilesIMS data to identify drugs on Prince Edward Island’s formulary, which may differ from the actual formulary.
There is also an upside risk to the assumption of increased consumption. If PBO under-estimated the increase in consumption, the cost of Pharmacare may also be under-estimated. Sensitivity of this assumption is explored in greater detail in Appendix A.
Some patients may have insurance for some drugs not listed on the Pharmacare formulary. The PBO makes neither assumptions about the insurance market for drugs outside of the Pharmacare Program post implementation, nor assumptions about substitution of products across formularies.
PBO’s analysis assumes immediate implementation of the new program, including successfully negotiating lower drug prices with suppliers. In reality, both factors would be time consuming and likely roll-out over several years.
Finally, PBO assumed that the co-payment exemptions completely removed any cost-related barriers to drug consumption. However, evidence suggests that even a $5 co-payment can act as a barrier to drug consumption.
Therefore, any changes to the specific parameters of a national Pharmacare program are likely to result in changes to any cost estimate.
Summary Table 2
5
1. Overall Drug Spending in Canada In September 2016, the House of Commons Standing Committee on Health asked the Parliamentary Budget Officer to estimate the cost of a national Pharmacare program that would provide all Canadians with a common level of drug coverage.
To begin, PBO provides an overview of the current landscape for prescription drugs.
Excluding hospital drug purchases, PBO estimates that total prescription drug spending in Canada amounted to roughly $28.5 billion in 2015-16 (July-June). This spending was borne by three general sources, or payers: public, private, and out-of-pocket.
For the purposes of this report, the payer or primary payer refers to the public insurance, private insurance, or individual out-of-pocket ‘payer’ that paid for the largest portion of the prescription. The entirety of the transaction value is attributed to the primary payer, even though a portion of this out-of-pocket amount may be reimbursed by an insurer as a coordination of benefits.
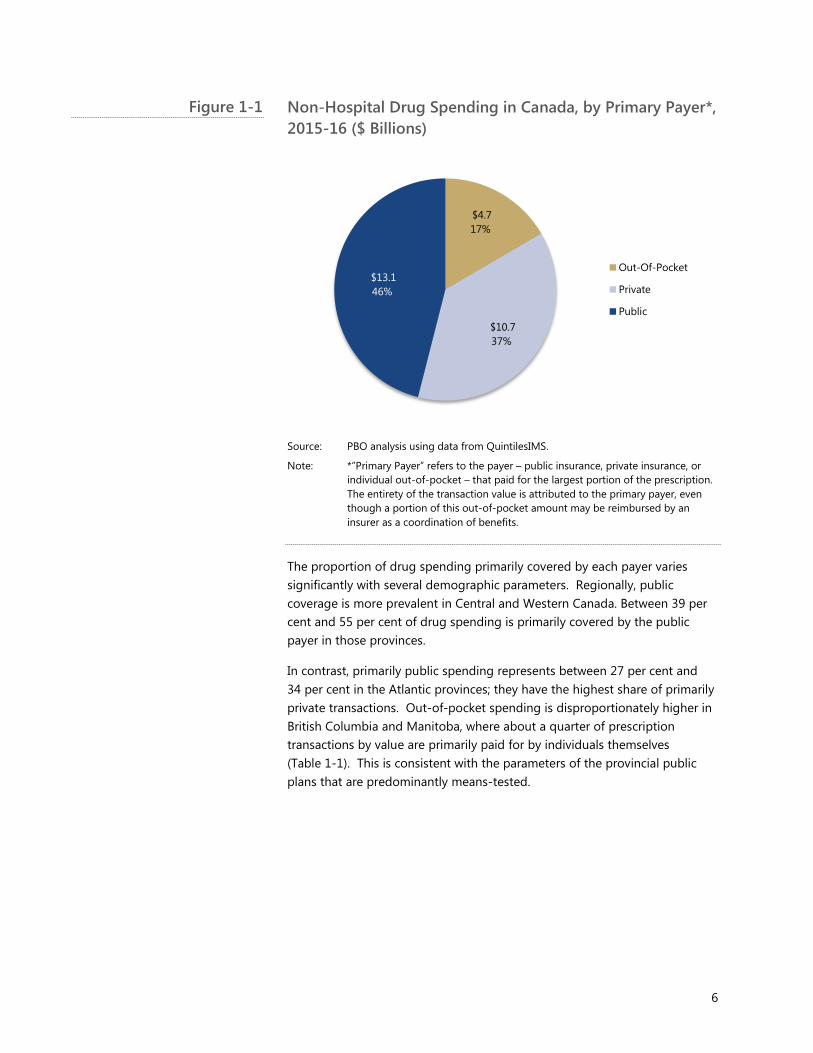
About 46 per cent of the total drug expenditure ($13.1 billion) was covered primarily by public sources; 37 per cent ($10.7 billion) was covered primarily by private insurance; and the remaining 17 per cent ($4.7 billion) was primarily paid for out-of-pocket (Figure 1-1).
6
Non-Hospital Drug Spending in Canada, by Primary Payer*, 2015-16 ($ Billions)
Source: PBO analysis using data from QuintilesIMS.
Note: *”Primary Payer” refers to the payer – public insurance, private insurance, or individual out-of-pocket – that paid for the largest portion of the prescription. The entirety of the transaction value is attributed to the primary payer, even though a portion of this out-of-pocket amount may be reimbursed by an insurer as a coordination of benefits.
The proportion of drug spending primarily covered by each payer varies significantly with several demographic parameters. Regionally, public coverage is more prevalent in Central and Western Canada. Between 39 per cent and 55 per cent of drug spending is primarily covered by the public payer in those provinces.
In contrast, primarily public spending represents between 27 per cent and 34 per cent in the Atlantic provinces; they have the highest share of primarily private transactions. Out-of-pocket spending is disproportionately higher in British Columbia and Manitoba, where about a quarter of prescription transactions by value are primarily paid for by individuals themselves (Table 1-1). This is consistent with the parameters of the provincial public plans that are predominantly means-tested.
$4.7 17%
$10.7 37%
$13.1 46%
Out-Of-Pocket
Private
Public
Figure 1-1
7
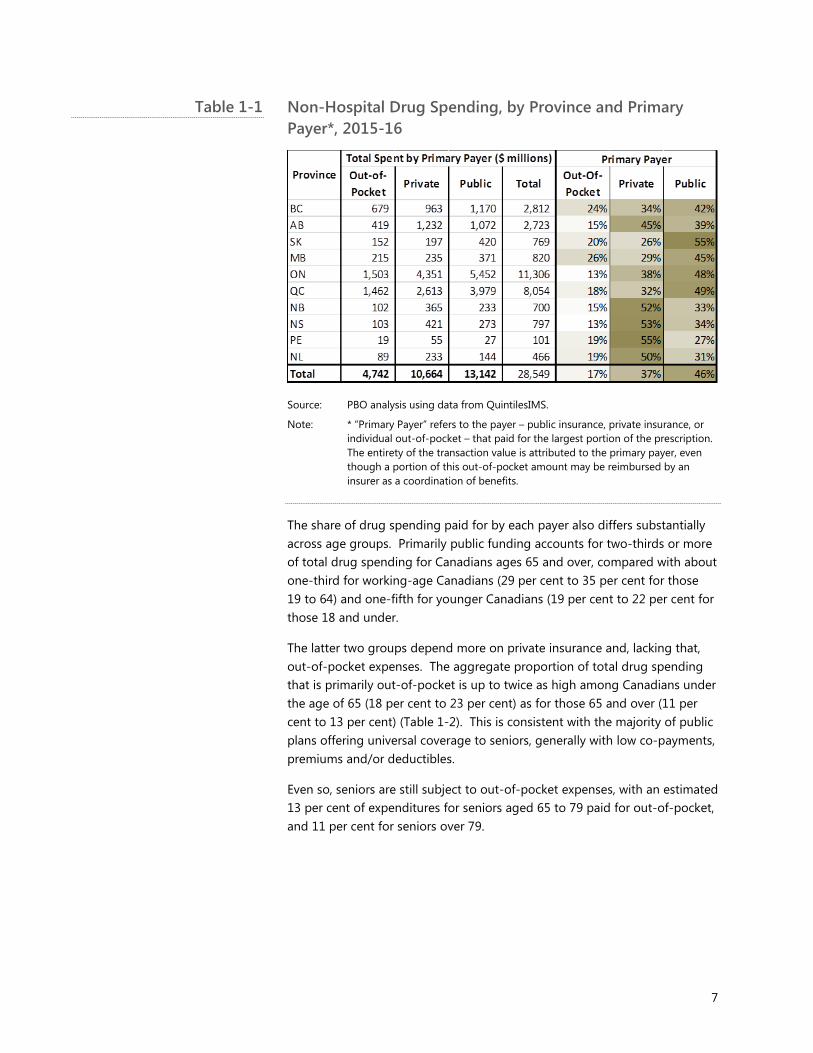
Non-Hospital Drug Spending, by Province and Primary Payer*, 2015-16
Source: PBO analysis using data from QuintilesIMS.
Note: * “Primary Payer” refers to the payer – public insurance, private insurance, or individual out-of-pocket – that paid for the largest portion of the prescription. The entirety of the transaction value is attributed to the primary payer, even though a portion of this out-of-pocket amount may be reimbursed by an insurer as a coordination of benefits.
The share of drug spending paid for by each payer also differs substantially across age groups. Primarily public funding accounts for two-thirds or more of total drug spending for Canadians ages 65 and over, compared with about one-third for working-age Canadians (29 per cent to 35 per cent for those 19 to 64) and one-fifth for younger Canadians (19 per cent to 22 per cent for those 18 and under.
The latter two groups depend more on private insurance and, lacking that, out-of-pocket expenses. The aggregate proportion of total drug spending that is primarily out-of-pocket is up to twice as high among Canadians under the age of 65 (18 per cent to 23 per cent) as for those 65 and over (11 per cent to 13 per cent) (Table 1-2). This is consistent with the majority of public plans offering universal coverage to seniors, generally with low co-payments, premiums and/or deductibles.
Even so, seniors are still subject to out-of-pocket expenses, with an estimated 13 per cent of expenditures for seniors aged 65 to 79 paid for out-of-pocket, and 11 per cent for seniors over 79.
Table 1-1
8
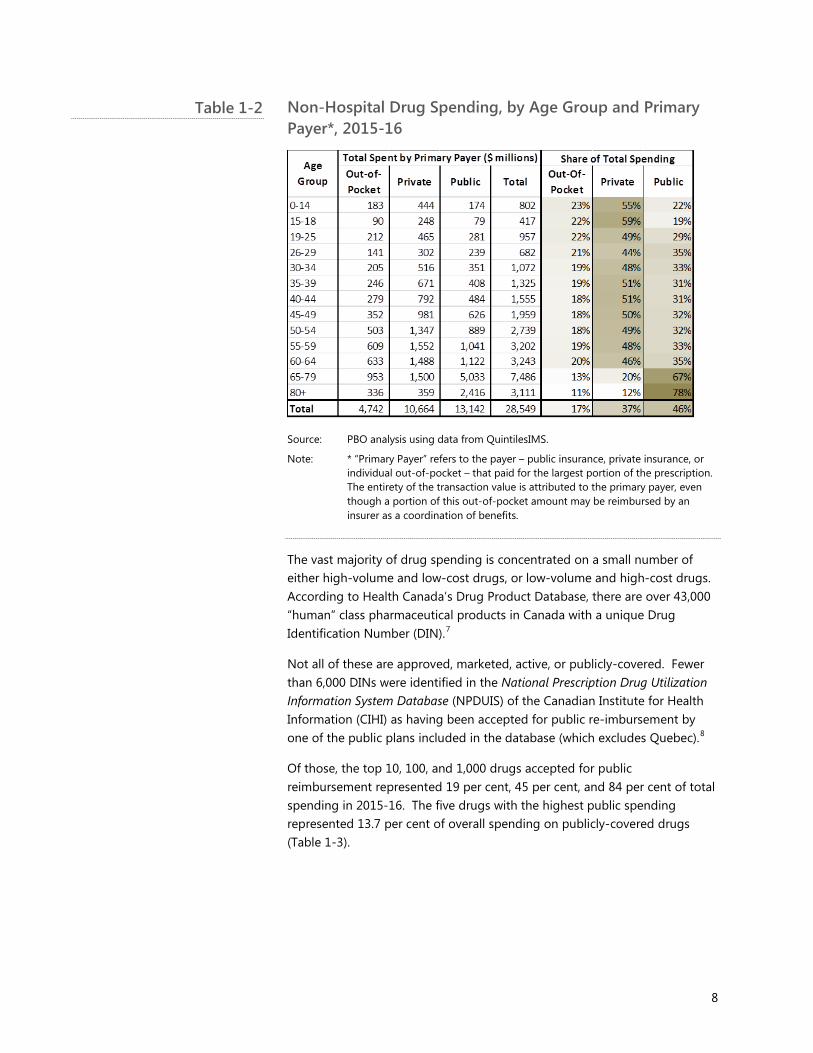
Non-Hospital Drug Spending, by Age Group and Primary Payer*, 2015-16
Source: PBO analysis using data from QuintilesIMS.
Note: * “Primary Payer” refers to the payer – public insurance, private insurance, or individual out-of-pocket – that paid for the largest portion of the prescription. The entirety of the transaction value is attributed to the primary payer, even though a portion of this out-of-pocket amount may be reimbursed by an insurer as a coordination of benefits.
The vast majority of drug spending is concentrated on a small number of either high-volume and low-cost drugs, or low-volume and high-cost drugs. According to Health Canada’s Drug Product Database, there are over 43,000 “human” class pharmaceutical products in Canada with a unique Drug Identification Number (DIN).7
Not all of these are approved, marketed, active, or publicly-covered. Fewer than 6,000 DINs were identified in the National Prescription Drug Utilization Information System Database (NPDUIS) of the Canadian Institute for Health Information (CIHI) as having been accepted for public re-imbursement by one of the public plans included in the database (which excludes Quebec).8
Of those, the top 10, 100, and 1,000 drugs accepted for public reimbursement represented 19 per cent, 45 per cent, and 84 per cent of total spending in 2015-16. The five drugs with the highest public spending represented 13.7 per cent of overall spending on publicly-covered drugs (Table 1-3).
Table 1-2
9
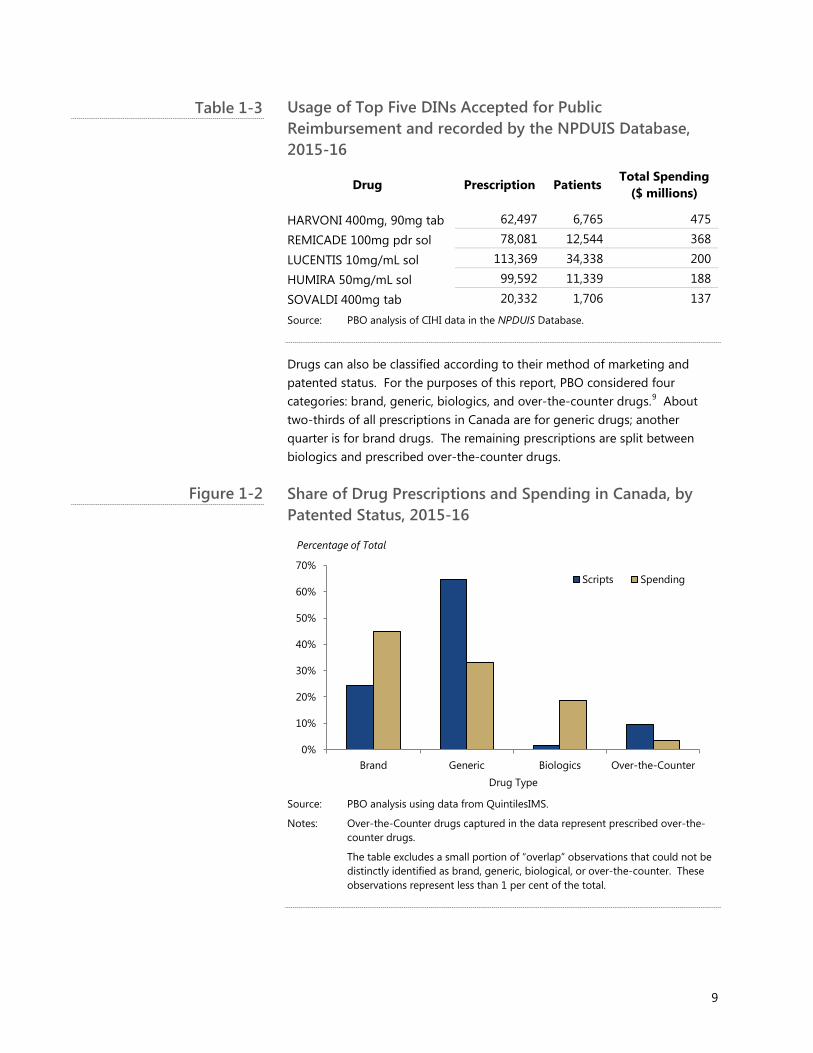
Usage of Top Five DINs Accepted for Public Reimbursement and recorded by the NPDUIS Database, 2015-16
Drug Prescription Patients Total Spending
($ millions)
HARVONI 400mg, 90mg tab 62,497 6,765 475
REMICADE 100mg pdr sol 78,081 12,544 368
LUCENTIS 10mg/mL sol 113,369 34,338 200
HUMIRA 50mg/mL sol 99,592 11,339 188
SOVALDI 400mg tab 20,332 1,706 137
Source: PBO analysis of CIHI data in the NPDUIS Database.
Drugs can also be classified according to their method of marketing and patented status. For the purposes of this report, PBO considered four categories: brand, generic, biologics, and over-the-counter drugs.9 About two-thirds of all prescriptions in Canada are for generic drugs; another quarter is for brand drugs. The remaining prescriptions are split between biologics and prescribed over-the-counter drugs.
Share of Drug Prescriptions and Spending in Canada, by Patented Status, 2015-16
Source: PBO analysis using data from QuintilesIMS.
Notes: Over-the-Counter drugs captured in the data represent prescribed over-the-counter drugs.
The table excludes a small portion of “overlap” observations that could not be distinctly identified as brand, generic, biological, or over-the-counter. These observations represent less than 1 per cent of the total.
0%
10%
20%
30%
40%
50%
60%
70%
Brand Generic Biologics Over-the-CounterDrug Type
Scripts Spending
Percentage of Total
Table 1-3
Figure 1-2
10
Although generic drugs account for 65 per cent of all prescriptions, they represent only 33 per cent of total spending. In contrast, brand drugs account for 24 per cent of prescriptions, but 45 per cent of total drug spending.
This phenomenon highlights the higher per unit cost of brand drugs compared with generic versions of brand drugs. Biologics also reflect this phenomenon: while they represent less than 2 per cent of all prescriptions in Canada, they contribute to almost 19 per cent of all drug spending in Canada (Figure 1-2).
Source: CADTH10.
The following sections of this chapter explore each of these payers of prescribed pharmaceuticals in greater detail.
1.1. Federal Government
The federal government’s role in pharmaceuticals includes regulating market access; ensuring the safety, efficacy and quality of drugs; providing financial support to the provinces as stipulated in the Canada Health Act (CHA) via the Canada Health Transfer (CHT); delivering and/or directly funding of pharmaceuticals to certain populations; and containing the price of new and innovative drugs.11
Health Canada
Health Canada is the federal department responsible for approving new pharmaceuticals for sale in Canada. Specifically, Health Canada examines the efficacy, safety and manufacturing quality of prescription and non-
Box 1-1 Patent Status
Brand-name drugs refer to drugs that were the version initially marketed as New Active Substances. They are the first version sold by the innovator manufacturer and are known as the Canadian Reference Product. They may be patented, or off-patent. Generic drugs have identical active ingredients to the brand-name drug, and enter the market after the patent expiry of the brand-name drug. Biologics are a class of drugs derived through the metabolism of living organisms, rather than being synthesized in a laboratory. They can include brand-name biologics or generic biologics. Over-the-counter drugs is a term used to describe all drugs that do not typically require a prescription to be purchased. They can include brand-name or generic; an OTC drug cannot be biologic as per Health Canada classification.
11
prescription drugs.12 Once approved, Health Canada will issue a Notice of Compliance to the drug manufacturer.13
Additionally, approved drugs may have patents, resulting in their addition to the Patent Register administered by Health Canada. This is a list of patents for drugs sold in Canada.14 Any manufacturer wishing to sell a generic of a drug listed in the Patent Register must wait for the patent to expire before obtaining market authorization from Health Canada.15, 16
Patented Medicine Prices Review Board
The Patented Medicine Prices Review Board (PMPRB) is the arm’s-length federal organization with a mandate to ensure that “factory gate” drug prices for all patented drugs are not excessive. This is the price at which they are sold to wholesalers, pharmacies and other large distributers. They include new and existing patented drugs.
The PMPRB uses factors set out in the Patent Act to determine if the price is excessive. 17 Where the price has been found to be excessive, the PMPRB has the authority to order a price reduction or a payment that offsets up to twice the amount of excess revenues derived from the sale of drugs at the excessive price.18
Direct and Indirect Spending
The federal government is responsible for funding and/or delivering pharmaceuticals to certain populations including First Nations and Inuit persons, Veterans, members of the military, members of the Royal Canadian Mounted Police, refugees, and inmates in federal penitentiaries.19 For 2015-16, this cost amounted to an estimated $645 million.
The federal government also offers the Medical Expense Tax Credit, which gives Canadians with significant medical expenses a 15 per cent non-refundable tax credit (minimum 3 per cent of their net income, or $2,268 for 2017).20 There is also a supplemental refundable medical expense tax credit with a 2017 maximum of $1,203.21 Finance Canada estimates these tax credits and the tax treatment cost the federal government $1,480 million and $150 million respectively.
Also, the federal government does not include benefits received by an employee from an employer-sponsored healthcare plan in the employee’s taxable income. Finance Canada estimates the tax treatment cost the federal government $2,605 million in 2016. 22
Finally, as an employer, it is estimated that the federal government spends roughly $658 million on federal employees’ private drug insurance plans.23
12
1.2. Sub-national Public Drug Plans
Each province and territory administers its own drug insurance plan, and the criteria vary. Generally, each jurisdiction stipulates the specific eligibility requirements for its population and the specific drugs it will cover, as well as any cost-sharing measures required.
Formularies are the unique inclusive lists of drugs that provincial or territorial pharmacare plans will cover either with or without eligibility requirements. Exceptional drugs or limited access drugs are drugs that have eligibility requirements.24
Often, provinces will follow the recommendations made by the Canadian Agency for Drugs and Technologies in Health (CADTH), or the Institut national d’excellence en santé et en services sociaux (INESSS) in Quebec, when deciding to add new drugs to their formularies.
New non-cancer drugs are evaluated for their cost-effectiveness via the Common Drug Review (CDR), while new cancer drugs are evaluated via the pan-Canadian Oncology Drug Review (pCODR), both of which are conducted by the CADTH.25 In Quebec, it is INESSS that evaluates the cost-effectiveness of new drugs, for both cancer and non-cancer drugs.26
While each province creates and manages its own unique formulary, evidence suggests there is consistency in the coverage of drugs across the provinces.
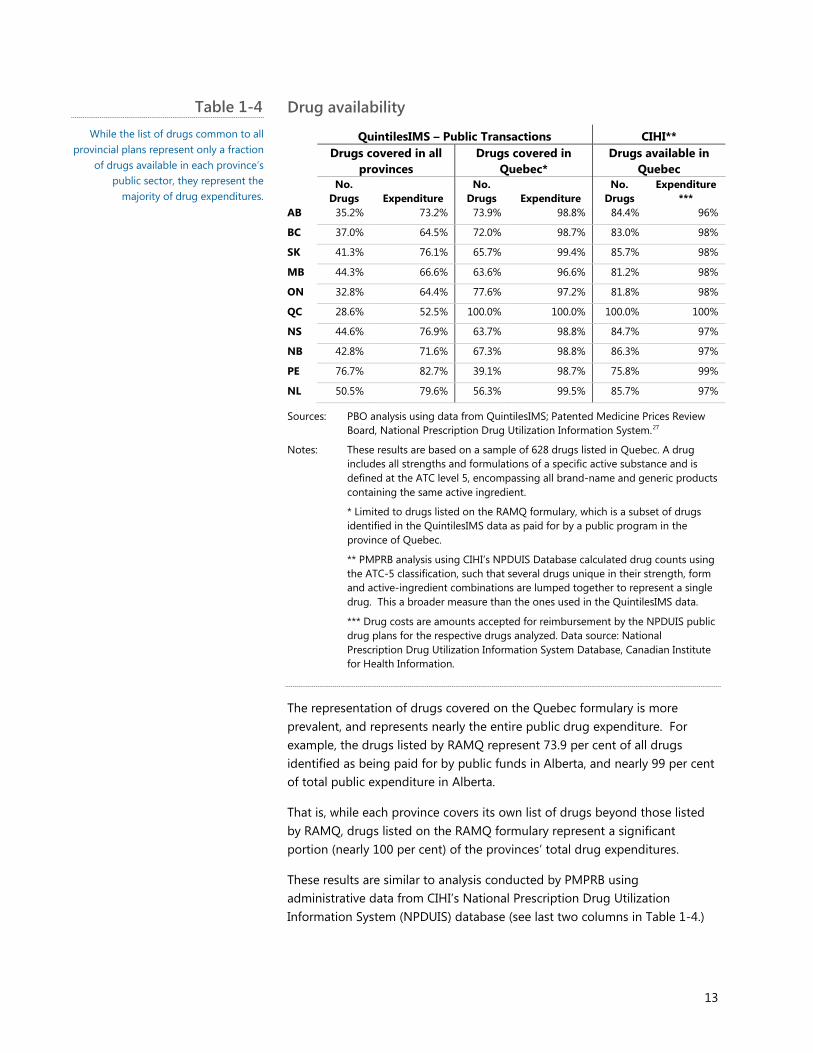
Table 1-4 shows, for example, that the list of drugs covered in all provinces comprises only 32.8 per cent of the drugs covered in Ontario, suggesting Ontario has many more drugs beyond this list. At the same time, those drugs represent nearly 65 per cent of Ontario’s public drug expenditures, suggesting the additional drugs covered are low cost or low usage.
13
Drug availability QuintilesIMS – Public Transactions CIHI**
Drugs covered in all
provinces Drugs covered in
Quebec* Drugs available in
Quebec
No. Drugs Expenditure
No. Drugs Expenditure
No. Drugs
Expenditure***
AB 35.2% 73.2% 73.9% 98.8% 84.4% 96%
BC 37.0% 64.5% 72.0% 98.7% 83.0% 98%
SK 41.3% 76.1% 65.7% 99.4% 85.7% 98%
MB 44.3% 66.6% 63.6% 96.6% 81.2% 98%
ON 32.8% 64.4% 77.6% 97.2% 81.8% 98%
QC 28.6% 52.5% 100.0% 100.0% 100.0% 100%
NS 44.6% 76.9% 63.7% 98.8% 84.7% 97%
NB 42.8% 71.6% 67.3% 98.8% 86.3% 97%
PE 76.7% 82.7% 39.1% 98.7% 75.8% 99%
NL 50.5% 79.6% 56.3% 99.5% 85.7% 97%
Sources: PBO analysis using data from QuintilesIMS; Patented Medicine Prices Review Board, National Prescription Drug Utilization Information System.27
Notes: These results are based on a sample of 628 drugs listed in Quebec. A drug includes all strengths and formulations of a specific active substance and is defined at the ATC level 5, encompassing all brand-name and generic products containing the same active ingredient.
* Limited to drugs listed on the RAMQ formulary, which is a subset of drugs identified in the QuintilesIMS data as paid for by a public program in the province of Quebec.
** PMPRB analysis using CIHI’s NPDUIS Database calculated drug counts using the ATC-5 classification, such that several drugs unique in their strength, form and active-ingredient combinations are lumped together to represent a single drug. This a broader measure than the ones used in the QuintilesIMS data.
*** Drug costs are amounts accepted for reimbursement by the NPDUIS public drug plans for the respective drugs analyzed. Data source: National Prescription Drug Utilization Information System Database, Canadian Institute for Health Information.
The representation of drugs covered on the Quebec formulary is more prevalent, and represents nearly the entire public drug expenditure. For example, the drugs listed by RAMQ represent 73.9 per cent of all drugs identified as being paid for by public funds in Alberta, and nearly 99 per cent of total public expenditure in Alberta.
That is, while each province covers its own list of drugs beyond those listed by RAMQ, drugs listed on the RAMQ formulary represent a significant portion (nearly 100 per cent) of the provinces’ total drug expenditures.
These results are similar to analysis conducted by PMPRB using administrative data from CIHI’s National Prescription Drug Utilization Information System (NPDUIS) database (see last two columns in Table 1-4.)
Table 1-4 While the list of drugs common to all
provincial plans represent only a fraction of drugs available in each province’s
public sector, they represent the majority of drug expenditures.
14
The main difference between PBO’s analysis and that of PMPRB is that PMPRB made this calculation at a higher level than the drug identification number (DIN).
Using a higher level of drug identification inherently assumes a province covers a drug listed by RAMQ if that province covers a generic version of a RAMQ drug, or in a different strength and/or form. DIN-level analysis limits the analysis to only the exact drug listed by RAMQ, resulting in a smaller calculation of commonality.
In addition to the list of drugs covered, provincial and territorial plans also use mandatory drug interchangeability (substituting a generic drug for a brand-name drug), usually providing a list of generic drugs acceptable for substitution.
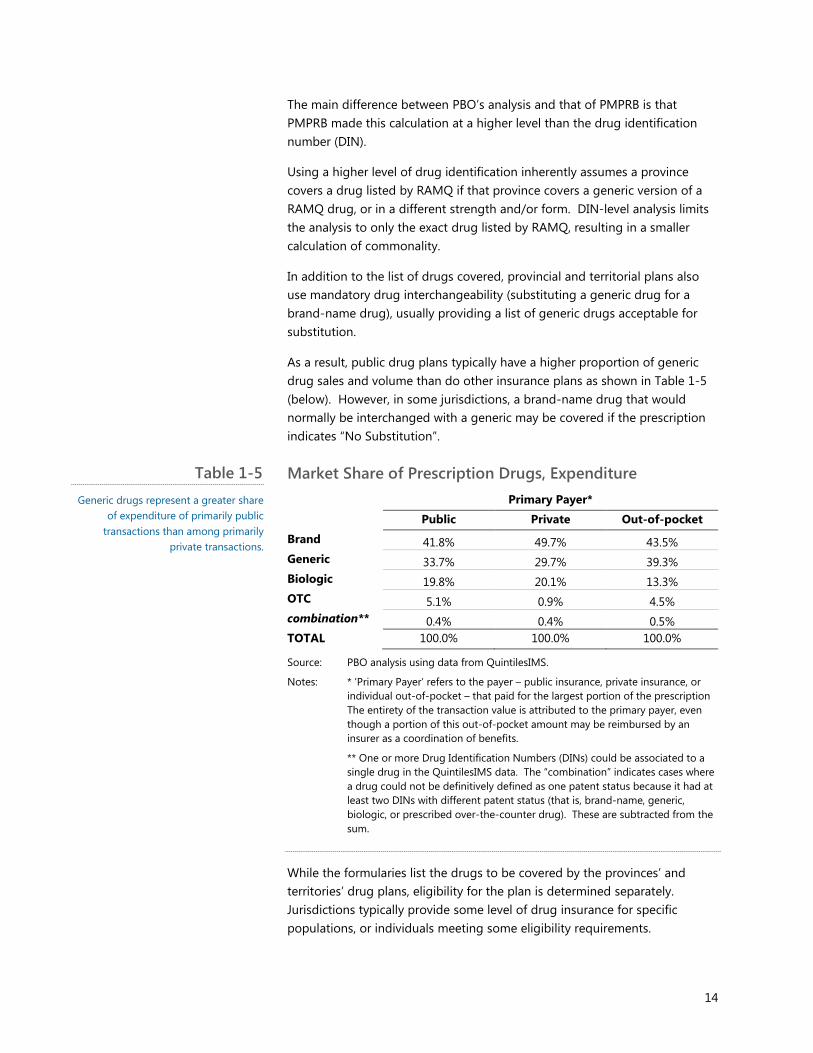
As a result, public drug plans typically have a higher proportion of generic drug sales and volume than do other insurance plans as shown in Table 1-5 (below). However, in some jurisdictions, a brand-name drug that would normally be interchanged with a generic may be covered if the prescription indicates “No Substitution”.
Market Share of Prescription Drugs, Expenditure Primary Payer*
Public Private Out-of-pocket
Brand 41.8% 49.7% 43.5% Generic 33.7% 29.7% 39.3% Biologic 19.8% 20.1% 13.3% OTC 5.1% 0.9% 4.5% combination** 0.4% 0.4% 0.5% TOTAL 100.0% 100.0% 100.0%
Source: PBO analysis using data from QuintilesIMS.
Notes: * ‘Primary Payer’ refers to the payer – public insurance, private insurance, or individual out-of-pocket – that paid for the largest portion of the prescription The entirety of the transaction value is attributed to the primary payer, even though a portion of this out-of-pocket amount may be reimbursed by an insurer as a coordination of benefits.
** One or more Drug Identification Numbers (DINs) could be associated to a single drug in the QuintilesIMS data. The “combination” indicates cases where a drug could not be definitively defined as one patent status because it had at least two DINs with different patent status (that is, brand-name, generic, biologic, or prescribed over-the-counter drug). These are subtracted from the sum.
While the formularies list the drugs to be covered by the provinces’ and territories’ drug plans, eligibility for the plan is determined separately. Jurisdictions typically provide some level of drug insurance for specific populations, or individuals meeting some eligibility requirements.
Table 1-5 Generic drugs represent a greater share
of expenditure of primarily public transactions than among primarily
private transactions.
15
More specifically, most of these plans typically cover seniors, low-income families or individuals. They also cover what is known as “catastrophic drug coverage” or expenses for individuals whose drug costs become a significant portion of their income.
Aside from specific criteria, the health needs of each province’s population, prescribing habits of physicians, generic drug pricing, and price negotiations vary. This creates differences in the consumption or even the coverage of various drugs to specific populations.
Finally, provincial drug plans also vary in their determination of patient co-payments. Some provinces have a fixed co-payment for some beneficiaries, and a means-tested co-payment for others. Provinces also set different thresholds for both the income and the drug expenditure, often with a sliding scale, such that drug expenses that exceed a certain percentage of income will be reimbursed.
As a result, the out-of-pocket expenditure faced by a patient can vary significantly depending on the province or territory in which they live. Additionally, some plans also charge premiums that are paid for out-of-pocket. See Appendix H for a comparison of provincial drug plans.
16
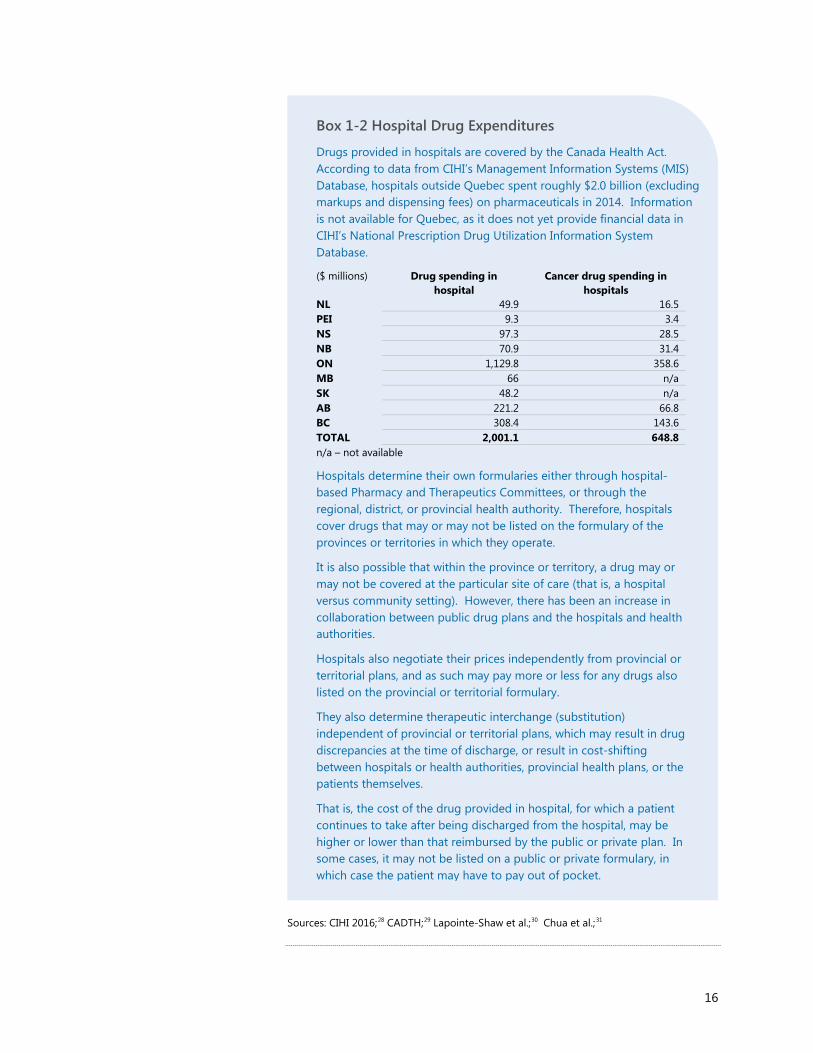
Sources: CIHI 2016;28 CADTH;29 Lapointe-Shaw et al.;30 Chua et al.;31
Box 1-2 Hospital Drug Expenditures
Drugs provided in hospitals are covered by the Canada Health Act. According to data from CIHI’s Management Information Systems (MIS) Database, hospitals outside Quebec spent roughly $2.0 billion (excluding markups and dispensing fees) on pharmaceuticals in 2014. Information is not available for Quebec, as it does not yet provide financial data in CIHI’s National Prescription Drug Utilization Information System Database.
($ millions) Drug spending in hospital
Cancer drug spending in hospitals
NL 49.9 16.5 PEI 9.3 3.4 NS 97.3 28.5 NB 70.9 31.4 ON 1,129.8 358.6 MB 66 n/a SK 48.2 n/a AB 221.2 66.8 BC 308.4 143.6 TOTAL 2,001.1 648.8 n/a – not available
Hospitals determine their own formularies either through hospital-based Pharmacy and Therapeutics Committees, or through the regional, district, or provincial health authority. Therefore, hospitals cover drugs that may or may not be listed on the formulary of the provinces or territories in which they operate.
It is also possible that within the province or territory, a drug may or may not be covered at the particular site of care (that is, a hospital versus community setting). However, there has been an increase in collaboration between public drug plans and the hospitals and health authorities.
Hospitals also negotiate their prices independently from provincial or territorial plans, and as such may pay more or less for any drugs also listed on the provincial or territorial formulary.
They also determine therapeutic interchange (substitution) independent of provincial or territorial plans, which may result in drug discrepancies at the time of discharge, or result in cost-shifting between hospitals or health authorities, provincial health plans, or the patients themselves.
That is, the cost of the drug provided in hospital, for which a patient continues to take after being discharged from the hospital, may be higher or lower than that reimbursed by the public or private plan. In some cases, it may not be listed on a public or private formulary, in which case the patient may have to pay out of pocket.
17
1.3. Private Drug Plans
Eligibility requirements for private drug plans are usually subject to availability through employment, rather than any particular personal criteria. However, individual plans are available for purchase independent of employment.32
The Canadian Life and Health Insurance Association (CLHIA) estimates that at least 25.3 million Canadians, roughly 70.5 per cent, have private drug insurance directly or through a family member by employer-sponsored plans (group plans).33, 34
Private drug plans mirror the public plans in several aspects. Like public plans, private health insurance plans that cover pharmaceuticals also have formularies, which are generally broader than their public counterparts.
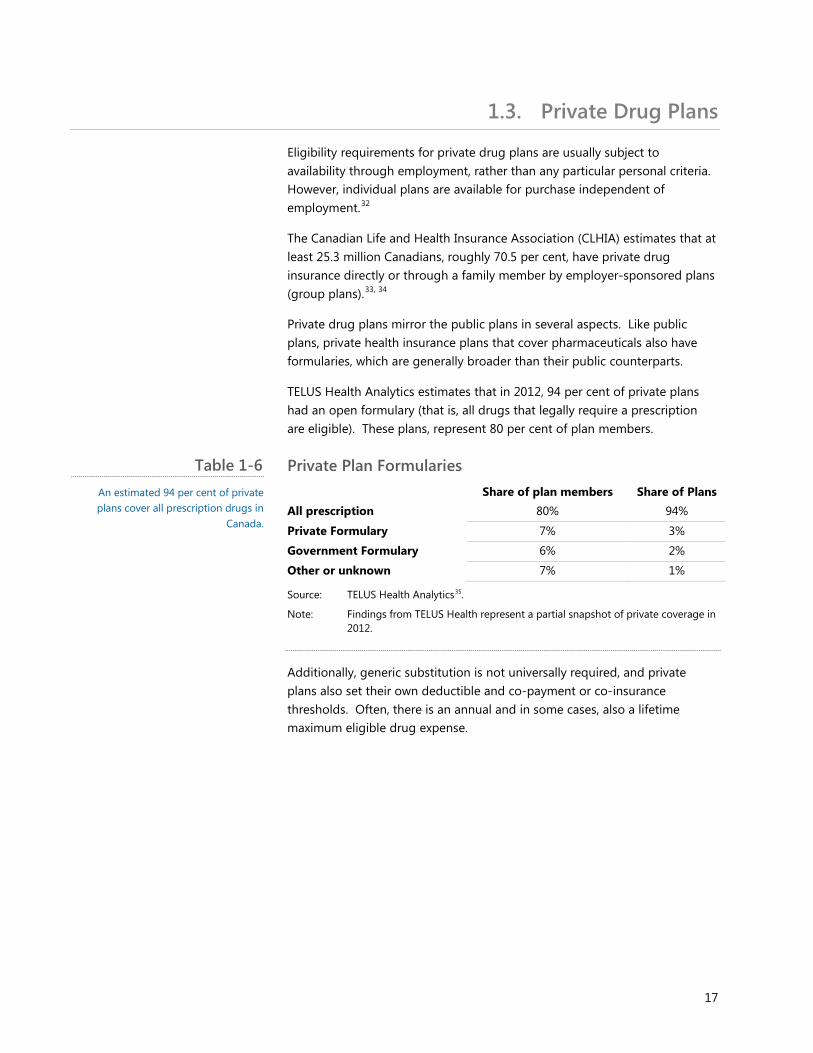
TELUS Health Analytics estimates that in 2012, 94 per cent of private plans had an open formulary (that is, all drugs that legally require a prescription are eligible). These plans, represent 80 per cent of plan members.
Private Plan Formularies Share of plan members Share of Plans All prescription 80% 94%
Private Formulary 7% 3%
Government Formulary 6% 2%
Other or unknown 7% 1%
Source: TELUS Health Analytics35.
Note: Findings from TELUS Health represent a partial snapshot of private coverage in 2012.
Additionally, generic substitution is not universally required, and private plans also set their own deductible and co-payment or co-insurance thresholds. Often, there is an annual and in some cases, also a lifetime maximum eligible drug expense.
Table 1-6 An estimated 94 per cent of private plans cover all prescription drugs in
Canada.
18
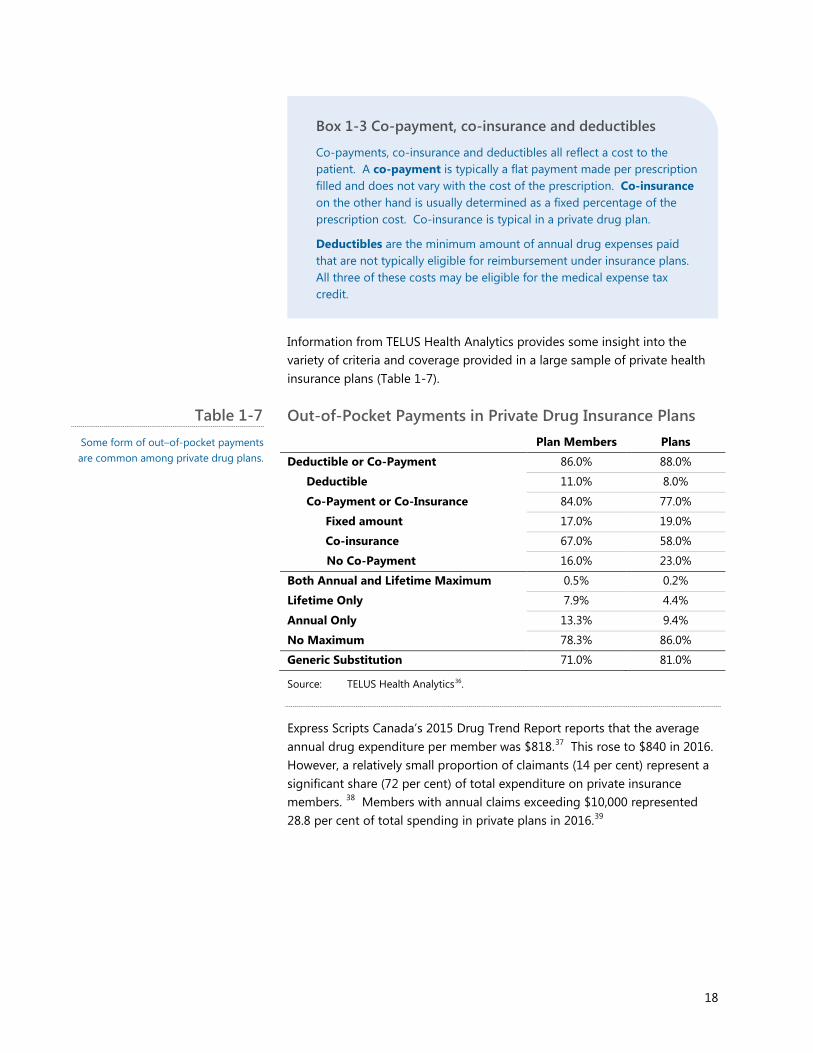
Information from TELUS Health Analytics provides some insight into the variety of criteria and coverage provided in a large sample of private health insurance plans (Table 1-7).
Out-of-Pocket Payments in Private Drug Insurance Plans
Plan Members Plans
Deductible or Co-Payment 86.0% 88.0%
Deductible 11.0% 8.0%
Co-Payment or Co-Insurance 84.0% 77.0%
Fixed amount 17.0% 19.0%
Co-insurance 67.0% 58.0%
No Co-Payment 16.0% 23.0%
Both Annual and Lifetime Maximum 0.5% 0.2%
Lifetime Only 7.9% 4.4%
Annual Only 13.3% 9.4%
No Maximum 78.3% 86.0%
Generic Substitution 71.0% 81.0%
Source: TELUS Health Analytics36.
Express Scripts Canada’s 2015 Drug Trend Report reports that the average annual drug expenditure per member was $818.37 This rose to $840 in 2016. However, a relatively small proportion of claimants (14 per cent) represent a significant share (72 per cent) of total expenditure on private insurance members. 38 Members with annual claims exceeding $10,000 represented 28.8 per cent of total spending in private plans in 2016.39
Box 1-3 Co-payment, co-insurance and deductibles
Co-payments, co-insurance and deductibles all reflect a cost to the patient. A co-payment is typically a flat payment made per prescription filled and does not vary with the cost of the prescription. Co-insurance on the other hand is usually determined as a fixed percentage of the prescription cost. Co-insurance is typical in a private drug plan.
Deductibles are the minimum amount of annual drug expenses paid that are not typically eligible for reimbursement under insurance plans. All three of these costs may be eligible for the medical expense tax credit.
Table 1-7 Some form of out–of-pocket payments are common among private drug plans.
19
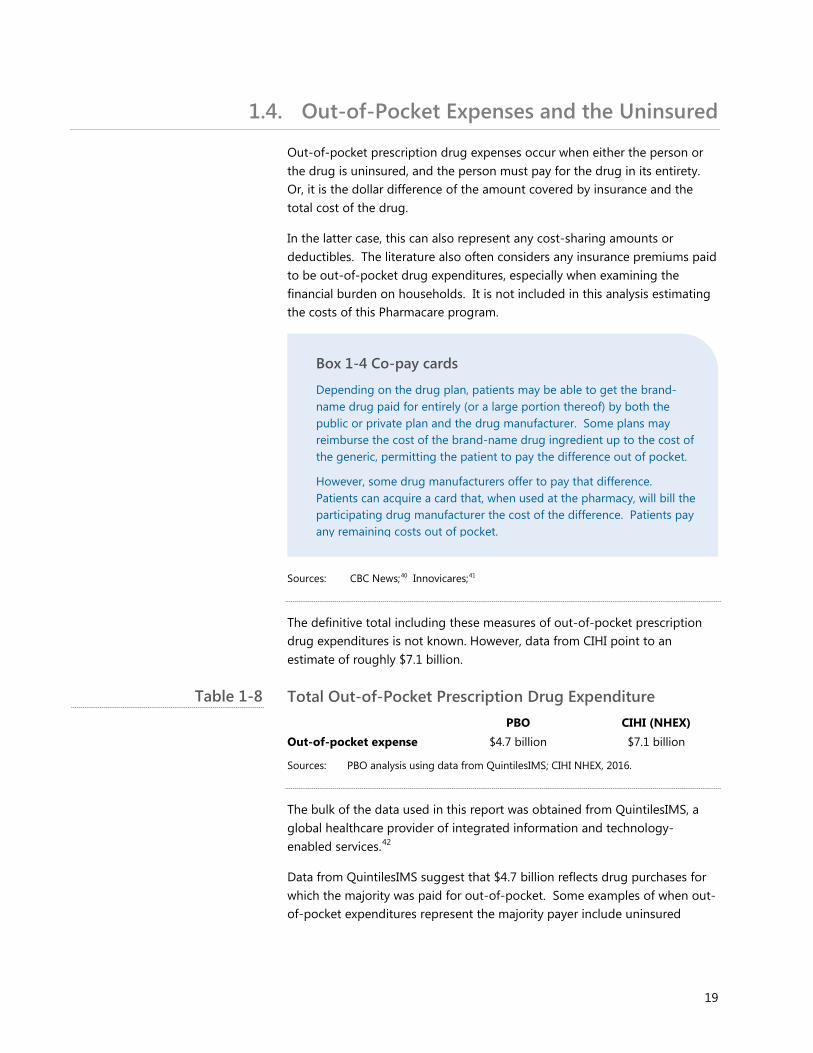
1.4. Out-of-Pocket Expenses and the Uninsured
Out-of-pocket prescription drug expenses occur when either the person or the drug is uninsured, and the person must pay for the drug in its entirety. Or, it is the dollar difference of the amount covered by insurance and the total cost of the drug.
In the latter case, this can also represent any cost-sharing amounts or deductibles. The literature also often considers any insurance premiums paid to be out-of-pocket drug expenditures, especially when examining the financial burden on households. It is not included in this analysis estimating the costs of this Pharmacare program.
Sources: CBC News;40 Innovicares;41
The definitive total including these measures of out-of-pocket prescription drug expenditures is not known. However, data from CIHI point to an estimate of roughly $7.1 billion.
Total Out-of-Pocket Prescription Drug Expenditure PBO CIHI (NHEX) Out-of-pocket expense $4.7 billion $7.1 billion
Sources: PBO analysis using data from QuintilesIMS; CIHI NHEX, 2016.
The bulk of the data used in this report was obtained from QuintilesIMS, a global healthcare provider of integrated information and technology-enabled services.42
Data from QuintilesIMS suggest that $4.7 billion reflects drug purchases for which the majority was paid for out-of-pocket. Some examples of when out-of-pocket expenditures represent the majority payer include uninsured
Box 1-4 Co-pay cards
Depending on the drug plan, patients may be able to get the brand-name drug paid for entirely (or a large portion thereof) by both the public or private plan and the drug manufacturer. Some plans may reimburse the cost of the brand-name drug ingredient up to the cost of the generic, permitting the patient to pay the difference out of pocket.
However, some drug manufacturers offer to pay that difference. Patients can acquire a card that, when used at the pharmacy, will bill the participating drug manufacturer the cost of the difference. Patients pay any remaining costs out of pocket.
Table 1-8
20
individuals, cases where the deductible was not yet met, or cases where the expense met or exceeded annual or lifetime caps.
The $2.4-billion difference between the data from QuintilesIMS and CIHI’s NHEX stem from the differences in the definition of payer. The entire value of the prescription drug transactions is assigned to the majority payer in the QuintilesIMS data, whereas CIHI estimates the actual level of expense incurred by the payer.
For example, in instances where patients pay a $100 deductible and a $20 co-payment on a $300 prescription for which they have public insurance, the entirety of that transaction will be allocated to the payer “public”. This is because the majority (60 per cent) of this drug was paid for by public insurance, and the remaining 40 per cent was paid out-of-pocket.
Additionally, the QuintilesIMS data classify transactions based on the payer at the time of payment. If the majority of the cost were to be later reimbursed by either private or public insurance, but was originally paid for entirely out-of-pocket, the transaction would be classified as “cash”. The result of this classification is that total out-of-pocket costs are underestimated.
On the other hand, the result of this classification is that the “cash” payer represents transactions where the patient was the majority payer and did not have insurance, did not have insurance for that particular drug, had to pay a relatively high deductible, or would be later reimbursed and had to pay up-front (the ‘first-dollar’) amount.
For out-of-pocket expenditures, CIHI relies on data from the Survey of Household Spending conducted by Statistics Canada.43, 44 These data do not include premiums paid. That survey suggests that, in 2015, average annual out-of-pocket expenditure amounted to $417 per household. This is only an average; an actual household’s spending can vary greatly depending on its circumstances, including health and insurance coverage. 45
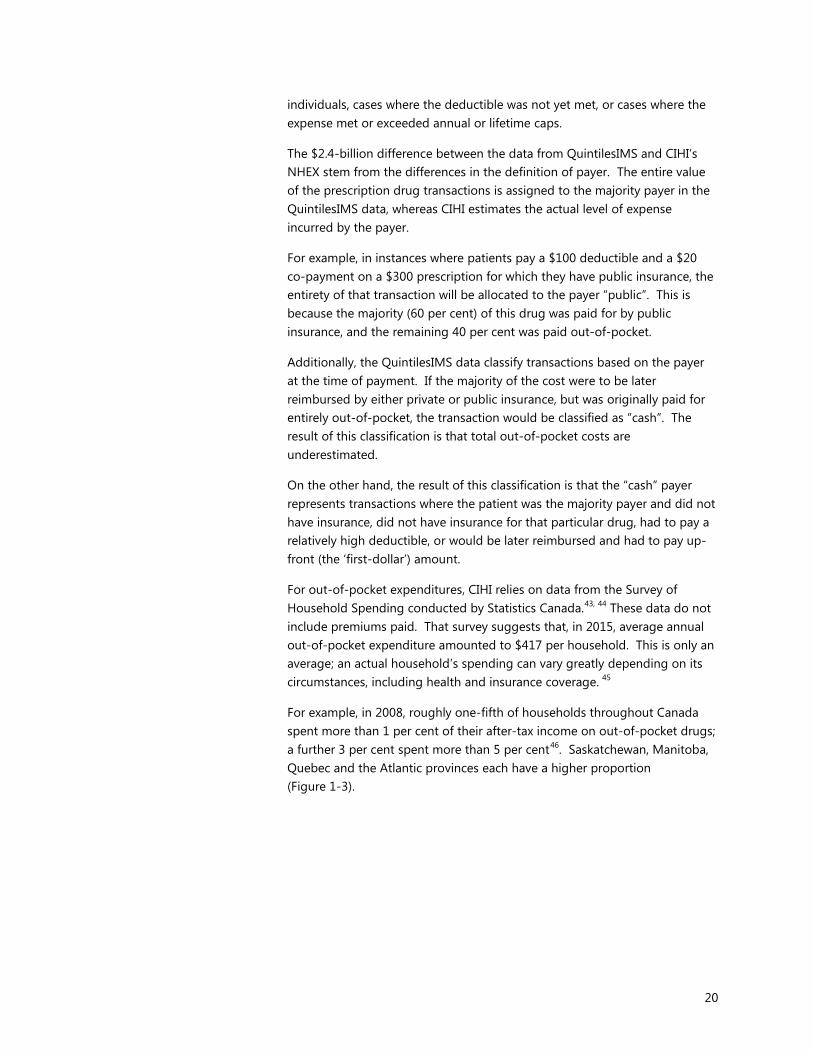
For example, in 2008, roughly one-fifth of households throughout Canada spent more than 1 per cent of their after-tax income on out-of-pocket drugs; a further 3 per cent spent more than 5 per cent46. Saskatchewan, Manitoba, Quebec and the Atlantic provinces each have a higher proportion (Figure 13).
21
Household Spending on Prescription Drugs as a Percentage of After-tax Income, by Province, 2008
Source: PBO analysis of Statistics Canada data (Survey of Household Spending;
CANSIM 109-5012).
Notes: * ‘Canada’ includes the 10 provinces only.
After-tax income is total income minus personal taxes.
This indicator only includes prescribed medicines, drugs and pharmaceutical products purchased by households. Over-the-counter drugs, drugs paid for by government or insurance companies, and premiums for health care plans are not included.
Average out-of-pocket drug expenses also vary across provinces. Ontarians consistently report the lowest annual out-of-pocket drug spending; in 2015, it was $314 per household. If private insurance premiums are included, this rises to $823.
Quebec has the highest, at $526 per household on prescription drugs, or $1,495 when including private insurance premiums. 47
3.0% 3.6%
2.2%
5.9% 5.2%
2.2%
3.3% 4.1%
3.8%
5.8%
5.4%
0%
5%
10%
15%
20%
25%
30%
35%
CAN BC AB SK MB ON QC NB NS PE NL
1% - 2% 2% - 3% 3% - 4% 4% - 5% Over 5%
Figure 1-3 Households face different levels of out-
of-pocket drug expenses.
22
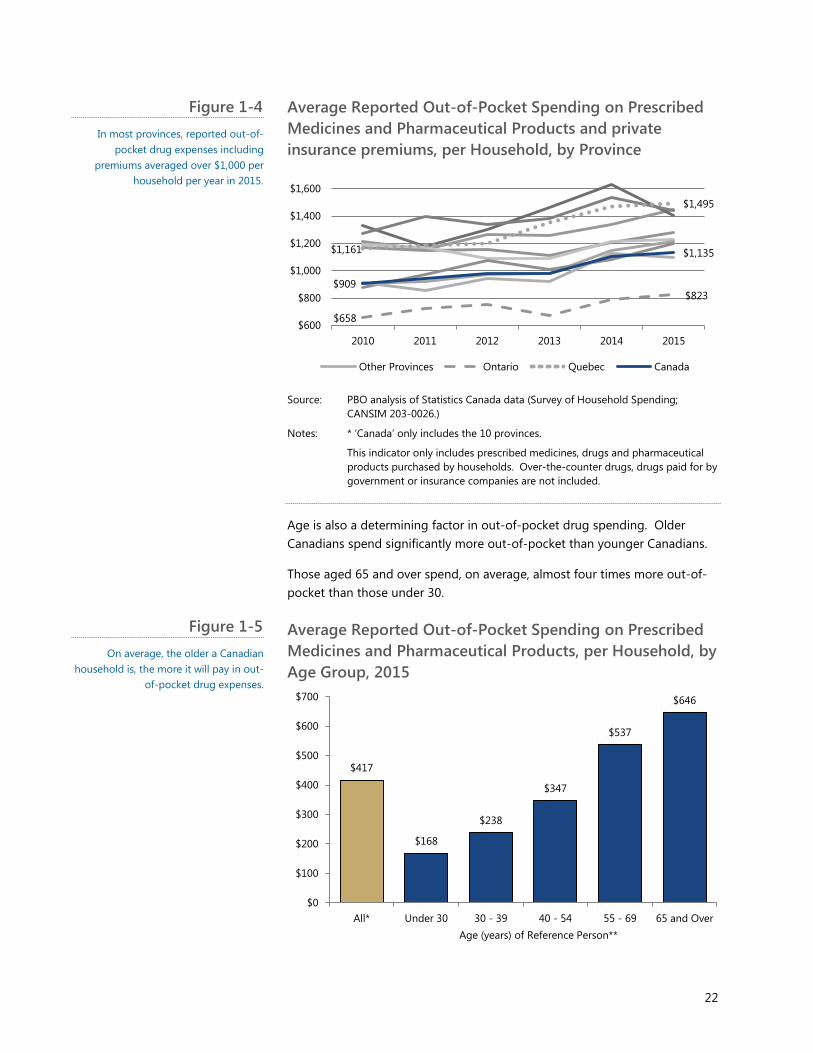
Average Reported Out-of-Pocket Spending on Prescribed Medicines and Pharmaceutical Products and private insurance premiums, per Household, by Province
Source: PBO analysis of Statistics Canada data (Survey of Household Spending;
CANSIM 203-0026.)
Notes: * ‘Canada’ only includes the 10 provinces.
This indicator only includes prescribed medicines, drugs and pharmaceutical products purchased by households. Over-the-counter drugs, drugs paid for by government or insurance companies are not included.
Age is also a determining factor in out-of-pocket drug spending. Older Canadians spend significantly more out-of-pocket than younger Canadians.
Those aged 65 and over spend, on average, almost four times more out-of-pocket than those under 30.
Average Reported Out-of-Pocket Spending on Prescribed Medicines and Pharmaceutical Products, per Household, by Age Group, 2015
$658
$823
$1,161
$1,495
$909
$1,135
$600
$800
$1,000
$1,200
$1,400
$1,600
2010 2011 2012 2013 2014 2015
Other Provinces Ontario Quebec Canada
$417
$168
$238
$347
$537
$646
$0
$100
$200
$300
$400
$500
$600
$700
All* Under 30 30 - 39 40 - 54 55 - 69 65 and OverAge (years) of Reference Person**
Figure 1-4 In most provinces, reported out-of-
pocket drug expenses including premiums averaged over $1,000 per
household per year in 2015.
Figure 1-5 On average, the older a Canadian
household is, the more it will pay in out-of-pocket drug expenses.
23
Source: PBO analysis of Statistics Canada data (Survey of Household Spending; CANSIM 203-0022.)
Notes: * ‘All’ includes the 10 provinces only.
** The reference person is the household member that is mainly responsible for the financial maintenance (for example, pays the mortgage, property taxes or electricity). In cases where members equally share the financial responsibility, one person is chosen to be the reference person.
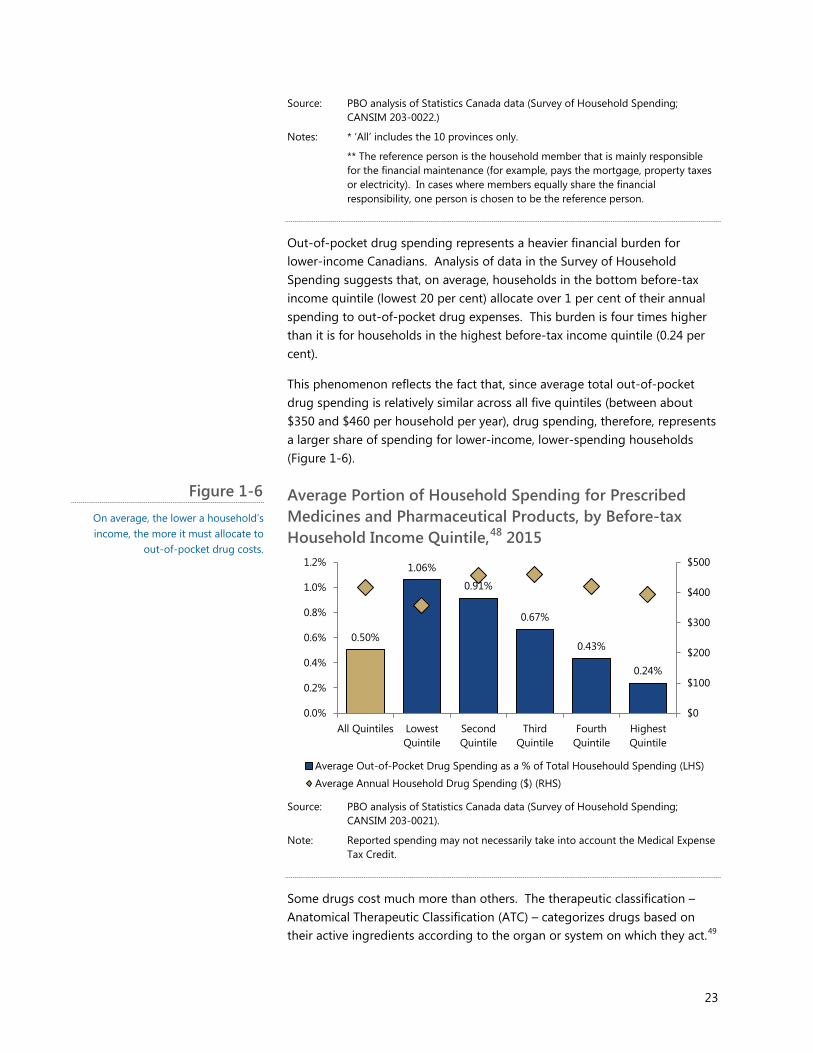
Out-of-pocket drug spending represents a heavier financial burden for lower-income Canadians. Analysis of data in the Survey of Household Spending suggests that, on average, households in the bottom before-tax income quintile (lowest 20 per cent) allocate over 1 per cent of their annual spending to out-of-pocket drug expenses. This burden is four times higher than it is for households in the highest before-tax income quintile (0.24 per cent).
This phenomenon reflects the fact that, since average total out-of-pocket drug spending is relatively similar across all five quintiles (between about $350 and $460 per household per year), drug spending, therefore, represents a larger share of spending for lower-income, lower-spending households (Figure 1-6).
Average Portion of Household Spending for Prescribed Medicines and Pharmaceutical Products, by Before-tax Household Income Quintile,48 2015
Source: PBO analysis of Statistics Canada data (Survey of Household Spending;
CANSIM 203-0021).
Note: Reported spending may not necessarily take into account the Medical Expense Tax Credit.
Some drugs cost much more than others. The therapeutic classification – Anatomical Therapeutic Classification (ATC) – categorizes drugs based on their active ingredients according to the organ or system on which they act.49
0.50%
1.06%
0.91%
0.67%
0.43%
0.24%
$0
$100
$200
$300
$400
$500
0.0%
0.2%
0.4%
0.6%
0.8%
1.0%
1.2%
All Quintiles LowestQuintile
SecondQuintile
ThirdQuintile
FourthQuintile
HighestQuintile
Average Out-of-Pocket Drug Spending as a % of Total Househould Spending (LHS)
Average Annual Household Drug Spending ($) (RHS)
Figure 1-6 On average, the lower a household’s income, the more it must allocate to
out-of-pocket drug costs.
24
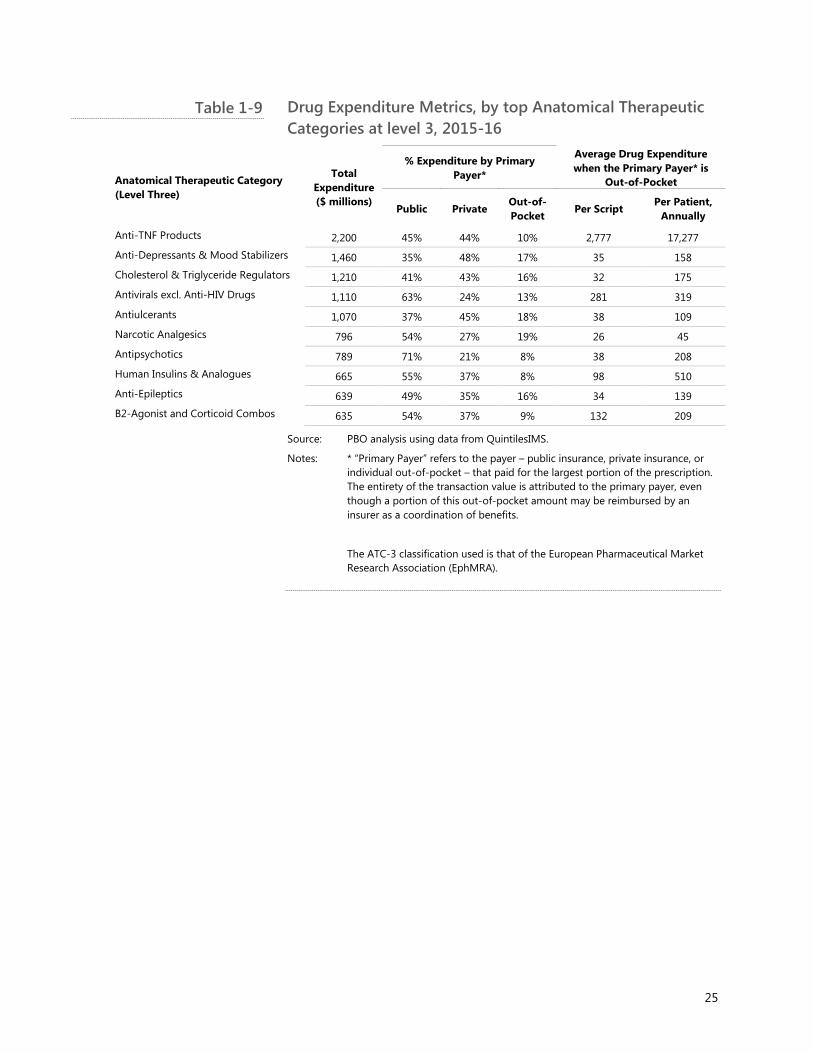
Table 1-9 presents the average annual per-patient costs by ATC, for the top 10 ATC classes ranked by total expenditure.
25
Drug Expenditure Metrics, by top Anatomical Therapeutic Categories at level 3, 2015-16
Anatomical Therapeutic Category (Level Three)
Total Expenditure ($ millions)
% Expenditure by Primary Payer*
Average Drug Expenditure when the Primary Payer* is
Out-of-Pocket
Public Private Out-of-Pocket Per Script
Per Patient, Annually
Anti-TNF Products 2,200 45% 44% 10% 2,777 17,277 Anti-Depressants & Mood Stabilizers 1,460 35% 48% 17% 35 158 Cholesterol & Triglyceride Regulators 1,210 41% 43% 16% 32 175 Antivirals excl. Anti-HIV Drugs 1,110 63% 24% 13% 281 319
Antiulcerants 1,070 37% 45% 18% 38 109
Narcotic Analgesics 796 54% 27% 19% 26 45
Antipsychotics 789 71% 21% 8% 38 208 Human Insulins & Analogues 665 55% 37% 8% 98 510 Anti-Epileptics 639 49% 35% 16% 34 139 B2-Agonist and Corticoid Combos 635 54% 37% 9% 132 209
Source: PBO analysis using data from QuintilesIMS.
Notes: * “Primary Payer” refers to the payer – public insurance, private insurance, or individual out-of-pocket – that paid for the largest portion of the prescription. The entirety of the transaction value is attributed to the primary payer, even though a portion of this out-of-pocket amount may be reimbursed by an insurer as a coordination of benefits.
The ATC-3 classification used is that of the European Pharmaceutical Market Research Association (EphMRA).
Table 1-9
26
Canada Health Transfer The Canada Health Transfer (CHT) is the federal transfer to provinces, payable if provinces adhere to the Canada Health Act (CHA) in the provision and delivery
of their eligible health care services.
The total envelope of CHT funds is equal to the previous years’ amount grown by the three-year moving average growth
rate of Canada’s nominal gross domestic product. The minimum
increased rate is set at 3 per cent. This fiscal year (2017-18) marks the first year that this increased rate is calculated this
way; it was previously legislated at 6 per cent.
Box 1-5 Short History of Public Pharmaceutical Funding
The Constitution of Canada divides the powers of government, giving the power to establish, maintain and manage hospitals to the provinces.
Canada’s first publicly funded hospitals originated in Saskatchewan in 1947. Both Alberta and British Columbia soon followed suit. By 1957, the federal government introduced the Hospital Insurance and Diagnostic Services Act. It stipulated federal reimbursement, or cost sharing, to one-half of provincial and territorial costs for specified hospital and diagnostic service.
In 1966, the federal government passed the Medical Care Act, which offered reimbursement, or cost sharing, of one-half of provincial and territorial costs for specified physician services provided outside of hospitals, once again expanding on an initiative started by Saskatchewan in 1962. By 1972, all provinces and territories had established publicly funded hospital and physician services.
Today, it is the Canada Health Act (CHA) that stipulates the criteria and conditions that health insurance plans of the provinces and territories must meet to receive transfer payments from the federal government. The amounts of these contributions, which are perhaps better known as the Canada Health Transfer (CHT), are determined separately in the Federal-Provincial Fiscal Arrangements Act.
Currently, the CHT payments are made on an equal cash per-capita (per person) basis. These transfer payments are added to the provinces’ and territories’ general revenues and are not directly tied to use in health care.
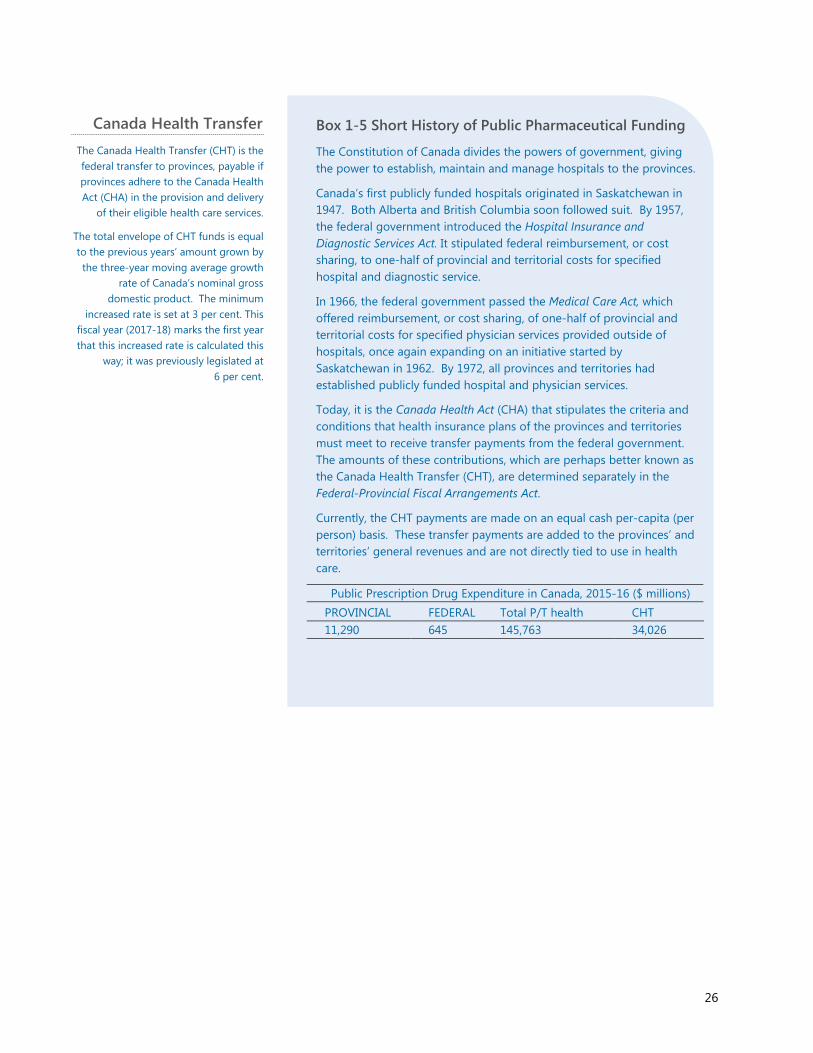
Public Prescription Drug Expenditure in Canada, 2015-16 ($ millions) PROVINCIAL FEDERAL Total P/T health CHT 11,290 645 145,763 34,026
27
Sources: Constitution Act50 Health Canada51 Canada Health Act52 Federal-Provincial Fiscal Arrangements Act 53 CIHI 2016 54 Finance Canada 201755 CLHIA56 Fraser Group/Tristat Resources57 Sanmartin et al.58 CIHI59 Law et al. 60 Hennessy et al.61
Notes: Provincial drug expenditures include any part of the CHT potentially allocated to drug expenditures.
Box 1-5 Short History of Public Pharmaceutical Funding (continued)
Provinces and territories are responsible for the delivery of pharmaceuticals. With respect to drug insurance, government responsibility was not clearly assigned in the Constitution.
Furthermore, insurance for pharmaceuticals (outside of hospitals) is not included in the definition of “insured health services” used in the Canada Health Act. Provinces and territories have generally accepted that responsibility for some populations, typically seniors and low-income individuals or families. The private sector, including social security funds (such as workers’ compensation boards) and private insurance, partially fills the gap.
Despite the existence of both public and private insurance, there remain uninsured and underinsured Canadians. The exact number is unknown, attributable to several factors including the large number of insurance providers, the various levels of benefits and coverage, and the lack of data availability.
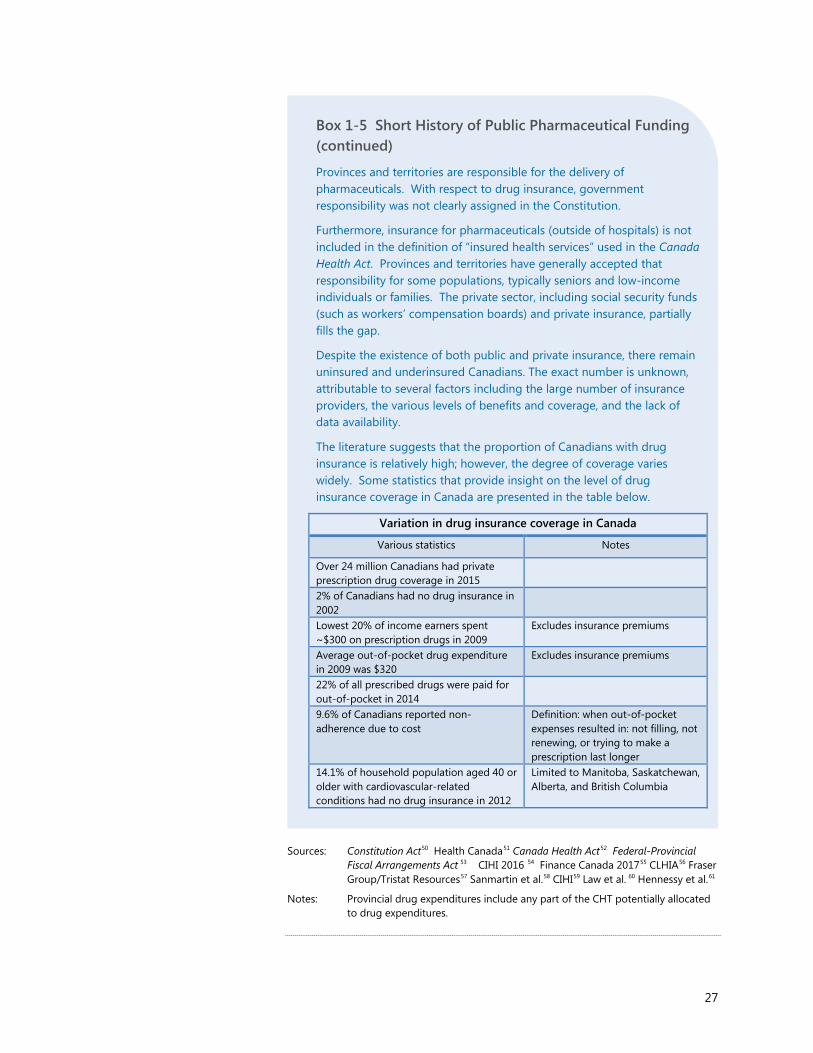
The literature suggests that the proportion of Canadians with drug insurance is relatively high; however, the degree of coverage varies widely. Some statistics that provide insight on the level of drug insurance coverage in Canada are presented in the table below.
Variation in drug insurance coverage in Canada
Various statistics Notes
Over 24 million Canadians had private prescription drug coverage in 2015
2% of Canadians had no drug insurance in 2002
Lowest 20% of income earners spent ~$300 on prescription drugs in 2009
Excludes insurance premiums
Average out-of-pocket drug expenditure in 2009 was $320
Excludes insurance premiums
22% of all prescribed drugs were paid for out-of-pocket in 2014
9.6% of Canadians reported non-adherence due to cost
Definition: when out-of-pocket expenses resulted in: not filling, not renewing, or trying to make a prescription last longer
14.1% of household population aged 40 or older with cardiovascular-related conditions had no drug insurance in 2012
Limited to Manitoba, Saskatchewan, Alberta, and British Columbia
28
1.5. Drug Prices in Canada
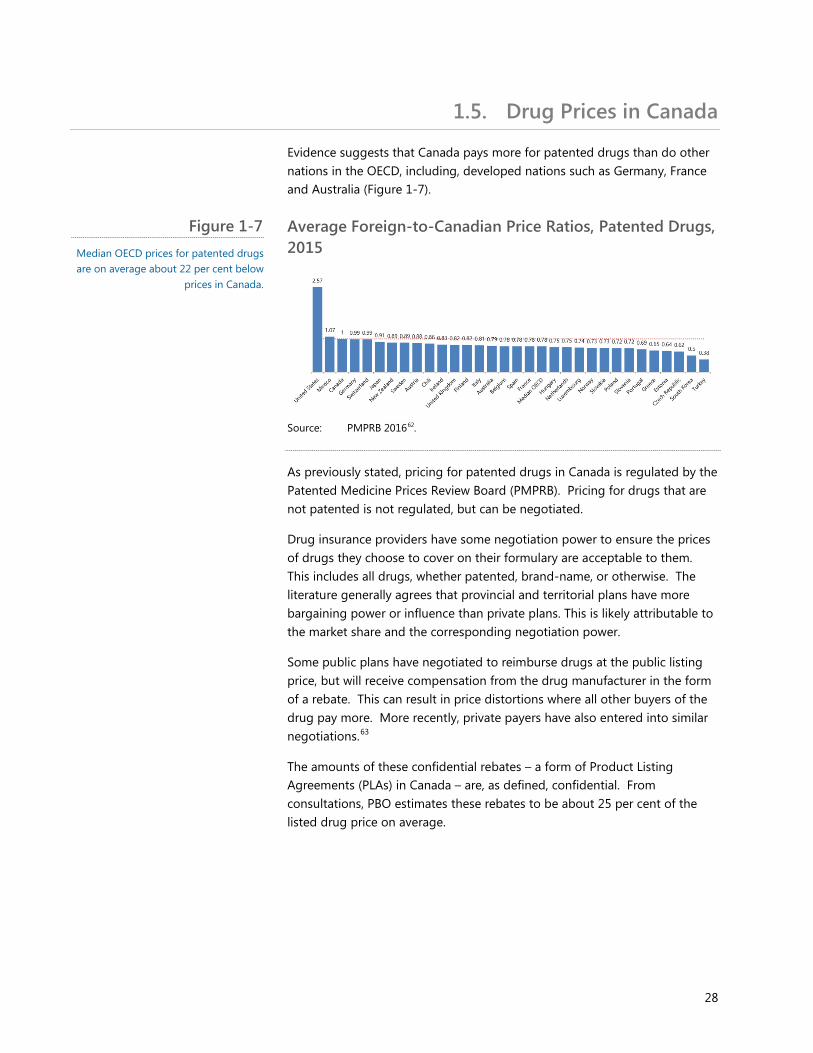
Evidence suggests that Canada pays more for patented drugs than do other nations in the OECD, including, developed nations such as Germany, France and Australia (Figure 1-7).
Average Foreign-to-Canadian Price Ratios, Patented Drugs, 2015
Source: PMPRB 201662.
As previously stated, pricing for patented drugs in Canada is regulated by the Patented Medicine Prices Review Board (PMPRB). Pricing for drugs that are not patented is not regulated, but can be negotiated.
Drug insurance providers have some negotiation power to ensure the prices of drugs they choose to cover on their formulary are acceptable to them. This includes all drugs, whether patented, brand-name, or otherwise. The literature generally agrees that provincial and territorial plans have more bargaining power or influence than private plans. This is likely attributable to the market share and the corresponding negotiation power.
Some public plans have negotiated to reimburse drugs at the public listing price, but will receive compensation from the drug manufacturer in the form of a rebate. This can result in price distortions where all other buyers of the drug pay more. More recently, private payers have also entered into similar negotiations.63
The amounts of these confidential rebates – a form of Product Listing Agreements (PLAs) in Canada – are, as defined, confidential. From consultations, PBO estimates these rebates to be about 25 per cent of the listed drug price on average.
Figure 1-7 Median OECD prices for patented drugs are on average about 22 per cent below
prices in Canada.
29
Box 1-6 Confidential Rebates
Currently, there are two major sources of pharmaceutical confidential rebates operating in Canada: those negotiated by pharmacies and those negotiated by insurance plan providers.
Pharmacies have negotiated with drug manufacturers for confidential rebates. Generic drug manufacturers have competed with one another by offering a confidential rebate to pharmacies in exchange for their product being stocked (and sold) in those pharmacies.
Prior to public plans attempting to reduce these rebates in late 2006, it was estimated these rebates ranged from 40 per cent to 80 per cent for specific generic products. Rebates may have also been used to encourage sales of off-patent (brand-name) drugs.
Pharmacies that are reimbursed the acquisition cost, (plus set markups and professional fees) net a profit equal to the gap between the reimbursed acquisition cost and the actual acquisition cost (net of rebates).
However, several provinces have regulations or policies that stipulate reimbursement shall reflect the net acquisition cost, thus effectively eliminating these profits. Ontario did permit a maximum 20 per cent professional allowance – defined differently than a rebate – as long as pharmacists fund patient-related professional services. However, in 2010 Ontario legislated that no professional allowances would be permitted from either public or private plans. Instead, the dispensing fee was increased.
More recent generic drug reference pricing (setting the price of a generic to a percentage of the brand-name drug) by public drug plans has also squeezed this source of pharmacy profits.
It may have also resulted in creativity in offering benefits to pharmacies from drug manufacturers. The Canadian Revenue Agency (CRA) discovered more than $58 million of unreported rebates and incentives.

30
Sources: Competition Bureau of Canada,64 Grootendorst et al., 65 Ontario Ministry of Health and Long-Term Care, 66 CBC News, 67 Gagnon, 68 CLHIA 69.
Other documented negotiating strategies are listed and described in Appendix G.
Box 1-6 Confidential Rebates (continued)
Evidence suggests that reducing the size of rebates paid to pharmacies has resulted in increased dispensing fees for private plans. One such example occurred in Quebec where the average cost to the Quebec public drug plan decreased 5.5 per cent, while the average drug cost for private drug plans in Quebec increased by 6.4 per cent.
This occurred despite an official decline of generic drug reference pricing from 50 per cent of the patented drug price to 25 per cent.
Public plans, and more recently private plans, also negotiate directly with drug manufacturers to obtain a confidential rebate. These rebates are more commonly known as ‘Product Listing Agreements’ (PLAs).
The pan-Canadian Pharmaceutical Alliance (pCPA) is a joint public-plan initiative to collectively negotiate for lower prices through PLAs. To date, the pCPA has negotiated reduced prices for several brand-name and generic drugs, and is in negotiations for additional products.
The Canadian Life and Health Insurance Association (CLHIA) suggests the savings obtained by the pCPA for specific drugs could represent 20 per cent in savings, on average. Through consultations with stakeholders, PBO decided to set the price discount assumption to 25 per cent.

Federal Cost of a National Pharmacare Program
31
2. Scope of National Pharmacare Plan In September 2016, the House of Commons Standing Committee on Health asked the Parliamentary Budget Officer to estimate the cost of a national Pharmacare program that would provide all Canadians with a common level of drug coverage.
The parameters or framework of the Pharmacare program were provided to PBO by the Committee. Specifically, the new program would:
• Be a universal plan;
• Replace existing public and private drug plans;
• Use the Quebec Medications List as the national formulary;
• Require a $5 co-payment for all prescriptions of brand-name drugs, with exemptions for the following:
o Individuals aged 15 and under;
o Students aged 16-18;
o Individuals aged 65 and over;
o Pregnant women;
o Physically disabled;
o Recipients of Employment Insurance and their dependents; and,
o Recipients of welfare or social assistance and their dependants.
PBO made some additional assumptions. In particular, the scope of the cost estimate is limited to that of the federal government. Estimates do not include the potential additional cost of administration to implement Pharmacare, nor the potential savings to provinces from consolidated administration.
Impacts on hospitals’ drug expenditures, which are technically part of public drug expenditures, are also excluded from analysis. Any costs related to legislation, regulations or negotiations are excluded from the analysis.
Secondly, spill-over effects to related programs, transfers or policies such as any resulting changes to the CHT, or increases or decreases in the costs of other health sectors (for example, a physician’s increased billing for prescriptions) are not included in the cost estimate.
Thirdly, any increase in overall health that results in lower overall healthcare costs is not considered. Lastly, any resulting impacts to any and all stakeholders other than the federal government, including but not limited to,

Federal Cost of a National Pharmacare Program
32
the private insurance industry, the pharmaceutical industry and public programs, are outside the scope of this paper.
The data, and thus the analysis, were limited to the 10 provinces. More detailed information on the data source and limitations can be found in Appendix B.
While not included in this report, the data obtained by PBO and the methodology used permit the use of other formularies for future cost calculations.
Sources: Canadian Institute for Health Information, nhex-Series-C-2016; Express Scripts Canada, Poor Patient Decisions Waste Up To $5.1 Billion Annually, According To Express Scripts Canada.
Box 2-1 Administrative Costs and Standardization
Although the PBO will not be estimating the cost associated with the administration of a national Pharmacare program, the aggregate cost to administer multiple public and private drug insurance plans is likely greater than the administrative cost of a single program or plan.
For example, as a proportion of total costs, in 2014 public sector health expenditures consisted of about 1.7 per cent ($2.6 billion) on administration, while private sector health expenditures consisted of 5.7 per cent ($3.6 billion). Such costs are likely to be reduced with a single national administrator.
Another issue that may be specific to private drug insurance plans is that the administrators and beneficiaries of such plans may not be using the most cost-effective dispensing regime or pharmaceutical. A single national administrator could impose a fixed dispensing regime or restrict drugs on the formulary to those that are the most cost effective.
Federal Cost of a National Pharmacare Program
33
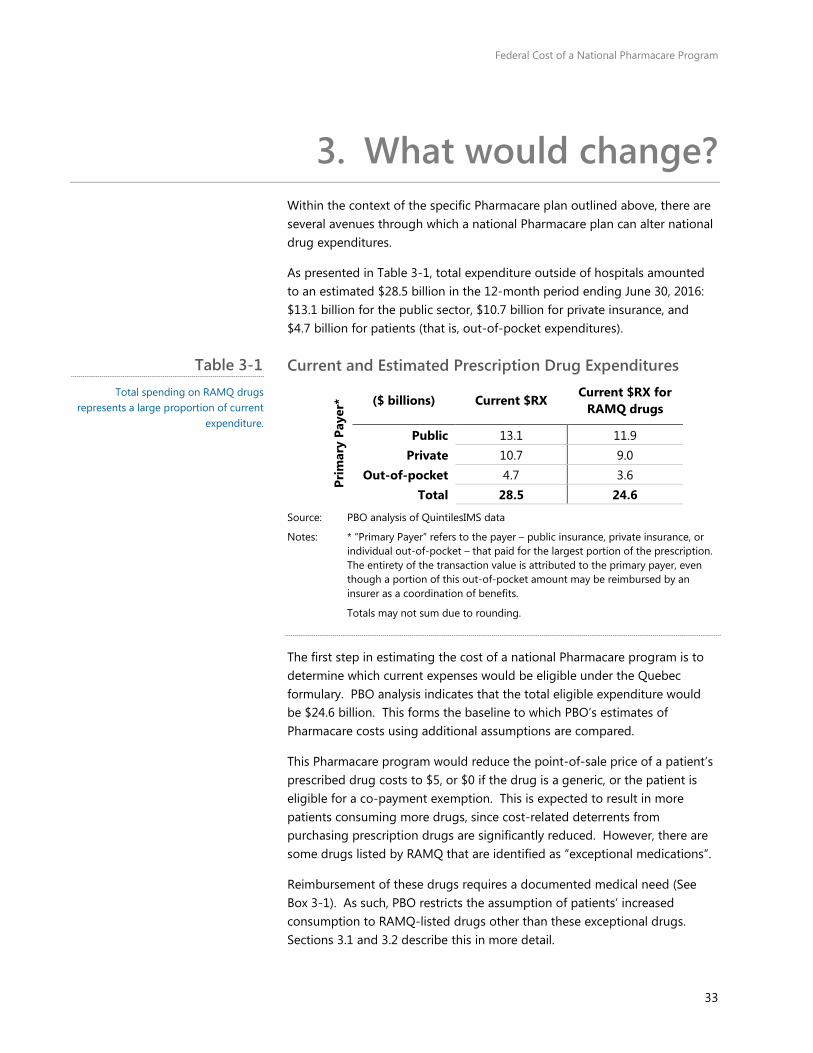
3. What would change? Within the context of the specific Pharmacare plan outlined above, there are several avenues through which a national Pharmacare plan can alter national drug expenditures.
As presented in Table 3-1, total expenditure outside of hospitals amounted to an estimated $28.5 billion in the 12-month period ending June 30, 2016: $13.1 billion for the public sector, $10.7 billion for private insurance, and $4.7 billion for patients (that is, out-of-pocket expenditures).
Current and Estimated Prescription Drug Expenditures
Prim
ary
Paye
r* ($ billions) Current $RX Current $RX for
RAMQ drugs
Public 13.1 11.9 Private 10.7 9.0
Out-of-pocket 4.7 3.6 Total 28.5 24.6
Source: PBO analysis of QuintilesIMS data
Notes: * “Primary Payer” refers to the payer – public insurance, private insurance, or individual out-of-pocket – that paid for the largest portion of the prescription. The entirety of the transaction value is attributed to the primary payer, even though a portion of this out-of-pocket amount may be reimbursed by an insurer as a coordination of benefits.
Totals may not sum due to rounding.
The first step in estimating the cost of a national Pharmacare program is to determine which current expenses would be eligible under the Quebec formulary. PBO analysis indicates that the total eligible expenditure would be $24.6 billion. This forms the baseline to which PBO’s estimates of Pharmacare costs using additional assumptions are compared.
This Pharmacare program would reduce the point-of-sale price of a patient’s prescribed drug costs to $5, or $0 if the drug is a generic, or the patient is eligible for a co-payment exemption. This is expected to result in more patients consuming more drugs, since cost-related deterrents from purchasing prescription drugs are significantly reduced. However, there are some drugs listed by RAMQ that are identified as “exceptional medications”.
Reimbursement of these drugs requires a documented medical need (See Box 3-1). As such, PBO restricts the assumption of patients’ increased consumption to RAMQ-listed drugs other than these exceptional drugs. Sections 3.1 and 3.2 describe this in more detail.
Table 3-1 Total spending on RAMQ drugs
represents a large proportion of current expenditure.
Federal Cost of a National Pharmacare Program
34
Additionally, PBO assumed that the Pharmacare plan would operate much like the existing public plans and, therefore, result in a convergence of consumption behaviour among those with private insurance or no insurance.
In particular, PBO assumed that expanded use of public plans’ usage of mandatory substitution would result in a greater consumption of generics among patients with private insurance or no insurance. This assumption was applied universally across all drugs that had a generic available.
PBO assumes that Pharmacare would negotiate lower drug prices in Canada universally to the current lowest observed price, thus reducing total expenditure. This is consistent with the purchasing power of large public plans.
Finally, through a potentially stronger negotiating position, PBO assumes additional savings in the form of renegotiated drug prices. That is, prices negotiated even lower than the currently observed lowest price. These savings, along with any revenues generated from the co-payment will offset some of the costs of pharmaceutical expenditures in Canada.
The following sections describe each of these in more detail.
Federal Cost of a National Pharmacare Program
35
3.1. Behavioural Impacts
The cost of prescription drugs is the primary factor affecting access among Canadians. As noted in many publications, patients will often report not adhering to the prescribed treatment regime because they cannot afford their prescribed drugs.
Based on data collected from the Canadian Community Health Survey in 2007, Law et. al (2012) found that the prevalence of cost-related non-adherence was between 7 per cent and 17 per cent across Canadian provinces. 70 Unsurprisingly, the lowest reported rates of cost-related non-adherence were in Quebec, which requires all its citizens to purchase some form of prescription drug insurance coverage. 71
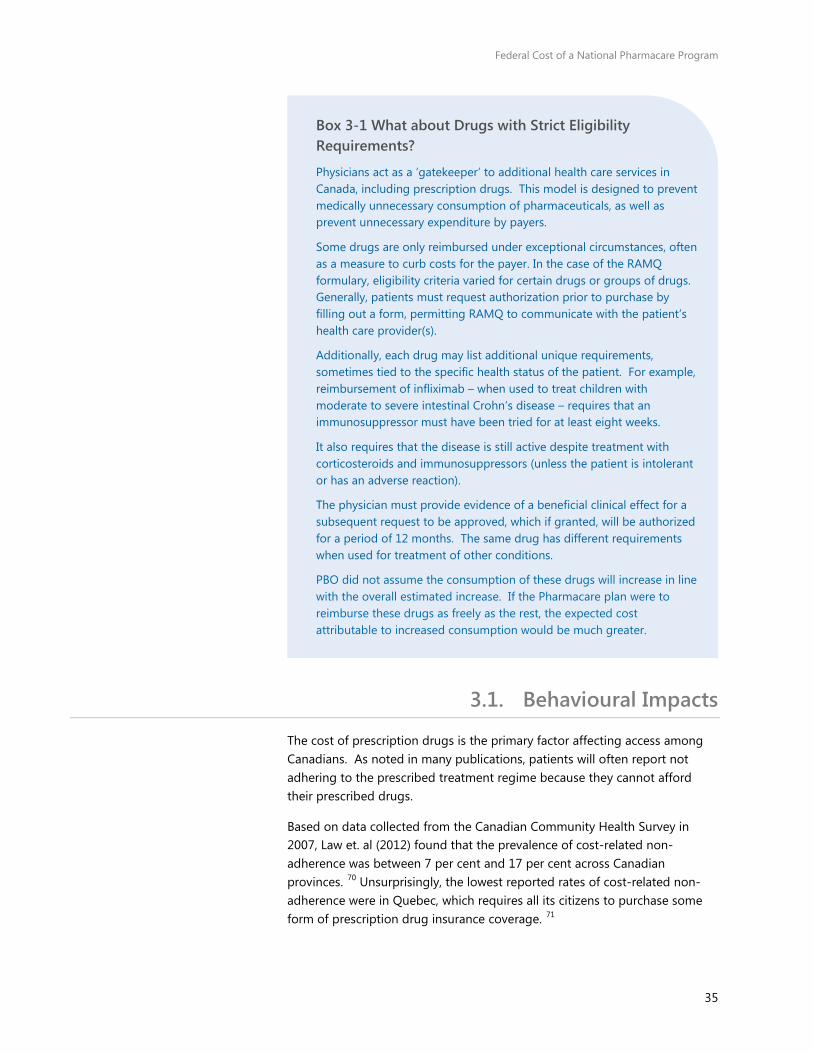
Box 3-1 What about Drugs with Strict Eligibility Requirements?
Physicians act as a ‘gatekeeper’ to additional health care services in Canada, including prescription drugs. This model is designed to prevent medically unnecessary consumption of pharmaceuticals, as well as prevent unnecessary expenditure by payers.
Some drugs are only reimbursed under exceptional circumstances, often as a measure to curb costs for the payer. In the case of the RAMQ formulary, eligibility criteria varied for certain drugs or groups of drugs. Generally, patients must request authorization prior to purchase by filling out a form, permitting RAMQ to communicate with the patient’s health care provider(s).
Additionally, each drug may list additional unique requirements, sometimes tied to the specific health status of the patient. For example, reimbursement of infliximab – when used to treat children with moderate to severe intestinal Crohn’s disease – requires that an immunosuppressor must have been tried for at least eight weeks.
It also requires that the disease is still active despite treatment with corticosteroids and immunosuppressors (unless the patient is intolerant or has an adverse reaction).
The physician must provide evidence of a beneficial clinical effect for a subsequent request to be approved, which if granted, will be authorized for a period of 12 months. The same drug has different requirements when used for treatment of other conditions.
PBO did not assume the consumption of these drugs will increase in line with the overall estimated increase. If the Pharmacare plan were to reimburse these drugs as freely as the rest, the expected cost attributable to increased consumption would be much greater.
Federal Cost of a National Pharmacare Program
36
Cost-related non-adherence is most prevalent among populations without insurance. 72, 73 To a lesser extent, it also affects insured individuals with a high co-pay, deductible or co-insurance rates.
The proposed national Pharmacare program will generally reduce the cost of prescription drugs for Canadians. As such, there will be a consequential behavioural response arising from this improved coverage. Specifically, lower costs borne by patients for prescription drugs will result in greater prescription drug consumption.
What is the cost savings to patients?
PBO begins its estimate by determining how much less patients would have paid for drugs in the 12-month period ending in June 2016, compared to what they actually paid. The dataset from QuintilesIMS indicates that patients spent roughly $4.7 billion out-of-pocket on prescriptions issued from pharmacies in the 12 months ended June 2016.
Of this, the total value associated to drugs that are not exceptional was about $3.5 billion.74 PBO assumes that this amount approximates the total cost incurred by patients for prescription drug expenses other than exceptional drugs.
To estimate the comparable costs that would be incurred under a new national Pharmacare program (that is, total drug expenditures excluding exemptions), PBO first identified that close to 590 million prescriptions were filled during the same 12-month period. Using data from QuintilesIMS, PBO estimates the proportion of prescriptions filled with generic drugs was 68 per cent for all non-exceptional drugs.
While there is a range of prescription rates for generics across Canadian provinces, the mean Canadian value is assumed to be most representative as it reflects existing prescribing practices among doctors and pharmacists.
Roughly 84 million prescriptions would require the $5 payment, for a total out-of-pocket expense of roughly $420 million.
The out-of-pocket expenses for patients under the new national Pharmacare framework would be about 90 per cent lower compared to the existing regime.
PBO applied this calculation separately for prescriptions that are exempt from a $5 co-payment and prescriptions facing the co-payment.
What is the behavioral reaction to lower out-of-pocket expenses?
The economic estimate of the change in consumption of a product in response to a change in its price is referred to as demand price elasticity. A
Federal Cost of a National Pharmacare Program
37
recent estimate of demand price elasticity for prescription drugs in Quebec stems from changes made in 1998 to patient contribution rates for prescriptions. 75 Based on this research, the overall demand price elasticity for prescription drugs in Quebec is estimated to range between -0.11 and 0.16. 76 That means for a 1 per cent increase in the price a patient pays, the amount of prescription drugs consumed would decrease by between 0.11 per cent and 0.16 per cent.
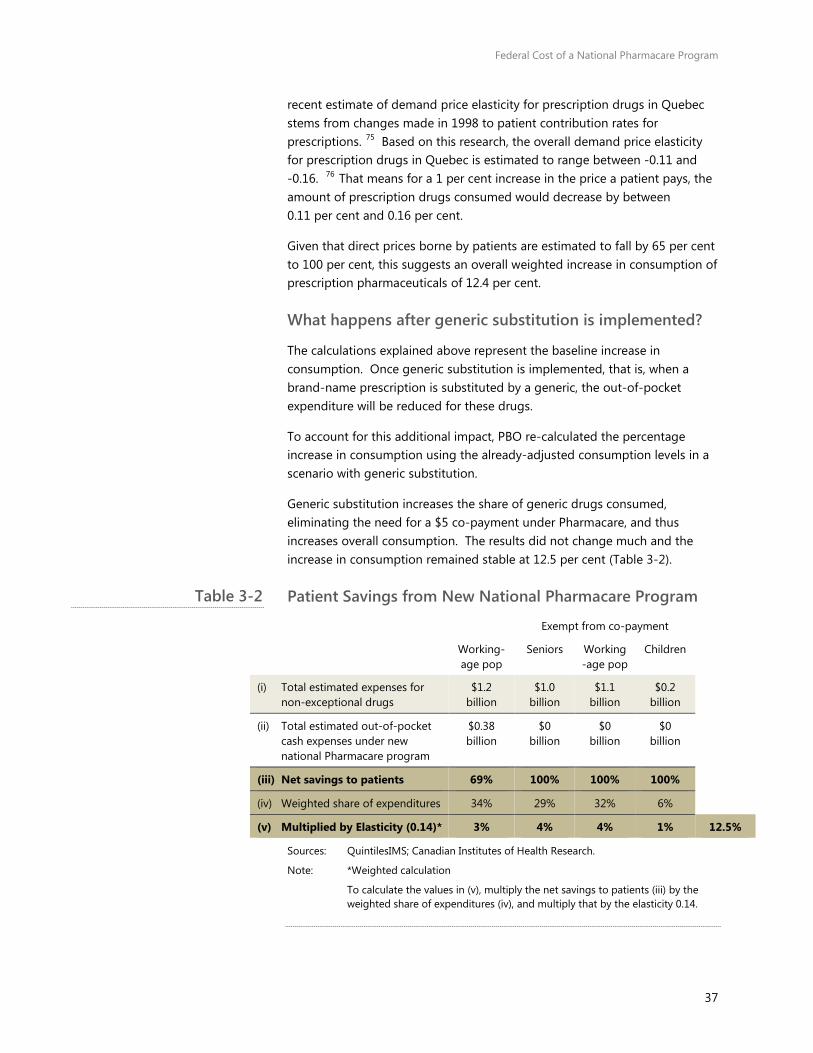
Given that direct prices borne by patients are estimated to fall by 65 per cent to 100 per cent, this suggests an overall weighted increase in consumption of prescription pharmaceuticals of 12.4 per cent.
What happens after generic substitution is implemented?
The calculations explained above represent the baseline increase in consumption. Once generic substitution is implemented, that is, when a brand-name prescription is substituted by a generic, the out-of-pocket expenditure will be reduced for these drugs.
To account for this additional impact, PBO re-calculated the percentage increase in consumption using the already-adjusted consumption levels in a scenario with generic substitution.
Generic substitution increases the share of generic drugs consumed, eliminating the need for a $5 co-payment under Pharmacare, and thus increases overall consumption. The results did not change much and the increase in consumption remained stable at 12.5 per cent (Table 3-2).
Patient Savings from New National Pharmacare Program
Exempt from co-payment
Working-age pop
Seniors Working-age pop
Children
(i) Total estimated expenses for non-exceptional drugs
$1.2 billion
$1.0 billion
$1.1 billion
$0.2 billion
(ii) Total estimated out-of-pocket cash expenses under new national Pharmacare program
$0.38 billion
$0 billion
$0 billion
$0 billion
(iii) Net savings to patients 69% 100% 100% 100%
(iv) Weighted share of expenditures 34% 29% 32% 6%
(v) Multiplied by Elasticity (0.14)* 3% 4% 4% 1% 12.5%
Sources: QuintilesIMS; Canadian Institutes of Health Research.
Note: *Weighted calculation
To calculate the values in (v), multiply the net savings to patients (iii) by the weighted share of expenditures (iv), and multiply that by the elasticity 0.14.
Table 3-2
Federal Cost of a National Pharmacare Program
38
3.2. The Cost of Co-payment Exemptions
A co-payment is a flat fee made by the patient for each prescription filled. It does not vary with the cost of the prescription.
Under the terms of reference for this report, it is assumed that a $5 co-payment would be applied to all prescriptions of brand-name drugs. Generic drugs would be exempt. PBO assumed the $5 co-payment would extend to biologics and prescribed over-the-counter drugs, as well as brand-name drugs. 77
The Standing Committee on Health requested that co-pay exemptions be specified according to the criteria used in the United Kingdom. 78 PBO mapped these with minor modifications to the seven designated groups enumerated in Section 2.
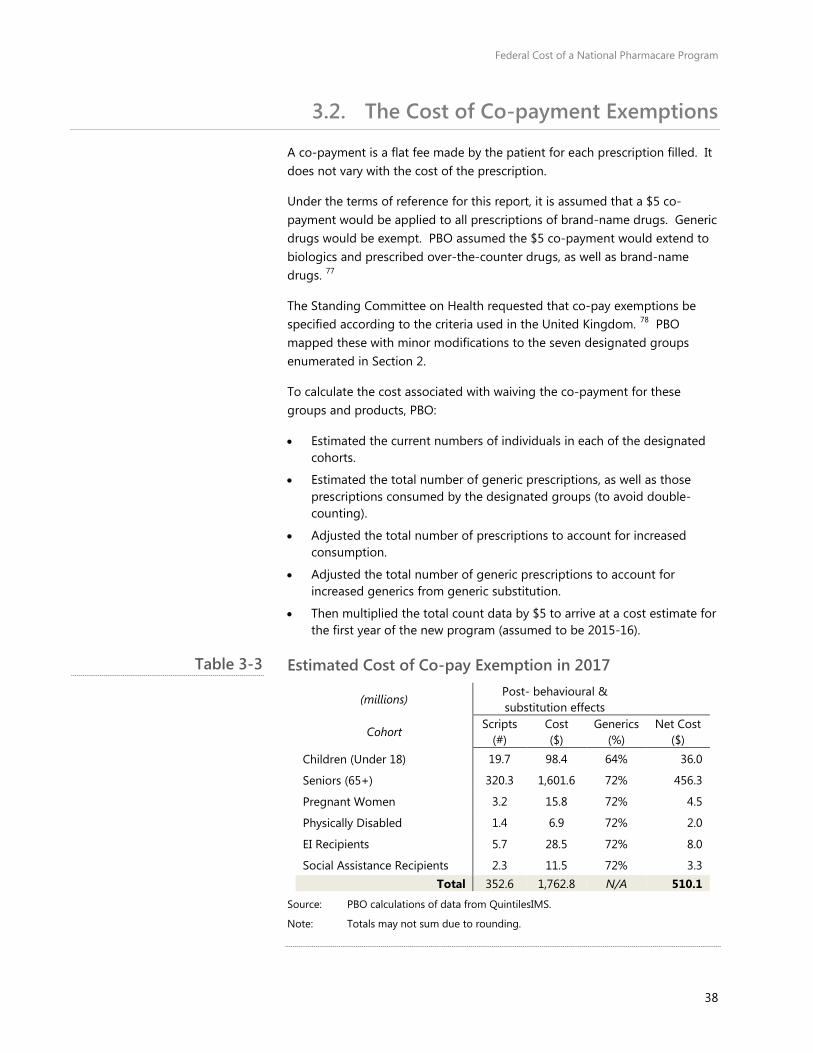
To calculate the cost associated with waiving the co-payment for these groups and products, PBO:
• Estimated the current numbers of individuals in each of the designated cohorts.
• Estimated the total number of generic prescriptions, as well as those prescriptions consumed by the designated groups (to avoid double-counting).
• Adjusted the total number of prescriptions to account for increased consumption.
• Adjusted the total number of generic prescriptions to account for increased generics from generic substitution.
• Then multiplied the total count data by $5 to arrive at a cost estimate for the first year of the new program (assumed to be 2015-16).
Estimated Cost of Co-pay Exemption in 2017
(millions) Post- behavioural & substitution effects
Cohort Scripts
(#) Cost ($)
Generics (%)
Net Cost ($)
Children (Under 18) 19.7 98.4 64% 36.0
Seniors (65+) 320.3 1,601.6 72% 456.3
Pregnant Women 3.2 15.8 72% 4.5
Physically Disabled 1.4 6.9 72% 2.0
EI Recipients 5.7 28.5 72% 8.0
Social Assistance Recipients 2.3 11.5 72% 3.3 Total 352.6 1,762.8 N/A 510.1
Source: PBO calculations of data from QuintilesIMS.
Note: Totals may not sum due to rounding.
Table 3-3
Federal Cost of a National Pharmacare Program
39
As presented in Table 3-3, the overall cost of the co-pay exemption would be about $510.1 million. This is after accounting for the impact of behavioural changes arising from implementation of a national Pharmacare program, which would be expected to increase the consumption of drugs due to a more comprehensive formulary and potentially lower prices.
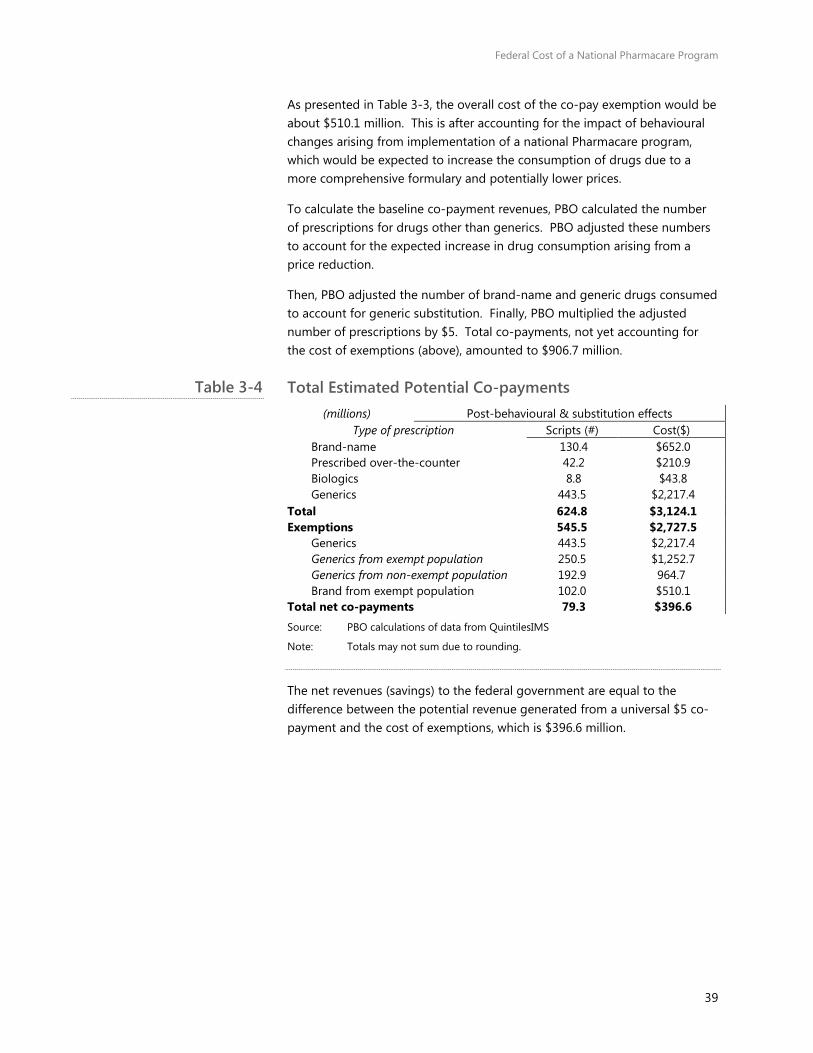
To calculate the baseline co-payment revenues, PBO calculated the number of prescriptions for drugs other than generics. PBO adjusted these numbers to account for the expected increase in drug consumption arising from a price reduction.
Then, PBO adjusted the number of brand-name and generic drugs consumed to account for generic substitution. Finally, PBO multiplied the adjusted number of prescriptions by $5. Total co-payments, not yet accounting for the cost of exemptions (above), amounted to $906.7 million.
Total Estimated Potential Co-payments (millions) Post-behavioural & substitution effects
Type of prescription Scripts (#) Cost($) Brand-name 130.4 $652.0 Prescribed over-the-counter 42.2 $210.9 Biologics 8.8 $43.8 Generics 443.5 $2,217.4
Total 624.8 $3,124.1 Exemptions 545.5 $2,727.5
Generics 443.5 $2,217.4 Generics from exempt population 250.5 $1,252.7 Generics from non-exempt population 192.9 964.7 Brand from exempt population 102.0 $510.1
Total net co-payments 79.3 $396.6
Source: PBO calculations of data from QuintilesIMS
Note: Totals may not sum due to rounding.
The net revenues (savings) to the federal government are equal to the difference between the potential revenue generated from a universal $5 co-payment and the cost of exemptions, which is $396.6 million.
Table 3-4
Federal Cost of a National Pharmacare Program
40
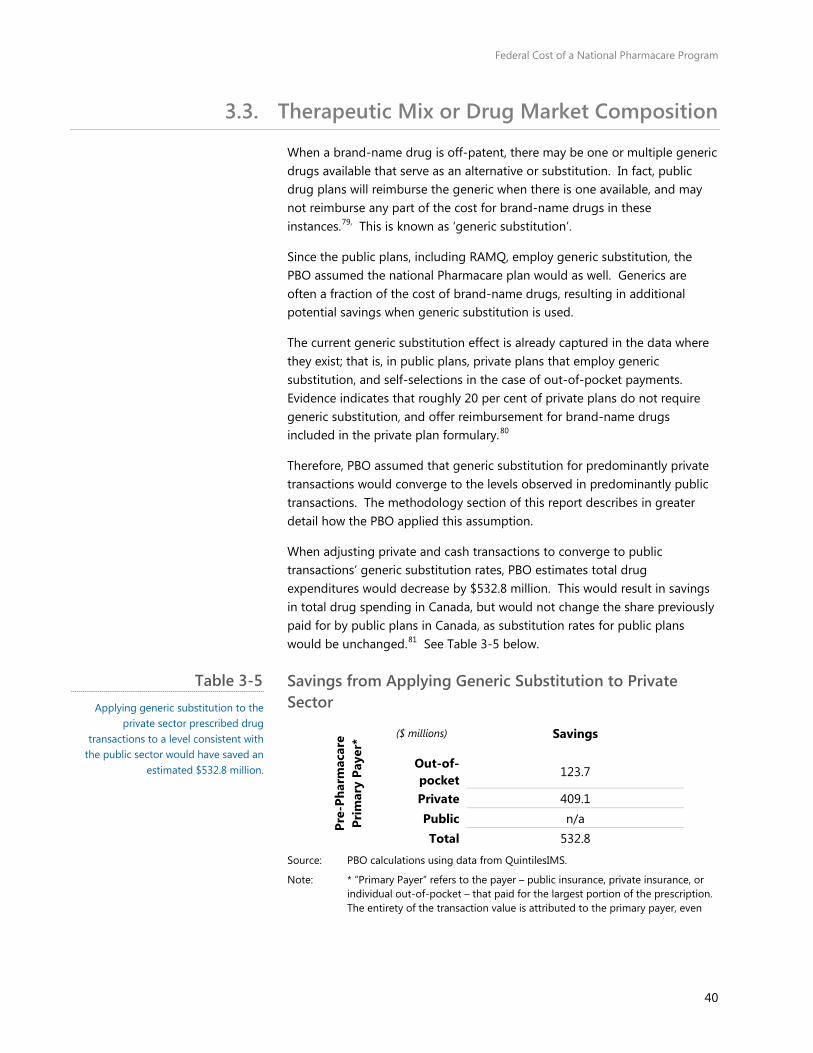
3.3. Therapeutic Mix or Drug Market Composition
When a brand-name drug is off-patent, there may be one or multiple generic drugs available that serve as an alternative or substitution. In fact, public drug plans will reimburse the generic when there is one available, and may not reimburse any part of the cost for brand-name drugs in these instances.79, This is known as ‘generic substitution’.
Since the public plans, including RAMQ, employ generic substitution, the PBO assumed the national Pharmacare plan would as well. Generics are often a fraction of the cost of brand-name drugs, resulting in additional potential savings when generic substitution is used.
The current generic substitution effect is already captured in the data where they exist; that is, in public plans, private plans that employ generic substitution, and self-selections in the case of out-of-pocket payments. Evidence indicates that roughly 20 per cent of private plans do not require generic substitution, and offer reimbursement for brand-name drugs included in the private plan formulary.80
Therefore, PBO assumed that generic substitution for predominantly private transactions would converge to the levels observed in predominantly public transactions. The methodology section of this report describes in greater detail how the PBO applied this assumption.
When adjusting private and cash transactions to converge to public transactions’ generic substitution rates, PBO estimates total drug expenditures would decrease by $532.8 million. This would result in savings in total drug spending in Canada, but would not change the share previously paid for by public plans in Canada, as substitution rates for public plans would be unchanged.81 See Table 3-5 below.
Savings from Applying Generic Substitution to Private Sector
Pre-
Phar
mac
are
Prim
ary
Paye
r* ($ millions) Savings
Out-of-pocket
123.7
Private 409.1 Public n/a Total 532.8
Source: PBO calculations using data from QuintilesIMS.
Note: * “Primary Payer” refers to the payer – public insurance, private insurance, or individual out-of-pocket – that paid for the largest portion of the prescription. The entirety of the transaction value is attributed to the primary payer, even
Table 3-5 Applying generic substitution to the
private sector prescribed drug transactions to a level consistent with
the public sector would have saved an estimated $532.8 million.
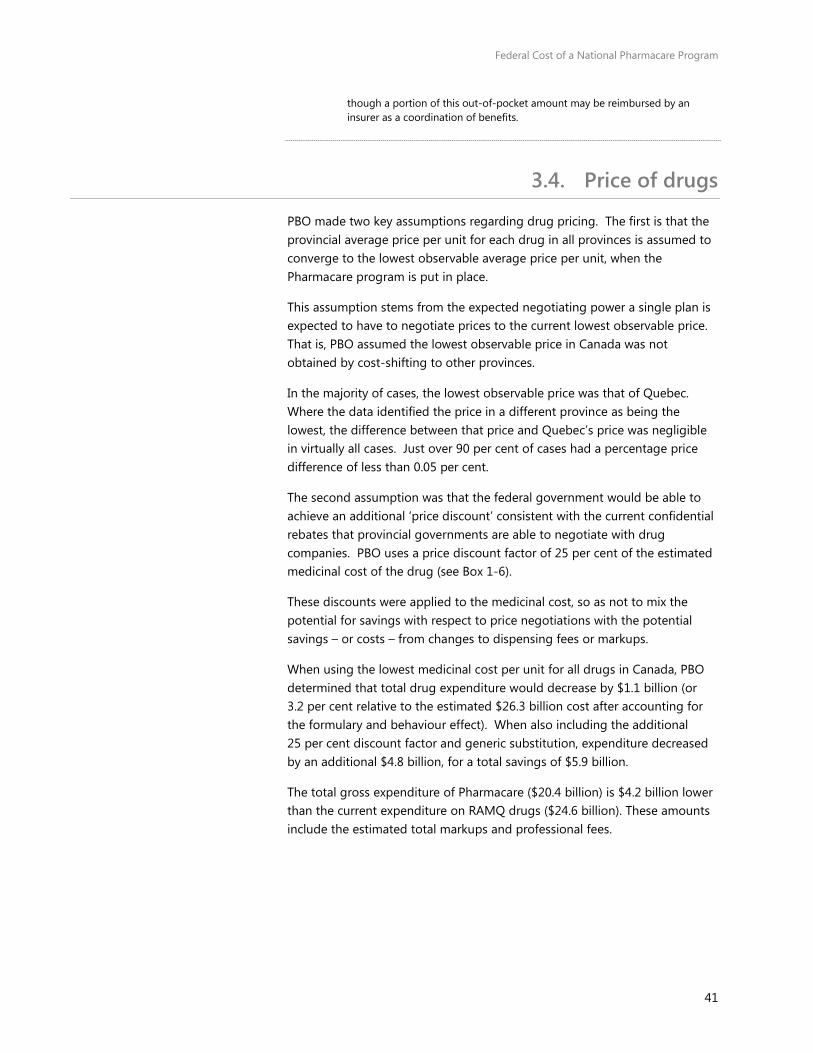
Federal Cost of a National Pharmacare Program
41
though a portion of this out-of-pocket amount may be reimbursed by an insurer as a coordination of benefits.
3.4. Price of drugs
PBO made two key assumptions regarding drug pricing. The first is that the provincial average price per unit for each drug in all provinces is assumed to converge to the lowest observable average price per unit, when the Pharmacare program is put in place.
This assumption stems from the expected negotiating power a single plan is expected to have to negotiate prices to the current lowest observable price. That is, PBO assumed the lowest observable price in Canada was not obtained by cost-shifting to other provinces.
In the majority of cases, the lowest observable price was that of Quebec. Where the data identified the price in a different province as being the lowest, the difference between that price and Quebec’s price was negligible in virtually all cases. Just over 90 per cent of cases had a percentage price difference of less than 0.05 per cent.
The second assumption was that the federal government would be able to achieve an additional ‘price discount’ consistent with the current confidential rebates that provincial governments are able to negotiate with drug companies. PBO uses a price discount factor of 25 per cent of the estimated medicinal cost of the drug (see Box 1-6).
These discounts were applied to the medicinal cost, so as not to mix the potential for savings with respect to price negotiations with the potential savings – or costs – from changes to dispensing fees or markups.
When using the lowest medicinal cost per unit for all drugs in Canada, PBO determined that total drug expenditure would decrease by $1.1 billion (or 3.2 per cent relative to the estimated $26.3 billion cost after accounting for the formulary and behaviour effect). When also including the additional 25 per cent discount factor and generic substitution, expenditure decreased by an additional $4.8 billion, for a total savings of $5.9 billion.
The total gross expenditure of Pharmacare ($20.4 billion) is $4.2 billion lower than the current expenditure on RAMQ drugs ($24.6 billion). These amounts include the estimated total markups and professional fees.

Federal Cost of a National Pharmacare Program
42
Gross Cost of Pharmacare, by Primary Payer Primary Payer*
Current $RX
RAMQ $RX
+ Beh. effect
+lowest ppu**
+Gen Subst.
+25% discount
Out-of-Pocket
$4.7 $3.6 $3.9 $3.8 $3.6 $3.1
Private $10.7 $9.0 $9.6 $9.1 $8.7 $7.2
Public $13.1 $11.9 $12.7 $12.3 $12.3 $10.1
Total $28.5 $24.6 $26.3 $25.2 $24.7 $20.4
Source: PBO Calculations using data from QuintilesIMS
Notes: * ‘Primary Payer’ refers to the payer – public insurance, private insurance, or individual out-of-pocket – that paid for the largest portion of the prescription. The entirety of the transaction value is attributed to the primary payer, even though a portion of this out-of-pocket amount may be reimbursed by an insurer as a coordination of benefits.
**ppu – price per unit.
3.5. Markups and Fees
PBO assumes that dispensing fees and markups would remain unchanged, and would be included in the cost of Pharmacare. To account for the increased consumption of prescribed drugs, PBO calculated an average fee per drug, and adjusted it by the total behavioural increase (12.5 per cent for drugs other than the exceptional drugs; 0 per cent for exceptional drugs).
Total fees (including markups and professional fees) were estimated to be $7.8 billion for all drugs and $6.8 billion for drugs listed on the Quebec RAMQ formulary. After accounting for the assumed proportionate increase in fees due to increased consumption, PBO estimated total fees would have been $7.4 billion if this Pharmacare program had been implemented in the 12-month period preceding June 2016.
This assumption depends greatly on design and implementation. The Pharmacare program may result in re-negotiated markups and fees to an increase, decrease or a net-zero change. An increase may be justified to fully or partially compensate for any negative impacts to pharmacists’ incomes; a decrease to realize additional savings.
3.6. Total Net Federal Cost
After accounting for the formulary, the expected increase in consumption, increased market share of generics, and the potential savings from price negotiation, PBO estimates this Pharmacare program would have cost the federal government $20.4 billion if it had been implemented in 2015-16, or 83 per cent of actual 2015-16 drug expenditure for pharmaceuticals listed on the RAMQ formulary.
Table 3-6 The gross cost of Pharmacare, including
fees and markups, is an estimated $20.4 billion after accounting for pricing,
generic substitution and behavioural effects.
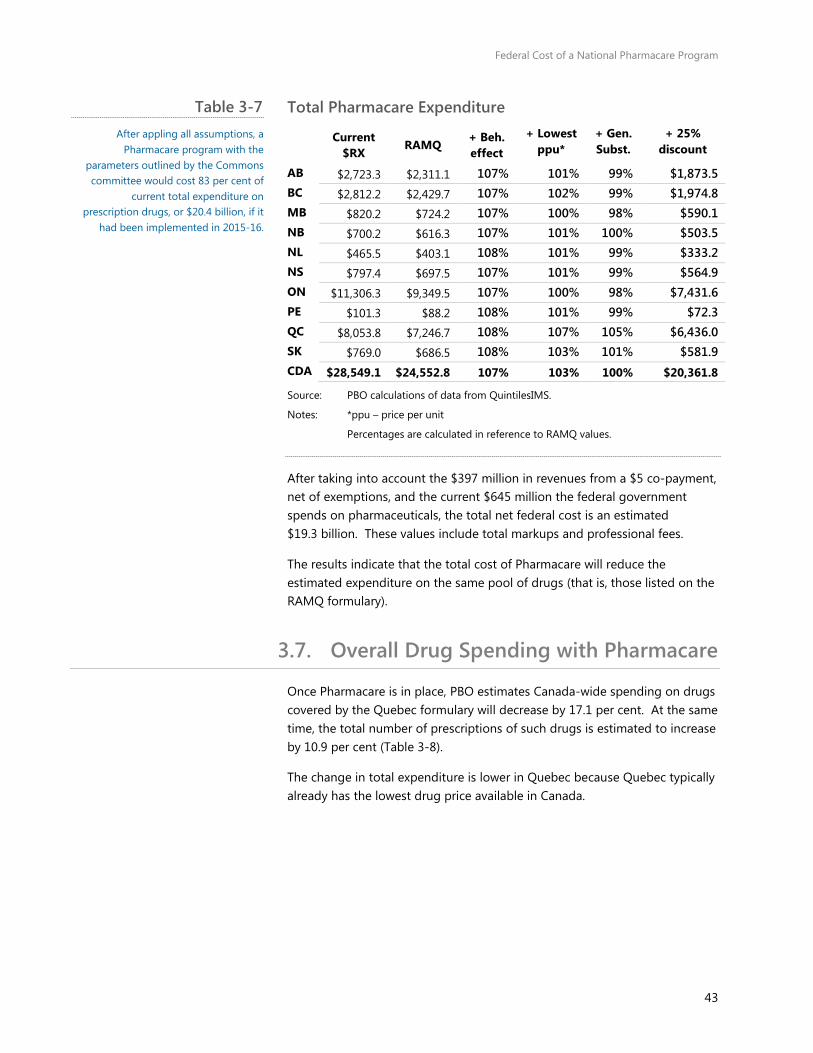
Federal Cost of a National Pharmacare Program
43
Total Pharmacare Expenditure
Current
$RX RAMQ
+ Beh. effect
+ Lowest ppu*
+ Gen. Subst.
+ 25% discount
AB $2,723.3 $2,311.1 107% 101% 99% $1,873.5 BC $2,812.2 $2,429.7 107% 102% 99% $1,974.8 MB $820.2 $724.2 107% 100% 98% $590.1 NB $700.2 $616.3 107% 101% 100% $503.5 NL $465.5 $403.1 108% 101% 99% $333.2 NS $797.4 $697.5 107% 101% 99% $564.9 ON $11,306.3 $9,349.5 107% 100% 98% $7,431.6 PE $101.3 $88.2 108% 101% 99% $72.3 QC $8,053.8 $7,246.7 108% 107% 105% $6,436.0 SK $769.0 $686.5 108% 103% 101% $581.9 CDA $28,549.1 $24,552.8 107% 103% 100% $20,361.8
Source: PBO calculations of data from QuintilesIMS.
Notes: *ppu – price per unit
Percentages are calculated in reference to RAMQ values.
After taking into account the $397 million in revenues from a $5 co-payment, net of exemptions, and the current $645 million the federal government spends on pharmaceuticals, the total net federal cost is an estimated $19.3 billion. These values include total markups and professional fees.
The results indicate that the total cost of Pharmacare will reduce the estimated expenditure on the same pool of drugs (that is, those listed on the RAMQ formulary).
3.7. Overall Drug Spending with Pharmacare
Once Pharmacare is in place, PBO estimates Canada-wide spending on drugs covered by the Quebec formulary will decrease by 17.1 per cent. At the same time, the total number of prescriptions of such drugs is estimated to increase by 10.9 per cent (Table 3-8).
The change in total expenditure is lower in Quebec because Quebec typically already has the lowest drug price available in Canada.
Table 3-7 After appling all assumptions, a
Pharmacare program with the parameters outlined by the Commons committee would cost 83 per cent of
current total expenditure on prescription drugs, or $20.4 billion, if it
had been implemented in 2015-16.

Federal Cost of a National Pharmacare Program
44
Estimated Non-Hospital Drug Spending on RAMQ Formulary Drugs, with Pharmacare, by Province, Canada, 2015-16
Source: PBO analysis of Quntiles IMS data.
The proposed Pharmacare plan also has an impact on the use and spending on various types of drugs differently (Table 3-9). PBO estimates the number of prescriptions for brand-name drugs will decline by 4.8 per cent, while growth for biologics will increase by 5.4 per cent. Generics and over-the-counter drugs will also increase.
Estimated Non-Hospital Drug Spending on RAMQ Formulary Drugs, with Pharmacare, by Drug Type, Canada, 2015-16*
Source: PBO analysis of QuintilesIMS data.
Note: * The table includes a small portion of “overlap” observations that were identified as some combination of brand, generic, biological, or over-the-counter. These observations represent less than 1 per cent of the total. Not all drugs could be identified using this classification. As such, the dollar amounts are slightly underestimated compared to the total displayed in Table 3-8.
# (thousands)
% # (millions) %
BC 49,545 4,948 11.1% 1,975 -455 -18.7%AB 40,536 3,959 10.8% 1,874 -438 -18.9%SK 15,363 1,546 11.2% 582 -105 -15.2%MB 15,886 1,589 11.1% 590 -134 -18.5%ON 188,288 17,862 10.5% 7,432 -1918 -20.5%QC 277,443 27,711 11.1% 6,436 -811 -11.2%NB 11,623 1,166 11.2% 503 -113 -18.3%NS 12,255 1,219 11.0% 565 -133 -19.0%PE 1,876 187 11.1% 72 -16 -18.0%NL 8,597 873 11.3% 333 -70 -17.3%Canada - excl. QC 343,970 33,349 10.7% 13,926 3,380- -19.5%Canada - Total 621,413 61,060 10.9% 20,362 4,191- -17.1%
Change in Total Change in Total
ProvinceTotal
Prescriptions (thousands)
Total Spending
($ millions)
# (thousands)
% # (millions) %
Brand 130,401 6,513- -4.8% 8,683 2,427- -21.8%Generic 443,486 63,698 16.8% 7,640 589- -7.2%Biological 8,757 448 5.4% 3,610 1,163- -24.4%Over-the-Counter 42,431 3,822 9.9% 374 22- -5.6%overlap 3,662 394 12.1% 85 19- -18.4%Total* 621,413 61,060 10.9% 20,221 4,182- -17.1%
ProvinceTotal
Prescriptions (thousands)
Change in Total Total Spending
($ millions)
Change in Total
Table 3-8
Table 3-9
Federal Cost of a National Pharmacare Program
45
4. Projections Using the results and information from PMPRB, PBO projected the federal costs of a Pharmacare program. These projections continue the steady-state assumption, where all savings and additional costs are assumed to occur instantaneously with implementation.
In reality, lower prices and associated behavioural changes would occur as quickly or slowly as the success of price negotiations for all drugs marketed in Canada, as well as the administrative implementation of the program.
4.1. Context
The Patented Medicine Prices Review Board (PMPRB) through the National Prescription Drug Utilization Information System (NPDUIS) initiative has analyzed the factors influencing prescription drug expenditures by publically administered drug plans in certain provinces.82
Using the factors determined by the PMPRB, the fiscal cost of a national Pharmacare program after the first year of implementation would be influenced by the following factors or cost drivers:
• the volume of drugs used
• the prescription price of drugs
• population growth
• dispensing fees and markups83
The methodology and analysis, as well as the combined effects of all four factors are explained in Appendix F.
The baseline cost of drugs includes the Canada-wide utilization of the RAMQ formulary drugs for the June 2015 to July 2016 period with generic substitution and behaviour effects included.
Regarding the prescription price, certain speciality drugs, such as direct-acting antivirals (DAA) and biologics were excluded from the baseline and separate growth criteria were applied to the total dollar amounts (net of dispensing fees and markups).84
PBO also projected the net co-payment revenues and the federal direct spending on drugs, subtracting these values from the projected costs of Pharmacare to provide a net cost projection.
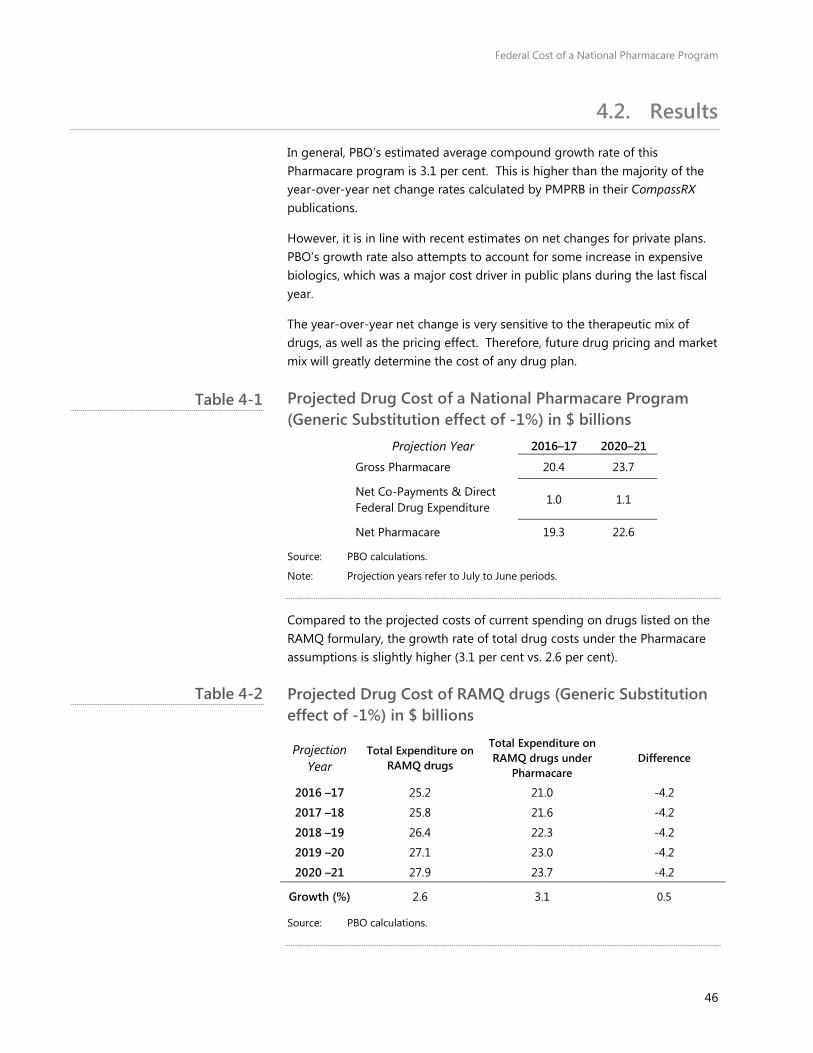
Federal Cost of a National Pharmacare Program
46
4.2. Results
In general, PBO’s estimated average compound growth rate of this Pharmacare program is 3.1 per cent. This is higher than the majority of the year-over-year net change rates calculated by PMPRB in their CompassRX publications.
However, it is in line with recent estimates on net changes for private plans. PBO’s growth rate also attempts to account for some increase in expensive biologics, which was a major cost driver in public plans during the last fiscal year.
The year-over-year net change is very sensitive to the therapeutic mix of drugs, as well as the pricing effect. Therefore, future drug pricing and market mix will greatly determine the cost of any drug plan.
Projected Drug Cost of a National Pharmacare Program (Generic Substitution effect of -1%) in $ billions
Projection Year 2016–17 2020–21
Gross Pharmacare 20.4 23.7
Net Co-Payments & Direct Federal Drug Expenditure
1.0 1.1
Net Pharmacare 19.3 22.6
Source: PBO calculations.
Note: Projection years refer to July to June periods.
Compared to the projected costs of current spending on drugs listed on the RAMQ formulary, the growth rate of total drug costs under the Pharmacare assumptions is slightly higher (3.1 per cent vs. 2.6 per cent).
Projected Drug Cost of RAMQ drugs (Generic Substitution effect of -1%) in $ billions
Projection Year
Total Expenditure on RAMQ drugs
Total Expenditure on RAMQ drugs under
Pharmacare Difference
2016 –17 25.2 21.0 -4.2
2017 –18 25.8 21.6 -4.2
2018 –19 26.4 22.3 -4.2
2019 –20 27.1 23.0 -4.2
2020 –21 27.9 23.7 -4.2
Growth (%) 2.6 3.1 0.5
Source: PBO calculations.
Table 4-1
Table 4-2
Federal Cost of a National Pharmacare Program
47
This is mostly attributable to the size of the total professional fees and markups. Under the proposed national Pharmacare program, the total consumption of drugs and, therefore, associated fees, are expected to be much higher than the fees and markups associated with current consumption of RAMQ drugs ($7.4 billion compared to $6.8 billion). As a result, the total envelope of funds is larger, creating a slightly higher growth rate.

Federal Cost of a National Pharmacare Program
48
Sensitivity Analysis Appendix A:PBO conducted a sensitivity analysis on the total cost of the Pharmacare program using different provincial formularies. As noted earlier, the list of inclusive drugs – the formulary – can and does vary across plans.
Given that Quebec’s drug plan is considered as the most generous of public drug plans, PBO performed the same calculations using drugs where the majority payer was identified as ‘public’ in Prince Edward Island in the QuintilesIMS data.
All other assumptions were held constant, including the behavioural effect. While it is likely consumption would not increase as high as in the baseline scenario, this offers a cost estimate using an isolated change. The $3.2-billion decrease compared to the baseline results using the RAMQ formulary indicates that this assumption can significantly increase or decrease the costs of a drug plan.
Total Pharmacare Expenditure using Drugs Listed on PEI’s Formulary
Current $RX
PEI + Beh. effect
+ Lowest
ppu
+ 25% discount
+ Gen. Subst.
AB $2,723.3 $2,155.5 108% 102% 100% $1,769.5
BC $2,812.2 $2,066.7 108% 102% 99% $1,696.5
MB $820.2 $646.5 108% 100% 99% $531.3
NB $700.2 $583.2 108% 102% 100% $481.6
NL $465.5 $399.1 109% 102% 100% $333.8
NS $797.4 $672.8 108% 101% 99% $547.8
ON $11,306.3 $8,301.1 107% 101% 99% $6,724.2
PE $101.3 $95.5 108% 102% 100% $79.0
QC $8,053.8 $5,137.2 107% 107% 105% $4,483.8
SK $769.0 $625.2 108% 103% 102% $534.7
CDA $28,549.07 $20,682.86 108% 103% 101% $17,182.14
Source: PBO calculations of data from QuintilesIMS
Note: percentages are calculated in reference to the PEI values
To estimate the sensitivity of PBO’s cost estimates to the application of the average generic drug price for use in generic substitution, PBO also calculated a cost estimate using the lowest generic price rather than the lowest average generic price among provinces. This had a negligible impact on the cost estimate.
Table A-1 The list of inclusive drugs (formulary)
can have a significant effect on the cost of a Pharmacare program.
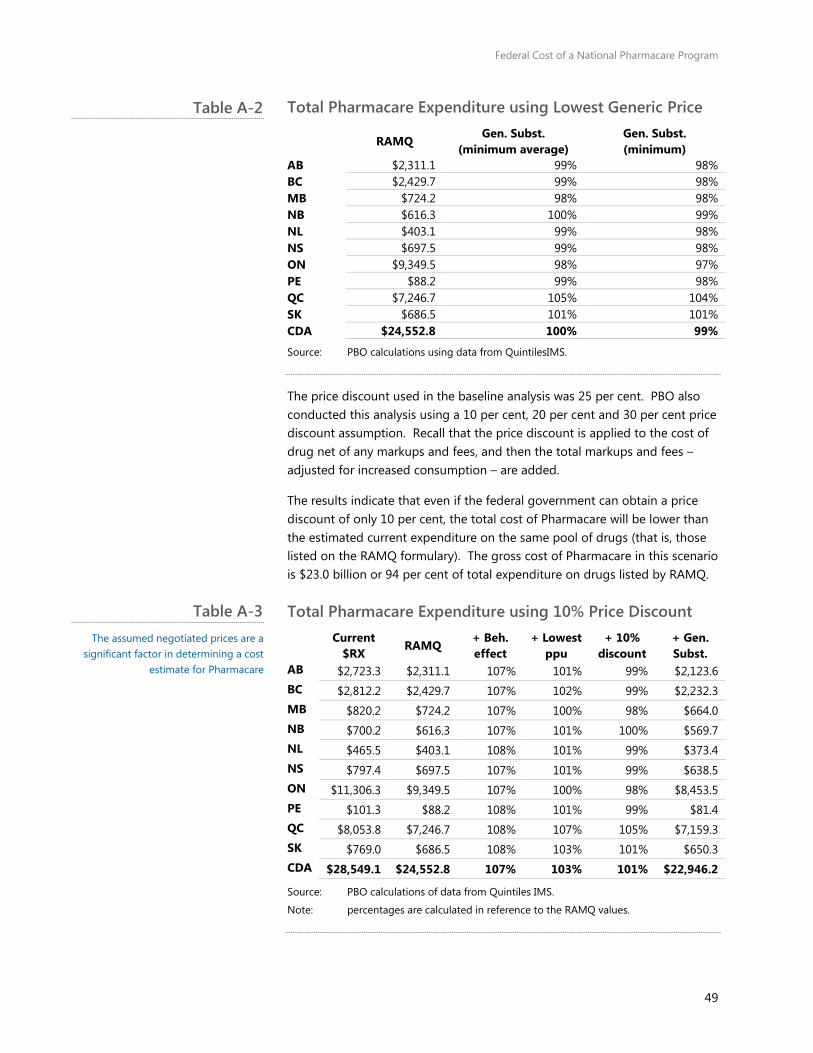
Federal Cost of a National Pharmacare Program
49
Total Pharmacare Expenditure using Lowest Generic Price
RAMQ Gen. Subst.
(minimum average) Gen. Subst. (minimum)
AB $2,311.1 99% 98% BC $2,429.7 99% 98% MB $724.2 98% 98% NB $616.3 100% 99% NL $403.1 99% 98% NS $697.5 99% 98% ON $9,349.5 98% 97% PE $88.2 99% 98% QC $7,246.7 105% 104% SK $686.5 101% 101% CDA $24,552.8 100% 99%
Source: PBO calculations using data from QuintilesIMS.
The price discount used in the baseline analysis was 25 per cent. PBO also conducted this analysis using a 10 per cent, 20 per cent and 30 per cent price discount assumption. Recall that the price discount is applied to the cost of drug net of any markups and fees, and then the total markups and fees – adjusted for increased consumption – are added.
The results indicate that even if the federal government can obtain a price discount of only 10 per cent, the total cost of Pharmacare will be lower than the estimated current expenditure on the same pool of drugs (that is, those listed on the RAMQ formulary). The gross cost of Pharmacare in this scenario is $23.0 billion or 94 per cent of total expenditure on drugs listed by RAMQ.
Total Pharmacare Expenditure using 10% Price Discount
Current
$RX RAMQ
+ Beh. effect
+ Lowest ppu
+ 10% discount
+ Gen. Subst.
AB $2,723.3 $2,311.1 107% 101% 99% $2,123.6 BC $2,812.2 $2,429.7 107% 102% 99% $2,232.3 MB $820.2 $724.2 107% 100% 98% $664.0 NB $700.2 $616.3 107% 101% 100% $569.7 NL $465.5 $403.1 108% 101% 99% $373.4 NS $797.4 $697.5 107% 101% 99% $638.5 ON $11,306.3 $9,349.5 107% 100% 98% $8,453.5 PE $101.3 $88.2 108% 101% 99% $81.4 QC $8,053.8 $7,246.7 108% 107% 105% $7,159.3 SK $769.0 $686.5 108% 103% 101% $650.3 CDA $28,549.1 $24,552.8 107% 103% 101% $22,946.2
Source: PBO calculations of data from Quintiles IMS.
Note: percentages are calculated in reference to the RAMQ values.
Table A-2
Table A-3 The assumed negotiated prices are a
significant factor in determining a cost estimate for Pharmacare
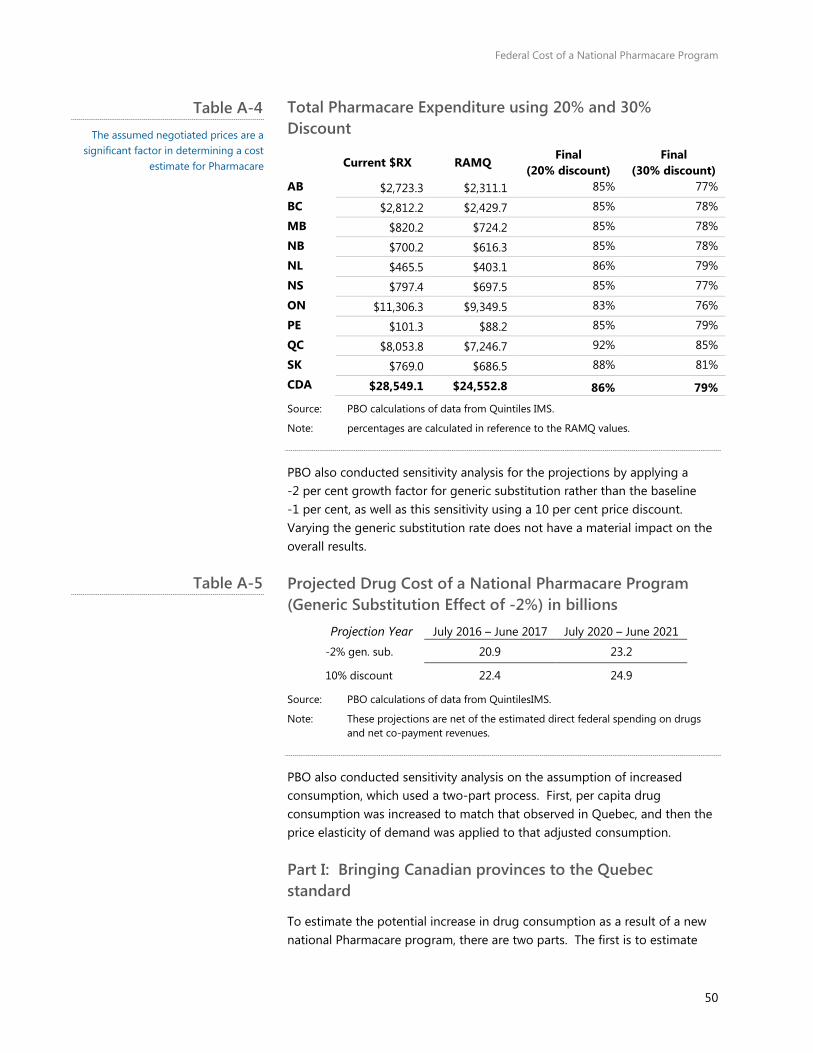
Federal Cost of a National Pharmacare Program
50
Total Pharmacare Expenditure using 20% and 30% Discount
Current $RX RAMQ Final
(20% discount) Final
(30% discount) AB $2,723.3 $2,311.1 85% 77%
BC $2,812.2 $2,429.7 85% 78%
MB $820.2 $724.2 85% 78%
NB $700.2 $616.3 85% 78%
NL $465.5 $403.1 86% 79%
NS $797.4 $697.5 85% 77%
ON $11,306.3 $9,349.5 83% 76%
PE $101.3 $88.2 85% 79%
QC $8,053.8 $7,246.7 92% 85%
SK $769.0 $686.5 88% 81%
CDA $28,549.1 $24,552.8 86% 79%
Source: PBO calculations of data from Quintiles IMS.
Note: percentages are calculated in reference to the RAMQ values.
PBO also conducted sensitivity analysis for the projections by applying a 2 per cent growth factor for generic substitution rather than the baseline 1 per cent, as well as this sensitivity using a 10 per cent price discount. Varying the generic substitution rate does not have a material impact on the overall results.
Projected Drug Cost of a National Pharmacare Program (Generic Substitution Effect of -2%) in billions
Projection Year July 2016 – June 2017 July 2020 – June 2021 -2% gen. sub. 20.9 23.2
10% discount 22.4 24.9
Source: PBO calculations of data from QuintilesIMS.
Note: These projections are net of the estimated direct federal spending on drugs and net co-payment revenues.
PBO also conducted sensitivity analysis on the assumption of increased consumption, which used a two-part process. First, per capita drug consumption was increased to match that observed in Quebec, and then the price elasticity of demand was applied to that adjusted consumption.
Part I: Bringing Canadian provinces to the Quebec standard
To estimate the potential increase in drug consumption as a result of a new national Pharmacare program, there are two parts. The first is to estimate
Table A-4 The assumed negotiated prices are a
significant factor in determining a cost estimate for Pharmacare
Table A-5
Federal Cost of a National Pharmacare Program
51
prescription drug consumption patterns in all Canadian provinces (except Quebec), if a similar comprehensive insurance program was to be offered. In an attempt to perhaps better isolate the effect attributable to differences in insurance, the PBO limited this application to the working-age population.
Based on PBO analysis of data provided by QuintilesIMS, in the 12-month period ended June 2016, the amount of prescription drugs consumed (measured as units) by Quebec working-age residents was significantly higher across all age cohorts (9 per cent to 15 per cent).85
Higher per-capita age adjusted consumption could be due to various factors, including the health conditions of Quebec patients, as well as prescribing attitudes among Quebec doctors and pharmacists. However, PBO assumes that most of this differential is attributable to the unique presence of mandatory comprehensive drug insurance coverage, which is absent in other provinces.86
Adjusting the average unit consumption of drugs among the provinces, except Quebec, to the Quebec consumption rates, results in an age-weighted per-capita consumption increase of roughly 15 per cent. That is, if working-age Canadians in the nine provinces without mandatory prescription drug insurance coverage consumed drugs at the same rate as Quebec, overall consumption would be 15 per cent higher. 87
Part II: Bringing all Canadian provinces from Quebec standard to new national Pharmacare standard
The second step in estimating change in prescription drug consumption among Canadians under the new national Pharmacare framework is to determine the impact of the more generous federal plan compared to the current Quebec regime.
As noted earlier, the new national Pharmacare framework will, in general, be more generous to patients compared to the existing Quebec regime for several reasons. First, the costs borne by patients would be capped at a maximum of $5 for each prescription. As well, there would also be several categories of designated individuals who are not required to pay prescription fees (for example, seniors and pregnant women).
Finally, there would be no fees for generic drugs. As noted earlier, PBO assumes that the new national Pharmacare program would operate in the same manner as several existing provincial public plans and reimburse all dispensing fees and markups. As such, the behavioral impact of lower costs for patients would be expected to engender greater consumption of prescription drug among Canadians.
Federal Cost of a National Pharmacare Program
52
What is the cost savings to patients?
PBO begins its estimate by determining how much less Quebec patients would have paid for drugs in the 12-month period ending in June 2016, compared to what they actually paid. The dataset from QuintilesIMS indicates that Quebec residents spent roughly $5.7 billion on prescriptions – other than exceptional drugs – issued from pharmacies in the 12 months ended June 2016.
Of this, the total value of transactions for non-exceptional drugs where the majority of the total cost was paid for out-of-pocket was about $1.1 billion. PBO assumes that this amount approximates the total cost incurred by patients for prescription drug expenses.
To estimate the comparable costs that would be incurred under the new national Pharmacare program (that is, total drug expenditures excluding exemptions), PBO first identified that close to 280 million prescriptions were filled in Quebec during the same 12-month period. The share of prescriptions filled with generic drugs was an estimated 60 per cent.
In addition, PBO also calculated the incidence of cohort-based exemptions at 238 million. The remaining 33 million prescriptions among those not eligible for a co-payment exemption would require the $5 payment, for a total out-of-pocket expense of roughly $167 million.
The out-of-pocket expenses for residents of Quebec under the new national Pharmacare framework would be about 85 per cent lower compared to the existing regime.
What is the behavioural reaction to lower out-of-pocket expenses?
Given that direct costs borne by patients are estimated to fall by 85 per cent, and given an estimated elasticity of 0.14, this suggests an overall increase in consumption of prescription pharmaceuticals of about 10 per cent.
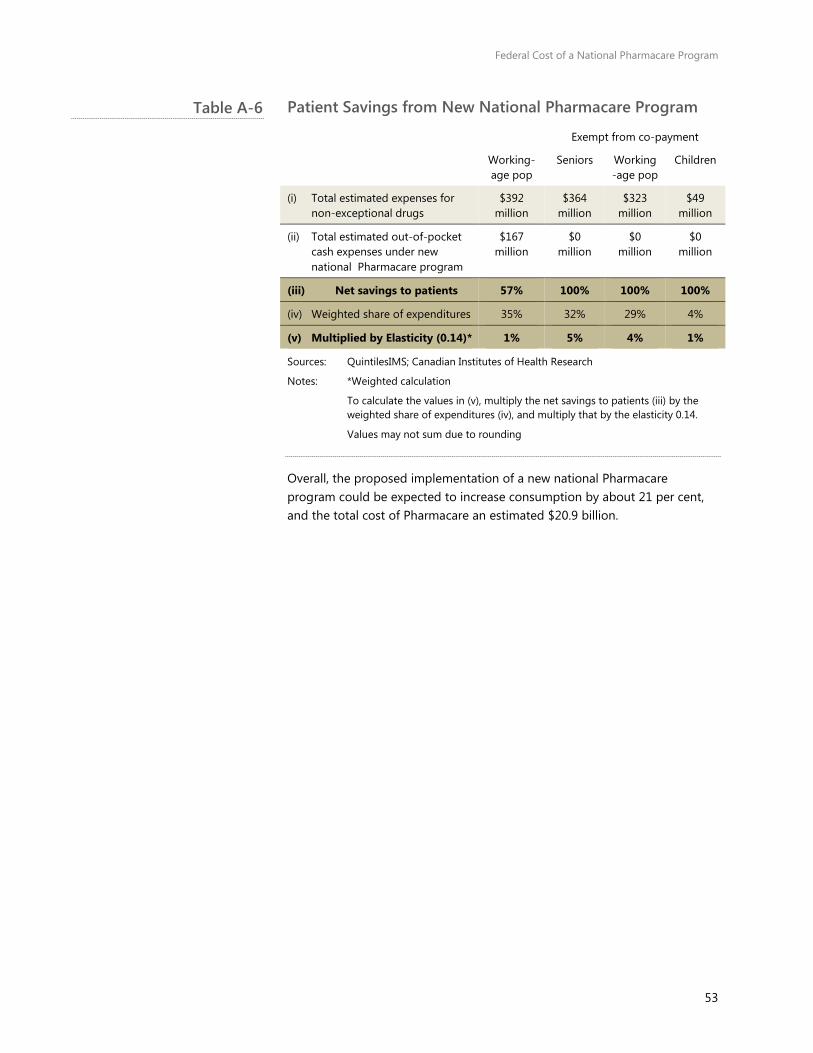
Federal Cost of a National Pharmacare Program
53
Patient Savings from New National Pharmacare Program
Exempt from co-payment
Working-age pop
Seniors Working-age pop
Children
(i) Total estimated expenses for non-exceptional drugs
$392 million
$364 million
$323 million
$49 million
(ii) Total estimated out-of-pocket cash expenses under new national Pharmacare program
$167 million
$0 million
$0 million
$0 million
(iii) Net savings to patients 57% 100% 100% 100%
(iv) Weighted share of expenditures 35% 32% 29% 4%
(v) Multiplied by Elasticity (0.14)* 1% 5% 4% 1%
Sources: QuintilesIMS; Canadian Institutes of Health Research
Notes: *Weighted calculation
To calculate the values in (v), multiply the net savings to patients (iii) by the weighted share of expenditures (iv), and multiply that by the elasticity 0.14.
Values may not sum due to rounding
Overall, the proposed implementation of a new national Pharmacare program could be expected to increase consumption by about 21 per cent, and the total cost of Pharmacare an estimated $20.9 billion.
Table A-6
Federal Cost of a National Pharmacare Program
54
Data Appendix B:The PBO primarily used data from QuintilesIMS Health (IMS), and the Canadian Institute for Health Information (CIHI). Both datasets covered the period of July 2015 to June 2016, the latest available at the time of request.
The primary source of the QuintilesIMS data is transactions from a large sample of pharmacies in all provinces. Additional data are incorporated from various sources. The data are adjusted by QuintilesIMS to account for the sample size, resulting in a provincially and nationally representative value.
One of the three databases obtained from QuintilesIMS was provided on a sufficiently-disaggregated level to permit analysis on the number and expenditure of drugs for select age groups by gender, payer and province.
In this database, expenditure refers to the cost as determined by the average provincial manufacturer price. That is, it excludes markups and fees and does not reflect that total cost paid at the pharmacy. PBO used these expenditures as a measure for the cost of the medicine.
The second database obtained from QuntilesIMS was much more aggregated, providing the total consumption and expenditure of drugs by province. PBO describes how these two databases were used for the costing of a Pharmacare program in Appendices C through E.
The third database obtained from QuintilesIMS provided projected patient counts at the Anatomic Therapeutic Classification 3 (ATC-3) level, allowing the PBO to create average cost per patient estimates for each ATC-3 level.88 Table 1-9 presents select results in Section 1.4.
The data from CIHI were limited to public plans, but also provided metrics on the number and expenditure of drugs disaggregated by province, select age groups and gender. All public plans included in the CIHI database that operate within a province were rolled into the provincial tabulations.
Expenditure in this database was more comprehensive and included the cost of the medicines, dispensing fees, markups (where available to CIHI), total cost, as well as the total cost that was reimbursed by the public plan.
Payer, in the QuintilesIMS data, is defined as the ‘majority payer’. For example, a private payer transaction refers to drug transactions in pharmacies where the majority of the cost was paid for by a private insurer.
This is an important feature of the data. It implies the total drug expenditures associated to “cash” payers underestimates total out-of-pocket expenditures in Canada. This is because some of the cost of publicly-insured
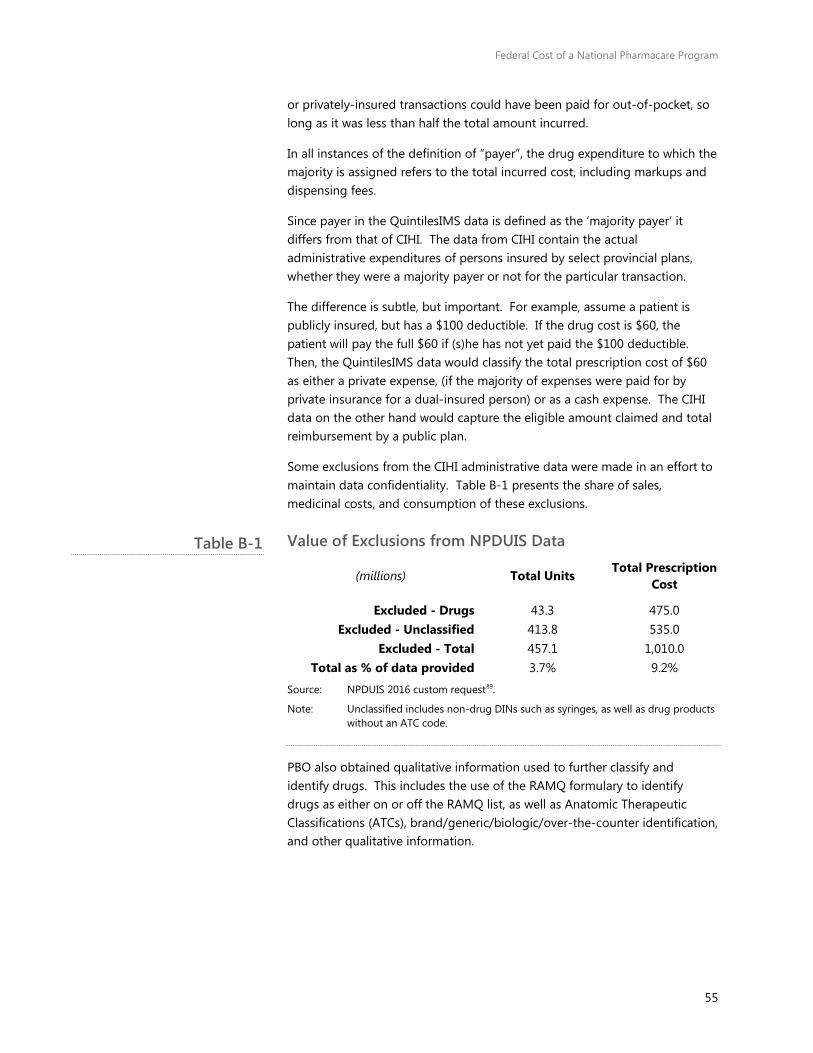
Federal Cost of a National Pharmacare Program
55
or privately-insured transactions could have been paid for out-of-pocket, so long as it was less than half the total amount incurred.
In all instances of the definition of “payer”, the drug expenditure to which the majority is assigned refers to the total incurred cost, including markups and dispensing fees.
Since payer in the QuintilesIMS data is defined as the ‘majority payer’ it differs from that of CIHI. The data from CIHI contain the actual administrative expenditures of persons insured by select provincial plans, whether they were a majority payer or not for the particular transaction.
The difference is subtle, but important. For example, assume a patient is publicly insured, but has a $100 deductible. If the drug cost is $60, the patient will pay the full $60 if (s)he has not yet paid the $100 deductible. Then, the QuintilesIMS data would classify the total prescription cost of $60 as either a private expense, (if the majority of expenses were paid for by private insurance for a dual-insured person) or as a cash expense. The CIHI data on the other hand would capture the eligible amount claimed and total reimbursement by a public plan.
Some exclusions from the CIHI administrative data were made in an effort to maintain data confidentiality. Table B-1 presents the share of sales, medicinal costs, and consumption of these exclusions.
Value of Exclusions from NPDUIS Data
(millions) Total Units Total Prescription Cost
Excluded - Drugs 43.3 475.0 Excluded - Unclassified 413.8 535.0
Excluded - Total 457.1 1,010.0 Total as % of data provided 3.7% 9.2%
Source: NPDUIS 2016 custom request89.
Note: Unclassified includes non-drug DINs such as syringes, as well as drug products without an ATC code.
PBO also obtained qualitative information used to further classify and identify drugs. This includes the use of the RAMQ formulary to identify drugs as either on or off the RAMQ list, as well as Anatomic Therapeutic Classifications (ATCs), brand/generic/biologic/over-the-counter identification, and other qualitative information.
Table B-1
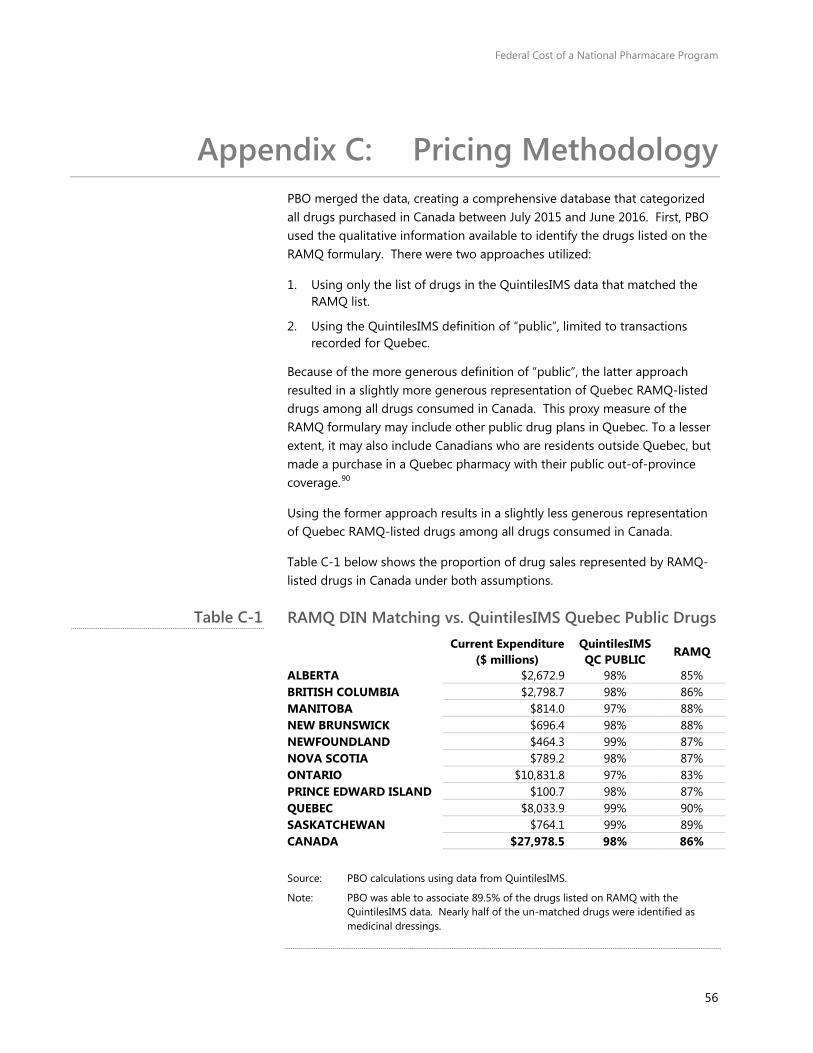
Federal Cost of a National Pharmacare Program
56
Pricing Methodology Appendix C:PBO merged the data, creating a comprehensive database that categorized all drugs purchased in Canada between July 2015 and June 2016. First, PBO used the qualitative information available to identify the drugs listed on the RAMQ formulary. There were two approaches utilized:
1. Using only the list of drugs in the QuintilesIMS data that matched the RAMQ list.
2. Using the QuintilesIMS definition of “public”, limited to transactions recorded for Quebec.
Because of the more generous definition of “public”, the latter approach resulted in a slightly more generous representation of Quebec RAMQ-listed drugs among all drugs consumed in Canada. This proxy measure of the RAMQ formulary may include other public drug plans in Quebec. To a lesser extent, it may also include Canadians who are residents outside Quebec, but made a purchase in a Quebec pharmacy with their public out-of-province coverage.90
Using the former approach results in a slightly less generous representation of Quebec RAMQ-listed drugs among all drugs consumed in Canada.
Table C-1 below shows the proportion of drug sales represented by RAMQ-listed drugs in Canada under both assumptions.
RAMQ DIN Matching vs. QuintilesIMS Quebec Public Drugs
Current Expenditure
($ millions) QuintilesIMS QC PUBLIC
RAMQ
ALBERTA $2,672.9 98% 85% BRITISH COLUMBIA $2,798.7 98% 86% MANITOBA $814.0 97% 88% NEW BRUNSWICK $696.4 98% 88% NEWFOUNDLAND $464.3 99% 87% NOVA SCOTIA $789.2 98% 87% ONTARIO $10,831.8 97% 83% PRINCE EDWARD ISLAND $100.7 98% 87% QUEBEC $8,033.9 99% 90% SASKATCHEWAN $764.1 99% 89% CANADA $27,978.5 98% 86%
Source: PBO calculations using data from QuintilesIMS.
Note: PBO was able to associate 89.5% of the drugs listed on RAMQ with the QuintilesIMS data. Nearly half of the un-matched drugs were identified as medicinal dressings.
Table C-1
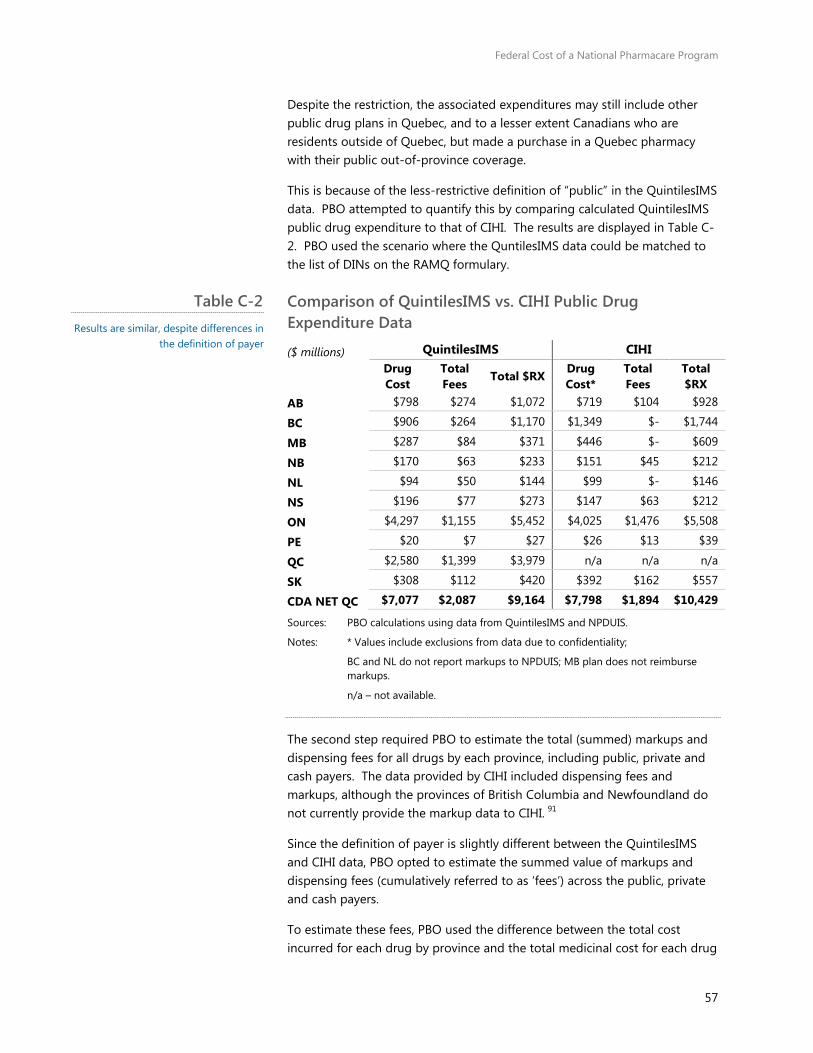
Federal Cost of a National Pharmacare Program
57
Despite the restriction, the associated expenditures may still include other public drug plans in Quebec, and to a lesser extent Canadians who are residents outside of Quebec, but made a purchase in a Quebec pharmacy with their public out-of-province coverage.
This is because of the less-restrictive definition of “public” in the QuintilesIMS data. PBO attempted to quantify this by comparing calculated QuintilesIMS public drug expenditure to that of CIHI. The results are displayed in Table C-2. PBO used the scenario where the QuntilesIMS data could be matched to the list of DINs on the RAMQ formulary.
Comparison of QuintilesIMS vs. CIHI Public Drug Expenditure Data
($ millions) QuintilesIMS CIHI
Drug Cost
Total Fees
Total $RX Drug Cost*
Total Fees
Total $RX
AB $798 $274 $1,072 $719 $104 $928
BC $906 $264 $1,170 $1,349 $- $1,744
MB $287 $84 $371 $446 $- $609
NB $170 $63 $233 $151 $45 $212
NL $94 $50 $144 $99 $- $146
NS $196 $77 $273 $147 $63 $212
ON $4,297 $1,155 $5,452 $4,025 $1,476 $5,508
PE $20 $7 $27 $26 $13 $39
QC $2,580 $1,399 $3,979 n/a n/a n/a
SK $308 $112 $420 $392 $162 $557
CDA NET QC $7,077 $2,087 $9,164 $7,798 $1,894 $10,429
Sources: PBO calculations using data from QuintilesIMS and NPDUIS.
Notes: * Values include exclusions from data due to confidentiality;
BC and NL do not report markups to NPDUIS; MB plan does not reimburse markups.
n/a – not available.
The second step required PBO to estimate the total (summed) markups and dispensing fees for all drugs by each province, including public, private and cash payers. The data provided by CIHI included dispensing fees and markups, although the provinces of British Columbia and Newfoundland do not currently provide the markup data to CIHI. 91
Since the definition of payer is slightly different between the QuintilesIMS and CIHI data, PBO opted to estimate the summed value of markups and dispensing fees (cumulatively referred to as ‘fees’) across the public, private and cash payers.
To estimate these fees, PBO used the difference between the total cost incurred for each drug by province and the total medicinal cost for each drug
Table C-2 Results are similar, despite differences in
the definition of payer
Federal Cost of a National Pharmacare Program
58
by province. This may vary from actual total fees, because the medicinal cost for each drug is based on the provincial average. Additionally, it may or may not include some additional wholesale markups. Lastly, there is some evidence that private plans pay a higher markup than do public plans. 92
PBO used each payer’s provincial market share of total medicinal costs to allocate the fees to each payer group (that is, public, private and cash). The implicit assumptions are that fees corresponded to the cost of the drug, and fees do not vary by the age or gender of the patient independent of their insurance status. This calculation was performed for each drug.
To allocate these fees to each age and gender group, PBO divided the total fees per payer, age and gender group by the summed total of the number of units consumed by each payer, age and gender group. This results in a standardized ‘fee-per-unit’. Multiplying the standardized fee-per-unit by the total units consumed by each unique age, gender and payer observation by province and drug produces the total estimated fees and markups for each group.
The CIHI data on markups and dispensing fees were used for reference and validation. See Table C-2 for the comparison by province (limited to public sector only).
Finally, PBO applied the lowest medicinal cost per unit observed in the dataset (calculated at the provincial level for each drug) to all drugs. As RAMQ has negotiated a list to equal to the lowest in Canada, the majority of these instances corresponded to Quebec (see Figure C-1).

Federal Cost of a National Pharmacare Program
59
Frequency of Lowest Price per Unit
Source: PBO calculations of QuintilesIMS data.
Implicitly, PBO also makes the assumption that the medicinal cost of the drug is the same for both public and private payers.
8% 5% 6% 4% 6%
53%
5% 3% 5% 5%
0%
10%
20%
30%
40%
50%
60%
BC AB SK MB ON QC NB NS PE NL
0
20
40
60
80
100
0.00
0.02
0.05
0.08
0.11
0.14
0.17
0.20
0.23
0.26
0.29
0.33
0.36
0.40
0.44
0.47
0.52
0.61
0.70
0.82
0.87
0.91
0.97
1.00
1.07
1.13
1.31
1.40
2.44
27.0
4
Cum
ulat
ive
Freq
uenc
y
Percent difference in prices
Figure C-1 Consistent with Quebec’s drug price
policies, the data indicated Quebec had the lowest price per unit for the majority
of cases.
90.4% cumulative
Federal Cost of a National Pharmacare Program
60
Co-payment Exemption Appendix D:Methodology
PBO calculated the co-payments using an iterative process. First, the baseline was used to calculate the behaviour effect. Then, the co-payments were re-calculated based on the adjusted number of prescriptions consumed (that is, the volume of prescriptions after the behaviour effect was applied). The process below describes the results from the second iteration, after the steady-state behavioural effect was calculated and applied.
Individuals under 16 and students aged 16 to 18
PBO assumes that all current Canadian residents aged between 16 and 18 are students. Hence, this category can be consolidated with the contiguous prescribed group of individuals under the age of 16.
Based on demographic projections prepared by Statistics Canada’s Demography Division for PBO, there were an estimated 3.8 million individuals in this age category.93
Data collected from QuintilesIMS indicates there were roughly 21.6 million prescriptions filled in Canada for individuals under the age of 18 in the 12-month period ended June 2016.
Individuals aged 65 and over
Data collected from QuintilesIMS indicate that there were about 331 million prescriptions filled in Canada for individuals aged 65 and over in the 12-month period ended June 2016.
Pregnant Women
The co-payment exemption for pregnant women is modelled on the approach taken by the United Kingdom. The UK Maternity Exemption Certificate, or “MatEx”, exempts pregnant women, and women who have given birth within the last 12 months, from paying a co-payment on any of their prescription drugs.94
Eligible women can apply for the MatEx as soon as their pregnancy is certified by a doctor or midwife, and any time during the pregnancy or during the 12 months after the birth of the baby. The exemption begins one month retroactively from when the National Health Service receives the application, and applies until 12 months after the expected date of the baby’s birth.95

Federal Cost of a National Pharmacare Program
61
Based on analysis of Statistics Canada data, PBO estimates that in 2017 there will be roughly 310,000 pregnant women in Canada. In addition, about 380,000 women will be in the 12-month postpartum period during the same year.96
Based on research from British Columbia, PBO assumes that pregnant women can be expected to take an average of 3.1 prescription dispensations over the course of their pregnancy. PBO assumes that postpartum women average 5.8 prescription dispensations over the course of their 12-month postpartum period. 97,98 In sum, this represents about 3.2 million prescriptions in 2017.
Physically disabled
Using Statistics Canada’s Social Policy Simulation Model/Database (SPSDM), PBO estimated 112,310 individuals and their dependents aged between 19 and 65 claimed the disability tax credit in 2016. This estimate excludes claimants who also received income from social assistance or employment insurance, thus ensuring no double counting among the cohorts.
It is assumed that this cohort will consume the average number of prescriptions for individuals aged between 18 and 65, that is, 13.3 suggesting total prescriptions within this group to be roughly 1.5 million.
Recipients of employment insurance
Using SPSDM, PBO estimates that there are roughly 1.2 million individuals and dependents aged between 19 and 65 who received Employment Insurance (EI) income in 2016. This estimate excludes claimants who also received income from social assistance or claimed the disability tax credit. According to Employment and Social Development Canada, the average duration of a regular Employment Insurance claim was 19.4 weeks in 2014. 99 As such, roughly 461,000 individuals would be eligible for a co-pay exemption on an annualised basis.
PBO assumed that this cohort will consume the average number of prescriptions consumed by individuals aged between 18 and 65. This suggests that total prescriptions for this group would be roughly 6.1 million.
Recipients of social assistance
Using SPSDM, PBO estimates that there are roughly 501,000 individuals and dependents aged between 19 and 65 who received social assistance income in 2016. As noted above, this estimate excludes claimants who also received income from employment insurance or claimed the disability tax credit. It was assumed that the average duration of social assistance payments was the same as EI benefits. As such, roughly 187,000 individuals would be eligible for a co-pay exemption on an annualised basis.
Federal Cost of a National Pharmacare Program
62
PBO assumed that this cohort will consume the average number of prescriptions consumed by individuals aged between 18 and 65. This suggests that total prescriptions for this group would amount to about 2.5 million.
Behavioural effect
This Pharmacare program will reduce patient costs, and as a result is expected to increase the number of drugs consumed. This will affect the calculation of the co-payment revenues and cost of the co-payment exemptions.
PBO estimated this increase at 12.5 per cent. To adjust the co-payment calculation for this increase in consumption, PBO assumed that the number of drug units per prescription would remain constant, thus increasing the number of prescriptions by the same proportion.
Generic drug exemption
Data published by the Canadian Institute for Health Information indicate that in 2014, the share of prescriptions attributable to generic drugs paid for by public insurance plans ranged between 68 per cent and 74 per cent across nine provinces. 100 Weighting these rates by provincial populations indicates an average rate of 71 per cent.
This is consistent with PBO’s calculations using data from QuintilesIMS, where generic drugs represented 64 per cent of total expenditures among patients aged 19-64, 64 per cent for seniors, and 53 per cent for children aged 18 and under.
PBO assumes that the generic prescription rate calculated for seniors applies to Social Assistance Recipients, who generally already receive coverage under these public drug insurance programs.
For all other designated groups, PBO assumed that the Canadian generic prescription rate in the 12-month period ended June 2016 among drugs users aged 19 – 64 (that is, the figure derived from the QuintilesIMS data set) applies. These generic shares change after the application of the generic substitution effect (below).
Generic substitution effect
To account for generic drug substitution, PBO assumed that each brand-name drug (excluding biologics and OTC) would be replaced with a generic as long as they were both in the same ATC-5 classification, of the same strength and of the same form.
This resulted in a decrease in the expected consumption of brand-name drugs, thus reducing the potential revenues generated from a $5 co-
Federal Cost of a National Pharmacare Program
63
payment. It also increased the expected consumption of generic drugs, resulting in an increased cost of co-payment exemptions.
See section 3.3 and Appendix E for a more detailed explanation of the calculation of generic substitution.
Federal Cost of a National Pharmacare Program
64
Methodology – Generic Appendix E:Substitution
Provinces may list the specific alternative drugs eligible for substitution. PBO used drugs contained within the same ATC-5 category as a proxy measure for eligible substitution.
PBO calculated the average price per unit for generic drugs within an ATC-5 category with the same strength and form, for each province. The price in this case was based on the average provincial price (that is, manufacturer price). PBO selected the average price for each class that was the lowest among the provinces.
Minprov(average priceATC-5) for all generic drugs
PBO then applied this lowest, average observed generic drug price per unit to the brand-name drug within the same ATC-5 category, with the same strength and form. Using the lowest price produced very similar results. Finally, PBO multiplied the number of brand-name units consumed by this price to calculate the total expenditure under the assumption of full generic substitution.
Despite public plans enforcing generic substitution, some proportion of these brand-name drugs – the ones eligible for substitution – is still consumed. PBO calculated this share to be roughly 32 per cent (nationally) of total brand-name drugs that were not “exceptional” drugs.
Therefore, PBO applied the conservative assumption that this level of brand-name drug consumption would continue for drugs currently covered by either private insurance or paid for out-of-pocket. That is, no generic substitution effect was applied to the public sector.
Among brand-name drugs flagged as eligible for generic substitution – that is, brand-name drugs with at least one generic available in the same ATC-5 classification, with the same strength and form – 32 per cent of the adjusted consumption maintained their brand-name price in the private and cash sectors. The remaining 68 per cent assumed the lower, provincial minimum, average generic price.
To do this, PBO applied this 32:68 ratio to each drug’s unit and prescription count across the province, age, gender and payer groups, assigning 32 per cent as brand-name post-Pharmacare, and the remaining 68 per cent as generic post-Pharmacare.
Federal Cost of a National Pharmacare Program
65
Since generics are often a fraction of the price of a brand-name drug, this resulted in roughly $535 million in savings. In cases where there was no generic, no change was made.
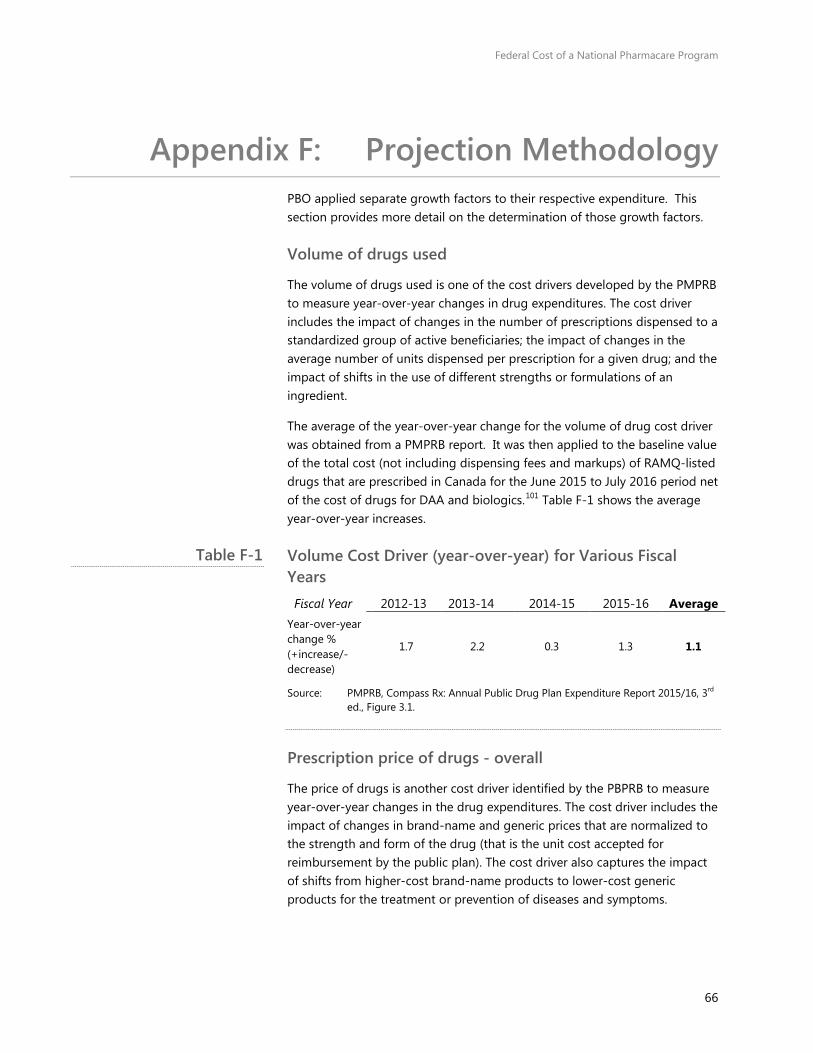
Federal Cost of a National Pharmacare Program
66
Projection Methodology Appendix F:PBO applied separate growth factors to their respective expenditure. This section provides more detail on the determination of those growth factors.
Volume of drugs used
The volume of drugs used is one of the cost drivers developed by the PMPRB to measure year-over-year changes in drug expenditures. The cost driver includes the impact of changes in the number of prescriptions dispensed to a standardized group of active beneficiaries; the impact of changes in the average number of units dispensed per prescription for a given drug; and the impact of shifts in the use of different strengths or formulations of an ingredient.
The average of the year-over-year change for the volume of drug cost driver was obtained from a PMPRB report. It was then applied to the baseline value of the total cost (not including dispensing fees and markups) of RAMQ-listed drugs that are prescribed in Canada for the June 2015 to July 2016 period net of the cost of drugs for DAA and biologics.101 Table F-1 shows the average year-over-year increases.
Volume Cost Driver (year-over-year) for Various Fiscal Years Fiscal Year 2012-13 2013-14 2014-15 2015-16 Average
Year-over-year change % (+increase/-decrease)
1.7 2.2 0.3 1.3 1.1
Source: PMPRB, Compass Rx: Annual Public Drug Plan Expenditure Report 2015/16, 3rd ed., Figure 3.1.
Prescription price of drugs - overall
The price of drugs is another cost driver identified by the PBPRB to measure year-over-year changes in the drug expenditures. The cost driver includes the impact of changes in brand-name and generic prices that are normalized to the strength and form of the drug (that is the unit cost accepted for reimbursement by the public plan). The cost driver also captures the impact of shifts from higher-cost brand-name products to lower-cost generic products for the treatment or prevention of diseases and symptoms.
Table F-1
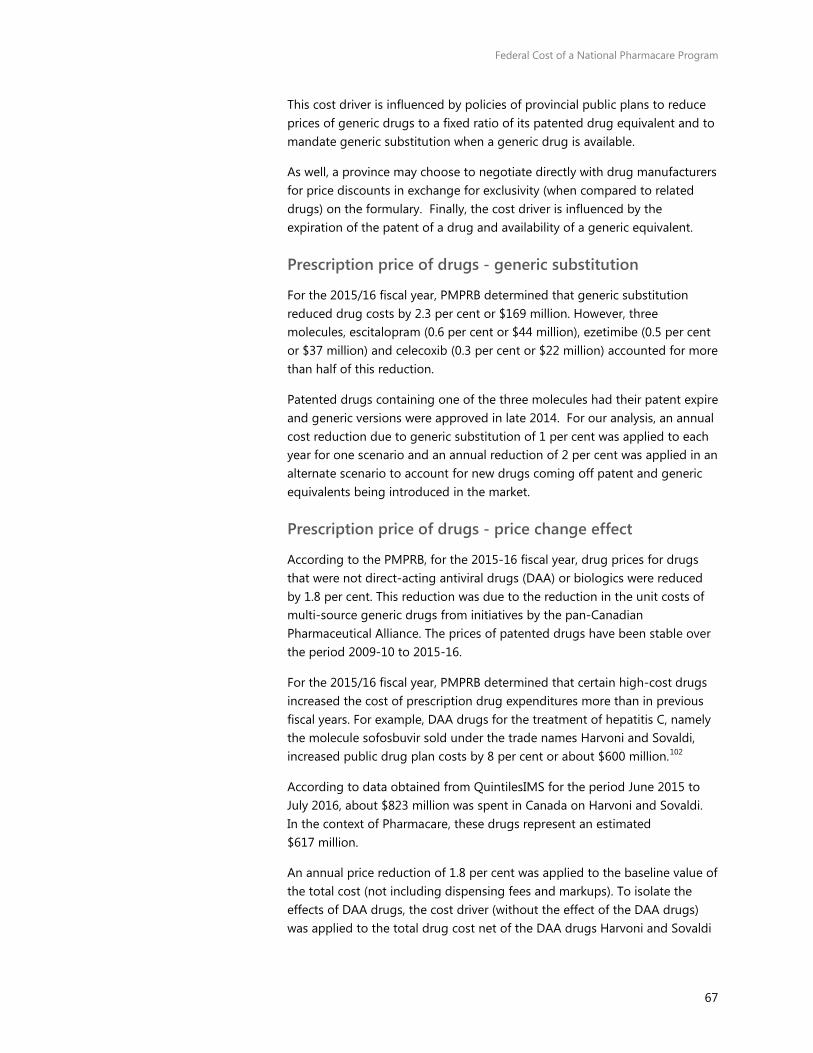
Federal Cost of a National Pharmacare Program
67
This cost driver is influenced by policies of provincial public plans to reduce prices of generic drugs to a fixed ratio of its patented drug equivalent and to mandate generic substitution when a generic drug is available.
As well, a province may choose to negotiate directly with drug manufacturers for price discounts in exchange for exclusivity (when compared to related drugs) on the formulary. Finally, the cost driver is influenced by the expiration of the patent of a drug and availability of a generic equivalent.
Prescription price of drugs - generic substitution
For the 2015/16 fiscal year, PMPRB determined that generic substitution reduced drug costs by 2.3 per cent or $169 million. However, three molecules, escitalopram (0.6 per cent or $44 million), ezetimibe (0.5 per cent or $37 million) and celecoxib (0.3 per cent or $22 million) accounted for more than half of this reduction.
Patented drugs containing one of the three molecules had their patent expire and generic versions were approved in late 2014. For our analysis, an annual cost reduction due to generic substitution of 1 per cent was applied to each year for one scenario and an annual reduction of 2 per cent was applied in an alternate scenario to account for new drugs coming off patent and generic equivalents being introduced in the market.
Prescription price of drugs - price change effect
According to the PMPRB, for the 2015-16 fiscal year, drug prices for drugs that were not direct-acting antiviral drugs (DAA) or biologics were reduced by 1.8 per cent. This reduction was due to the reduction in the unit costs of multi-source generic drugs from initiatives by the pan-Canadian Pharmaceutical Alliance. The prices of patented drugs have been stable over the period 2009-10 to 2015-16.
For the 2015/16 fiscal year, PMPRB determined that certain high-cost drugs increased the cost of prescription drug expenditures more than in previous fiscal years. For example, DAA drugs for the treatment of hepatitis C, namely the molecule sofosbuvir sold under the trade names Harvoni and Sovaldi, increased public drug plan costs by 8 per cent or about $600 million.102
According to data obtained from QuintilesIMS for the period June 2015 to July 2016, about $823 million was spent in Canada on Harvoni and Sovaldi. In the context of Pharmacare, these drugs represent an estimated $617 million.
An annual price reduction of 1.8 per cent was applied to the baseline value of the total cost (not including dispensing fees and markups). To isolate the effects of DAA drugs, the cost driver (without the effect of the DAA drugs) was applied to the total drug cost net of the DAA drugs Harvoni and Sovaldi

Federal Cost of a National Pharmacare Program
68
and the percentage of the total cost of drugs (net of fees and markups) that are biologics (25.5 per cent).103
To estimate the change in DAA drugs and of biologics over the projection period, a growth rate based on the year-over-year change for 2016 as published by Express Scripts Canada was used.104 For DAA drugs, a total growth rate of -3.5 per cent was used, and a total growth rate of 5 per cent was applied for biologics.105
Population growth
The final cost driver is the growth in the Canadian population over the projection period, which may increase the number of potential beneficiaries and the use of drugs. The average (2.5 per cent) of the demographic cost driver as published by PMPRB for the 2015/16 fiscal year for the NIHB (3.0 per cent) and British Columbia (2.0 per cent) public drug plans was selected since both plans are universal in that they cover all age groups.
The cost driver was applied to the non-biologic percentage of drugs and net of the cost of DAA drugs in the baseline, since the growth factors used for those drugs already contain a demographic factor.
Dispensing fees
The amount of total drug expenditures related to dispensing fees and markups was based on the baseline amount for the RAMQ formulary drugs for the June 2015 to July 2016 period with generic substitution and behaviour effects. A dispensing fee growth factor of 5.875 per cent, which is the average increase for the 2012-13 to 2015-16 period according to PMPRB, was used.106
Markups are negotiated by the payer and are typically set to a per cent of the drug costs. PBO used the projected growth of the Consumer Price Index (CPI) from the PBO’s latest Economic and Fiscal Outlook, equal to 2 per cent, as the growth factor for markups to act as a measure for average growth of drug costs (net of markups and fees).107
Summary formula
Year n = X*(1+(volume cost driver+generic substitution+price change effect+population growth factor)^n) + (DAA drug cost without fees and markups*(1+(DAA growth factor)^n) + (Biologics without fees and markups*(1+Biologics growth factor)^n) + (Dispensing fee baseline*(1+(Dispensing fee growth factor)^n) + (markup baseline*(1+(markup fee growth factor)^n)
X= Baseline (net of dispensing fees and markups) less DAA drug cost less biologic drug cost
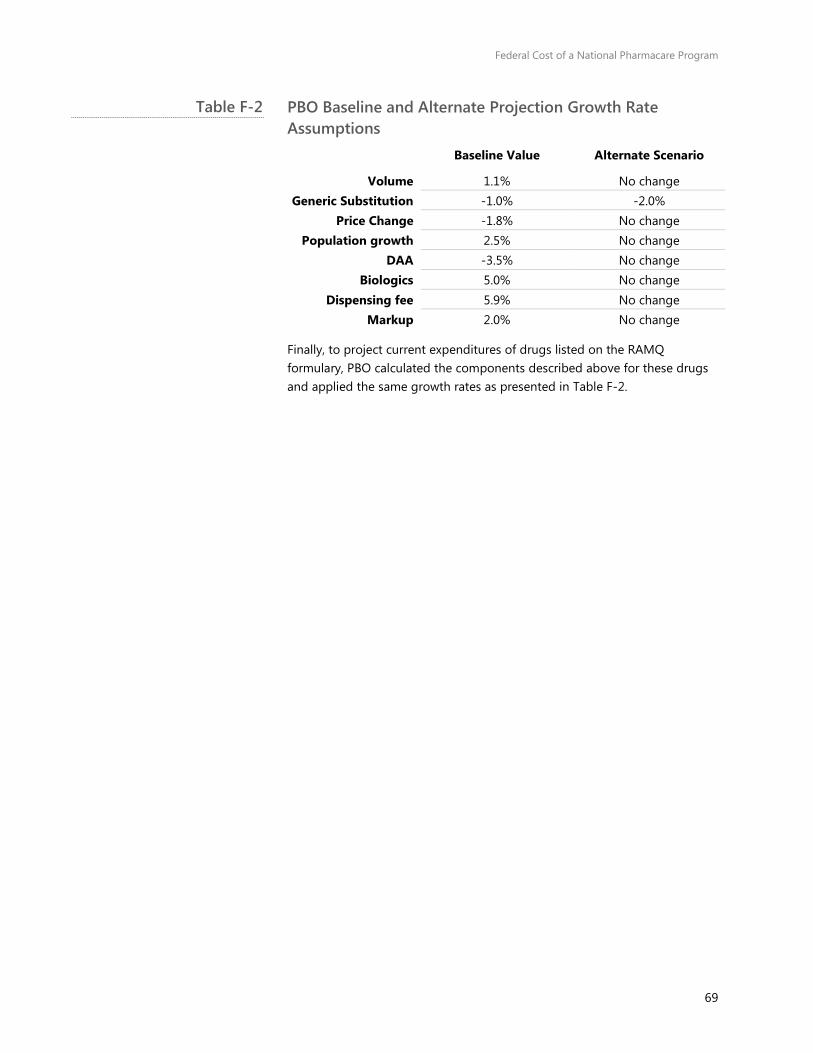
Federal Cost of a National Pharmacare Program
69
PBO Baseline and Alternate Projection Growth Rate Assumptions
Baseline Value Alternate Scenario
Volume 1.1% No change Generic Substitution -1.0% -2.0%
Price Change -1.8% No change Population growth 2.5% No change
DAA -3.5% No change Biologics 5.0% No change
Dispensing fee 5.9% No change Markup 2.0% No change
Finally, to project current expenditures of drugs listed on the RAMQ formulary, PBO calculated the components described above for these drugs and applied the same growth rates as presented in Table F-2.
Table F-2

Federal Cost of a National Pharmacare Program
70
Drug Cost Containment Appendix G:Strategies
Drug insurance plan providers employ several cost containment strategies. Although not an exhaustive list, PBO provides an overview of some strategies below.
Reference pricing
Reference pricing is generally the setting of prices for one drug, or class of drugs, relative to the price of another. 108 Generic drug pricing strategies in Canada typically employ this strategy. Selecting the reference product can be determined by the price; that is, it could be set to the lowest, highest, average or some other price.
The decision will ultimately impact the price and cost of all products being assigned the reference price The difference between the drug’s cost and this reference price is incurred by the patient, or his/her insurance plans if covered.109
Generic drug pricing
In Canada, public drug plans set the price of the generic drug by capping the price to a percentage of the brand name price. The percent used varies across provinces, and by some categories of drugs.
An annual document produced by CIHI that tracks these changes indicates the lowest generic price reference is in Alberta and is equal to 18 per cent of the brand-name drug. The reference price may extend to private plans as well.110
Product listing agreements (PLAs)
Product listing agreements are agreements between payers and drug manufacturers that work to keep or add a drug on a payer’s formulary, in exchange for something from the drug manufacturer. Some examples of different PLAs include: 111
• Rebate Agreement
A confidential reduced price for the payer in negotiations of a PLA is established, and the official list price for the drug remains public. A rebate from the drug manufacturer is paid to the payer, usually in a lump sum.
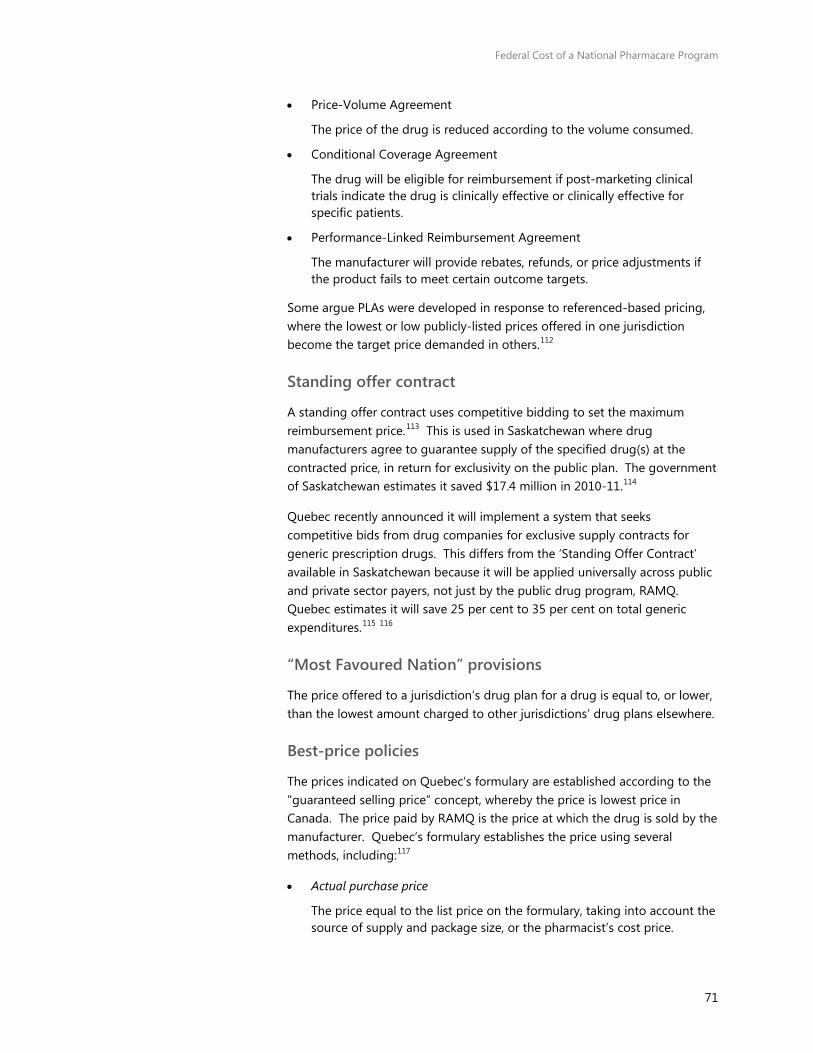
Federal Cost of a National Pharmacare Program
71
• Price-Volume Agreement
The price of the drug is reduced according to the volume consumed.
• Conditional Coverage Agreement
The drug will be eligible for reimbursement if post-marketing clinical trials indicate the drug is clinically effective or clinically effective for specific patients.
• Performance-Linked Reimbursement Agreement
The manufacturer will provide rebates, refunds, or price adjustments if the product fails to meet certain outcome targets.
Some argue PLAs were developed in response to referenced-based pricing, where the lowest or low publicly-listed prices offered in one jurisdiction become the target price demanded in others.112
Standing offer contract
A standing offer contract uses competitive bidding to set the maximum reimbursement price.113 This is used in Saskatchewan where drug manufacturers agree to guarantee supply of the specified drug(s) at the contracted price, in return for exclusivity on the public plan. The government of Saskatchewan estimates it saved $17.4 million in 2010-11.114
Quebec recently announced it will implement a system that seeks competitive bids from drug companies for exclusive supply contracts for generic prescription drugs. This differs from the ‘Standing Offer Contract’ available in Saskatchewan because it will be applied universally across public and private sector payers, not just by the public drug program, RAMQ. Quebec estimates it will save 25 per cent to 35 per cent on total generic expenditures.115 116
“Most Favoured Nation” provisions
The price offered to a jurisdiction’s drug plan for a drug is equal to, or lower, than the lowest amount charged to other jurisdictions’ drug plans elsewhere.
Best-price policies
The prices indicated on Quebec’s formulary are established according to the "guaranteed selling price” concept, whereby the price is lowest price in Canada. The price paid by RAMQ is the price at which the drug is sold by the manufacturer. Quebec’s formulary establishes the price using several methods, including:117
• Actual purchase price
The price equal to the list price on the formulary, taking into account the source of supply and package size, or the pharmacist’s cost price.
Federal Cost of a National Pharmacare Program
72
• Lowest price – setting the price equal to the lowest price among manufacturers offering the same drug.
• Lowest price method – setting the price for a given package size to the lowest brand-name price.
• Grouping of dosage forms and strengths – The price payable will correspond to drugs within the same form or strength and generic name, rather than just drugs with the same generic name.
• Maximum amount - Stipulating maximum amount payable.
• Setting maximum mark-ups – Setting a maximum dollar-amount for markups, which are typically set to a percentage of the drug cost.
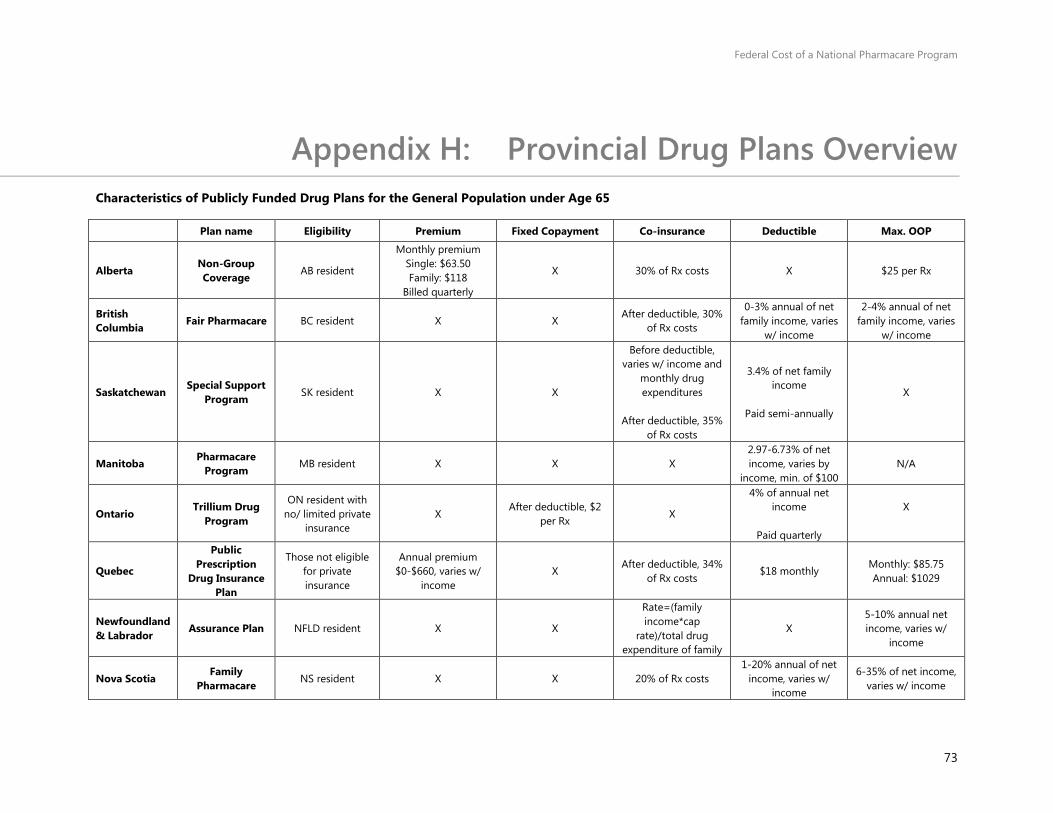
Federal Cost of a National Pharmacare Program
73
Provincial Drug Plans Overview Appendix H:Characteristics of Publicly Funded Drug Plans for the General Population under Age 65
Plan name Eligibility Premium Fixed Copayment Co-insurance Deductible Max. OOP
Alberta Non-Group Coverage AB resident
Monthly premium Single: $63.50 Family: $118
Billed quarterly
X 30% of Rx costs X $25 per Rx
British Columbia Fair Pharmacare BC resident X X
After deductible, 30% of Rx costs
0-3% annual of net family income, varies
w/ income
2-4% annual of net family income, varies
w/ income
Saskatchewan Special Support
Program SK resident X X
Before deductible, varies w/ income and
monthly drug expenditures
After deductible, 35%
of Rx costs
3.4% of net family income
Paid semi-annually
X
Manitoba Pharmacare Program MB resident X X X
2.97-6.73% of net income, varies by
income, min. of $100 N/A
Ontario Trillium Drug
Program
ON resident with no/ limited private
insurance X
After deductible, $2 per Rx
X
4% of annual net income
Paid quarterly
X
Quebec
Public Prescription
Drug Insurance Plan
Those not eligible for private insurance
Annual premium $0-$660, varies w/
income X
After deductible, 34% of Rx costs
$18 monthly Monthly: $85.75 Annual: $1029
Newfoundland & Labrador
Assurance Plan NFLD resident X X
Rate=(family income*cap
rate)/total drug expenditure of family
X 5-10% annual net income, varies w/
income
Nova Scotia Family
Pharmacare NS resident X X 20% of Rx costs 1-20% annual of net
income, varies w/ income
6-35% of net income, varies w/ income
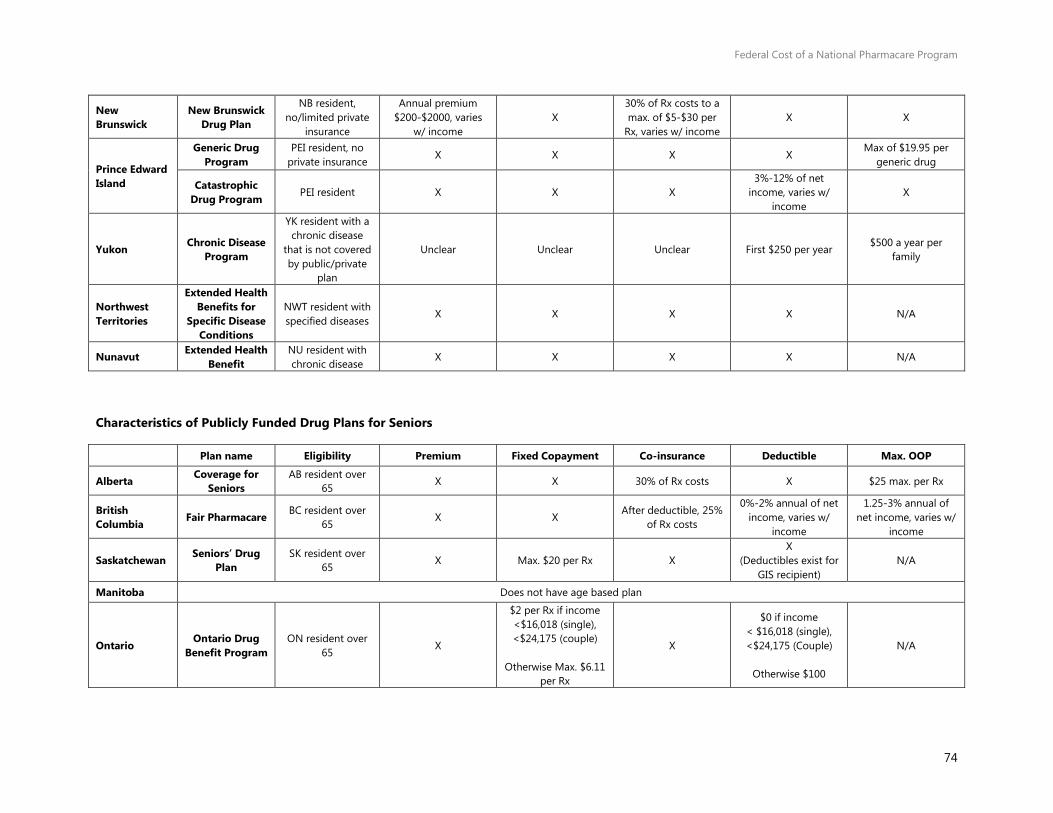
Federal Cost of a National Pharmacare Program
74
New Brunswick
New Brunswick Drug Plan
NB resident, no/limited private
insurance
Annual premium $200-$2000, varies
w/ income X
30% of Rx costs to a max. of $5-$30 per
Rx, varies w/ income X X
Prince Edward Island
Generic Drug Program
PEI resident, no private insurance
X X X X Max of $19.95 per
generic drug
Catastrophic Drug Program
PEI resident X X X 3%-12% of net
income, varies w/ income
X
Yukon Chronic Disease Program
YK resident with a chronic disease
that is not covered by public/private
plan
Unclear Unclear Unclear First $250 per year $500 a year per
family
Northwest Territories
Extended Health Benefits for
Specific Disease Conditions
NWT resident with specified diseases
X X X X N/A
Nunavut Extended Health Benefit
NU resident with chronic disease
X X X X N/A
Characteristics of Publicly Funded Drug Plans for Seniors
Plan name Eligibility Premium Fixed Copayment Co-insurance Deductible Max. OOP
Alberta Coverage for Seniors
AB resident over 65
X X 30% of Rx costs X $25 max. per Rx
British Columbia Fair Pharmacare BC resident over
65 X X
After deductible, 25% of Rx costs
0%-2% annual of net income, varies w/
income
1.25-3% annual of net income, varies w/
income
Saskatchewan Seniors’ Drug Plan
SK resident over 65
X Max. $20 per Rx X X
(Deductibles exist for GIS recipient)
N/A
Manitoba Does not have age based plan
Ontario Ontario Drug
Benefit Program ON resident over
65 X
$2 per Rx if income <$16,018 (single), <$24,175 (couple)
Otherwise Max. $6.11
per Rx
X
$0 if income < $16,018 (single), <$24,175 (Couple)
Otherwise $100
N/A
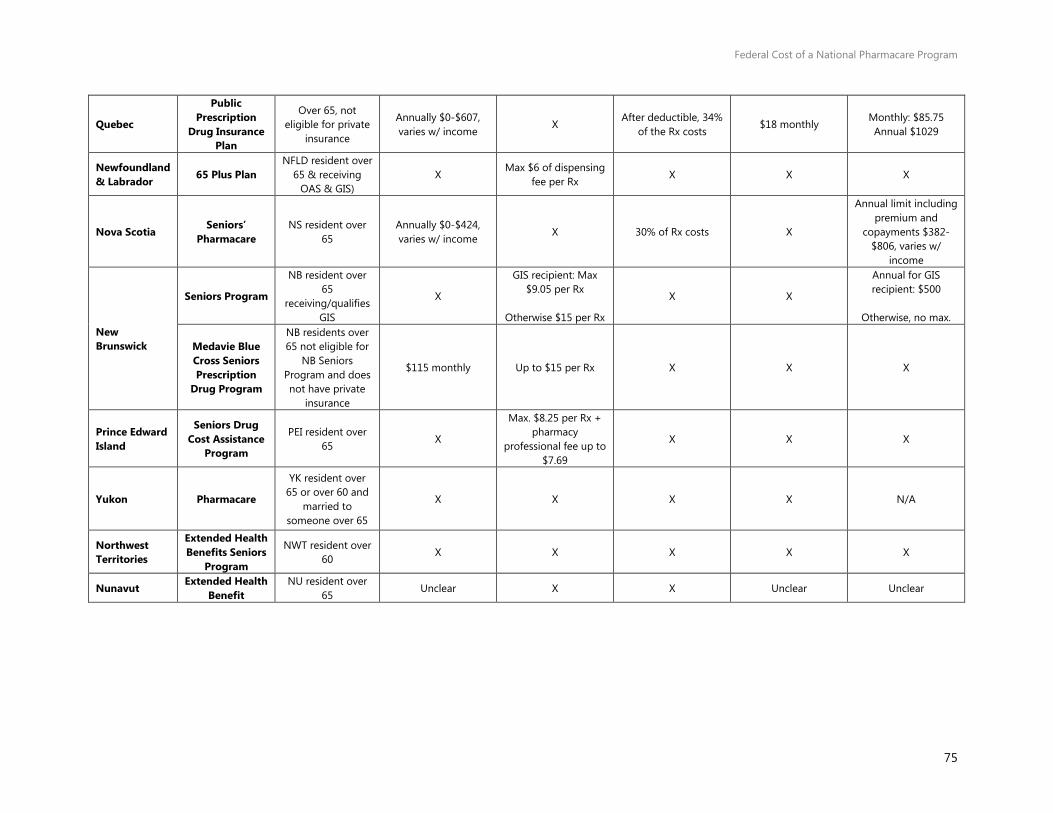
Federal Cost of a National Pharmacare Program
75
Quebec
Public Prescription
Drug Insurance Plan
Over 65, not eligible for private
insurance
Annually $0-$607, varies w/ income
X After deductible, 34%
of the Rx costs $18 monthly
Monthly: $85.75 Annual $1029
Newfoundland & Labrador 65 Plus Plan
NFLD resident over 65 & receiving
OAS & GIS) X
Max $6 of dispensing fee per Rx
X X X
Nova Scotia Seniors’
Pharmacare NS resident over
65 Annually $0-$424, varies w/ income
X 30% of Rx costs X
Annual limit including premium and
copayments $382-$806, varies w/
income
New Brunswick
Seniors Program
NB resident over 65
receiving/qualifies GIS
X
GIS recipient: Max $9.05 per Rx
Otherwise $15 per Rx
X X
Annual for GIS recipient: $500
Otherwise, no max.
Medavie Blue Cross Seniors Prescription
Drug Program
NB residents over 65 not eligible for
NB Seniors Program and does not have private
insurance
$115 monthly Up to $15 per Rx X X X
Prince Edward Island
Seniors Drug Cost Assistance
Program
PEI resident over 65
X
Max. $8.25 per Rx + pharmacy
professional fee up to $7.69
X X X
Yukon Pharmacare
YK resident over 65 or over 60 and
married to someone over 65
X X X X N/A
Northwest Territories
Extended Health Benefits Seniors
Program
NWT resident over 60
X X X X X
Nunavut Extended Health
Benefit NU resident over
65 Unclear X X Unclear Unclear

Federal Cost of a National Pharmacare Program
76
Characteristics of Publicly Funded Drug Plans for those on Social Assistance/Low Income
Plan name Eligibility Premium Fixed Copayment Co-insurance Deductible Max. OOP
Alberta Alberta
Adult/Child Health Benefit
AB resident receiving income
support X X X X N/A
British Columbia
Pharmacare Plan C
BC resident receiving income
assistance X X X X N/A
Saskatchewan Supplementary Health Program
Determined by Ministry of Social
Services X
Up to $2 per Rx for adults, depending on
status X X X
Manitoba Employment &
Income Assistance
MB resident receiving income
support X X X X N/A
Ontario Ontario Drug
Benefit ON resident above
65 X $2 per Rx X X X
Quebec
Public Prescription
Drug Insurance Plan
QC resident receiving 94%-
100% GIS X X X X X
Newfoundland & Labrador
Foundation Plan NFLD resident
receiving income support
X X X X N/A
Access Plan Low income families and individuals
X X 20% - 70% of total Rx
costs, varies w/ income
X X
Nova Scotia Pharmacare
Benefits
Low income families and individuals
X $5 per Rx X X X
New Brunswick
Plan E (Adults in Licensed
Residential Facilities)
NB resident reside in a licensed adult residential facility
Unclear $4 per Rx X Unclear $250 annually
Plan F (Social Development
Clients)
NB resident with valid health card
issued by the Dept. of Social
Development
Unclear
$4 per Rx for adults>18 years and $2 for children<18
years
X Unclear $250 per family unit
annually
Plan G (Special needs children
Children in care of the Minister of
X X X X N/A
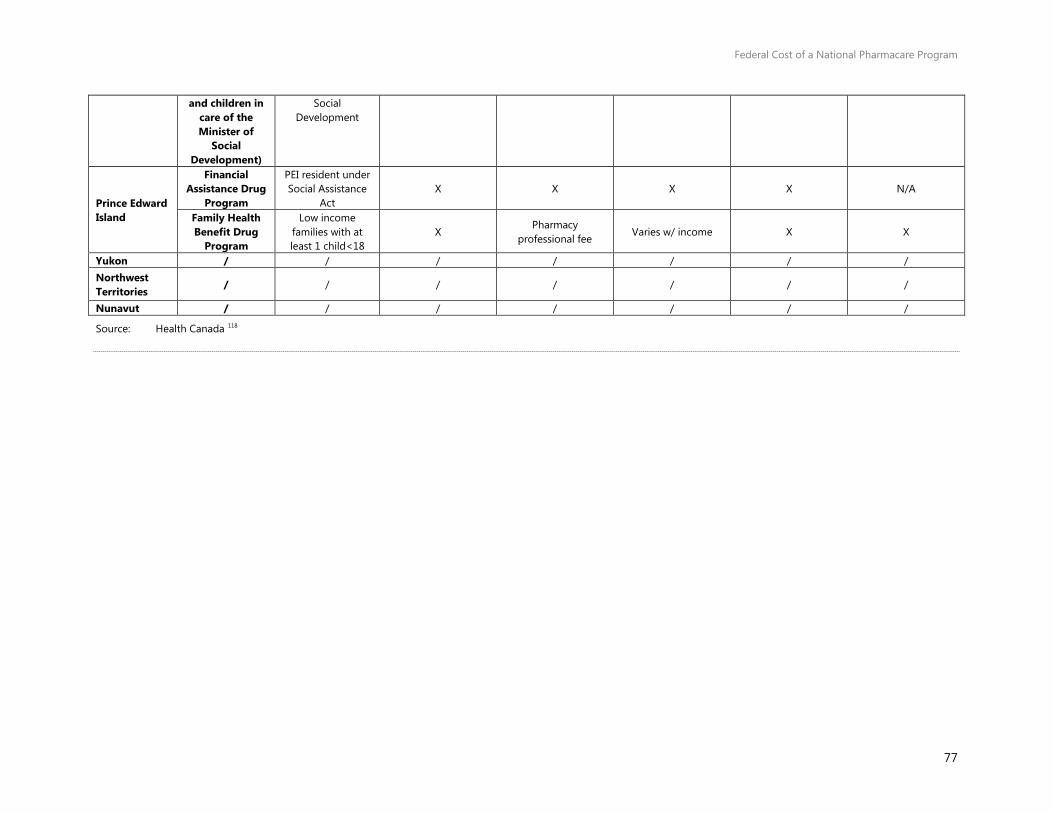
Federal Cost of a National Pharmacare Program
77
and children in care of the Minister of
Social Development)
Social Development
Prince Edward Island
Financial Assistance Drug
Program
PEI resident under Social Assistance
Act X X X X N/A
Family Health Benefit Drug
Program
Low income families with at least 1 child<18
X Pharmacy
professional fee Varies w/ income X X
Yukon / / / / / / / Northwest Territories
/ / / / / / /
Nunavut / / / / / / /
Source: Health Canada 118

Federal Cost of a National Pharmacare Program
78
Notes
1. PBO calculations of the average compound growth rate for the latest 10 years of data, 2004 to 2014, using data from Canadian Institute for Health Information. National Health Expenditure Trends, 1975 to 2016. Data Tables. Ottawa, ON: CIHI; 2016. https://www.cihi.ca/sites/default/files/document/nhex-trends-narrative-report_2016_en.pdf
2. Patented Medicine Prices Review Board, CompassRx, 3rd Edition Annual Public Drug Plan Expenditure Report, 2015/16, May 2017. http://www.pmprb-cepmb.gc.ca/view.asp?ccid=1314
3. $590 million adjusted for inflation using PBO’s projected annual growth rate of inflation. Source of nominal amount: Gagnon, Mark-André. “Pharmacare and Federal Drug Expenditures: A Prescription for Change” in How Ottawa Spends, 2012-2013, 161-171. McGill-Queen’s University Press, 2012. Source of inflation growth projections: PBO, “Economic and Fiscal Outlook, April 2017”, April 2017. http://www.pbo-dpb.gc.ca/web/default/files/Documents/Reports/2017/EFO%20April%202017/EFO_MAY2017_EN.pdf
4. Morgan, Steven G., Michael Law, Jamie R. Daw, Liza Abraham, and Danielle Martin. Estimated cost of universal public coverage of prescription drugs in Canada. Canadian Medical Association Journal 187, no. 7 (2015): 491-497. http://www.cmaj.ca/content/early/2015/03/16/cmaj.141564
5. This may not result in savings, if for example federal employees' unions offset the loss of benefits through collective bargaining. Source: PDCI Market Access Inc. January 19, 2016. Pharmacare Costing In Canada Preliminary Report: Assessment of a National Pharmacare Model Cost Estimate Study. Commissioned by the Canadian Pharmacists Association. http://www.pdci.ca/wp-content/uploads/2016/01/Pharmacare-Preliminary-Report-PDCI-January-2016.pdf
6. Patient's out of pocket costs for exceptional drugs are also expected to decrease to either $5 or $0, depending on eligibility for the co-payment exemption. However, they were not included in this calculation.
7. Health Canada (2017). Drug Product Database. https://www.canada.ca/en/health-canada/services/drugs-health-products/drug-products/drug-product-database.html.
8. However, the data from CIHI's NPDUIS database that PBO accessed also excluded certain drugs with high cost and low patient counts for privacy and data comparability reasons.
9. Brand-name drugs include both patent and off-patent drugs.
Federal Cost of a National Pharmacare Program
79
10. Canadian Agency for Drugs and Technologies in Health, web page
Similarities and Differences Between Brand Name and Generic Drugs. Last updated July 17, 2015. Accessed June 16, 2017. https://www.cadth.ca/generic-drugs/similarities-and-differences-between-brand-name-and-generic-drugs
11. These populations include First Nations and Inuit persons, Veterans, members of the military, members of the Royal Canadian Mounted Police, and inmates in federal penitentiaries. http://www.hc-sc.gc.ca/hcs-sss/pharma/acces/fedprog-eng.php
12. Health Canada, http://www.hc-sc.gc.ca/dhp-mps/prodpharma/activit/fs-fi/reviewfs_examenfd-eng.php.Accessed May 20, 2017.
13. Health Canada, http://www.hc-sc.gc.ca/dhp-mps/prodpharma/notices-avis/index-eng.php Accessed May 20, 2017; http://www.hc-sc.gc.ca/dhp-mps/prodpharma/activit/fs-fi/reviewfs_examenfd-eng.php, Accessed May 20, 2017.
14. The Patent Register also contains patents that were removed by Health Canada post January 1, 2010. Requests for a list of removed patents prior to this date must be made to the Office of Patented Medicines and Liaison (OPML). http://www.hc-sc.gc.ca/dhp-mps/prodpharma/patregbrev/ptnt-faq-mbreg-eng.php, Accessed May 20, 2017.
15. A manufacturer may also make an allegation justifying immediate market entry that is either accepted by the innovator or upheld by the court. http://www.hc-sc.gc.ca/dhp-mps/pubs/drug-medic/patmrep_mbrevrap-eng.php
16. The recently passed Canadian-European Union Comprehensive Economic and Trade Agreement (CETA) will extend some patents by up to two years via an issuance of a Certificate of Supplementary Protection. Bill C-30 Canada–European Union Comprehensive Economic and Trade Agreement Implementation Act, [Assented to 16th May, 2017]. http://www.parl.ca/DocumentViewer/en/42-1/bill/C-30/royal-assent
17. Based on the factors set out in the Patent Act, the PMPRB issues a set of non-binding guidelines (the Compendium of Policies, Guidelines and Procedures), to ensure that patentees are aware of the policies, guidelines and procedures under which Board Staff reviews the prices of patented drug products sold in Canada. It also specifies the recourse options where drugs are found to be excessively priced in Canada. Link available. http://www.pmprb-cepmb.gc.ca/view.asp?ccid=492
18. Patented Medicine Review Board. Compendium of Policies, Guidelines and Procedures. February 2017. Accessed May 12, 2017. http://www.pmprb-cepmb.gc.ca/en/legislation/compendium-of-policies,-guidelines-and-procedures
19. Health Canada, Federal Public Drug Benefit Programs https://www.canada.ca/en/health-canada/services/health-care-system/pharmaceuticals/access-insurance-coverage-prescription-medicines/federal-public-drug-benefit-programs.html . Updated July 19, 2005. Accessed July 30, 2017. Government of Canada, Immigration and Citizenship, Health Care.

Federal Cost of a National Pharmacare Program
80
http://www.cic.gc.ca/english/refugees/outside/summary-ifhp.asp Updated July 17, 2017. Accessed July 30, 2017.
20. Canada Revenue Agency, Indexation adjustment for personal income tax and benefit amounts. Last updated March 7, 2017, http://www.cra-arc.gc.ca/tx/ndvdls/fq/ndxtn-eng.html
21. Canada Revenue Agency, Line 452 – Refundable medical expense supplement we page. Last updated January 4, 2017. http://www.cra-arc.gc.ca/tx/ndvdls/tpcs/ncm-tx/rtrn/cmpltng/ddctns/lns409-485/452-eng.html. Accessed June 10, 2017.
22. Department of Finance Canada. Report on Federal Tax Expenditures 2017 – Concepts, Estimates and Evaluation. 2017. https://www.fin.gc.ca/taxexp-depfisc/2017/taxexp1702-eng.asp#a1 Unfortunately, the proportion of the amount claimed for each tax credit or of the benefits received from an employer-sponsored healthcare plans that is related to drug expenditures is not available. Also note that the tax treatment of benefits received from an employer-sponsored healthcare plan also reduces the taxable income calculated for provincial income tax purposes.
23. $590 million adjusted for inflation using PBO’s projected annual growth rate of inflation. Source of nominal amount: Gagnon, Mark-André. “Pharmacare and Federal Drug Expenditures: A Prescription for Change” in How Ottawa Spends, 2012-2013, 161-171. McGill-Queen’s University Press, 2012. Source of inflation growth projections: PBO, “Economic and Fiscal Outlook, April 2017”, April 2017. http://www.pbo-dpb.gc.ca/web/default/files/Documents/Reports/2017/EFO%20April%202017/EFO_MAY2017_EN.pdf
24. Often, drugs are listed as restricted because they are costly, but may be the only option available for some patients who have exhausted their other options.
25. Canadian Agency for Drugs and Technologies in Health, Programs and Services web page. https://www.cadth.ca/about-cadth/what-we-do/products-services, Accessed May 20, 2017
26. Institut national d'excellence en santé et en services sociaux, https://www.inesss.qc.ca/accueil.html, Accessed May 20, 2017.
27. The Patented Medicine Prices Review Board provided the PBO with custom calculations using data from the National Prescription Drug Utilization Information System, Canadian Institute for Health Information.
28. Canadian Institute for Health Information. Prescribed Drug Spending in Canada, 2016: A Focus on Public Drug Programs. Ottawa, ON: CIHI; 2016.
29. CADTH, Hospital Formularies Decision-Making Process, Environmental Scan, Issue 47. March 2015. https://www.cadth.ca/hospital-formularies-decision-making-process
30. Lapointe-Shaw, Lauren, Hadas D. Fischer, Alice Newman, Ava John-Baptiste, Geoffrey M. Anderson, Paula A. Rochon, and Chaim M. Bell. Potential savings of harmonising hospital and community formularies for chronic disease medications initiated in hospital. PloS one 7, no. 6 (2012): e39737. https://doi.org/10.1371/journal.pone.0039737

Federal Cost of a National Pharmacare Program
81
31. Chua, Doson, Eric Chu, Angela Lo, Melissa Lo, Fruzina Pataky, Linda Tang, and
Ajay Bains. Effect of misalignment between hospital and provincial formularies on medication discrepancies at discharge: PPITS (proton pump inhibitor therapeutic substitution) study. The Canadian Journal of Hospital Pharmacy 65, no. 2 (2012).
32. For example Blue Cross or Personal Health Insurance from SunLife.
33. This excludes individuals insured through extended health care plan packages, which can include drug expenses, supplementary hospital and travel health coverages. This may also reflect some double counting of eligible recipients, where for example, both partners have coverage for them and their partner.
34. Canadian Life and Health Insurance, Health Insurance Benefits in Canada – 2015.
35. TELUS Health Analytics, The Current State of Private Drug Plans and Issues for Future Sustainability. Prepared for Health Canada, Office of Pharmaceutical Management Strategies, October 30, 2013.
36. TELUS Health Analytics, The Current State of Private Drug Plans and Issues for Future Sustainability. Prepared for Health Canada, Office of Pharmaceutical Management Strategies, October 30, 2013.
37. Express Scripts Canada. 2015 Drug Trend Report.
38. Express Scripts Canada. 2016 Drug Trend Report. http://www.express-scripts.ca/sites/default/files/2016-Drug-Trend-Report.pdf
39. Ibid.
40. Crowe, Kelly. CBC News, “Drug companies using doctors, discount cards to skirt generic substitutions”. Posted April 22, 2010. Accessed August 1, 2017. http://www.cbc.ca/news/health/drug-companies-using-doctors-discount-cards-to-skirt-generic-substitutions-1.3042773.
41. InnoviCares web site. https://www.innovicares.ca/en#whats-covered Accessed August 1, 2017.
42. Formed through the merger of Quintiles and IMS Health, QuintilesIMS employs approximately 50,000 employees worldwide including the roughly 350 working in the Canada Business Unit. The Canada Business Unit provides support and insights to pharmaceutical clients along the entire product lifecycle structured under four business lines. It was from this unit that PBO acquired the data.
43. Canadian Institute for Health Information. National Health Expenditure Trends, 1975 to 2016. Ottawa, ON: CIHI; 2016. https://www.cihi.ca/sites/default/files/document/nhex-methodological-notes_2016_en.pdf
44. The Survey of Household Spending excludes the following populations: Persons living on Indian reserves and on Crown lands; official representatives of foreign countries living in Canada and their families; members of religious and other communal colonies; members of the Canadian Forces living in military camps; people living in residences for senior citizens; and people living full-time in institutions.
Federal Cost of a National Pharmacare Program
82
45. Sanmartin Claudia, Deirdre Hennessy, Yuqian Lu and Michael Robert Law,
2014, Trends in out-of-pocket health care expenditures in Canada, by household income, 1997 to 2009, Health Reports, Vol. 25, no. 4, Statistics Canada, Catalogue no. 82-004-X. pp. 13-17. http://www.statcan.gc.ca/access_acces/alternative_alternatif.action?l=eng&loc=11924-eng.pdf
46. Health Canada, 2011. Health Canadians – A Federal Report on Comparable Health Indicators 2010. http://www.hc-sc.gc.ca/hcs-sss/pubs/system-regime/2010-fed-comp-indicat/index-eng.php
47. In 2010, the Survey of Household Spending (SHS) used a new methodology to collect household expenditure information. Statistics Canada, Survey of Household Spending (SHS) Summary of changes web page. Accessed June 27, 2017 http://www23.statcan.gc.ca/imdb/p2SV.pl?Function=getMainChange&Id=192713. Last updated January 26, 2017.
48. The Before-tax Household Income Quintiles were derived by Statistics Canada by the following: “Income groupings are obtained by ranking the households who responded to the interview in ascending order by total household income before tax, then partitioning the households into five groups of similar size.” Information on the ranges of income contained within each household income quintile on the Survey of Household Spending was not, to the knowledge of the authors, publicly available.
49. The particular ATC used in the data is developed and maintained by y the European Pharmaceutical Market Research Association (EphMRA), which can differ from the classification developed by the World Health Organization. EphMRA has written a document to help explain the differences between the two classifications, which can be found here: http://www.ephmra.org/user_uploads/who-atc%202013%20final.pdf Using EphMRA classification, drugs can be classified into more than one ATC.
50. Constitution Act, 1867 http://laws-lois.justice.gc.ca/eng/const/FullText.html
51. Health Canada, Reports and Publications – Health Care System web page. Last updated October 9, 2012. http://www.hc-sc.gc.ca/hcs-sss/pubs/system-regime/2011-hcs-sss/index-eng.php, accessed May 20, 2017.
52. Canada Health Act, http://laws-lois.justice.gc.ca/eng/acts/c-6/FullText.html
53. Federal-Provincial Fiscal Arrangements Act, http://laws-lois.justice.gc.ca/eng/acts/F-8/
54. Canadian Institute for Health Information, Data Tables. National Health Expenditure Trends, 1975 to 2016. Ottawa, ON: CIHI; 2016.
55. Department of Finance Canada, Federal Support to Provinces and Territories, Federal Support to Provinces and Territories. Last updated February 2, 2017. Accessed June 10, 2017. https://www.fin.gc.ca/fedprov/mtp-eng.asp
56. Canadian Life and Health Insurance Association, Letter to The Minister of Health the Honourable Rona Ambrose, CLHIA expresses concerns to Federal Health Minister about costs of a national pharmacare program dated September 22, 2015.
Federal Cost of a National Pharmacare Program
83
https://www.clhia.ca/domino/html/clhia/clhia_lp4w_lnd_webstation.nsf/page/5CEC3F8A27207E4E85257ED200643C4C
57. Fraser Group/Tristat Resources. 2002. Drug Expense Coverage in the Canadian Population: Protection from Severe Drug Expenses (p. 55). Retrieved April 15, 2015. http://www.frasergroup.com/downloads/severe_drug_e.pdf
Also Cited by Kratzer, Jillian, Lucy Cheng, Sara Allin, and Michael R. Law. The impact of private insurance coverage on prescription drug use in Ontario, Canada. Healthcare Policy 10, no. 4 (2015): 62. http://www.longwoods.com/content/24212
58. Sanmartin, Claudia, Deirdre Hennessy, Yuqian Lu, and Michael Robert Law. Trends in out-of-pocket health care expenditures in Canada, by household income, 1997 to 2009." Health reports 25, no. 4 (2014): 13.
59. Canadian Institute for Health Information, Data Tables. National Health Expenditure Trends, 1975 to 2016. Ottawa, ON: CIHI; 2016; Latest year available for total prescribed was 2014.
60. Law, Michael R., Lucy Cheng, Irfan A. Dhalla, Deborah Heard, and Steven G. Morgan. The effect of cost on adherence to prescription medications in Canada. Canadian Medical Association Journal 184, no. 3 (2012): 297-302. http://www.cmaj.ca/content/184/3/297.full#T1
61. Hennessy, D., Sanmartin, C., Ronksley, P. Weaver, R., Campbell, D., Manns, B., Tonelli, M., and Hemmelgarn, B. Out-of pocket spending on drugs and cost-related prescription non-adherence among Canadians with chronic disease. Statistics Canada. 2016. http://www.statcan.gc.ca/pub/82-003-x/2016006/article/14634/tbl/tbl01-eng.htm
62. PMPRB Annual Report 2015; National Prescription Database Utilization Information System. Note that the data source was cited as “MIDAS™ database, 2005-2015, IMS AG. All rights reserved.” http://www.pmprb-cepmb.gc.ca/CMFiles/Publications/Annual%20Reports/2015/2015_Annual_Report_Final_EN.pdf
63. PDCI Market Access Inc. and H3 Consulting. Private Payer Product Listing Agreements in Canada; Second Joint Industry/Payer Survey. November 2016. Accessed May 13, 2017. http://www.pdci.ca/resources/publications/
64. Competition Bureau of Canada., Canadian Generic Drug Sector Study. 2007. http://www.competitionbureau.gc.ca/eic/site/cb-bc.nsf/eng/02495.html
65. Grootendorst, P., M. Rocchi, and H. Segal. An Economic Analysis of the Impact of Reductions in Generic Drug Rebates on Community Pharmacy in Canada. Toronto: Leslie Dan Faculty of Pharmacy, University of Toronto; 2008.
66. Ontario Ministry of Health and Long-Term Care., Ensuring Better Value for Money. Accessed June 10, 2017. Last Modified January 14, 2013. http://www.health.gov.on.ca/en/pro/programs/drugs/plan_reform_ods/ensuring.aspx
67. CBC News Article by Dean Beeby, Revenue Canada probe of pharmacies finds $58M in hidden income. Posted July 7, 2016. Last Updated July 7, 2016. Accessed June 10, 2017. http://www.cbc.ca/news/politics/generic-drugs-pharmacies-canada-revenue-agency-tax-penalties-1.3667050
Federal Cost of a National Pharmacare Program
84
68. Gagnon, M. A. A roadmap to a rational pharmacare policy in Canada.
Canadian Federation of Nurses Unions. 2014."
69. Canadian Life and Health Insurance Association, Letter to The Minister of Health the Honourable Rona Ambrose, CLHIA expresses concerns to Federal Health Minister about costs of a national pharmacare program dated September 22, 2015. https://www.clhia.ca/domino/html/clhia/clhia_lp4w_lnd_webstation.nsf/page/5CEC3F8A27207E4E85257ED200643C4C
70. Law, M., Cheng, L., Dhalla, I., Heard, D., Morgan, S. The effect of cost on adherence to prescription medications in Canada. Canadian Medical Association Journal. 184(3).
71. Morgan, S., and Boothe, K. Universal prescription drug coverage in Canada: Long-promised yet undelivered. Healthcare Management Forum. 2016 Nov; 29(6): 247–254. https://www.ncbi.nlm.nih.gov/pmc/articles/PMC5094297/.
72. Hennessy, D., Sanmartin, C., Ronksley, P. Weaver, R., Campbell, D., Manns, B., Tonelli, M., and Hemmelgarn, B. Out-of pocket spending on drugs and cost-related prescription non-adherence among Canadians with chronic disease. Statistics Canada. 2016. http://www.statcan.gc.ca/pub/82-003-x/2016006/article/14634-eng.pdf.
73. Morgan, S., Law, M., Daw, J., Abraham, L., and Martin, D. Estimated cost of universal public coverage of prescription drugs in Canada. Canadian Medical Association Journal. April 2015. http://www.cmaj.ca/content/184/3/297.full)
74. This does not include insurance premiums.
75. Contoyannis, P., Hurley, J., Grootendorst, P., Jeon, S., and Tamblyn, R., Estimating the price elasticity of expenditure for prescription drugs in the presence of non-linear price schedules: an illustration from Quebec, Canada. Health Economics. 14 No. 9 (2005).
76. The elasticity estimates were typically based on a price changes for seniors, who may or may not be more price sensitive than the rest of the Canadian population. This includes the price estimate of Contoyannis et. al where the estimate was based on a relatively small price change for seniors in Quebec in 1998. However, international elasticities of demand for drugs suggest that the elasticity for the working-age population may be higher. Due to lack of population-wide Canadian estimates, PBO chose to use an estimate within the range of those calculated by Contoyannis et. al (which is well within the range of estimates produced by the other two Canadian studies). Sources: Contoyannis, P., Hurley, J., Grootendorst, P., Jeon, S., and Tamblyn, R., Estimating the price elasticity of expenditure for prescription drugs in the presence of non-linear price schedules: an illustration from Quebec, Canada. Health Economics. 14 (2005); Li X, Guh D, Lacaille D, Esdaile J, Ais AH. The impact of cost sharing of prescription drug expenditures on health care utilization by the elderly : own-and cross-price elasticities. Health Policy. 2007 Aug; 82 (3): 340-347; Results by Grootendorst PV et. al as summarized and cited by Michael Law, “Assessing Cost-related Non-adherence to Prescription Drugs in Canada – A report prepared for Health Canada”. Provided by an Information Request to Health Canada IR0261.
77. Bio-similars are classified as Biologics in the data.
Federal Cost of a National Pharmacare Program
85
78. A complete list of designated categories for UK co-pay exemptions can be
found at: http://www.nhs.uk/NHSEngland/Healthcosts/Pages/Prescriptioncosts.aspx.
79. In some public plans, patients can receive reimbursement for a brand-name drug up to the reimbursement cost of the generic either upon request, or if the physician has indicated a 'no substitution' clause. The latter is often in cases where the patient experiences adverse drug reactions to the generic, but not the brand-name drug, but is sometimes upon request to fulfill patients' preferences rather than medical necessity. In other plans, only the generic is reimbursed, despite the 'no substitution' request. However, plans tend to offer a compassionate clause that will reimburse patients for the full cost of a brand-name drug in cases of severe adverse reaction to the generic.
80. Quebec imposed generic substitution clauses for private plans on October 1, 2015. Therefore, the data captures a weighted average of the effect of generic substitution in private plans. Source: Bill 28: An Act mainly to implement certain provisions of the Budget Speech of 4 June 2014 and return to a balanced budget in 2015-2016. Assented to 21 April 2015. Forty-first legislature, First Session. http://www2.publicationsduquebec.gouv.qc.ca/dynamicSearch/telecharge.php?type=5&file=2015C8A.PDF
Also, PMPRB cited a paper indicating the generic substation has been increasing in private plans: Lynas, K. 2012. Private Insurers Implementing Policies Making Generic Substitution Mandatory. Can Pharm J (Ott). Nov. 2012 145(6):245. http://www.ncbi.nlm.nih.gov/pmc/articles/PMC3567597/ Accessed May 20, 2017). doi: 10.3821/145.6.cpj245.
81. Patented drugs may compete with existing brand-name drugs that have no generic available. While it's possible some substitutions are made, this is already captured in the data if/when it occurs.
82. The provinces and programs include: Alberta, Saskatchewan, Manitoba, Ontario, New Brunswick, Nova Scotia and Prince Edward Island and Health Canada's Non-insured Health Benefits drug plan.
83. Patented Medicine Prices Review Board, Compass Rx: Annual Public Drug Plan Expenditure Report, various years.
84. Due to the high cost of DAAs and biologics, the percentage of the total prescription cost that comprises of the dispensing fees and markups is much lower than other traditional drugs. For example, for Harvoni and Sovaldi collectively dispensing fees and markups are 4.2% of the total prescription cost. We are assuming that there is no behaviour response for these drugs.
85. Age cohorts identified in the dataset used by the PBO were:19-25; 26-29; 30-34; 35-39; 40-44; 45-49; 50-54; 55-59; and 60-64.
86. Smolina, K., Morgan, S. The Drivers of Overspending on Prescription Drugs in Quebec. Healthcare Policy. 2014; 10(2): 19-26.
87. As noted in Smolina, K, and Morgan, S. (2014) the patterns of prescription drug consumption in Quebec differ from those in the rest of Canada. Part of these differences is captured through the demographic weightings used by the PBO (that is, different age groups consume different types of drugs). However, as noted earlier, idiosyncratic cultural or administrative
Federal Cost of a National Pharmacare Program
86
(prescribing) differences in Quebec versus the rest of the country are not captured in this calculation. As such, the actual estimated behavioural effect could be higher or lower.
88. QI Projected Patient counts are created by way of a multi-step factoring framework that leverages multiple QI data assets, including national multi-year databases of de-identified patient-level prescription and claims transactions, as well as the “Gold Standard” Geographical Prescription Monitor (“GPM”) service that provides the most complete and robust picture of total prescription volume in the Canadian retail pharmacy marketplace. The Projected Patients framework is used to estimate the total number of unique patients in a given cohort definition. The particular ATC used in the data is developed and maintained by y the European Pharmaceutical Market Research Association (EphMRA), which can differ from the classification developed by the World Health Organization. EphMRA has written a document to help explain the differences between the two classifications, which can be found here: http://www.ephmra.org/user_uploads/who-atc%202013%20final.pdf Using EphMRA classification, drugs can be classified into more than one ATC.
89. Canadian Institute for Health Information. National Prescription Drug Utilization Information System Database. Received March 30, 2017.
90. Some provinces permit out-of-province insurance for drugs. http://www.health.gov.nl.ca/health/prescription/covered_outofprovince.html ; https://www.saskatchewan.ca/residents/health/prescription-drug-plans-and-health-coverage/health-benefits-coverage/out-of-province-and-out-of-canada-coverage#out-of-province-services-in-canada ; https://www.insurancehotline.com/travel-and-your-provincial-health-plan/
91. Manitoba's public drug plan does not reimburse any markups.
92. This document: http://www.springer.com/cda/content/document/cda_downloaddocument/9783319121680-c2.pdf?SGWID=0-0-45-1489884-p177022475; The 2007 competition bureau report, page 49 in “Canadian Generic Drug Sector Study”.
93. Annual population projections by age and sex for July 1, 2016 to 2100, Canada, provinces and territories. Medium-growth scenario: special projection up to 2100. Prepared by Statistics Canada for the PBO.
94. The UK National Health Service overview of the Maternity Exemption Certificate is presented here: http://www.nhsbsa.nhs.uk/1039.aspx.
95. Women with stillbirths, defined as a baby born dead after 24 completed weeks of pregnancy, may continue to use the MatEx; women with miscarriages, defined as babies born dead between 14 and 24 weeks of pregnancy, must return the MatEx.
96. Statistics Canada. CANSIM Table 1024516: http://www5.statcan.gc.ca/cansim/a26?lang=eng&id=1024516
97. Smolina, K., Hanley, G., Mintzes, B., Oberlander, T., Morgan, S. Trends and Determinants of Prescription Drug Use during Pregnancy and Postpartum in British Columbia, 2002-2011: A Population-Based Cohort Study. PLoS One. 10(5). 2015.
Federal Cost of a National Pharmacare Program
87
98. Personal communications with Dr. K. Smolina regarding mean dispensations
in 2011 to new mothers in British Columbia.
99. Employment and Social Development Canada. Employment Insurance Monitoring and Assessment Report for 2014-15. https://www.canada.ca/en/employment-social-development/programs/ei/ei-list/reports/monitoring2015.html
100. Canadian Institutes for Health Information. Prescribed Drug Spending in Canada. 2014. https://secure.cihi.ca/free_products/Prescribed%20Drug%20Spending%20in%20Canada_2014_EN.pdf
101. Patented Medicine Prices Review Board, Compass Rx: Annual Public Drug Plan Expenditure Report, various years.
102. Sofosbuvir is found on the RAMQ formulary and accounted for roughly 20% public brand name expenditures (net of fees) and roughly 5% of total expenditures, according to PBO calculations using IMS data.
103. As a comparison the cost of traditional drugs per prescription (i.e. non-biologics and DAA) increased by 1.7% for privately-administered drug plans in Canada, see: Express Scripts, Express Scripts Canada: Drug Trend Report 2016, 2016, pg. 22.
104. Express Scripts Canada analyses the change in drug cost for private insurance plans. The year-over-year change should be similar to public drug plans since the percentage of biologics of the total dollars spent in our data is approximately the same for public drug plans (20.5%) versus private drug plans (20.0%). For brand name drugs the percentage of total dollar spent is higher in our data for private drug plan (49.6%) versus public drug plans (43.3%).
105. According to Express Scripts the prescription cost of DAA drugs to treat Hepatitis C will decrease due to listing agreements through the pan-Canadian Pharmaceutical Alliance and due to the decrease of the number of individuals in the population with the disease. As well, there was a spike in DAA drugs to treat Hepatitis C in the start of 2015 due to drugs being listed on the formulary of certain provinces. The Express Scripts year-over-year change for 2016 for DAA drugs was -63.3%. The prescription cost of biologics such as those used for the treatment of inflammatory conditions is expected to increase due to the approval of a new biologic, containing the molecule ixekizumab and the slow uptake of the use of biosimilars as well as the higher cost of biosimilars when compared to their name brand drug. For example, the biosimilar for infliximab is 53% of the name brand price. The Express Scripts year-over-year change for 2016 for biologics to treat inflammatory conditions, the class of drugs with the highest dollars spent in 2016, was 11.7%.
106. Patented Medicine Prices Review Board, Compass Rx: Annual Public Drug Plan Expenditure Report, 3rd Ed., 2017.
107. PBO. Economic and Fiscal Outlook April 2017. 2017. http://www.pbo-dpb.gc.ca/web/default/files/Documents/Reports/2017/EFO%20April%202017/EFO_MAY2017_EN.pdf
Federal Cost of a National Pharmacare Program
88
108. Better Pharmacare Coalition Reference-Based Pricing web page. Last
updated (unknown) http://www.betterpharmacare.com/issues-cost-pricing.cfm Accessed May 20, 2017.
109. Lexchin J. Drug pricing in Canada. In: Babar ZUD, editor. Pharmaceutical prices in the 21st century. Cham (Switzerland): Springer International Publishing AG; 2015:25–41.
110. Canadian Institute for Health Information. National Prescription Drug Utilization Information System Database – Plan Information Document. July 15, 2016. Ottawa, ON: CIHI; 2016. https://secure.cihi.ca/free_products/NPDUIS_PlanInformationComparison2016_EN.pdf
111. Forcier, Mélanie Bourassa, and François Noël. Product listing agreements (PLAs): a new tool for reaching Quebec's pharmaceutical policy objectives? Healthcare Policy 9, no. 1 (2013): 65. http://www.longwoods.com/content/23477
112. Morgan et. al, Use of Product Listing Agreements by Canadian Provincial Drug Benefit Plan. Healthcare Policy, Volume 8, Issue 4, May 2013. http://www.longwoods.com/content/23376
113. Competition Bureau Canada, Canadian Generic Drug Sector Study. 2007.
114. Government of Saskatchewan. About the Saskatchewan Formulary, web page. Last updated (unknown) http://formulary.drugplan.ehealthsask.ca/About.aspx Accessed May 20, 2017.
115. The Canadian Press, “Generic drug deal to save Quebec more than $00 million yearly: Barrette”. Published July 17, 2017. Accessed August 3, 2017. http://www.ctvnews.ca/health/generic-drug-deal-to-save-quebec-more-than-300-million-yearly-barrette-1.3506064
116. Les Perreaux. The Globe and Mail, "Quebec expects to save millions with overhaul of generic-drug purchasing process“. Published June 28, 2017. Accessed August 3, 2017. https://www.theglobeandmail.com/news/national/quebec-expects-to-save-millions-with-overhaul-of-generic-drug-purchasing-process/article35484903/
117. Régie de l'assurance maladie Québec, List of Medications in force. Last updatd June 1 2017. http://www.ramq.gouv.qc.ca/en/regie/legal-publications/Pages/list-medications.aspx
118. Information Request. IR0261. Sent October 4, 2016. http://www.pbo-dpb.gc.ca/web/default/files/files/files/IR/IR0261_HC_HESA_EN.pdf and http://www.pbo-dpb.gc.ca/web/default/files/files/files/IR/IR0261_HC_HESA_FR.pdf