federal infrastructure strategy reports€¦ · federal infrastructure strategy reports this is the...
TRANSCRIPT

Federal Infrastructure Strategy Reports
This is the eleventh in a series of interim reports which will be published by the U. S. Army Corps of El}gineers during the Federal Infrastructure Strategy program, a three-year effort to explore the development of an integrated or multiagency Federal infrastructure policy. This report presents the technical description and documentation of a pavement technology transfer demonstration project performed by the U. S. Army Corps of Engineers Waterways Experiment Station.
Other reports in the series thus far include:
Framing the Dialogue: Strategies, Issues and Opportunities (IWR Report 93-FIS-l);
Challenges and Opportunities for Innovation in the Public Works Infrastructure, Volumes 1 and 2, (IWR Reports 93-FIS-2 and 93-FIS-3);
Infrastructure in the 21st Century Economy: A Review of the Issues and Outline of a Study of the Impacts of Federal Infrastructure Investments (IWR Report 93-FIS-4);
Federal Public Works Infrastructure R&D: A New Perspective (IWR Report 93-FIS-5);
The Federal Role in Funding State and Local Infrastructure: Two Reports on Public Works Financing (lWR Report 93-FIS-6);
Infrastructure in the 21st Century Economy: An Interim Report - Volume 1 - The Dimensions of Public Works' Effects on Growth and Industry (lWR Report 94-FIS-7);
Infrastructure in the 21st Century Economy: An Interim Report - Volume 2 - Three Conceptual Papers Exploring the Link Between Public Capital and Productivity (IWR Report 94-FIS-8);
Infrastructure in the 21st Century Economy: An Interim Report - Volume 3 - Data on Federal Capital Stocks and Investment Flows (IWR Report 94-FIS-9);
Local Public Finance Impact Model: User's Guide and Technical Documentation (IWR Report 94-FIS-I0).
For further information on the Federal Infrastructure Strategy program, please contact:
Mr. Robert A. Pietrowsky FIS Program Manager 703/355-3073
Dr. Eugene Z. Stakhiv Chief, Policy and Special Studies Division 703/355-2370
U.S. Department of the Army Corps of Engineers Institute for Water Resources Casey Building, 7701 Telegraph Road Alexandria, VA 22315-3868
The Institute's infrastructure study team includes Dr. Cameron E. Gordon, Economic Studies Manager and Mr. James F. Thompson, Jr., Engineering Studies Manager. The program is overseen by Mr. Kyle Schilling, Director of the Institute.
Reports may be ordered by writing (above address) or calling Mrs. Arlene Nurthen, IWR Publications, at 703/355-3042.

The Federal Infrastructure Strategy Program
Technical Report Series
Nondestructive Testing, Evaluation, and Rehabilitation for Roadway Pavements:
Warren County, Mississippi, Cincinnati, Ohio, and Berkeley, California
July 1994
prepared by
Richard H. Grau and Don R. Alexander Pavement Systems Division
Geotechnical Laboratory U.S. Army Engineer Waterways Experiment Station
for
U.S. Army Corps of Engineers Water Resources Support Center
Institute for Water Resources
. IWR REPORT 94-FIS-ll

I I e Ia) !li!ll 'I u.s. Mrri CoIps of EngIn08lS U.s. Mrri CoIps of Engineers iI water Resouroes Support Center Waterways Experinent StatIon J ~_~_water_Resou_roes ________________________ __
I' Technical Report
Federal Infrastructure St tegy P II NONDESTRUCTIVE TESTING, EVALUATION, AND ra rogram Jl REHABILITATION FOR ROADWAY PAVEMENT:
II WARREN COUNTY, MISSISSIPPI, J, CINCINNATI, OHIO, AND BERKELEY, CALIFORNIA
II
-'.
Federal Infrastructure Strategy Program I!!I U.s. Mrri CoIps of Engineers July 1994 IWR Report 94-FI8-11
I I

ii
PREFACE
Nondestructive Testing, Evaluation, and Rehabilitation for Roadway Pavements
TABLE OF CONTENTS
v
EXECUTIVE SUMMARY ...................................... vii
Conversion Factors, Non-SI to SI Units of Measurement . . . . . . . . . . . . . . . . . . . . xiii
1. INTRODUCTION . . . . . . . . . . . . . . . . . . . . . . . . . . . . . . . . . . . . . . . . .. 1 STUDY OBJECTIVES ..................................... 1 HISTORY ............. '. . . . . . . . . . . . . . . . . . . . . . . . . . . . . .. 1 WES 16-KIP VIBRATOR - DSM EVALUATION PROCEDURE. . . . . . . . .. 2 LA YERED ELASTIC PROCEDURE ........................... 3 CURRENT STATUS ..................................... 3 BENEFITS/SAVINGS .................................... 4 STUDY APPROACH . . . . . . . . . . . . . . . . . . . . . . . . . . . . . . . . . . . .. 4 PROBLEM STATEMENT ................................ " 5 COOPERATIVE RESEARCH AND DEVELOPMENT AGREEMENTS. . . .. 5
2. TECHNOLOGY TRANSFER PLAN .............................. 7 DEMONSTRATION SITE SELECTION . . . . . . . . . . . . . . . . . . . . . . . . . . 7 CONTRACTOR SELECTION ............................... 8
3. TESTING AND EVALUATION ................................. 11 WARREN COUNTY, MS .................................. 11 CINCINNATI, OH ...................................... 12 BERKELEY, CA . . . . . . . . . . . . . . . . . . . . . . . . . . . . . . . . . . . . . . .. 14 BERKELEY'S COMMENTS ................................ 15 CONTRACTOR'S COMMENTS ............................ " 16 SEMINARS . . . . . . . . . . . . . . . . . . . . . . . . . . . . . . . . . . . . . . . . . .. 16 ANALYSIS ........................................... 17
4. SUMMARY OF RESULTS ................................... 19
5. RECOMMENDATIONS REGARDING A SPECIFICATIONS TEMPLATE ..... 25
BIBLIOGRAPHY . . . . . . . . . . . . . . . . . . . . . . . . . . . . . . . . . . . . . . . . . . .. 27
@ TABLE OF CONTENTS iii

ABBREVIATIONS AND ACRONYMS .............................. 29
APPENDIX A STATEMENT OF WORK/SPECIFICATIONS ................ 31
APPENDIX B COOPERATIVE RESEARCH AND DEVELOPMENT AGREEMENT BETWEEN WES AND THE CITY OF CINCINNATI ................ 35
APPENDIX C SOLICITATION PACKAGE MAILING LIST ................ 47
APPENDIX D WARREN COUNTY, MS TEST SECTIONS ................. 51
APPENDIX E PAVEMENT ANALYSIS ............................. 55
APPENDIX F REHABILITATION STRATEGIES FOR WARREN COUNTY, MS ... 77
APPENDIX G CINCINNATI, OH TEST SECTIONS ..................... 83
APPENDIX H REHABILITATION STRATEGIES FOR CINCINNATI, OH ....... 87
APPENDIX I BERKELEY, CA TEST SECTIONS ....................... 99
APPENDIX J REHABILITATION STRATEGIES FOR BERKELEY, CA . . . . . . .. 107
APPENDIX K RECOMMENDED SPECIFICATIONS TEMPLATE FOR A REQUEST FOR BID .................................... 115
LIST OF FIGURES
Figure 1. AC overlay thicknesses computed for the Warren County, Mississippi pavements. ......................................... 20
Figure 2. AC overlay thicknesses computed for the Cincinnati, Ohio pavements. .... 20 Figure 3. AC overlay thicknesses computed for the Berkeley, California pavements. .. 21 Figure 4. Comparison of subgrade stress and strain criteria used for evaluating
flexible pavements . . . . . . . . . . . . . . . . . . . . . . . . . . . . . . . . . . . .. 21 Figure 5. Comparison of stress criteria used for evaluating rigid and composite
pavements . . . . . . . . . . . . . . . . . . . . . . . . . . . . . . . . . . . . . . . . .. 22 Figure 6. Comparison of asphalt tensile strain criteria used for evaluating flexible
pavements . . . . . . . . . . . . . . . . . . . . . . . . . . . . . . . . . . . . . . . . .. 22
. LIST OF TABLES
Table 1. Testing and Evaluation Data for Demonstration Sites ................ ix
iv TABLE OF CONTENTS @

PREFACE
Nondestructive Testing, Evaluation, and Rehabilitation for Roadway Pavements
This report was prepared for the U.S. Army Corps of Engineers Institute for Water Resources by the U. S. Army Engineer Waterways Experiment Station (WES) as part of the Federal Infrastructure Strategy (FIS) program. The FIS program was initiated as a budget initiative for Fiscal Year 1991. The U.S. Army Corps of Engineers (USACE) acted as program facilitator with various other government departments and agencies actively participating. The PIS program is overseen by the USACE Directorate of Civil Works, with detailed management responsibilities delegated to the Institute for Water Resources.
This project was selected in cooperation with the USACE Directorate of Research and Development by the USACE Infrastructure Task Force Subcommittee on Technical Transfer. The Waterways Experiment Station (WES) of the U.S. Army Corps of Engineers led this initiative.
As an integral part of this project, separate Cooperative Research and Development Agreements (CRDA's) were executed between WES and Warren County, MS; Cincinnati, OR; and Berkeley, CA. The CRDA's were approved by the Assistant Secretary of the Army (Research, Development, and Acquisition), Army Domestic Technology Transfer Program Manager.
The objective of the agreements was to acquaint municipal public works agencies with a process where they could use a guide specification to acquire vendor services to perform nondestructive assessments of their pavement's structural adequacy. The guide specification was employed to enable municipalities to contract for use of a Falling Weight Deflectometer (FWD) pavement evaluation system. The FWD system was used to assess the pavement structural adequacy and determine pavement material properties for each of the localities. These data were then used to design cost effective pavement rehabilitation strategies for the participating communities.
This project was planned and managed at WES from April 1992 to December 1993 by the Pavement Systems Division, Geotechnical Laboratory. Personnel of the Pavement Systems Division involved in this project were Dr. Albert J. Bush III, and Messrs. Don R. Alexander and Richard R. Grau. This report was prepared by Messrs. Grau and Alexander. The project was monitored by Messrs. James F. Thompson, Jr. and Robert A. Pietrowsky, Institute for Water Resources, Water Resources Support Center, Fort Belvoir, VA, who also prepared the Executive Summary.
Special recognition is given to Mr. Rhea A. Fuller, Road Manager, Warren County, MS, Mr. Douglas C. Perry, Department of Public Works, Cincinnati, OR, Mr. Paul Sachs, Metropolitan Transportation Commission, Oakland, CA, and Ms. Wendy P. Wong, Department of Public Works, Berkeley, CA who were points of contact and provided information required from each demonstration site to insure that this project was successful.
@ PREFACEv

The project was conducted under the general supervision Dr. William F. Marcuson III, Director, Geotechnical Laboratory, and under "the direct supervision of Drs. George M. Hammitt II, Chief, Pavement Systems Division, and Albert J. Bush III, Chief, Criteria Development and Applications Branch, Pavement Systems Division.
At the time of publication of this report, Director of WES was Dr. Robert W. Whalin. The Commander of WES was Colonel Bruce K. Howard.
vi PREFACE@

EXECUTlVESU~ARY
Nondestructive Testing, Evaluation, and Rehabilitation for Roadway Pavements
Many of the nation's highways, roads, and streets managed by state and local governments require major rehabilitation. Traditionally, many of these pavements are repaired by applying a standard thickness of an asphalt overlay on top of the original pavement structure. For example, it is common practice in some areas to recommend applying a two-inch asphalt overlay to any pavement requiring rehabilitation.
Understandably, this is not always cost effective. Properly designing a durable and economical overlay requires knowledge of the pavement's structural capacity. A nondestructive evaluation procedure can often be utilized to assess the structural adequacy of a pavement and in determining the materials properties for use in designing cost-effective rehabilitation strategies.
OBJECTIVES
This report documents the results of one FIS technology transfer initiative: the demonstration of nondestructive pavement evaluation technology (NDT) to cooperating Federal and nonfederal partners. The demonstrations utilized Falling Weight Deflectometer (FWD) technology, a commercially available nondestructive procedure for determining the structural adequacy of a pavement system. Data obtained from FWD tests were combined with pavement material properties and estimated future traffic volumes to design rehabilitation strategies for the existing streets and roadways of three communities.
The specific objectives of the study were to:
• Evaluate and develop improvements to the initial guide specification used for contracting FWD technology.
• Evaluate the three analytical methods used by each contractor to develop the pavement repair strategies.
• Document and explain the differences in the results of the pavement evaluation methods.
• Document the benefits of FWD technology over other conventional techniques.
• Transfer nondestructive testing of pavements technology to non-federal partners, and demonstrate how analysis of the test results can be used to develop rehabilitation strategies for roadway pavements.
@ EXECUTIVE SUMMARY vii

STUDY APPROACH
The technology transfer plan consisted of selecting three demonstration sites, awarding contracts to engineering firms to test, evaluate, and recommend rehabilitation strategies for the roadways, and conducting a seminar at each site for roadway planners, designers, and managers.
The demonstrations were undertaken in coordination with the Federal Highway Administration (FHWA) and the American Public Works Association (APWA). The three communities selected as demonstration sites were: Warren County, Mississippi, Cincinnati, Ohio, and Berkeley, California.
Separate Cooperative Research and Development Agreements were made between WES and the three local governments in order to acquaint them with a process for using guide specifications for obtaining vendor services to nondestructively test and assess their pavement's structural adequacy.
Each agency selected approximately twenty-five miles of local roads to be tested, with the roadways generally containing asphalt concrete (AC), portland cement concrete (PCC) , and overlay pavements (asphalt concrete over portland cement concrete).
Specifications were prepared for testing the pavements, analyzing the test results, and developing rehabilitation strategies for each road. Contracts were awarded to two small businesses to perform the tasks required in the specifications: Dynatest Consulting, Inc. for Warren County and Cincinnati, and Engineering & Research International, Inc. (ERI) for Berkeley. Dynatest subsequently subcontracted the testing and evaluations for the Cincinnati site to Soil and Materials, Inc.
TECHNICAL CHARACTERISTICS
A total of 142 roadway sections ranging from 0.02 to 8.1 miles were included in the three tests (Table 1). Three different procedures were used to analyze data obtained from NDT and to provide overlay designs at each site.
These methods included the WES layered elastic procedure (an extensively tested, computerized methodology based upon multilayered elastic models and limiting stress/strain criteria), the American Association of State Highway and Transportation Officials (AASHTO) Guide for Design of Pavement Structures, and either Dynatest's or ERI's own methods (see Table 1).
Rehabilitation strategies were developed for each roadway section based on expected design lives of 5, 10, and 20 years. The recommendations were based on overlay thicknesses recommended by each analysis method, visual condition and amount of distress observed on the roadway, ride quality noted during a tour of each site, and the amount of traffic estimated for the time periods.
Recommendations were also based on engineering judgment and the constraints of typical construction and maintenance practices at the demonstration site. The tabulation of alternative rehabilitation strategies for each demoristration, tabulated by roadway section, is presented in Appendices F, Hand K.
viii EXECUTIVE SUMMARY @

Table 1. Testing and Evaluation Data for Demonstration Sites
Site No. Sections Section Test Equi~ment Design Length Procedures {miles}
Warren County, 8 0.9-8.2 HW01 AASHT02
MS ELMOD3
WES4
Cincinnati OH 22 0.29-3.19 HWD AASHTO ELMOD
WES
Berkeley, CA 112 0.02-0.81 KUAB 2m-FWDs AASHTO ERI6 WES
SUMMARY OF RESULTS
Each method used to analyze the NDT data and determine overlay requirements for the roadway sections provided a different thickness. On average, the WES procedure produced overlay thicknesses that were within one-inch of the other methods for asphalt concrete (AC) pavements and three-inches higher for portland cement concrete (PCC) pavements. Average WES overlay thicknesses for composite pavements were within 2-inches of the AASHTO values and four to six-inches lower than the DynatestiSME values. These comparisons are valid for the specific analysis methods used and assumptions made by the contractors for these specific pavements, and results should not be interpreted as typical or representative of the differences that can be encountered with other procedures or contractors.
1 Dynatest 8081 Heavy Weight Deflectometer Test System.
2 American Association of State Highway and Transportation Officials Guide for Design of Pavement Structures.
3 Dynatest's Evaluation of Layer Moduli and Overlay Design, and companion ELCON (ELmod for CONcrete).
4 U.S. Army Waterways Experiment Station's Layered Elastic Procedure.
s KUAB Two Mass Falling Weight Deflectometer.
6 Engineering & Research, Inc. evaluation procedure.
@ EXECUTIVE SUMMARY ix

The differences between overlay thicknesses determined from the various evaluation methods can be attributed to a number of factors. The thicknesses recommended are directly related to the performance criteria selected. With layered elastic procedures, stresses and strains are computed at critical locations within the pavement system for the design vehicle. Limiting values of stress/strain are applied to translate from the analytical models to field performance. These limiting criterion are typically empirically derived from observed field performance or laboratory test results (WES, Dynatest/SME, and ERI performance criteria are presented graphically in Chapter 4, Figures 4-6).
For example, it is interesting to note that for flexible pavements the WES results will be more conservative for lower traffic levels (less than 500,000 vehicle coverage) and less conservative for higher traffic levels (greater than 500,000 coverage). It should also be noted that Dynatest/SME applies both a tensile stress criteria to the PCC and a stress criteria to the unbound layers. This stress criteria contributed significantly to the larger overlays reported for the composite pavements. In contrast, the asphalt strain criteria for flexible pavements is similar for each of the methods, with the WES procedure being slightly more conservative at the lower traffic levels.
When selecting an evaluation procedure, it is important to consider the type of performance criteria and how the criteria was developed. For example, if the anticipated traffic levels are extremely high, it may not be wise to select limiting criterion based on limited field or lab tests in which failures occurred at low coverage or repetition levels.
Another illustration of a criteria consideration is the method of analyzing composite pavements. In the WES computer programs, a composite pavement is analyzed using rigid pavement criteria. This does not mean, however, that all composite pavements should be treated as rigid pavements. If the modulus of the PCC layer is low (less than 1,000,000 psi), the pavement should be analyzed as a flexible pavement. In the case of very thick AC overlays, judgement is required to determine which failure mechanism is most likely to occur.
In addition to the criteria, the back-calculation procedures, methods of handling past fatigue damage, and other method-specific considerations can also cause a wide range of results. One of the first steps in the evaluation process, material characterization, is a difficult task that often requires a great deal of engineering judgement to obtain reasonable results. The assessment of damage that has already occurred in a pavement is also often difficult to define and incorporate into the analysis process.
Although the structural overlay requirements were found to vary significantly depending on the method used, no one method was found to be more accurate than another. However, it is recommended that a minimum of two methods always be used for determining overlay thicknesses so the designer has sufficient information for developing rehabilitation strategies.
Results from this study have shown that NDT is a viable technique for evaluating the structural capacities and overlay requirements for roads and streets. Analysis of the deflection test data has been shown to be a complex task with results depending on a number of factors including the selection of criteria, climate, and traffic considerations. Due to this complexity, results can vary significantly depending on the contractor and evaluation methodology. Thus, it is important to consider experience in selecting a contractor for conducting NDT analyses.
x EXECUTIVE SUMMARY @

The WES procedures, which are well accepted methods with extensively documented performance-based criteria, have been presented and are available for use by local municipalities, counties, cities, or contractors. It is. recommended that a well accepted method, such as the WES procedure, is specified for NDT analysis or required as a check if other new or less known procedures are used.
CONCLUSIONS
The demonstrations confirmed that the pavement related research performed at WES can be directly applied to roads, streets, and highways. Observations made during this project and comments/suggestions provided by personnel representing the three demonstration sites include the following:
• The methods used to analyze the data obtained with a FWD are dependent on traffic data; therefore, in order to obtain meaningful overlay designs, the traffic estimates must be accurate and realistic.
• The information obtained from construction and maintenance records was helpful, but was not always accurate. The thickness of each existing pavement layer within a pavement structure is a very important factor used when determining rehabilitation strategies. If historical data is not accurate, these data must be obtained by coring the pavement, which may significantly increase the cost of the procedure.
• In some cases, the rehabilitation procedures did not address the restricted curb and gutter and crown heights of many of the older roads and streets. Roadway design constraints peculiar to the local city/county must be provided in advance since this may impact on the rehabilitation strategies.
• A more detailed comparison of the cost for suggested maintenance procedures to a standard two-inch thick asphalt overlay would have been helpful. This comparison would have provided a cost analysis to determine the feasibility of NDT.
• The difference between the three methods used for analyzing the NDT results and providing rehabilitation strategies for each roadway are primarily attributed to the different procedures used by the design programs for analyzing the NDT results and accounting for the existing pavement thicknesses. In the future, the method used for determining overlay thicknesses should be specified in the guide specifications.
BENEFITS/SAVINGS
Rehabilitation requirements from NDT can be used effectively for formulating budget plans and prioritizing projects as an integral part of a comprehensive pavement management system. With the high cost of rehabilitation and the increasing traffic levels nationwide, pavement management systems are proving to be extremely cost effective, with benefits being realized within the first three years after implementation.
While no systematic comparison of benefits and costs accruing to users of this technology was made as part of these demonstrations, the analysis of such data for one particular case may be instructive. In Berkeley, California, contract costs for using the FWD amounted to $50,000. Berkeley officials
@ EXECUTIVE SUMMARY xi
reported that the use of the FWD technology enabled the city to revise their current and future pavement rehabilitation schedule, allowing the city to safely postpone a significant amount of the roadwork originally planned for the current year. This resulted in an estimated 1994 savings of $825,0000 in materials, and $125,000 in labor. Although such results do not reflect a rigorous time series analysis of future outlays, it provides an insight into the potential for using NDT to develop cost effective pavement rehabilitation strategies.
xii EXECUTIVE SUMMARY @

Conversion Factors, N on-SI to SI Units of Measurement
Nondestructive Testing, Evaluation, and Rehabilitation for Roadway Pavements
Non-SI units of Measurement used in this report can be converted to SI units as follows:
Multiply By To obtain
feet 0.3048 meters
inches 2.54 centimeters
miles (U.S.statute) 1.609347 kilometers
tons (2,000 pounds, mass) 907.1847 kilograms
@ CONVERSION FACTORS xiii

1. INTRODUCTION
STUDY OBJECTIVES
Nondestructive Testing, Evaluation, and Rehabilitation for Roadway Pavements
Falling Weight Deflectometer (FWD) technology is a commercially available nondestructive procedure for determining the structural adequacy of a pavement system. The data obtained from the FWD tests combined with pavement material properties and estimated future traffic volumes can be used to design rehabilitation strategies for existing streets and roadways. The objectives of this study were to:
a. Evaluate and develop improvements to the initial guide specification used for contracting FWD technology.
b. Evaluate the analytical methods used to develop the pavement repair strategies for three local jurisdictions.
c. Document and explain the differences in the results of the pavement evaluation methods.
d. Document the benefits of FWD technology over other conventional techniques.
e. Transfer nondestructive testing (NDT) of pavements technology to non-federal partners, and demonstrate how analysis of the test results can be used to develop rehabilitation strategies for roadway pavements.
HISTORY
Pavement design and evaluation methods for flexible and rigid pavements were developed from numerous performance tests, theories, and studies beginning in 1926 for rigid pavements with the Westergard analysis and 1947 for flexible pavements with full-scale test pavement using actual aircraft loadings. The procedures that resulted from the study and interpretation of these performance tests were used to design and evaluate several hundred military airfield pavements throughout the world and are documented in numerous reports. The first generation evaluations depended on direct sampling of pavement layers to determine either the modulus of subgrade reaction (k) from plate bearing tests on rigid pavements or the California bearing ratio (CBR) on flexible pavements.
Nondestructive test procedures for pavement evaluation have been developed by WES through years of research sponsored by the Army, Air Force, and Federal Aviation Administration (FAA). WES started vibratory testing of pavements in search of NDT procedures in the mid-1950's. Initial work in
@ INTRODUCTION 1

NDT was concentrated in the area of airport pavements. During the 1950's and 60's, accepted methods for evaluating the load-carrying capacity of airport pavements required direct sampling techniques that were both costly and time-consuming. Often, direct sampling required the closing of a pavement facility to traffic operations, which in turn necessitated the rerouting and/or rescheduling of aircraft.
With substantial increases in traffic operations (that is, takeoffs and landings), closing a pavement facility, even briefly, could result in delay of a mission and higher costs to air carriers. Increasing aircraft loads and aging pavement systems made accurate and frequent evaluations of both civil and military pavements extremely important to the airport owner/operator since many facilities would need strengthening or rehabilitation to meet increased demands.
These considerations dictated the need for test equipment, data collection techniques, and evaluation methodologies to satisfy the requirement for a rapid NDT procedure for valuating the loadcarrying capacity of pavements with a minimum of disturbance to normal operations. Even though the early work dealt with airport pavements, similar procedures were later applied to NDT of roads and streets.
Early work (pre-1967) suggested that deflections caused by vibratory loadings on pavement could be used in an evaluation procedure if properly correlated with the performance of pavement. The test sections of the WES full-scale multiple-wheel heavy gear load study conducted during 1969-1970 were used to validate the pavement performance to deflection. Tests to determine load-deflection relations (dynamic stiffness modulus (DSM) values and wave propagation results) were conducted periodically during this study. An analysis of the results showed that the DSM values correlated well with the performance data while wave propagation results were erratic. Further studies of the correlation between DSM and pavement performance were conducted at military airfields by applying vibratory loadings and comparing the resulting DSM with allowable loadings determined using existing evaluation criteria. A 16-kip vibrator was then constructed to produce peak vibratory loadings up to 15,000 lbs at frequencies ranging from 5 to 100 Hz, thus producing a combined static plus peak dynamic load of 31 kips, approximately equal to one wheel load of the C-5A aircraft.
WES 16-KIP VIBRATOR - DSM EVALUATION PROCEDURE
In 1972, the FAA sponsored a study to develop a workable nondestructive evaluation procedure for airport pavements. Based upon available data, the use of the DSM-pavement performance method was selected as the most applicable procedure to be developed at that time. The most important phase of the study was the development of correlations between the nondestructive test results and the evaluation of the load-carrying capacities of the pavement by direct sampling procedures. Available pavement performance data from full-scale accelerated traffic tests and condition surveys of airports conducted over a 30-year period were used in this phase of the study. The correlation was made by performing both nondestructive and direct sampling tests at the same locations on several airport pavements representing a range of pavement conditions. The NDT data collected included DSM values, deflections for frequency sweeps from 5 to 100 Hz, deflection basin measurements, and wave propagation data. Direct sampling data collected included the thicknesses of all layers of material comprising the pavement, foundation strength values (CBR or k), concrete flexural strengths, and material properties.
The convenience and desirability of nondestructive pavement evaluation had led to the development of several types of nondestructive testing devices capable of measuring load-deflection
2 INTRODUCTION @

responses of pavements. However, since the characteristics of these devices vary, different measurements on the same test site can be expected from each. Therefore, the WES 16-kip vibrator was selected as the standard vibrator for the comparison tests because it was readily available and it had been developed to produce a range of loadings including the largest vibratory load possible with any of the transportable equipment.
Several obvious shortcomings of the DSM procedure were realized. The empirical nature of the procedure (correlations between DSM and allowable load) somewhat limited the applicability to conventionally constructed pavement structures. Another disadvantage was that the procedure was inherently tied to one particular device, the 16-kip vibrator.
In the early 1980's, the Army funded a project to develop a DSM procedure for evaluating roads and streets based on NDT results for a small vibratory device, the Road Rater. The procedure was published in 1984 and has been used by the Army.
LAYERED ELASTIC PROCEDURE
Growing acceptance and convenience of NDT led to widespread use of various NDT devices and procedures to evaluate the load-carrying capability of pavements for air carrier and highway pavements in the late 1970's. During this time, the FAA sponsored a study to evaluate commercially available NDT devices for use on light aircraft pavements and develop a methodology for evaluation of light aircraft pavements based upon multilayered elastic models and limiting stress/strain criteria.
From this work, it was determined that the deflection basin produced by applying a load to the pavement with an NDT device gives input parameters to the system analysis that can be used to derive the stiffness parameters of the pavement layers. A computer program was developed utilizing a layered elastic system to determine a set of modulus values that provide the best fit between a measured deflection basin and a computed deflection basin when given an initial estimate of the modulus values, a range of modulus values, and a set of measured deflections.
The original work, presented for evaluation of light aircraft pavements using a small vibratory NDT device, has been expanded to include the evaluation of all airport and highway type pavements using NDT results from a variety of vibratory or impulse type equipment. Limiting stress/strain criteria were extracted from design procedures developed under joint FAA-Army funding. The layered elastic criteria
. has been calibrated with earlier performance based criteria. The layered elastic procedure provides several advantages that make it a desirable alternative to the DSM procedure. One major factor is that it provides a rational approach for characterizing and analyzing pavement structures. This allows for consideration of a variety of material types including stabilized layers, new materials, etc. Also, material properties for all layers in a pavement system can be better defined in terms of modulus. Evaluation techniques and computer software have been developed in conjunction with the layered elastic evaluation methodology.
CURRENT STATUS
The DSM procedure based on NDT with the WES 16-kip vibrator was adopted by the FAA and Army in the late 1970's for evaluation of airport pavements. NDT was performed at approximately 150 FAA airports between 1970 and 1985 and 48 Army airfields were evaluated between 1982 and 1987.
@ INTRODUCTION 3

Use of this equipment and procedure has been phased out in favor of the newly developed layered elastic procedure which can make use of NDT results from smaller, less costly test equipment.
The WES layered elastic procedure has been finalized and extensive associated computer software developed. A layered elastic pavement evaluation procedure was presented to the Navy in 1986. The procedure, utilizing NDT results from a falling weight deflectometer (FWD), was adopted for use by the Air Force in 1986 and is now being used for Army airfield evaluations. The Army has also funded a project to expand the layered elastic procedure to include evaluation of Army roads and streets.
The elastic layer procedure has been evaluated, along with a number of commercially available NDT devices, under a jointly funded Army, Air Force, Navy, and FAA NDT comparative study that began in late 1987. This effort involved side-by-side NDT on a range of pavement types and thicknesses. Direct sampling was conducted on each of the pavement sections and undisturbed samples of the subgrade materials obtained for laboratory resilient modulus testing. Variability of test equipment and evaluation results was evaluated. The data and equipment calibration results have been published in a Phase I report (1989). Results from all NDT devices were used to evaluate each section with the layered elastic procedure. A Phase II report will include an evaluation of the equipment and procedures.
BENEFITS/SAVINGS
The major benefit of improved NDT techniques from an Army viewpoint is obviously that it provides a safer and more reliable military pavement system which is of great importance to National defense. Several benefits are realized from the operations side. First, NDT provides rapid and reliable determinations of load-carrying capacities and overlay requirements needed to support current or anticipated traffic. NDT is essential to the effective utilization of a pavement management system. For example, timely structural evaluations will indicate the need for minor maintenance or rehabilitation efforts as compared to much more costly alternatives that can result from allowing the pavement to deteriorate to a failed condition. Increased efficiency due to more compact and computer controlled equipment results in substantial cost savings. NDT can be conducted with minimal disturbance to normal traffic flow, thus detailed evaluations can be conducted safely and economically.
A list of publications that document the development and evaluation of NDT technology and equipment is provided in the Bibliography. The publication by Van Cauwelaert, F. J. et ai, 1989 describing a computer program developed for back-calculating pavement layer moduli from measured surface deflections, and the publication by Bentsen, R. A. et aI, 1989 describing the evaluation of seven NDT pavement testing devices will provide the reader a general background of the technology.
STUDY APPROACH
Separate Cooperative Research and Development Agreements were made between WES and three local public works agencies to acquaint the agencies with a process for using guide specifications to obtain vendor services to nondestructively test and assess their pavement's structural adequacy. Each agency selected approximately twenty-five miles of local roads to be tested. Specifications were prepared for testing the roads, analyzing the test results, and developing rehabilitation strategies for each road. Contracts were awarded to small businesses to perform the tasks required in the specifications. After the contractors completed their work, they participated in seminars that included a presentation of their
4 INTRODUCTION @

results, rehabilitation strategies, and a demonstration of their equipment to local personnel responsible for designing and maintaining roads.
PROBLEM STATEMENT
Many of the highways, roads, and streets managed by state and local governments across the United States require major rehabilitation. Most of these pavements are repaired by applying a standard thickness of an asphalt overlay on top of the original pavement structure. For example, it is common practice in some local government organizations to recommend applying a 2 inch asphalt overlay to any pavement requiring rehabilitation. This is not cost effective. Some pavements are structurally sound and a much less expensive surface treatment would provide the rehabilitation required. Some pavements are severely overloaded and a 2 inch overlay only lasts 6 months before rutting and/or cracking reoccurs. Designing a durable and economical overlay requires knowledge of the pavement's structural capacity. With a nondestructive evaluation procedure using a FWD, the structural adequacy of a pavement can be assessed, and materials properties can be determined for use in designing rehabilitation strategies that will reduce life cycle costs.
During preparation of the contract and statement of work/specifications (Appendix A) for obtaining the FWD technology/ services, several problems incurred that had to be resolved. WES had a list of sixteen engineering and consultant firms that were experienced in providing the required services, but this was not inclusive of recently formed companies that were qualified to perform the services requested. A notice was published in the Commerce Business Daily to alert interested companies of the technology transfer project and request solicitations for bid. Twenty-three companies responded to the published notice. Since this contract was set aside for small businesses (average annual sales receipts equal no more than $2.5 million per year for the previous three years), only eight companies submitted proposals to our solicitation for bid. For this demonstration, we wanted to limit the type of equipment used and define the test procedures for evaluating the pavements. To accomplish this, an American Society for Testing and Materials (ASTM) standard test method was specified to define the acceptable equipment and an ASTM standard guide was specified to define the level of work required.
In order to eliminate contractors who were definitely not qualified to perform the requested work, four factors were used to evaluate each proposal. These factors included equipment characteristics and calibration, similar work experience by the firm, ability to complete the work within a short time period, and employee experience/qualifications were listed in the solicitation package. A statement was included in the package that all proposals would be evaluated using these four factors. This is discussed in detail in section two of this report.
COOPERATIVE RESEARCH AND DEVELOPMENT AGREEMENTS
Three Cooperative Research and Development Agreements (CRDA' s) were obtained during this project. They were executed between WES and Warren County, MS, Cincinnati, OR, and Berkeley, CA. The purpose of the CRDA's was to demonstrate and transfer the WES-developed technology of NDT and evaluation of roadways to state and local governments. The local governments agreed to provide WES a prioritized list of streets and roads that required rehabilitation based on their pavement management system. After this list was approved by WES and the local governments, WES agreed to awarded contracts to commercial firms to test, evaluate, and develop rehabilitation strategies for each of the streets. A copy of the CRDA between WES and Cincinnati, OR is provided as Appendix B.
@ INTRODUCTION 5

These CRDA's were the first to be obtained by WES and there seemed to be some caution by the local Office of Counsel in developing the agreements and obtaining final approval from the Assistant Secretary of the Army (Research, Development, and Acquisition), SARDA. After the initial draft of the CRDA with Warren County, MS was submitted to the local Office of Counsel, five months elapsed before it was finalized and forwarded to SARDA for their review and comments. One and one half months were required to obtain approval from SARDA. Warren County officials approved and signed the final CRDA within one week.
While the initial CRDA with Warren County was being approved by the appropriate U.S. Government agencies, CRDA' s were sent to representatives of Cincinnati, OH and Berkeley, CA for their review and comments. Their comments were received within two weeks and incorporated into the documents. These revised CRDA's were then forwarded to Cincinnati and Berkeley for approval by their local officials. The signed CRDA's were received from each city within two weeks. During this time, SARDA informed WES that additional statements should be incorporated into these last two agreements. Therefore, these locally approved agreements were revised and forward to Cincinnati and Berkeley for final.approval. This process required two additional weeks. After the agreements were signed by officials from WES and the two cities, five weeks were required to obtain final approval from SARDA. The purpose of the two previous paragraphs is not to criticize anyone, but to sensitize the reader to the relatively lengthy approval process required to obtain a CRDA. The approved CRDA provided in Appendix C should provide an example for future agreements and hopefully decrease the time required to develop and obtain final approval for a CRDA.
None of these CRDA's were developed and approved in the same manner, therefore, it is not clear exactly how this process should proceed in the future. A suggested schedule of milestones and events would be helpful for those preparing a CRDA.
6 INTRODUCTION @
Nondestructive Testing, Evaluation, and Rehabilitation for Roadway Pavements
2. TECHNOLOGY TRANSFER PLAN
The plan for informing local governments how to use NDT technology to help manage their pavements consisted of selecting three demonstration sites, awarding contracts to engineering firms to test, evaluate, and recommend rehabilitation strategies for the roadways, and conducting a seminar at each site for roadway planners, designers, and managers.
DEMON STRA TION SITE SELECTION
During the initial stages of this project, personnel from WES met with representatives from the Federal Highway Administration (FHW A) and the American Public Works Association (APWA) to coordinate the project and obtain their suggestions and assistance. The FHW A suggested that three demonstration sites should be selected, and these should be located in urban, suburban, and rural areas. They also suggested using the American Association of State Highway and Transportation Officials (AASHTO) Guide for Design of Pavement Structures as one of the methods for analyzing the FWD data and determining overlay requirements.
Three government agencies responsible for construction and maintenance of roadways in their local areas were selected as partners in this technology transfer process. The partners included representatives from Warren County, MS; Cincinnati, OH, and Berkeley, CA. Selection of the partners was based on receptiveness of the agencies, use of a pavement management system, pavements requiring rehabilitation, and funds that could be applied to the roadway rehabilitation strategies that would be recommended. The APW A assisted WES in selecting Berkeley, CA and Cincinnati, OH as the demonstration sites that represented urban and suburban areas, respectively.
Each agency was responsible for providing a prioritized list of roads for evaluation. The prioritization was based on a pavement management system currently being used. WES requested that the list contain asphalt concrete (AC), portland cement concrete (pCC), and overlay pavements (asphalt concrete over portland cement concrete), and that the tota1length of roadways be approximately 25 miles. Included in the list was the length of each road, number of lanes, location, type construction, average daily traffic (ADT), and estimated ADT's for the next 5, 10, and 20 years. The agencies were also responsible for furnishing all pavement design data, and maintenance and rehabilitation records that were available for the roadways.
@ TECHNOWGY TRANSFER PLAN 7

CONTRACTOR SELECTION
After the demonstration sites were selected, WES prepared a statement of work/specifications (Appendix A) that was included in the solicitation for bid. The responsibilities of the government agencies and the contractor were listed in detail.
WES was responsible for providing the contractors with a computer program for evaluating the test data and determining rehabilitation methods for roads. WES also provided instructions to the contractor on how to use the program. As previously discussed, each city/county was responsible for providing a prioritized list of roads for evaluation. The contractor was responsible for conducting the FWD tests, determining pavement thicknesses, traffic control, liability due to accidents, analysis of the data, recommended rehabilitation strategies, a final report, and conducting a seminar that explained the NDT process and demonstrated their NDT equipment at the demonstration site. The PREMEETING listed as item 5 of the appendix proved to be beneficial to both the contractor and representatives from the demonstration site. During this meeting, such things as color of marking paint, local traffic control requirements, peculiar traffic conditions, availability of rehabilitation methods, and accommodations for the seminar were discussed.
A notice stating WES' s intention to award contracts for NDT, evaluation, and subsequent rehabilitation strategies of roadways at three sites was published in the Commerce Business Daily (CBD). Solicitation packages were mailed to those firms that responded to the notice in the CBD and to engineering/consulting firms (Appendix C) that were known to own or have access to FWD equipment, and were experienced with NDT of pavements. A section was included in the package that stated that all proposals would be evaluated using four factors. The four factors were as follows:
a. Equipment characteristics and calibration: minimum output of 9 Kips, and calibration within the past 12 months at a Strategic Highway Research Program calibration site.
b. Documented experience of the firm in similar work on highways or airfields by either reports or references.
c. Ability to complete each/all jobs to include a final report by 15 August 1993 and seminar by 1 September 1993.
d. Experience/qualifications of employees that will conduct the work.
Initially, WES planned to award contracts to three separate firms, one for each demonstration site, so a broader picture of how the requirements of the contract were met could be obtained. Therefore, the contractors were requested to prepare separate bids for each demonstration site, and they were informed that it was WES's intention to award three separate contracts. Each demonstration site was divided into four bid items (the first item contained approximately ten miles of roadway and each of the other three items contained approximately five miles of roadway) so an item could be deleted if funds were not available for testing the entire 25 miles of roadway.
Eight firms provided proposals in response to the solicitation for bid. Dynatest Consulting, Inc. included Soil and Materials Engineers, Inc. in their proposal and explained that Soil and Materials Engineers, Inc. would test and evaluate the roadways at one demonstration site if they were awarded more
8 TECHNOLOGY TRANSFER PLAN @

than one site. A Board of Award was convened and the proposals were scored against the criteria above. Seven of the firms scored 70 percent or higher on the evaluation factors and were considered acceptable. Based on evaluation scores and to some extent bid price, only two firms were awarded contracts. Dynatest Consulting, Inc. was awarded contracts for Warren County, MS and Cincinnati, OH and Engineering & Research International, Inc. was awarded the contract for Berkeley, CA. Three firms were actually involved in the evaluations and demonstrations since Dynatest Consulting, Inc. subcontracted the testing and evaluation of roadways in Cincinnati to Soil and Materials Engineers, Inc.
@ TECHNOLOGY TRANSFER PLAN 9

3. TESTING AND EVALUATION
WARREN COUNTY, MS
Nondestructive Testing, Evaluation, and Rehabilitation for Roadway Pavements
Test Equipment. A Dynatest 8081 Heavy Weight Deflectometer (HWD) Test System was used to generate NDT load-deflection data that was analyzed for this project. Basically, the Dynatest HWD generates a transient, impulse-type load of 25-30 msec duration, at any desired (peak) load level between 6,500 and 54,000 lbf. For this project, test loads of approximately 9,000 lbf were used, corresponding to the effect of a standard 18,000 lbf single axle load, i.e., 9,000 lbf in each wheel path. In addition, one lower HWD load level was used at each test point as well as one higher level on the portland cement concrete sections. Information obtained by the different load levels may be used, if needed, to determine non-linear material behavior of the unbound materials.
Roadway Test Sections. Eight roadways sections that ranged in length from 0.90 - 8.20 miles were included in this project. The local pavement management system employed for selecting these sections was based on visual inspections of the pavement surfaces to determine the condition of each roadway. A table that includes the length, average daily traffic (ADT), and type of surface for each section is provided in Appendix D. Five of the roads were double bituminous surfaced treated rural county roads with ADT's between 505 and 1,986. Two of the roads were constructed of portland cement concrete, and their ADT's were 201 and 8,208. One road was constructed with portland cement concrete and overlaid with asphalt concrete. The ADT for this road was 6,415.
Methods of Analysis. As requested, three methods were used to analyze the data obtained with the HWD and provide overlay designs. Based on the structural condition of the pavements and estimated traffic volumes, these methods were also used to determine overlay thickness requirements. These methods include the WES developed evaluation procedures and software, the 1986 AASHTO Guide for Design of Pavement Structures, and Dynatest's ELMOD method. In addition, the MODULUS Program was used to compare back-calculation results. Descriptions of these methods are provided in Appendix E. Detailed descriptions of these methods are provided in the contractor's final reports, Briggs, R. C. et aI, 1993 listed in the Bibliography. These reports are available for loan from the WES library and may be obtained through your local library.
Field Tests. As stated in the Statement of Work/Specifications, the interval of pavement deflection measurements conformed to the Type II level of testing effort as described in ASTM D 4695, Standard Guide for General Pavement Deflection Measurements, with the exception that the tests were conducted in the outside wheelpaths of the outside lanes only. The test intervals ranged from 100 to 500 feet for flexible pavements and was 100 feet for rigid pavements. Based on data obtained with the HWD, specific locations were selected where pavement cores were obtained.
@ TESTING AND EVALUATION 11

Rehabilitation Strategies. Rehabilitation strategies were developed for each roadway, and in some cases, a roadway was treated as two separate items because of vast differences in types and amount of traffic. The recommendations were based on overlay thicknesses recommended by each analysis method, visual condition and amount of distress observed on the roadway, ride quality noted during a tour of each site, and the amount of traffic estimated for the time periods. The recommendations were also based on engineering judgement and the constraints of typical construction and maintenance practices at the demonstration site. A tabulation of rehabilitation strategies for each roadway section is shown in Appendix F.
As shown in Appendix F, repair strategies were provided for each roadway section based on expected design lives of 5, 10, and 20 years. These alternative designs provided the county with options to link their roadway repair plans to long term municipal growth and community expansion plans. The options also provided cost effective solutions and definite plans for disbursement of funds allotted for roadway repair.
Findings. Each method used to analyze the NDT data and determine overlay requirements for the roadway sections provided a different thickness. These differences usually ranged between 0.1 and 1.5 inches, and were considered insignificant when the minimum standard recommended thickness for an asphalt overlay is one inch. In general, the thickness requirements determine by the WES method were 30 to 50 percent greater that those determined by the AASHTO or ELMOD methods, but this was not always true. There was no consistency between the differences in thickness requirements when comparing the thicknesses determined by the AASHTO method to those determined by the ELMOD method. Based on engineer judgement and calculated thickness requirements, the recommended overlay thicknesses ranged between the smallest and largest calculated values.
Based on the results of these three methods for determining overlay requirements, no one method is more accurate than the other. However, a minimum of two methods should always be used for determining overlay thicknesses so the designer will have a greater amount of information for developing rehabilitation strategies.
After the tasks described in Appendix A were completed, representatives from Warren County and the contractor were requested to provided WES comments concerning the project and suggested improvements to Appendix A. The Warren County road manager was pleased with the project and said the results will give him an accurate assessment of what really needs to be done for pavement repair. He said he could use the results to identify the pavement problems before they really got bad. The contractor suggested that the number of lanes should be included in the list of streets to be tested. He also suggested that the analysis method should conform to either the AASHTO or Corps of Engineers procedures.
ClNClNNATI, OH
Test Equipment. The test equipment was the same as that used in Warren County, MS.
Roadway Test Sections. Twenty-two roadway sections that ranged in length from 0.29 - 3.19 miles were included in this project. The selection of these sections was based on a recent visual survey and evaluation of roadways conducted by an engineering firm. A table that includes the length, ADT,
12 TESTING AND EVALUATION @
and type of surface for each section is provided in Appendix G. Nine of the roads were constructed of asphalt concrete, five were portland cement concrete, and eight were portland cement concrete overlaid with asphalt concrete. The number of traffic lanes ranged from two to six, and the ADT for the roads ranged from 500 to 25,000.
Methods of Analysis. The methods of analysis were the same as those for the Warren County, MS project.
Field Tests. The pavement deflection measurements were obtained as required in the Statement of Work/Specifications, and cores were obtained on each roadway to confirm construction and maintenance records or determine the thicknesses of the pavement structure. For safety purposes, some of the high traffic roads were tested and cored during the night when the traffic was lighter.
Rehabilitation Strategies. Rehabilitation strategies were developed for each roadway, and in some cases, a roadway was treated as two separate items because of differences in types and amount of traffic, pavement structure, and pavement deflection recorded during the testing period. The recommendations were based on overlay thicknesses recommended by each analysis method, visual condition and amount of distress observed on the roadway, ride quality noted during a tour of each site, and the amount of traffic estimated for the time periods. The recommendations were also based on engineering judgement and the constraints of typical construction and maintenance practices at the demonstration site. A tabulation of rehabilitation strategies for each roadway section is shown in Appendix H.
As shown in Appendix H, repair strategies were provided for each roadway section based on expected design lives of 5, 10, and 20 years. These alternative designs provided the city with options to link their roadway repair plans to long term municipal growth and community expansion plans. The options also provided cost effective solutions and definite plans for disbursement of funds provided for roadway repair.
Findings. Each method used to analyze the NDT data and determine overlay requirements for the roadway sections provided a different thickness. These differences usually ranged between 0.1 and 0.5 inches, and were considered insignificant when the minimum standard recommended thickness for an asphalt overlay is one inch. In general, the thickness requirements determine by the ELMOD method were 1 to 3 inches greater that those determined by the AASHTO or WES methods for the concrete pavements that were overlaid with asphalt. Based on engineer judgement and calculated thickness requirements, the recommended overlay thicknesses ranged between the smallest and largest calculated values.
Based on the results of these three methods for determining overlay requirements, no one method is more accurate than the other. However, a minimum of two methods should always be used for determining overlay thicknesses so the designer will have a greater amount of information for developing rehabilitation strategies.
After the tasks described in Appendix A were completed, representatives from the City of Cincinnati and the contractor were requested to provided WES comments concerning the project and suggested improvements to Appendix A. Personnel from the Cincinnati Department of Public Works were pleased with the project and said the results will give them an accurate assessment of the pavements and suggested repair procedures. They said the corings obtained from many of the roadways will provide
@ TESTING AND EVALUATION 13

them with valuable information concerning the thicknesses of the pavement structure. The contractor suggested that a map marked with the location of all of the roads to be tested would have been very helpful, and the traffic estimates for each roadway should include both the number of automobiles and trucks. The contractor also suggested that the analysis method should conform to either the AASHTO or Corps of Engineers procedures.
BERKELEY,CA
Test Equipment. A KUAB Two Mass Falling Weight Deflectometer (KUAB 2m-FWD) which is an impulse loading device that exerts a force similar in magnitude to a moving truck wheel load was used to test the roadways at this demonstration site. The two-mass system was developed to provide a consistently smooth load pulse with a single peak located at the center of the total load duration (time scale). The magnitude of the dynamic load applied to the pavement can be varied from 3,000 to 33,000 lbs by varying the mass and height from which the mass is dropped. A drop sequence of a single load of 6,000 lbf followed by two drops of 9,000 lbf was selected for these tests. The load rise time (time to peak load) is approximately 17 milliseconds, corresponding to a load duration of 34 milliseconds. A load cell measures the magnitude of the dynamic load.
Roadway Test Sections. There were 112 roadway test sections included in this project. The selection of these sections was based on a pavement management system developed by the Metropolitan Transportation Commission located in Oakland, CA. The system is a pavement condition survey determined by visual inspection of the roadway surface and measurement of crack size to determine the severity level of pavement distresses. The length of the sections ranged from 0.02 to 0.81 miles, and the majority of the roadways contained two lanes, although there was one single lane road, and others contained three, four, or five lanes. Three of the roadways were constructed of portland cement concrete, seven were asphalt concrete, and the remainder of the roadways were asphalt concrete over portland cement concrete overlays. The ADT's for these roadways ranged from 500 to 46,000. A table that includes the length, ADT, and type of surface for each section is provided in Appendix I.
Methods of Analysis. Three design procedures were used for structural evaluation and overlay design of the roadways included in this project. These included the WES procedures, AASHTO procedures, and procedures developed by ERI. Descriptions of these procedures are provided in Appendix E. Detailed descriptions of these methods are provided in the contractor's final report, ERES International, Inc .... , 1993 listed in the Bibliography. This report may also be obtained on loan from WES's library through your local library.
Field Tests. Tests were conducted in accordance with Type II level of testing as described in ASTM D 4695 with the exception that the tests were conducted in the right wheel path of the outer traffic lane. When necessary, test locations within a section were adjusted in order to avoid unnecessary obstructions to traffic, severely deteriorated pavement areas, or other safety hazards.
The historical records provided layer thickness information for only 9 of the 112 sections that were evaluated. Due to the limited information on the pavement thicknesses, ERI conducted a comprehensive boring program on the sections. A single boring location was chosen for each pavement section at a location determined to be representative of the overall pavement section according to the results of the NDT. Drilling was performed to the bottom of the granular base layer using a six-inch
14 TESTING AND EVALUATION @
diameter bit. Six-inch diameter core samples were extracted from composite pavement sections and tested for compressive strength.
Results of a 1992 pavement condition survey of the roadways were provided ERI by the city of Berkeley. The pavement condition index (PCI) of the roadways ranged from 40 (fair) to 80 (very good) with the exception of one street that had a PCI of 100. Most of the streets were constructed in the 1950' s and 1960's which indicates that the pavements have been in service for 30 to 40 years.
Rehabilitation Strategies. Rehabilitation strategies were developed for each roadway. If the NDT tests indicated major structural differences in a roadway, the roadway was divided into two separate items before strategies were developed. The engineering evaluations were based on results of the pavement condition survey, nondestructive and destructive testing, and estimated ADT' s for 5, 10, and 20 year time periods. Engineering judgement and the constraints of typical construction and maintenance practices at the demonstration site were also considered. A summary of the maintenance and repair recommendations are shown in Appendix J.
Findings. Generally, the AASHTO method for determining overlay thicknesses for asphalt pavements produced thicker overlays than the WES or ERI methods. But, in most cases the differences ranged from 0.5 to 1.0 inch, and were considered insignificant when the minimum standard recommended thickness for an asphalt overlay is one inch. For composite pavements, the ERI method produced thicker overlay requirements than the AASHTO or WES methods. The contractor based their rehabilitation strategies on the results produced by the ERI method.
After the project was completed, representatives from the City of Berkeley and the contractor were requested to provide WES comments concerning the project and suggested improvements to Appendix A. Representatives from Berkeley said the cones, flagman, and arrow board were sufficient for traffic control on the streets tested, but on high traffic volume roads or highways a much more extensive method for traffic control will be required. They also said that since the police department had been alerted to the testing program, no major problems were encountered. They mentioned that since they had a comprehensive pavement management system, they were able to provide the contractor with accurate traffic volumes, pavement condition data, and unit construction costs, but they had minimal records on the pavement layer thicknesses. This necessitated an extensive boring program by the contractor.
Personnel from Berkeley's Department of Public Works were concerned with differing overlay thicknesses resulting from the three separate methods, especially when one method recommended 0.5 inches, another 2.0 inches, and the third 4.0 inches. They also mentioned that Berkeley like other older cities are restricted by existing curb and gutter and crown height, and no longer have sufficient curb height to receive another overlay, and the rehabilitation strategies did not address these problems. They were also concerned with some of the recommendations where the overlay thickness was less than the material milled from the existing pavement.
BERKELEY'S COMMENTS
Berkeley's general comments concerning the demonstration project were as follows:
@ TESTING AND EVALUATION 15
a. NOT appears to be a valuable tool in designing overlays.
b. They received a large quantity of information that will be useful in terms of planning and design.
c. Based on the results, they will be able to eliminate certain streets from their current overlay program, thereby saving the City $950,000 ($826,000 in material costs and $124,000 in labor costs) that would have been wasted on unnecessary repair.
d. WES' guidelines on issuing a Request for Proposal (RFP) for nondestructive testing will be most helpful to local agencies.
e. A joint procurement project by several local agencies could possibly lower individual costs for NOT.
CONTRACTOR'S COMMENTS
Comments received from the contractor were as follows:
a. In some cases the city/county and the contractor may not be entirely familiar with NOT and design techniques, and there is a potential for large misunderstandings between what the two parties expect and the cost required to obtain the results. (One way to avoid this is to specify the testing and design methods and guidelines to be followed.
b. A map showing the location of each test site should be provided.
c. The percentage of truck traffic should be provided with the AOT's.
d. All construction, maintenance, and repair records for the test sites should be provided. This should be made known at the time of the RFP since this will directly affect the quantity of coring, etc. required.
e. Oesign constraints such as curb and gutter restrictions, no surface treatments allowed, etc. should be made clean prior to the design phase.
f. Make a provision that test point locations may be adjusted to avoid conflicts with intersections, poor visibility, and utilities.
SEMINARS
After the contractor completed testing and evaluating the roadways at a demonstration site, a final report was furnished to the city/county and WES. The contractor was responsible for participating in a seminar at the site. The purpose of the seminar was to inform local personnel of the NOT technology and demonstrate how it can be used with a pavement management system to develop rehabilitation procedures for roads and streets. Pavement engineers, roadway managers, county/city
16 TESTING AND EVALUATION @

administrators, and other personnel responsible for design and maintenance of roadways were invited to attend. Representatives from WES, the demonstration site, and the contractor each participated in a daylong seminar. The major topics presented at each seminar were as follows:
• History of NDT technology
• Description of local pavement management system
• Selection of roadway sections
• Test procedures and data collection
• Discussion of analysis procedures
• Results and recommended maintenance and rehabilitation techniques
• Proper application of NDT technology
• Demonstration of equipment
Approximately 45 people attended the seminars at Warren County and Berkeley, but only seven attended the seminar conducted at Cincinnati. The Cincinnati seminar was poorly attended because it was not widely publicized and another seminar concerning construction and maintenance of roads was conducted during the same time period. During the seminars, there seemed to be considerable interest from the attendees, and many of them requested copies of the final report.
ANALYSIS
Observations made during this project and comments and suggestions provided by personnel who represented the three demonstration sites are as follows:
a. The methods used to analyze the data obtained with a FWD are dependent on traffic data; therefore, in order to obtain meaningful overlay designs, the traffic estimates must be accurate and realistic. If this information is not realistic, the calculated overlay requirements will be incorrect, and the rehabilitated road will be either under designed or over designed.
b. City/county street maps with the selected street segments marked provided an easy method to locate the test sites. During these demonstrations, some of the test sites were impossible to locate when only the beginning and end of the sites were provided in the tabulation of sites. When this occurred, personnel from the local office were required to physically show the contractor the location of the site.
c. The information obtained from the construction and maintenance records was helpful, but was not always accurate. The inaccuracies were partially due to the fact that many of the roadways were 30 to 50 years old, and some of the maintenance procedures conducted during the years were not entered into the records. The thickness of each existing pavement layer
@ TESTING AND EVALUATION 17

within a pavement structure is a very important factor used when determining rehabilitation strategies. If historical data is not accurate, these data must be obtained by coring the pavement. If the contractor is required to core the pavement, the cost of the contract will increase significantly.
d. Items discussed during the premeeting that helped the contractor proceed in a timely manner included discussion of local procedures for traffic control, roadway rehabilitation procedures, color of marking paint to use, and unusual traffic conditions on certain roadways.
e. In some cases, the rehabilitation procedures did not address the restricted curb and gutter and crown heights of many of the older roads and streets. At times, the recommended thickness of overlay would result in a pavement surface located above the top of the curb. Roadway design constraints peculiar to the local city/county should be made at the premeeting since this will effect the rehabilitation strategies.
f. A more detailed comparison of the cost for suggested maintenance procedures to a standard 2 inch thick asphalt overlay would have been helpful. This comparison would have provided a cost analysis to determine the feasibility of NDT.
g. Comparison of the three methods used for analyzing the NDT results and providing rehabilitation strategies for each roadway were confusing. In some cases, one method may require no overlay, whereas another method may require an overlay thickness of three inches. These differences are attributed to the different procedures used by the design programs for analyzing the NDT results and accounting for the existing pavement thicknesses. In the future, the method used for determining overlay thicknesses should be specified in the guide specifications.
h. The city and county representatives received a large quantity of information on their roadways. Not only was information such as thicknesses of the pavement layers obtained, but based on the results of these demonstration, some of the streets and roads originally scheduled for rehabilitation will not be repaired.
i. It would be cost effective to have one contractor evaluate the roadways of two or more adjacent communities during the same time period. Since it is expensive for a contractor to mobilize and bring his equipment into an area, it would be economically advantageous to have a contractor test roads in more than one community while his equipment is in the vicinity.
18 TESTING AND EVALUATION @

4. SUMMARY OF RESULTS
Nondestructive Testing, Evaluation, and Rehabilitation for Roadway Pavements
The purpose of this project was to introduce personnel at the city, county, and municipality levels to NDT technologies. They should be aware of the DOD/DOT research efforts conducted over the past decade. The pavement related research performed at WES can be directly applied to roads, streets, and interstate highways. Rehabilitation requirements from NDT can be used effectively for formulating budget plans and prioritizing projects as an integral part of a comprehensive pavement management system. With the high cost of rehabilitation and the increasing traffic levels nationwide, pavement management systems are proving to be extremely cost effective, with benefits being realized within the first three years after implementation. In the case of Berkeley, CA benefits were immediately realized, saving the city a one-year total of $950,000.00 ($826,000.00 in material costs and $126,000.00 in labor costs). With an initial contract cost of $50,000.00, the NDT technology provided a 19 to 1 return on investment.
Each contractor analyzed the selected pavements using the WES procedures, AASHTO procedures, and their own methods. Based on NDT and visual condition assessments, rehabilitation alternatives were provided for 5-, 10-, and 20-year traffic projections. Structural overlay requirements were found to vary significantly depending on the analysis method used. The AC overlay thicknesses for Warren County, Cincinnati, and Berkeley are shown in Figures 1-3. The Dynatest/SME and AASHTO overlays, plotted in Figures 1 and 2, are actually the mean plus one standard deviation, which is the contractor's recommendation for these sections. WES values are based on a representative data set for each pavement section which should provide a value near the mean. AASHTO values are based on a reliability level of 50 percent. On the average, the WES procedure produced overlay thicknesses that were within ± 1 inch of the other methods for asphalt concrete (AC) pavements and 3 inches higher for portland cement concrete (PCC) pavements. Average WES overlay thicknesses for composite pavements were within ± 2 inches of the AASHTO values and 4-6 inches lower than the Dynatest/SME values. These comparisons are valid for the specific analysis methods used and assumptions made by the contractors for these specific pavements, and results should not be interpreted as typical or representative of the differences that can be encountered with other procedures or contractors.
The differences between overlay thicknesses determined from the various evaluation methods can be attributed to a number of factors. The required thicknesses are directly related to the performance criteria selected. With layered elastic procedures, stresses and strains are computed at critical locations within the pavement system for the design vehicle. Limiting values of stress/strain are applied to translate from the analytical models to field performance. These limiting criterion are typically empirically derived from observed field performance or laboratory test results. WES, Dynatest/SME, and ERl performance criteria are presented graphically in Figures 4-6. Direct comparisons of the strain-based and stress-based criteria may be difficult, however, although the plots do illustrate why different results are obtained from each method.
@ SUMMARY OF RESULTS 19

WARREN COUNTY OVERLAY COMPARISON
8 ,--------------------------------------------------------------------
+--------1 C=::J AASHTO
6 +-------1 - DYNATEST/SME f----------------------------------+i -WES
~ 5 +-------~============~--------------------~~~~ ~ ffi 4 +-~==~-------------------------~~--~ > o ~ 3 +-------~~~--_._r-----------~~--------~
2
o o «
o « o « o « o « o « o « o «
o «
PAVEMENT SECTIONS
o « o o "-
Figure 1. AC overlay thicknesses computed for the Warren County, Mississippi pavements (AASHTO and Dynatest/SME values = mean + 1 standard deviation).
9
., ~5 III > 04
~ 3
o
-
C=:JAASHTO
_ DYNATESTISME
-WES
1"'1
JU tJ IllIJ.
CINCINNATI OVERLAY COMPARISON
1""'\ rI. I I~m. .J lr ~ I
Figure 2. AC overlay thicknesses computed for the Cincinnati, Ohio pavements (AASHTO and DynatestlSME values = mean + 1 standard deviation).
20 SUMMARY OF RESULTS @

BERKELEY OVERLAY COMPARISON
C==:J AASHTO
+--------------____ -I_ER1
-WES
PAVEMENT SECTIONS
Figure 3. AC overlay thicknesses computed for the Berkeley, California pavements.
z ~ t; 0.1 ~ ~ :i (!) .. ::> "'~ :;(~ 0.01 u z iii'" I--~ )0...
ii! ~ 0.001 g «
0.0001
10
~
FLEXIBLE PAVEMENTS· SUBGRADE CRITERIA SUBGRADE: E= 10 KSI
~ WES- VERTICAlSUBG STRAIN
~ ERI- VERTICAL SUBG STRAIN
--DYNATEST/SME - vERTICAlSUBG STRESS
~ t--... -..... ~ ~
:-.....
100 1000 10000 100000 1000000
VEHiClE COVERAGES
1000
100
10
--.
10000000
Figure 4. Comparison of subgrade stress and strain criteria used for evaluating flexible pavements.
is t; ~ « '" (!) .. ;;: ~'" «'" ue:. iii ~
~ ~
@ SUMMARY OF RESULTS 21
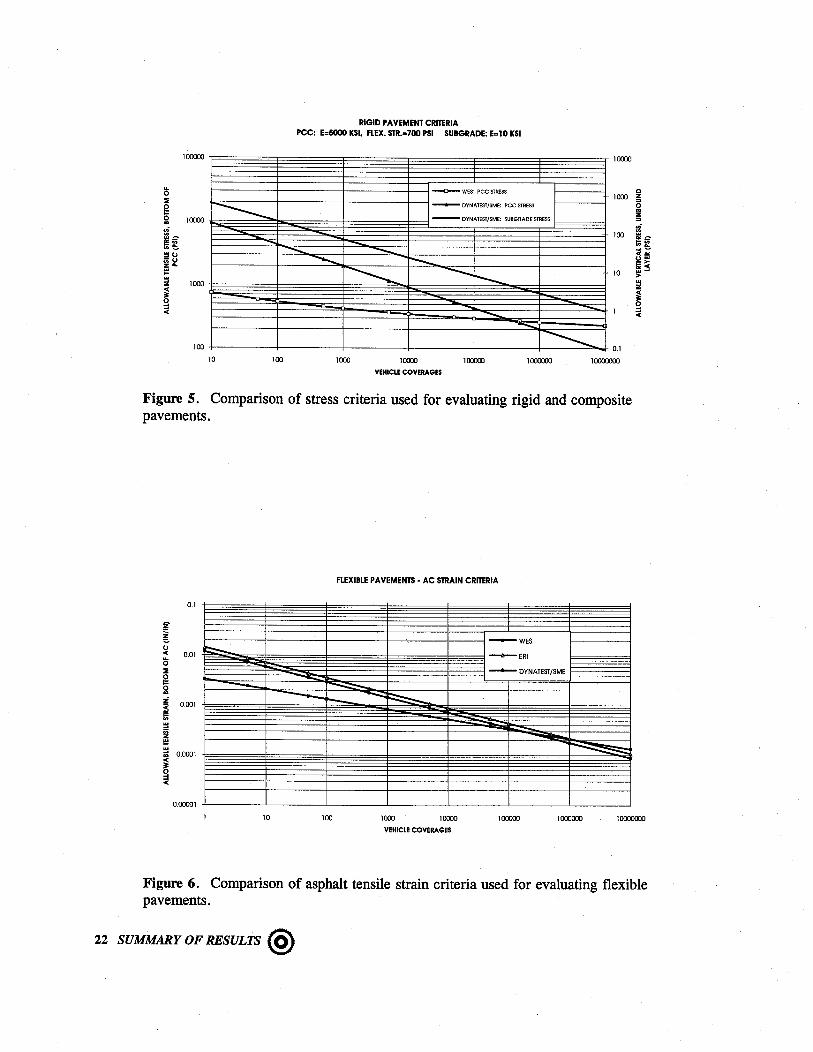
100000
0 :IE
~ 10000 r----,,;
i!~ t;~ ~O ;;;0 ZOo i!! iii! 1000
~ 0 ::I «
100
10 100
RIGID PAVEMENT CRITERIA PCC: E=5ooo KSI, FLEX. STR.=700 PSI SUBGRADE: E=10 KSI
10000
~WES: PCCSTRESS 1000
_____ DYNATEST/SME: pee STRESS
DYNATEST/SME: SUBGRADE STRESS
100
-- ----- r--~ ---- 10
-- ---- 0.1
10000000 1000 HooO VEHICLE COVERAGES
100000 1000000
Figure 5. Comparison of stress criteria used for evaluating rigid and composite pavements.
FLEXIBLE PAVEMENTS· AC STRAIN CRITERIA
0.1
g ~ ----WES 0 « 0.01 0
t:::::- -ERI
:IE - DYNATEST/SME g ~ ~ 0.001 «
- -=------!J; ~
~ i!! ~ 0.0001
~ ~
«
0.00001
Q z = ~ Z = ic :~ « ... Ow S; > iii! ~ 0 ::I «
10 100 1000 10000 100000 1000000 10000000
VEHICLE COVERAGES
Figure 6. Comparison of asphalt tensile strain criteria used for evaluating flexible pavements.
22 SUMMARY OF RESULTS @

In comparing the criteria, it is interesting to note the slopes of the various performance curves. It can be seen in Figure 4 that the slope of the Dynatest/SME tensile stress relationship is much steeper than the WES curve. This means that WES results will be more conservative for lower traffic levels (less than 500,000 vehicle coverage) and less conservative for higher traffic levels (greater than 500,000 coverage). It should also be noted that Dynatest/SME applies both a tensile stress criteria to the PCC and a stress criteria to the unbound layers. This stress criteria contributed significantly to the larger overlays reported for the composite pavements. The asphalt strain criteria for flexible pavements, shown in Figure 5, is similar for each of the methods, with the WES procedure being slightly more conservative at the lower traffic levels. The subgrade criteria for flexible pavements, presented in Figure 6, indicates that the WES and ERI criteria are very similar, and, in fact, the ERI criteria is based on previous Corps of Engineer research efforts. DynatestlSME methods utilize a stress-based criteria for the unbound layers. When selecting an evaluation procedure, it is important to consider the type of performance criteria and how the criteria was developed. For example, if the anticipated traffic levels are extremely high, it may not be wise to select limiting criterion based on limited field or lab tests in which failures occurred at low coverage or repetition levels. The traffic levels for the roads and streets included in this study ranged from approximately 5,000 up to 2,000,000 equivalent single axle coverage.
Another criteria consideration is the method of analyzing composite pavements. In the WES computer programs, a composite pavement is analyzed using rigid pavement criteria. This does not mean, however, that all composite pavements should be treated as rigid pavements. If the modulus of the PCC layer is low (less than 1,000,000 psi), the pavement should be analyzed as a flexible pavement. In the case of very thick AC overlays, judgement is required to determine which failure mechanism is most likely to occur.
In addition to the criteria, the back-calculation procedures, methods of handling past fatigue damage, and other method-specific considerations can result in a wide range of results. One of the first steps in the evaluation process, material characterization, is a difficult task that often requires a great deal of engineering judgement to obtain reasonable results. The assessment of damage that has already occurred in a pavement is difficult to define and incorporate into the analysis process. Many procedures attempt to define the loss of pavement life in terms of the existing surface condition. When results are reported for the AASHTO method, it is important to know which AASHTO procedure has been used. AASHTO has both NDT and pavement condition methods. AASHTO overlay requirements are also specified in terms of reliability. Overlay requirements for an 80-percent reliability level will be significantly higher than those determined for 50-percent reliability. Some of the AASHTO overlay thicknesses, reported by ERI, doubled depending on the reliability level specified.
Results from this study have shown that NDT is a viable technique for evaluating the structural capacities and overlay requirements for roads and streets. Analysis of the deflection test data has been shown to be a complex task with results depending on a number of factors including the selection of criteria, climate, and traffic considerations. Due to this complexity, results can vary significantly depending on the contractor and evaluation methodology. Thus, it is important to consider experience in selecting a contractor for conducting NDT analyses. The WES procedures, which are well accepted methods with well documented performance-based criteria, have been presented and are available for use by local municipalities, counties, cities, or contractors. It is recommended that a well accepted method, such as the WES procedure, is specified for NDT analysis or required as a check if other new or less known procedures are used.
@ SUMMARY OF RESULTS 23

Nondestructive Testing, Evaluation, and Rehabilitation for Roadway Pavements
5. RECOMMENDATIONS REGARDING A SPECIFICATIONS TEMPLATE
Personnel from the three demonstration sites and attendees at the seminars were informed how NDT of their roadways can be used as a tool for developing rehabilitation strategies. At each site, the NDT equipment and testing procedures were demonstrated to the attendees.
Based on the results of this project, additional items have been suggested for the specification template used for requesting bid proposals to nondestructively test, evaluate, and develop rehabilitation strategies for roadways. These model specifications are provided in Appendix K. Additions to the original specification (Appendix A) are as follows:
a. In paragraph 1 (see Appendix K), the specifications were modified such that contractor is requested to provide rehabilitation strategies based on average daily traffic projections (ADT's) of 5, 1O,and 20 years. These strategies should provide the city/county with multiple alternatives that can be used to develop the most cost effective use of roadway maintenance funds.
b. Paragraphs 2.a. and 2.b. call for a more extensive description of the test sites and their location (including a location map) to provide the contractor with sufficient information required to prepare a bid proposal.
c. Paragraphs 2.c. and 3.b. concerning the collection of pavement layer thickness data were added because this data is required during the analysis and design of overlays for the roadway structures. If this data is not available, the contractor must include the collection of this data in his cost estimate. Collection of this data may become quite involved when ~derground utilities are present.
d. In paragraph 3.a., the level of testing effort should be selected by the city/county based on how the test data will be used. Three levels are provided in the model: limited testing for a general overview of the pavement condition, a routine analysis for overlay design projects, and a detailed analysis for evaluation of joint efficiency for portland cement concrete slabs.
e. Paragraph 3.e. was added because properties of the pavement materials are required for analyzing the test data.
f. The AASHTO and Corps of Engineers analysis and design methods are suggested in the template because they are well known accepted procedures.
@ RECOMMENDATIONS 25

g. Five specific items were added to the PREMEETING paragraph to ensure that the contractor obtains the historical records required to complete the tasks, and that design constraints and past construction costs are considered.
26 RECOMMENDATIONS @

BIBLIOGRAPHY
Nondestructive Testing, Evaluation, and Rehabilitation for Roadway Pavements
Asphalt Institute. 1969. "Asphalt overlays and pavement rehabilitation," Manual Series No. 17, College Park, MD.
Bentsen, R. A., Nazarian, S., and Harrison, J. A. 1989. "Reliability testing of seven nondestructive pavement testing devices," Nondestructive Testing of Pavements and Backcalculation of Moduli, ASTM STP 1026, American Society for Testing and Materials, Philadelphia, PA, pp. 41-58.
Briggs, R.C., Gemayel, C.A., Stubstad, R.N., and Kohn, S.D. 1993. "Nondestructive deflection testing and analysis of selected roads in Warren County, Mississippi," Final Report, Dynatest Consulting, Inc., Ojai, CA.
_____ . 1993. "Nondestructive deflection testing and analysis of selected roads in Cincinnati, Ohio," Final Report,Dynatest Consulting, Inc., Ojai, CA.
Bush, A.J.,1I1. 1980s. "Nondestructive testing for light aircraft pavements; Phase II, development of the nondestructive evaluation methodology," Report No. FAA-RD-80-9-1I, Federal Aviation Administration, Department of Transportation, Washington, DC.
Departments of the Army and the Air Force. "Nondestructive Procedures for Airfield Pavement Evaluation," TM 5-826-5/Air Force AFP 88-24, Chap. 5, Washington, DC.
ERES International, Inc., D/B/A Engineering and Research International, Inc. 1993. "Nondestructive deflection testing and analysis of selected roads in the City of Berkeley, California," Savoy, IL.
Federal Aviation Administration. 1976. "Use of nondestructive testing devices in the evaluation of airport pavements," Advisory Circular AC 150/5370-11, Department of Transportation, Washington, DC.
@ BIBliOGRAPHY 27

Hall, J.W., Jr. 1987. "Comparative study of nondestructive pavement testing, MacDill Air Force Base, Florida," Technical Report GL-87-15, Vicksburg, MS.
Hall, J.W., Jr., and Alexander, D.R. 1983. "Comparative study of nondestructive pavement testing-WES NDT methodologies," Miscellaneous Paper GL-85-26, US Army Engineer Waterways Experiment Station, Vicksburg, MS.
Hoffman, M.D., and Thompson, M.R. 1981. "Mechanistic interpretation of nondestructive pavement testing deflections," Report No. UILU-ENG-81-2010, University of Illinois/Illinois Department of Transportation.
Moore, W.M., Hanson, D.I., and Hall, J.W., Jr. 1978. "An introduction to nondestructive structural evaluation of pavements," Transportation Research Circular No. 189, Transportation Research Board, National Academy of Sciences, Washington,DC.
Nordal, S.N., and Refsdal, G. 1990. "Bearing capacity of roads and airfields," Proceedings, The Norwegian Institute of Technology, Vol 2, Trondheim, Norway.
Van Cauwelaert, F. J., Alexander, D. R., White, T. D., and Barker, W. R. 1989. "Multilayer elastic program for backcalculating layer moduli in pavement evaluation," Nondestructive Testing of Pavements and Backcalculation of Moduli, ASTM STP 1026, American Society for Testing and Materials, Philadelphia, PA, pp. 171-188.
28 BIBliOGRAPHY @

Nondestructive Testing, Evaluation, and Rehabilitation for Roadway Pavements
ABBREVIATIONS AND ACRONYMS
AASHTO AC ADT ADTT APWA ASTM CBD CBR CRDA DSM ERI FAA FHWA FIS FWD HWD ISM NDT PCI PCC RFB RFP WES USACE
American Association of State Highway and Transportation Officials Asphalt Concrete Average Daily Traffic Average Daily Truck Traffic American Public Works Association American Society for Testing and Materials Commerce Business Daily California Bearing Ratio Cooperative Research and Development Agreement Dynamic Stiffness Modulus Engineering and Research International Federal Aviation Administration Federal Highway Administration Federal Infrastructure Strategy Falling Weight Deflectometer Heavy Weight Deflectometer Impulse Stiffness Modulus Nondestructive Testing Pavement Condition Index Portland Cement Concrete Request for Bid Request for Proposal Waterways Experiment Station U.S. Army Corps of Engineers
@ ABBREVIATIONS AND ACRONYMS 29

Appendix A Statement of Work/Specifications
@ APPENDIX A 31
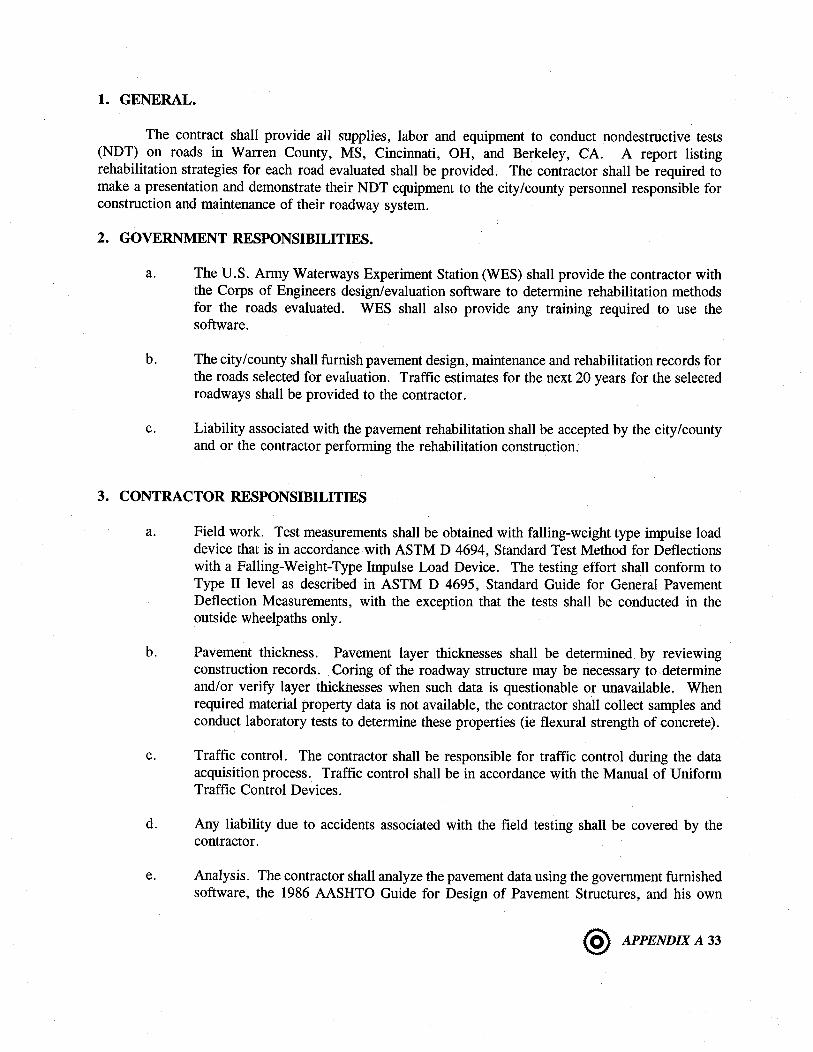
1. GENERAL.
The contract shall provide all supplies, labor and equipment to conduct nondestructive tests (NDT) on roads in Warren County, MS, Cincinnati, OH, and Berkeley, CA. A report listing rehabilitation strategies for each road evaluated shall be provided. The contractor shall be required to make a presentation and demonstrate their NDT equipment to the city/county personnel responsible for construction and maintenance of their roadway system.
2. GOVERNMENT RESPONSIBILITIES.
a. The U.S. Army Waterways Experiment Station (WES) shall provide the contractor with the Corps of Engineers design/evaluation software to determine rehabilitation methods for the roads evaluated. WES shall also provide any training required to use the software.
b. The city/county shall furnish pavement design, maintenance and rehabilitation records for the roads selected for evaluation. Traffic estimates for the next 20 years for the selected roadways shall be provided to the contractor.
c. Liability associated with the pavement rehabilitation shall be accepted by the city/county and or the contractor performing the rehabilitation construction.
3. CONTRACTOR RESPONSIBILITIES
a. Field work. Test measurements shall be obtained with falling-weight type impulse load device that is in accordance with ASTM D 4694, Standard Test Method for Deflections with a Falling-Weight-Type Impulse Load Device. The testing effort shall conform to Type II level as described in ASTM D 4695, Standard Guide for General Pavement Deflection Measurements, with the exception that the tests shall be conducted in the outside wheelpaths only.
b. Pavement thickness. Pavement layer thicknesses shall be determined by reviewing construction records. Coring of the roadway structure may be necessary to determine and/or verify layer thicknesses when such data is questionable or unavailable. When required material property data is not available, the contractor shall collect samples and conduct laboratory tests to determine these properties (ie flexural strength of concrete).
c. Traffic control. The contractor shall be responsible for traffic control during the data acquisition process. Traffic control shall be in accordance with the Manual of Uniform Traffic Control Devices.
d. Any liability due to accidents associated with the field testing shall be covered by the contractor.
e. Analysis. The contractor shall analyze the pavement data using the government furnished software, the 1986 AASHTO Guide for Design of Pavement Structures, and his own
@ APPENDIX A 33

methods. From these three analysis procedures, the contractor shall select the appropriate method based on engineering judgement. Recommendations for rehabilitation strategies shall be furnished based on 5 year, 10 year, and 20 year traffic estimates to allow the city/county to use stage construction based on budget constraints.
f. Report. The final report shall consist of a summary of test results, analysis of results, and the recommendations for maintenance and rehabilitation required to support the estimated future traffic.
g. After submission of the report, and approval by the contracting officer, a one day seminar will be conducted at the local area. City and county pavement engineers from the region will be invited. The contractor shall present his analysis at this seminar and demonstrate the operation of their falling weight deflectometer equipment. The date and exact location of the seminar shall be determined later.
4. AREAS TO BE TESTED.
A prioritized list of roads to be tested, their locations, and descriptions are provided in Appendices D, G, and I.
5. PREMEETING.
Prior to initiating the work, representatives from the WES, city/county, and contractor shall meet at work sites to coordinate the testing and evaluation of the pavements and determine when and where the seminar shall be conducted. There shall be three (3) seminars conducted, one at each site.
34 APPENDIX A @

Appendix B Cooperative Research and Development Agreement
Between WES and the City of Cincinnati
@ APPENDIX B 35

WES AGREEMENT NO. WES-93-GL-002
COOPERATIVE RESEARCH AND DEVELOPMENT AGREEMENT (CRDA) BETWEEN
U.S. ARMY ENGINEER WATERWAYS EXPERIMENT STATION AND
CINCINNATI, OHIO
THIS AGREEMENT ENTERED INTO THIS Z~ 1993, by and between the U.S. Army Engineer waterways Experiment
station represented by the Director, U.s. Army Engineer waterways
Experiment Station, Vicksburg, Mississippi (hereinafter referred.
to as WES) and cincinnati, Ohio (hereinafter referred to as
Cincinnati), pursuant to the authority contained in the Federal
Technology Transfer Act (15 USC 3710 et seq.) and Army Regulation
70-57.
WITNESSETH THAT:
WHEREAS WES desires to further test and demonstrate and to
transfer the WES-developed technology of non-destructive testing
(NOT) and evaluation of pavements to State and local governments;
and
WHEREAS, Cincinnati is interested in cooperating with WES in
the demonstration and further testing of the WES-developed
technology of non-destructive testing and evaluation of
pavements;
NOW THEREFORE, the PARTIES hereto do mutually agree as follows:
@ APPENDIX B 37
1. SCOPE OF WORK AND SCHEDULE:
The project shall include, the following:
a. Tasks to be performed by WES:
(1). Select roads to be evaluated from a prioritized
list provided by Cincinnati, Ohio.
(2). Provide software, design methods, and coordinate
the non-destructive testing of the roads identified in 1a(1}
as well as the analysis of results and selection of proper rehabilitation procedures based on future traffic estimates.
(3). Provide Cincinnati with a written report of
the results.
(4). Document the NOT with a video camera for use in future training workshops.
b. Tasks to be performed by Cincinnati:
(1). Provide WES a prioritized list of roads to be
evaluated with the NOT process.
(2). FUrnish available pavement design, maintenance,
and rehabilitation records for the roads selected.
(3). Provide estimates of future traffic for the next
twenty years for the roads selected.
(4). Notify WES of rehabilitation actions taken on the roads evaluated as a result of the study.
38 APPENDIX B @

2. DATA AND RESULTS:
Each Party shall have the right to utilize and publish all
data provided and results obtained.
3. TERM OF THE AGREEMENT:
The term of this CRDA shall be from the day and year first
above written through 30 September 1996.
4. PATENT AND OTHER INTELLECTUAL PROPERTY RIGHTS:
It is not envisioned that any technology will be developed
under this CRDA since the technology being employed by WES to
perform its portion of the cooperative effort does not appear t~
be patentable. However, should there be any patentable
technology developed hereunder, each PARTY shall retain title to
the patent rights and other intellectual property rights in this
or any foreign country in any invention developed solely by the
PARTY's own employees. Should either PARTY elect not to retain
title to an invention of one or more of its employees, the other
PARTY to the agreement shall have the right to obtain title to
the subject patent rights and other intellectual property rights
and will grant to the other PARTY a non-exclusive, paid-up
license to practice or have practiced each such invention
throughout the world.
On inventions made jointly, either PARTY shall have the
right to elect to file a joint patent or other intellectual
@ APPENDIX B 39

property application in this or any foreign country by notifying
the other PARTY within ninety (90) days after the invention is
reported. The PARTY so electing to file shall pay the expense of
preparation, filing and prosecuting the patent or other
intellectual property application.
5. REPRESENTATIVES:
The following individuals have authority to act under this
CRDA for their respective PARTIES:
cincinnati:
WES:
6. LIABILITY:
George Hartman, P.E. Acting city Engineer Division of Engineering 801 Plum Street Room 440, city Hall Cincinnati, OH 45202 Telephone: (513) 352-3401
Dr. A. J. Bush III Chief, Criteria Development & Applications Branch u.S. Army Engineer Waterways Experiment station Geotechnical Laboratory 3909 Halls Ferry Road Vicksburg, MS 39180-6199 Telephone: (601) 634-3545
a. Liability for Property. The u.S. Government shall not
be responsible for damages to any property of Cincinnati
provided to WES or· acquired by either PARTY under this CRDA.
b. Liability for Injuries Under the CRDA. To the
extent permitted by law, each PARTY assumes liability for the
40 APPENDIX B @
negligent actions of its employees or agents that are the cause
of injuries or damages that occur during the performance of this
CRDA. c. No Warranty. Except as specifically stated herein, WES
makes no express or implied warranty as to any matter whatsoever,
including the conditions of the reSearch or any invention or
product, whether tangible or intangible, made or developed under
this CRDA, or the ownership, merchantability, or fitness for a
particular purpose of the research or any invention or product.
d. Force Majeure. Neither PARTY shall be liable for any
unforeseeable event beyond its reasonable control not caused by
the fault or negligence of such PARTY, which causes such PARTY to
be unable to perform its obligations under the Agreement (and
which it has been unable to overcome by the exercise of
diligence), including, but not limited to flood, drought,
earthquake, storm, fire, pestilence, lightning and other nature
catastrophes, epidemic, war, riot, civic disturbance or
disobedience, strikes, labor dispute, or failure, threat of
failure, or sabotage of either PARTY's facilities, or any order
of injunction made by ~ court or public agency.
In the event of the occurrence of such a force majeure event, the
party unable to perform shall promptly notify the other PARTY.
It shall further use its best efforts to resume performance as
quickly as possible and shall suspend performance only for such
period of time as is necessary as a result of the force majeure
@ APPENDIX B 41

event.
7. OFFICIALS NOT TO BENEFIT:
No member of or delegate to Congress or resident
commissioner shall be admitted to any share or part of this
Agreement or to any benefit that my arise therefrom.
8. RELATIONSHIP OF PARTIES:
The parties to this CRDA act in their independent capacities
in the performance of their respective functions under it, and
neither PARTY is to be considered the officer, agent or employee
of the other.
9. MISCELLANEOUS:
a. Drug-Free Workplace. During the performance of this
CRDA, the PARTIES shall be required to comply with the intent of
the Drug-Free Workplace Act of 1988, 41 U.S.C. § 701, et seq.,
which requires the establishment of a drug-free workplace.
b. Equal Employment Opportunity. During the performance of
this CRDA, both PARTIES shall comply with Executive Order 11246,
as amended, and the rules, regulations, and orders of the
Secretary of Labor concerning equal employment opportunity.
c. Export Control Laws. The Parties understand that
materials and information resulting from the performance of this
Agreement may be subject to the export control laws (50 U.S.C. §
42 APPENDIX B @

2401-2420) and that each Party is responsible for its own
compliance with such laws.
d. Use of Name or Endorsements. The Government and the
federal laboratory will not directly or indirectly endorse any
product or service provided by the collaborating party as a
result of the CRDA.
Cincinnati shall not use the name of the u.s. Army Engineer
Waterways Experiment Station, or the u.s. Government on any
product or service which is directly or indirectly related to
either this CRDA or any patent license or assignment Agreement
which implements this CRDA unless permission has been obtained
from the Office of the Assistant Secretary of Defense for Public
Affairs. The U. S. Army Engineer Waterways Experiment station
shall assist in obtaining such approval as appropriate. By
entering into this CRDA the U. S. Army Engineer waterways
Experiment station does not directly or indirectly endorse any
product or service p~ovided, or to be provided, by Cincinnati,
its successors, assignees, or licensees. Cincinnati shall not in
any way imply that this CRDA is an endorsement of any such
product or service.
10. TERMINATION OF AGREEMENT:
Either PARTY may terminate this CRDA within 30 days written
notice by the written approval of either PARTY.
@ APPENDIX B 43

11. MODIFICATION OF AGREEMENT:
This CRDA may be modified and its scope extended, subject to
written approval of both PARTIES. All notices shall be in
writing and sent by Registered Mail to the other PARTY.
12. DISPUTES:
Any dispute arising under this CRDA which cannot be
readily resolved shall be submitted jointly to the signatories of
this CRDA with each party agreeing to seek in good faith to
resolve the issue through negotiation or other forms of
non-binding alternative disputes resolution. A joint decision of
the signatories, or their designees, shall be the disposition of
such dispute.
13. AGENCY REVIEW:
a. Authority. All prior reviews and approvals required by
regulation or law have been obtained prior to the execution of
this CRDA. The officials executing this CRDA have the requisite
authority to do so. Notwithstanding the delegation of authority
to execute this CRDA to the individual designated, the Secretary
of the Army has reserved to the Assistant Secretary of the Army
(Research, Development and Acquisition) the opportunity provided
by 15 United States Code section 3710a(c) (5) (A), to disapprove or
44 APPENDIX B @
require the modification of this CRDA within 30 days of the date
it is presented to him or her by WES.
b. Ratification. In the event that the Assistant Secretary
of the Army (Research, Development and Acquisition) exercises the
authority reserved by paragraph 12.1, Cincinnati shall have 30
days from notification of the required modification to ratify the
modifications or terminate the CRDA.
IN WITNESS WHEREOF, the PARTIES hereto have executed this
Agreement as of the day and year first above written.
FOR: THE U.S. ARMY
FOR: CINCINNATI, OHIO
APPROVED AS TO FORM:
~.LL"J . .nNT STATION
PE Director u.s. Army corps of Engineers Waterways Experiment station
FRANK A. DAWSON Acting City Manager
@ APPENDIX B 45

Appendix C Solicitation Package Mailing List
@ APPENDIX C 47

ARE, Inc
2600 Dellana Lane
Austin TX 78746
BRE, Inc
102144 I.H. 35 North
Austin, TX 78753
PCS/Law Engineering
12240 Indian Creek Court
Suite 120
Beltsville, MD 20705-1242
ERI, Inc
1401 Regency Dr. East
Savoy, IL 61874
Pavement Consultants, Inc
7530 Roosevelt Way NE
Suite 300
Seattle, WA 98115-4221
D. A. Voss & Associates
12520 SE 14th Street
Bellevue W A 98005
Dynatest Consulting, Inc
P.O. Box 71
Ojai, CA 93023
Louis Berger International, Inc
100 Halsted Street
PO Box 270
East Orange, NJ 07019
Soil and Materials Engineers, Inc
43980 Plymouth Oaks Blvd.
Plymouth,MI48170
ERES Consultants, Inc
8 Dunlap Court
Savoy, IL 61874
Pavement Services, Inc
2510 Southwest First Ave
Portland, OR 97201
Raj an , McQueen,and Assoc.
3112 Fox Den Lane
Oakton, VA 22124
@ APPENDIX C 49
Hadley & Hollingsworth Ltd
747 Sheridan Blvd
Unit IE
Lakewood, CO 80214
Infrastructure Management Services
3350 Salt Creek Lane
Suite 117
Arlington Heights, IL 60005
Braun Pavement Technologies, Inc
1404 Concordia Ave
St. Paul, MI 55104
Crawford, Murphy & Tilly, Inc
2750 West Washington St
Springfield, IL 62702
50 APPENDIX C @

Appendix D Warren County, MS Test Sections
@ APPENDIX D 51
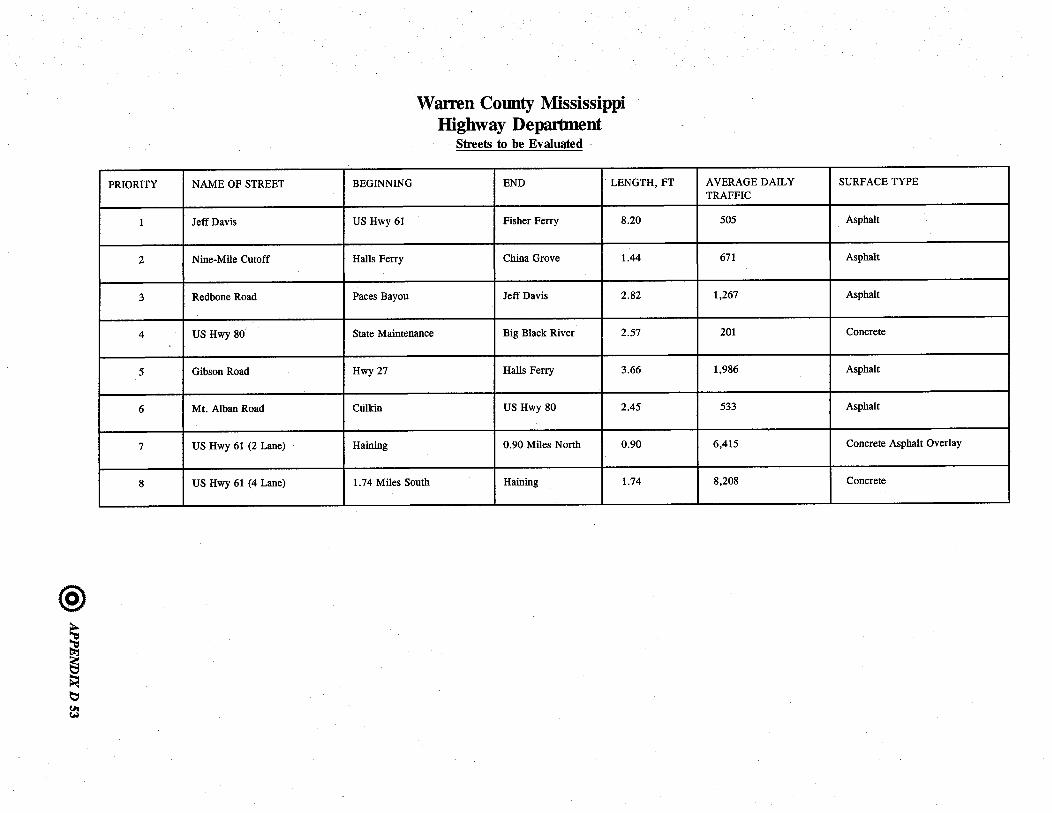
@
~ ~ ~ ~ (II 1M
PRIORITY
1
2
3
4
5
6
7
8
NAME OF STREET
Jeff Davis
Nine-Mile Cutoff
Redbone Road
US Hwy 80
Gibson Road
Mt. Alban Road
US Hwy 61 (2 Lane)
US Hwy 61 (4 Lane)
BEGINNING
US Hwy 61
Halls Ferry
Paces Bayou
Warren County Mississippi Highway Department
Streets to be Evaluated
END LENGTH,FT
Fisher Ferry 8.20
China Grove 1.44
Jeff Davis 2.82
State Maintenance Big Black River 2.57
Hwy27 Halls Ferry 3.66
Culkin US Hwy 80 2.45
Haining 0.90 Miles North 0.90
1.74 Miles South Haining 1.74
AVERAGE DAILY SURFACE TYPE TRAFFIC
505 Asphalt
671 Asphalt
1,267 Asphalt
201 Concrete
1,986 Asphalt
533 Asphalt I
6,415 Concrete Asphalt Overlay
8,208 Concrete !

Appendix E Pavement Analysis
@ APPENDIX E 55

Test Requirements
The statement of work for this project required the use of nondestructive testing equipment in accordance with ASTM D 4694, Standard Test Method for Deflections with a Falling-Weight-Type Impulse Device (Appendix A). A Type 2 level test program was conducted at each of the three locations in accordance with ASTM D 4695, Standard Guide for General Pavement Deflection Measurements (with the exception that tests were conducted only in the outside wheelpaths for both flexible and rigid pavements. At the Type 2 level, tests are conducted at 100 to 500 ft intervals to provide enough detail for the purpose of overlay design. All pavements were analyzed using WES developed evaluation procedures and software, the 1986 or 1993 AASHTO Guide for Design of Pavement Structures, and one other method of the contractor's choice. Recommendations for rehabilitation were furnished for 5-, 10-, and 20-year traffic estimates. Each evaluation methodology utilized in this study is described below.
WES Procedure
Overview. Methodologies for structural evaluation of roads and streets by use of nondestructive testing (NDT) and layered elastic theory have been developed through years of research at WES. Procedures and computer software are available for data reduction, material characterization, and analysis of flexible, rigid, and composite (flexible over rigid) pavements using surface deflection measurements from commercially available NDT equipment (TM 5-826-5). The criteria included in these procedures were developed from data obtained by monitoring the response of experimental test sections due to a range of prototype loadings. '
The structural deterioration of flexible pavements caused by traffic is normally evidenced by cracking of the asphalt concrete (AC) surface course and development of ruts in the wheel paths. The evaluation procedure handles these two modes of structural deterioration through limiting values of the strain at the bottom of the AC layer and at the top of the subgrade. Failure of rigid pavements due to the repeated application of loads (fatigue) is normally evidenced by cracking of the portland cement concrete (PCC) layer. Performance criteria for rigid pavements are based on limiting the tensile stress in the PCC slab to levels such that failure occurs only after the pavement has sustained a number of load repetitions.
The stresses and strains used for entering the criteria are computed by the use of Burmister' s solution for multilayered elastic continua. The solution of Burmister' s equations for most pavement systems will require the-use of computer programs and characterization of pavement materials by the modulus of elasticity and Poisson's ratio. The computer code utilized in the WES procedures for computing pavement response is the five-layer linear elastic program WESLEA. When WESLEA is used, the following assumptions are made:
a. The pavement is a multilayered structure, and each layer is represented by a modulus of elasticity and Poisson's ratio.
b. The interface between layers is continuous; i.e., the friction resistance between layers is greater than the developed shear force.
c. The bottom layer is of infinite thickness.
d. All loads are static, circular, and uniform over the contact area.
@ APPENDIX E 57

Supporting Data. A considerable amount of basic information, in addition to the NOT test results, is necessary for conducting a nondestructive pavement evaluation. In some cases, much of this data can be obtained from construction and maintenance records or previous evaluation reports. However, in most instances, acquiring the following additional data elements will require a substantial effort on the part of the contractor and/or the city, county, or agency funding the project:
a. Construction and maintenance history including as-built drawings and dates of construction and overlay.
b. Pavement material profiles including thickness, material classification, and frost code of each pavement layer. These parameters can be determined from the construction records or by drilling small diameter holes through the pavement and measuring layer thicknesses and obtaining samples of each material for laboratory testing.
c. Temperature data for AC and composite pavements.
(1) Five-day mean air,temperature (for the 5 days prior to testing). (2) Pavement surface temperature at the time of testing. (3) Average daily maximum and average daily mean air temperature for each month.
The stiffness of bituminous concrete is highly dependent on the temperature as shown in Figure B-1. Thus, the modulus determined for the AC from NOT may not be a good value for design, which should take the seasonal variation into account. Procedures are available for estimating the mean pavement temperature using the measured surface temperature and the mean air temperature for the five days prior to NOT testing. This can be used with Figure B-1 to predict the AC modulus at the time of testing. The design AC modulus that is used in the analysis and overlay design can be determined from a mean pavement temperature that is based on the design air temperature. This requires monthly temperature information that can be obtained from records of the National Oceanographic and Atmospheric Administration or other sources.
d. PCC flexural strength. The flexural strength of PCC pavements is a required input for evaluating rigid and composite pavements (which are evaluated using rigid pavement failure *criteria). The flexural strength can be determined from construction records or by testing 6-inch-diameter cores for tensile splitting strength using the procedure given in ASTM Test Method C 496. The flexural strength is then approximated as:
Flexural Strength, psi = 210.5 + Tensile Spli tting Strength (psi)
e. Traffic information. The current daily traffic using the pavement should be determined and an estimate of anticipated traffic for the design period must be made. The current daily traffic can be determined from existing records or by conducting a traffic-volume study. The future traffic should be estimated from studies which include vehicle classification counts.
58 APPENDIX E @
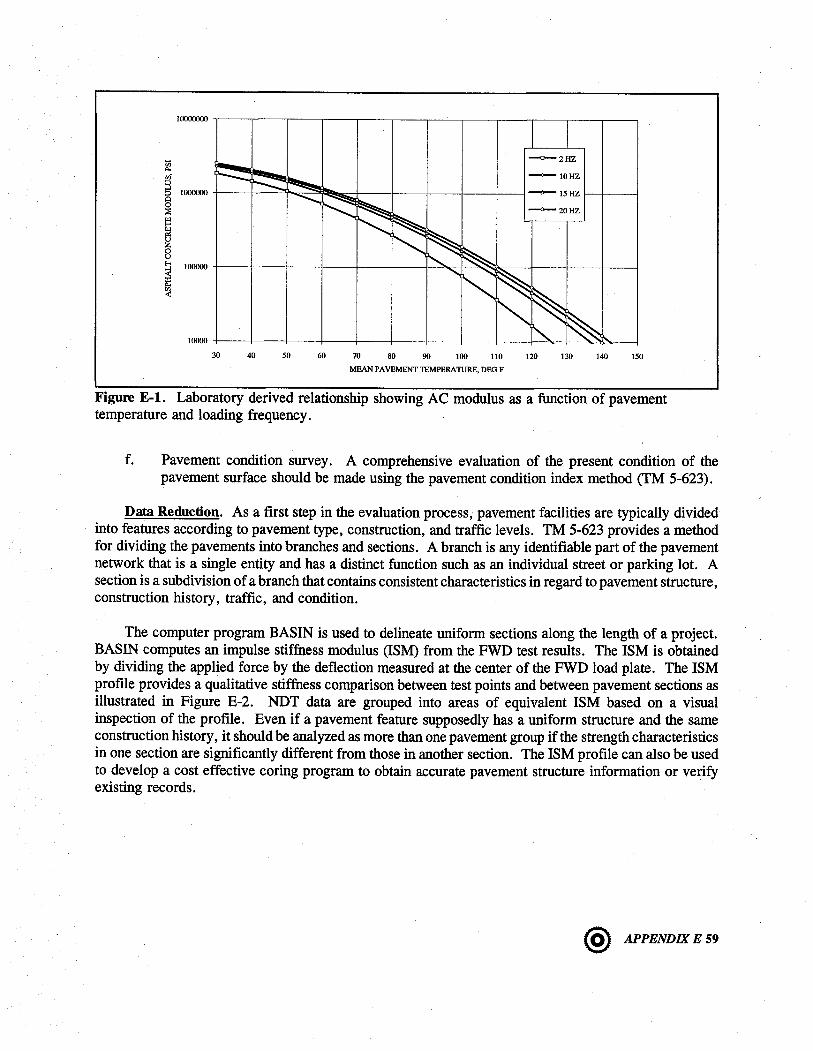
lOOO()()(]()
~ --2HZ
vi :3
1000000 ::> § :::: ~
~ z 8 ~ 1O()()(]()
liE ~
1()()(]()+---4---~--~---+---+--~----~--~--+-~4-~~~~
30 40 50 00 m ~ w ~ ill W ~ ~ ~
MEAN PAVEMENT TEMPERATURE, DEG F
Figure E-l. Laboratory derived relationship showing AC modulus as a function of pavement temperature and loading frequency.
f. Pavement condition survey. A comprehensive evaluation of the present condition of the pavement surface should be made using the pavement condition index method (TM 5-623).
Data Reduction. As a first step in the evaluation process, pavement facilities are typically divided into features according to pavement type, construction, and traffic levels. TM 5-623 provides a method for dividing the pavements into branches and sections. A branch is any identifiable part of the pavement network that is a single entity and has a distinct function such as an individual street or parking lot. A section is a subdivision of a branch that contains consistent characteristics in regard to pavement structure, construction history, traffic, and condition.
The computer program BASIN is used to delineate uniform sections along the length of a project. BASIN computes an impulse stiffness modulus (ISM) from the FWD test results. The ISM is obtained by dividing the applied force by the deflection measured at the center of the FWD load plate. The ISM profile provides a qUalitative stiffness comparison between test points and between pavement sections as illustrated in Figure E-2. NDT data are grouped into areas of equivalent ISM based on a visual inspection of the profile. Even if a pavement feature supposedly has a uniform structure and the same construction history, it should be analyzed as more than one pavement group if the strength characteristics in one section are significantly different from those in another section. The ISM profile can also be used to develop a cost effective coring program to obtain accurate pavement structure information or verify existing records.
@ APPENDIX E 59
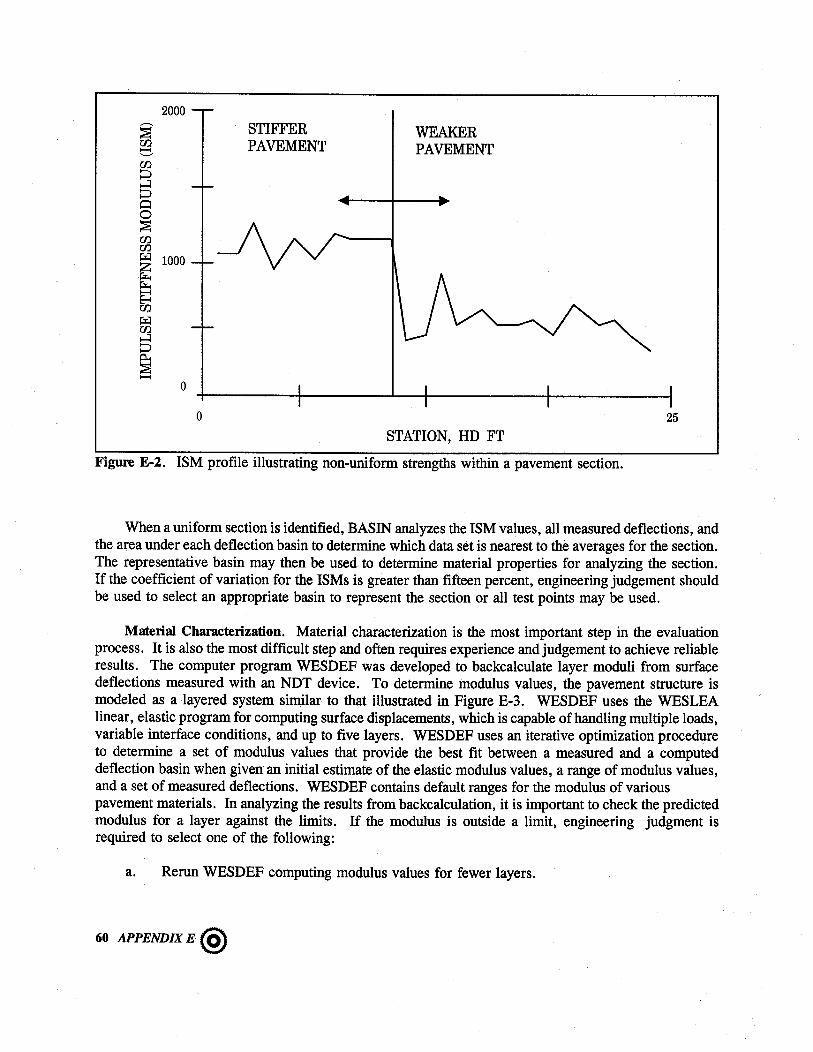
2000 """"' STIFFER WEAKER :::s w PAVEMENT PAVEMENT -'---' w ~ ....:l ~ 0 0 :::s w w ~ 1000 ~ ~ -E-t w ~ w ....:l ~ ~ :::s - 0
0 25
STATION, HD FT
Figure E-2. ISM profile illustrating non-uniform strengths within a pavement section.
When a uniform section is identified, BASIN analyzes the ISM values, all measured deflections, and the area under each deflection basin to determine which data set is nearest to the averages for the section. The representative basin may then be used to determine material properties for analyzing the section. If the coefficient of variation for the ISMs is greater than fifteen percent, engineering judgement should be used to select an appropriate basin to represent the section or all test points may be used.
Material Characterization. Material characterization is the most important step in the evaluation process. It is also the most difficult step and often requires experience and judgement to achieve reliable results. The computer program WESDEF was developed to backcalculate layer moduli from surface deflections measured with an NDT device. To determine modulus values, the pavement structure is modeled as a layered system similar to that illustrated in Figure E-3. WESDEF uses the WESLEA linear, elastic program for computing surface displacements, which is capable of handling multiple loads, variable interface conditions, and up to five layers. WESDEF uses an iterative optimization procedure to determine a set of modulus values that provide the best fit between a measured and a computed deflection basin when given an initial estimate of the elastic modulus values, a range of modulus values, and a set of measured deflections. WESDEF contains default ranges for the modulus of various pavement materials. In analyzing the results from backcalculation, it is important to check the predicted modulus for a layer against the limits. If the modulus is outside a limit, engineering judgment is required to select one of the following:
a. Rerun WESDEF computing modulus values for fewer layers.
60 APPENDIX E @
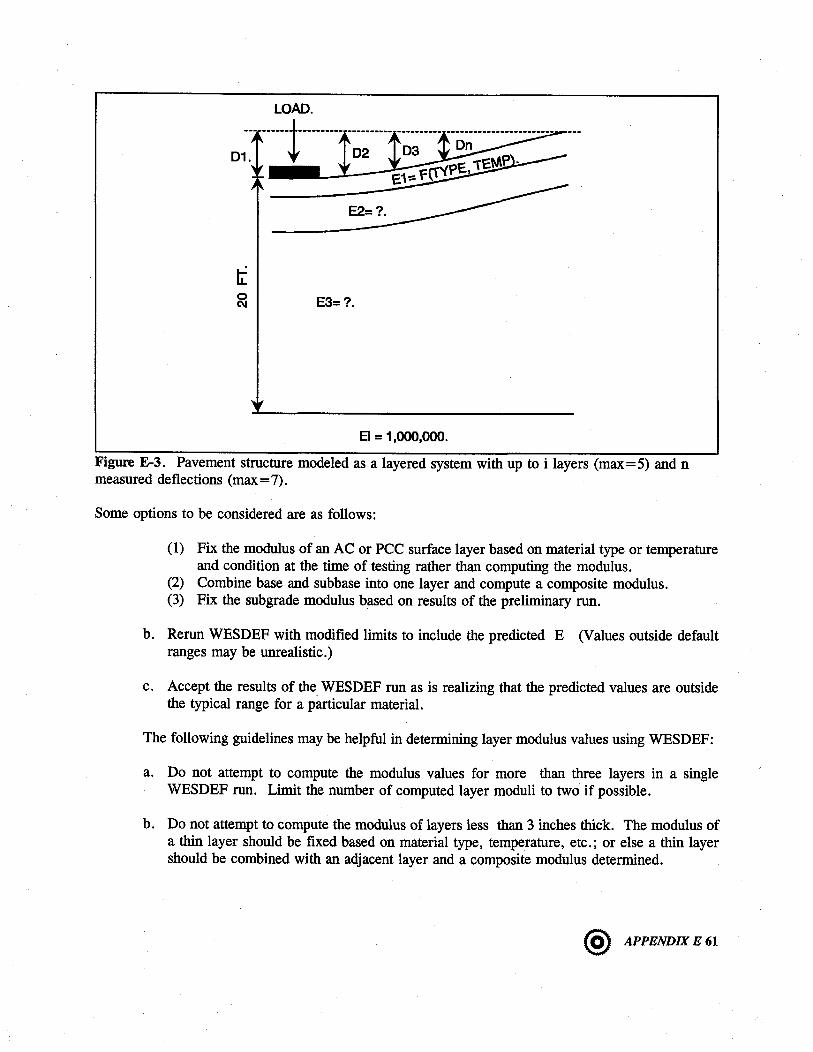
o C\I E3=?
Ei = 1 ,000,000.
Figure E-3. Pavement structure modeled as a layered system with up to i layers (max = 5) and n measured deflections (max=7).
Some options to be considered are as follows:
(1) Fix the modulus of an AC or PCC surface layer based on material type or temperature and condition at the time of testing rather than computing the modulus.
(2) Combine base and subbase into one layer and compute a composite modulus. (3) Fix the subgrade modulus based on results of the preliminary run.
b. Rerun WESDEF with modified limits to include the predicted E (Values outside default ranges may be unrealistic.)
c. Accept the results of the WESDEF run as is realizing that the predicted values are outside the typical range for a particular material.
The following guidelines may be helpful in determining layer modulus values using WESDEF:
a. Do not attempt to compute the modulus values for more than three layers in a single WESDEF run. Limit the number of computed layer moduli to two if possible.
b. Do not attempt to compute the modulus of layers less than 3 inches thick. The modulus of a thin layer should be fixed based on material type, temperature, etc.; or else a thin layer should be combined with an adjacent layer and a composite modulus determined.
@ APPENDIX E 61

c. When computing the modulus of a PCC layer, it may be necessary to combine a base or subbase layer with the subgrade layer and determine a composite modulus for the material beneath the PCC slab.
d. Exercise caution when using modulus values outside the default ranges. Because the ranges are quite broad, values outside these limits may be unrealistic.
e. For NDT devices with circular loaded areas, the offset distance to the first measured deflection is input to WESDEF as one half of the radius of the loading plate to approximate the deflection at half the radius of a uniformly distributed circular loaded area.
Analysis and Overlay Design. Load carrying capacities and required overlay thicknesses are evaluated using the computer program WESROAD. The program can analyze up to 30 axles with different loading conditions in a single run. For the mixed traffic analysis, the number of load applications for each axle type must be specified. Axle types are selected from the vehicle data file ROADDATA, which contains the axle geometry needed for elastic layer calculations. For a given pavement, having modulus values determined from WESDEF, WESROAD computes the stresses (rigid and composite pavements) or strains (flexible pavements) that will be induced by each vehicle in the design traffic mixture. The allowable number of load applications is determined for each vehicle from empirically developed criteria and the damage is defined as:
no. axles To tal Damage = 1:
1
Design Load Applications Allowable Load Applications
For: Damage >- 1.0 : Overlay Required
For analyzing flexible pavements, both the horizontal tensile strains at the bottom of the AC layer and the vertical subgrade strains at the top of the subgrade are considered. The allowable AC strain, shown graphically in Figure E-4, is:
62 APPENDIX E @

_[LOg10 (N) + 2.665 LOg10(~) + 0.392]
EAC = 10 5
or:
-[5 LOg10 (EAC + 2.665 LOg10( EAC2 ) - 0.392] N = 10 14.2
Where:
EAC = Tensile Strain, Bottom of AC (in/in) N= Vehicle Coverages EAC = AC Modul us, psi
The allowable subgrade strain for flexible pavements, shown graphically in Figure E-5, is:
or _[ 2.408 + L0010 (Ev ]
N = 10 0.1408
Where:
Ev = Vertical Strain, top of Subgrade (in/in) N = Vehicle Coverages
@ APPENDIX E 63
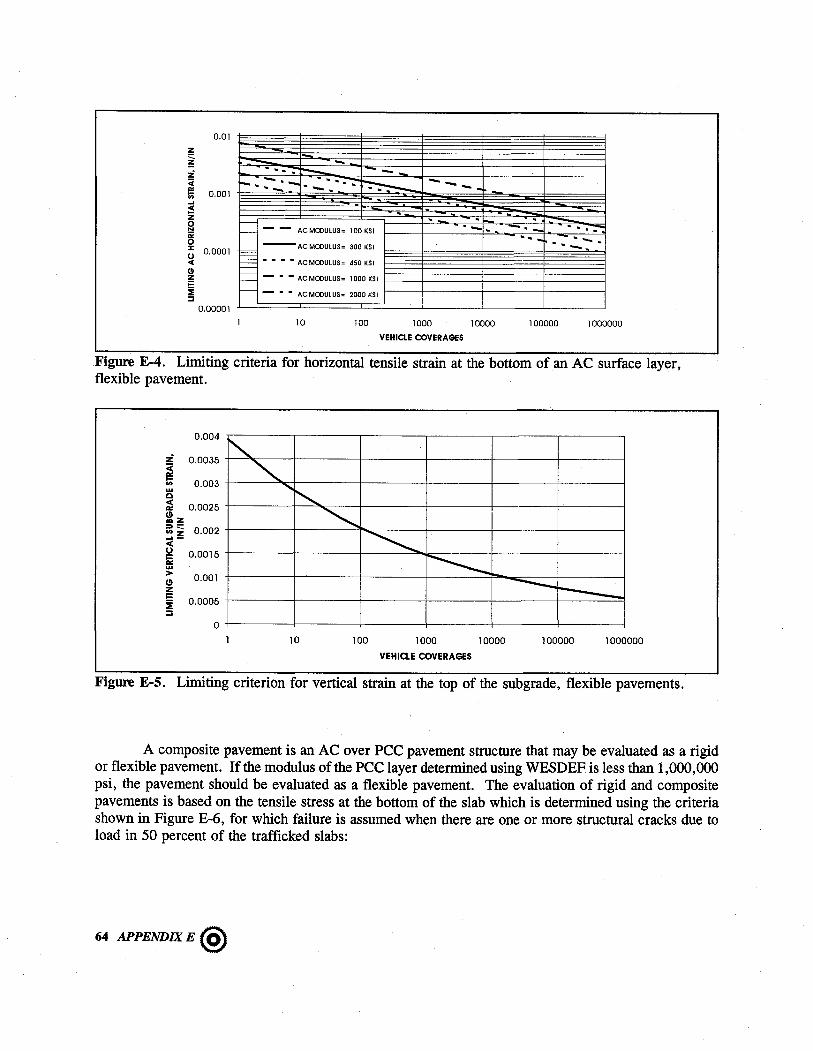
0.01
2: ~ :i :;;: '" 0.001 Ii; ... :!! z 0 !::!
'" 0 :z: 0.0001 0 c(
C!l z E ::!E :::;
0.00001
- -........ :-- ---- ........ ,. ...... -- -..: -. ---:-~ ---. .. -- -- . -
- AC MODUlUS= 100 KS! '--
§ - AC MODUlUS= 300 KS!
~ . -- - ACMODUlUS= 450 KS!
~ - • - AC MODUlUS= 1000 KS! c--- - • - AC MODUlUS= 2000 KS!
10 100 1000
VEHIQE COVERAGES
10000
- - ----'- -. ---.. - --. - --
100000 1000000
Figure E-4. Limiting criteria for horizontal tensile strain at the bottom of an AC surface layer, flexible pavement.
0.004
Z 0.0035 ::;;:
ti ... Q
0.003
:i 0.0025 ~z ;: ~ 0.002 ~-~ 0.0015 ... ~ 0.001 z E 0.0005 ::IE ::;
o
"" '" " ~
10
~ ~ ~ ----r----..
100 1000 10000 100000 1000000
VEHlaE COVERAGES
Figure E-S. Limiting criterion for vertical strain at the top of the subgrade, flexible pavements.
A composite pavement is an AC over PCC pavement structure that may be evaluated as a rigid or flexible pavement. If the modulus of the PCC layer determined using WESDEF is less than 1,000,000 psi, the pavement should be evaluated as a flexible pavement. The evaluation of rigid and composite pavements is based on the tensile stress at the bottom of the slab which is determined using the criteria shown in Figure E-6, for which failure is assumed when there are one or more structural cracks due to load in 50 percent of the trafficked slabs:
64 APPENDIX E @
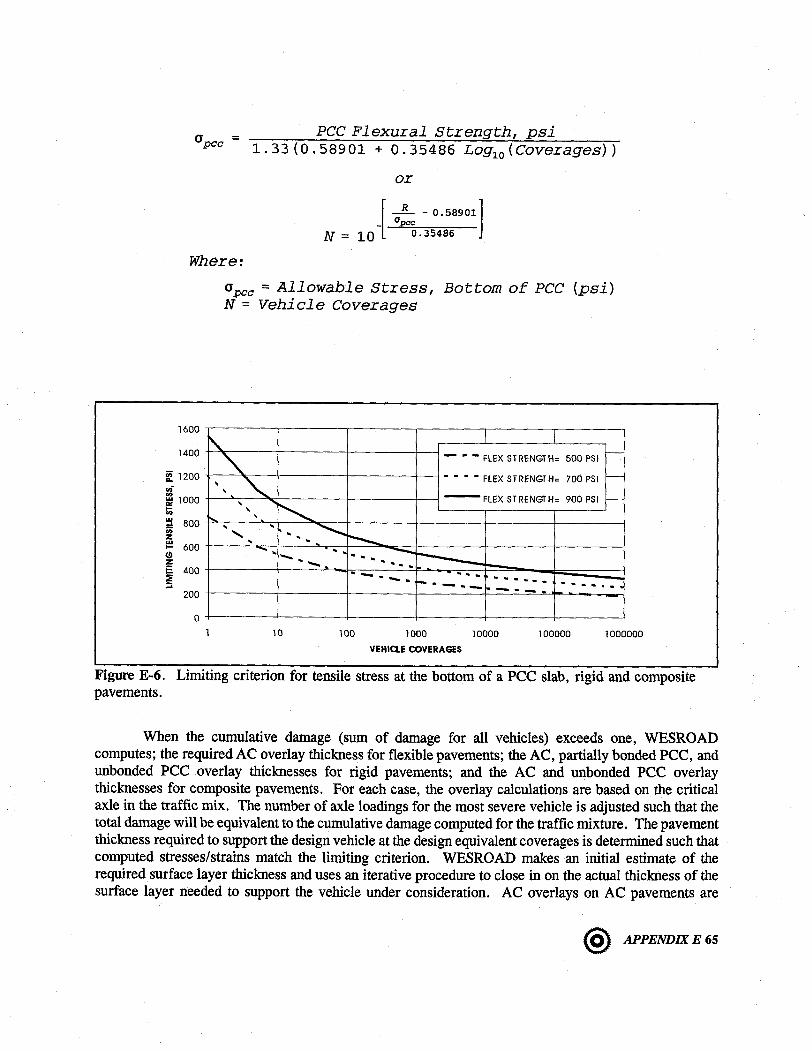
Opec = PCC Flexural Strength, psi
1.33(0.58901 + 0.35486 Log10 (Coverages»
or
[ ~ - 0.58901]
N = 10 0.35486
Where:
1600
1400
i! 1200 .,;
~ 1000
III 800 ::! U) z I:!:! 600 (!) z E. :E
400
::l 200
0
I\.
opec = Allowable Stress, Bottom of PCC (psi) N = Vehicle Coverages
r--
.. ~ - • - FLEX STRENGTH= 500 PSI
- - - - FLEX STRENGTH= 700 PSI f--, , ,
,
" " -FLEX STRENGTH= 900 PSI r--
~ , ,
, ........ ~ i"--,
........ ...... .. ... ........... r-----.. ... ... -. ... -... .. -- .......... ... ...... ........... r-. ....... _ .. - .. - ...........
10 100 1000
VEHIQ.E COVERAGES
10000 100000 1000000
Figure E-6. Limiting criterion for tensile stress at the bottom of a PCC slab, rigid and composite pavements.
When the cumulative damage (sum of damage for all vehicles) exceeds one, WESROAD computes; the required AC overlay thickness for flexible pavements; the AC, partially bonded PCC, and unbonded PCC overlay thicknesses for rigid pavements; and the AC and unbonded PCC overlay thicknesses for composite pavements. For each case, the overlay calculations are based on the critical axle in the traffic mix. The number of axle loadings for the most severe vehicle is adjusted such that the total damage will be equivalent to the cumulative damage computed for the traffic mixture. The pavement thickness required to support the design vehicle at the design equivalent coverages is determined such that computed stresses/strains match the limiting criterion. WESROAD makes an initial estimate of the required surface layer thickness and uses an iterative procedure to close in on the actual thickness of the surface layer needed to support the vehicle under consideration. AC overlays on AC pavements are
® APPENDIX E 65

simply the difference between the required thickness and the existing AC thickness. Equations for computing overlay thickness requirements for rigid pavements are as follows:
AC overlay = 3.0 ( F hd - Cbh )
PCC (unbonded) = V(hd}2 - Cr (h)2
PCC (partially bonded) = 1.4V(hd)l.4 - Cr (h)1.4
Where:
F = Factor which projects cracking E PCC layer
hd = Required thickness of new PCC pavement
Cb = Condition factor, (.5-1. 0)
h = Thickness of existing PCC
Cr = Condition Factor, (0.35-1.00)
Composite pavements (AC over PCC) are evaluated as rigid pavements. For overlays, the required thickness of PCC is determined, and the existing AC is treated as a bond breaker.
A typical output from WESROAD is presented in Figure E-7. This is a rigid pavement example with the total damage for the three design axles being much greater than one. Overlays for 244,876 coverages of the 32 kip axle load are 10.7 inches (AC), 6.6 inches (PCC, partially bonded), and 7.4 inches (pCC, unbonded).
66 APPENDIX E @

AXLE ID AXLELOAD ALLOWABLE COVERAGE AXLE COVERAGE DAMAGE 1 2. .810880E+33 .104275E+05 . 128595E-28
AXLE ID AXLELOAD ALLOWABLE COVERAGE AXLE COVERAGE DAMAGE 2 9. .161166E+05 .320000E+05 . 198553E+01
AXLE 10 AXLELOAD ALLOWABLE COVERAGE AXLE COVERAGE DAMAGE 10 32. .108687E+04 . 242718E+06 .223318E+03
THE TOTAL DAMAGE FOR ALL AXLES IS . 225303E+03
THE CRITICAL AXLE 10 IS 10 THE EQUIVALENT COVERAGES= 244876.015679807500000
************************************************************************ *********************"WESROAD" VERSION DRA-09.89.12********************* **********************EXECUTED: 2- 6-1992 @ 14: 8**********************
PROBLEM NUMBER 1
Example Problem, Rigid Base Pavement, Three axle loads.
PAVEMENT INPUT PARAMETERS *************************
LAYER FROST MODULUS, PSI THICK. POlS SLIP NO MATERIAL TYPE CODE NOT FROST IN. RAT. VALUE
****** ***************** ******* ********* ********* ******** **** *****
1 2 3 4 5
PCC SUBGRADE SUBGRADE SUBGRADE SUBGRADE
DESIGN AXLE 10
o o o o o
4387500. 6000. 6000. 6000. 6000.
4387500. 6000. 6000. 6000. 6000.
PAVEMENT EVALUATION SUMMARY (ALLOWABLE LOAD NOT APPLICABLE)
6.00 10.00 10.00 10.00
SEMI-INF
.15 1000.
.40 1.
.40 1.
.40
.40
REQ'D OVERLAY, IN.
DESIGN ALLOW- ALLOWABLE ************** **************** ABLE OPERATIONS OF PCC
LOAD EQUIVALENT LOAD DESIGN PARTIAL NO KIPS COVERAGE KIPS AXLE AC BOND BOND
******************** ****** ******** ****** ********* **** **** ****
10 32.0 . 244876E+06 10.7 6.6 7.4
Figure E-7. Rigid pavement analysis and overlay design from WESROAD. @ o APPENDIX E 67

Dynatest Consul1ing, Inc. (Dynatest) and Soil and Materials Engineers, Inc. (SME)
The evaluations for Warren County, Mississippi and Cincinnati, Ohio were conducted jointly by Dynatest and SME using the WES procedures, AASHTO procedures, and their own ELMOD method. In addition, the MODULUS program was used to provide another comparison of back calculation results. Tests were conducted using the Dynatest 8081 HWD Test System.
ELMOD Method. Generally, Dynatest analyzes their project level load-deflection data through a specially developed software package. This method is based on a combined analytical and empirical approach. The system is analytical in the sense that actual, in-situ material properties and wheel load responses are derived through a reverse, layered analysis technique, as described below. It is still empirical, however, in the sense that the relationships between the load related response of these mechanistic and analytical properties and future pavement performance are based upon past experience (observed performance) and associated research. This software package, employed for analyzing the Warren County and Cincinnati data as discussed below, is called ELMOD.
ELMOD is an acronym for Evaluation of Layer Moduli and Overlay Design, and the program is used primarily for asphalt concrete and continually reinforced concrete pavement types. A companion procedure called ELCON (ELmod for CONcrete) was used for the concrete (pCC) sections as well. The first step in the program is a routine which backcalculates the mechanistic material properties of a uniaxial, semi-infinite pavement system (ie, the elastic moduli or E-values of each structural layer in the pavement). Based on these derived E-values (for each FWD test point), the design life and/or needed overlay to bring the pavement up to its design life standard is calculated. The program is able to assign various (user controlled) seasonal adjustments to the derived E-values (a lower rainy season subgrade modulus and a varying asphalt concrete modulus as a function of seasonal temperature), and then calculate the expected remaining service life of the pavement section, and an overlay design if the expected lifetime is inadequate, based on certain transfer functions (which are also user controlled). These transfer functions are primarily based on laboratory measured performance correlated with subsequent field observed performance obtained for various pavements. When the fundamental structural pavement properties (E-values) have been determined, the critical stress and strains in the structure may be calculated.
As indicated, the prediction of pavement performance (roughness or cracking) from the calculated pavement response (critical stresses and strains) is empirical. The empirical relationships between the derived mechanistic material properties and performance are, however, user controlled (variable inputs to ELMOD/ELCON). The program therefore may be used for any specific local environmental conditions if these relationships are known.
It should be noted that generally most of the measured magnitudes of deflection are due to the response of the subgrade. It is therefore very important that the subgrade modulus is accurately determined. A small error in the sub grade modulus will lead to a very large error in the derived asphalt concrete modulus. For this reason, it is necessary to consider any non-linearity of the subgrade, which can be done easily with the analytical-empirical method, using the highly accurate deflection data obtained.
Due to the large influence of the subgrade on the measured deflections, it is very important that the deflections are measured at a load level similar to that resulting from heavy truck wheels, and that
68 APPENDIX E @

the deflections measured at large distances from the loading center (> - 3 ft) are measured very accurately.
For purposes of the ELMOD analyses of the pavements in Warren County and Cincinnati, the most important equations and parameters assumed for the climatic zone and material conditions found in each region were as follows:
a. Four seasons assumed, 13 weeks each.
b. Maximum effective pavement temperature occurs during Week No. 31, at the beginning of August, .. 105 deg F (Warren County) and .. 95 deg F (Cincinnati). Minimum effective pavement temperature occurs during Week No.7, in February, .. 40 deg F (Warren County) and .. 35 deg F (Cincinnati).
c. Seasonal variation of the modulus of the unbound materials is assumed to be sinusoidal. The ratio between the minimum and maximum unbound material E-values = 0.80, with the lower values occurring during the springtime in April.
d. The ratio between static and dynamic (effective) load = 1.2 (dynamic load factor, generally due to roughness).
e. Flexible pavement criterion:
1. Flexible pavement design fatigue failure criteria (structural failure, fatigue cracking in asphalt concrete):
EAC
:::: 0.07745 N-O• 304 E-O. 259
Where:
EAC :::: tensile strain at bottom of AC E :::: Modul us of AC N:::: Equivalent 18-kip Axle Loads
2. Permissible vertical stress (psi) on all unbound materials on flexible pavements (functional failure, roughness related):
<J1,p = 1435 ( E )C N-O.307
23.2
Where:
E = Modulus of material C = 1 for E > 23.2 ksi, or C = 1.16 for E < 23.2 ksi N = Equivalent 18-kip Axle Loads
@ APPENDIX E 69
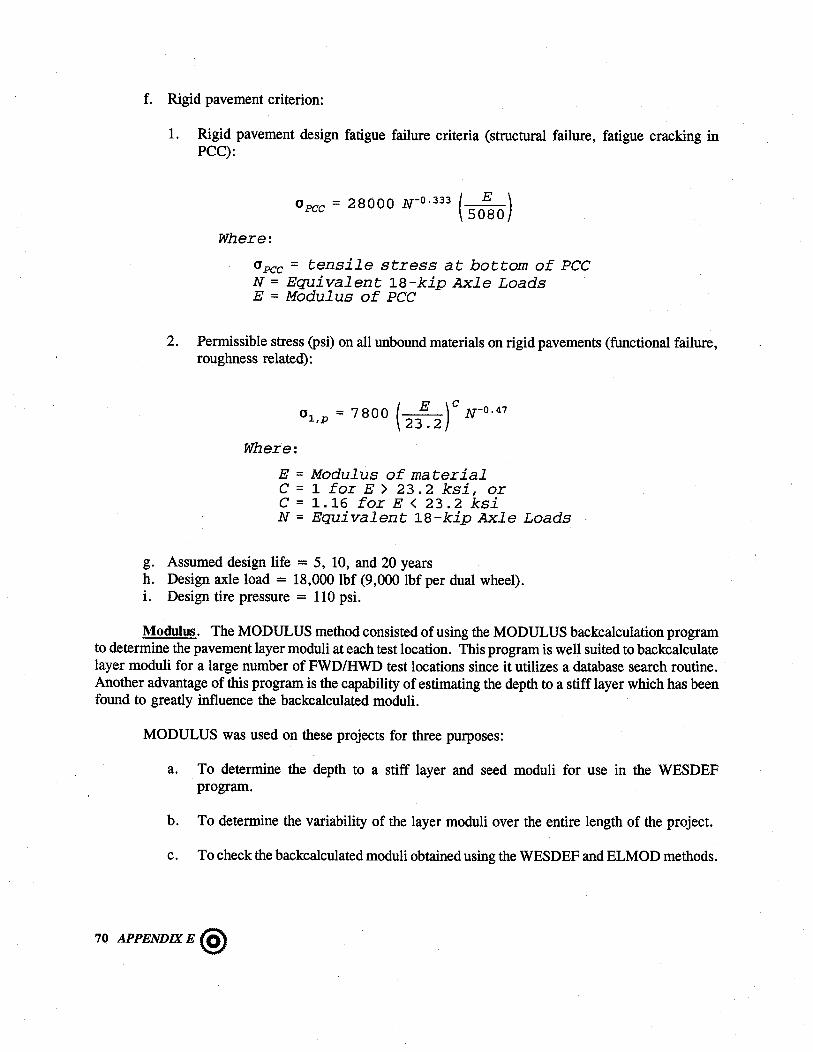
f. Rigid pavement criterion:
1. Rigid pavement design fatigue failure criteria (structural failure, fatigue cracking in peC):
o = 28000 N-O•333 ( E ) pcc 5080
Where:
0pcc = tensile stress at bottom of PCC N = Equivalent 18-kip Axle Loads E = Modul us of PCC
2. Permissible stress (psi) on all unbound materials on rigid pavements (functional failure, roughness related):
o = 7 800 ( E ) C N-O' 47 1,p 23.2
Where:
E = Modulus of material C = 1 for E > 23.2 ksi, or C = 1.16 for E < 23.2 ksi N = Equi val en t 18 - kip Axl e Loads
g. Assumed design life = 5, 10, and 20 years h. Design axle load = 18,000 lbf (9,000 lbf per dual wheel). i. Design tire pressure = 110 psi.
Modulus. The MODULUS method consisted of using the MODULUS backcalculation program to determine the pavement layer moduli at each test location. This program is well suited to backcalculate layer moduli for a large number of FWD/HWD test locations since it utilizes a database search routine. Another advantage of this program is the capability of estimating the depth to a stiff layer which has been found to greatly influence the backcalculated moduli.
MODULUS was used on these projects for three purposes:
a. To determine the depth to a stiff layer and seed moduli for use in the WESDEF program.
b. To determine the variability of the layer moduli over the entire length of the project.
c. To check the backcalculated moduli obtained using the WESDEF and ELMOD methods.
70 APPENDIX E @

Engineering & Research Int'l, Inc. (ERI)
The evaluation for Berkeley, California was conducted by ERI using the WES procedures, AASHTO procedures, and their own procedures. Tests were conducted using the ERI-KUAB Two Mass Falling Weight Deflectometer.
Backcalculation of Layer Moduli. For flexible pavements, the modulus of elasticity was determined for each structural layer of the flexible pavements at locations where both FWD tests and boring were done. The pavement was modeled as a multi-layered system based on boring results. Representative basins were used as inputs in an iterative scheme to backcalculate the layer moduli values. Representative deflection basins were determined by first calculating the mean plus one standard deviation of the maximum deflection recorded at each test point within a section. This weighted mean was then compared to all deflection basins within the section and the station with the maximum deflection closest to this value was selected as the representative basin. The ERI backcalculation program estimates the subgrade modulus based on the 1986 AASHTO guide. The estimated subgrade modulus is used in the ELSDEF87 program with other seed values to backcalculate the layer moduli values. During this process, measured deflections are compared to deflections calculated using a multi-elastic layer computer analysis program (ELSYM5) with various layer moduli sets. The layer moduli values that produce calculated deflection basins that best match field deflections are selected as the final moduli values of the in situ pavement layers. The hard rock was assumed a depth of 240 inches below the ground surface.
For composite pavements, the modulus of elasticity of the AC and PCC, and the foundation stiffness were determined. The composite pavement was modeled as a slab on grade with the maximum surface deflection corrected to account for compression in the AC layer. The subgrade was modeled as both dense liquid and elastic solid foundations, however, the dense liquid solution was utilized for overlay design ..
Environmental Considerations. Environmental data is typically used to segregate the calendar year into design seasons. Design seasons are selected to maintain a consistency in temperature and moisture, both of which affect the pavement materials. The average monthly temperatures varied only slightly throughout the year and thus, there was no need to establish individual design seasons based on temperature. Precipitation data indicated increased moisture for the period between October and March. As such, two design seasons corresponding to the periods between April and September and between October and March would seem appropriate. However, the backcalculated modulus values for the base were low and any further reduction was not warranted. Therefore, a single design season was assumed for analysis and design purposes.
Temperature corrections were applied to the backcalculated asphalt moduli, rather than normalizing the deflection data prior to analysis. The following steps were taken:
a. Pavement design temperature was calculated using the following equation:
@ APPENDIX E 71
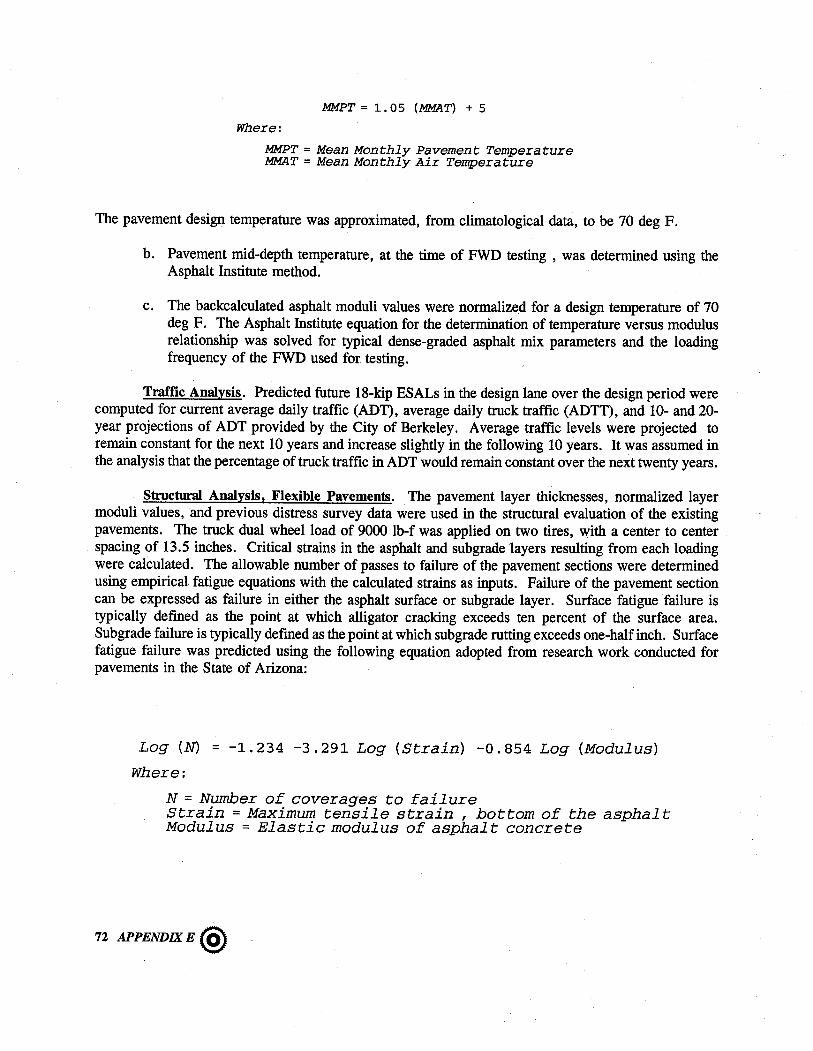
MMPT = 1.05 (MMAT) + 5
Where:
MMPT = Mean Monthly Pavement Temperature MMAT = Mean Monthly Air Temperature
The pavement design temperature was approximated, from climatological data, to be 70 deg F.
b. Pavement mid-depth temperature, at the time of FWD testing, was determined using the Asphalt Institute method.
c. The backcalculated asphalt moduli values were normalized for a design temperature of 70 deg F. The Asphalt Institute equation for the determination of temperature versus modulus relationship was solved for typical dense-graded asphalt mix parameters and the loading frequency of the FWD used for testing.
Traffic Analysis. Predicted future 18-kip ESALs in the design lane over the design period were computed for current average daily traffic (ADT), average daily truck traffic (ADTT), and 10- and 20-year projections of ADT provided by the City of Berkeley . Average traffic levels were projected to remain constant for the next 10 years and increase slightly in the following 10 years. It was assumed in the analysis that the percentage of truck traffic in ADT would remain constant over the next twenty years.
Structural Analysis. Flexible Pavements. The pavement layer thicknesses, normalized layer moduli values, and previous distress survey data were used in the structural evaluation of the existing pavements. The truck dual wheel load of 9000 lb-f was applied on two tires, with a center to center spacing of 13.5 inches. Critical strains in the asphalt and subgrade layers resulting from each loading were calculated. The allowable number of passes to failure of the pavement sections were determined using empirical fatigue equations with the calculated strains as inputs. Failure of the pavement section can be expressed as failure in either the asphalt surface or subgrade layer. Surface fatigue failure is typically defined as the point at which alligator cracking exceeds ten percent of the surface area. Sub grade failure is typically defmed as the point at which subgrade rutting exceeds one-half inch. Surface fatigue failure was predicted using the following equation adopted from research work conducted for pavements in the State of Arizona:
Log (N) = -1.234 -3.291 Log (Strain) -0.854 Log (Modulus)
Where:
N = Number of coverages to failure Strain = Maximum tensile strain I bottom of the asphal t Modulus = Elastic modulus of asphal t concrete
72 APPENDIX E @

Sub grade rutting was predicted using the following equation developed by the U. S. Army Corps of Engineers:
Where:
N = Coverages to subgrade failure Ev = Maximum vertical strain, top of subgrade
The total fatigue damage at each pavement section was determined based on the past fatigue damage and future projected traffic for 5-, 10-, and 20- year planning horizons. The overlays were designed for pavement sections having total fatigue damage greater than 1.
Structural Analysis, Composite Pavements. The ERI approach to composite pavement overlay design is based on the calculation of critical stresses at increasing overlay thicknesses, and the decreasing effects on fatigue damage to the PCC slab. The pavement structure is modeled as a single slab-on-grade and in-situ, backcalculated layer moduli are used as the design values for slab and subgrade. A fatigue equation is applied to the inverse of the stress ratio, and the allowable loadings to failure are compared to the predicted traffic loadings to determine the required overlay thickness for a given design period. The design procedure contains the following steps:
a. Design values of PCC modulus and modulus of subgrade reaction are computed.
b. Existing asphalt overlays are converted to an equivalent concrete thickness, which is added to the existing concrete thickness.
c. The pavement is modeled as a slab on grade with the load applied to the edge of the slab at the midpoint between transverse joints.
d. Critical stresses are calculated using Westergaard equations.
e. PCC flexural strengths are estimated based on laboratory testing of concrete specimens and relationships between flexural strength and compressive strength or flexural strength and PCC modulus.
f. The ratio of flexural strength to critical tensile stress is computed and the allowable number of loadings are determined from a fatigue equation.
g. If the damage exceeds 1.0, an additional thickness of concrete is added to the existing system and the procedures are repeated until the total damage is equal to 1.0.
@ APPENDIX E 73

American Association of State Highway & Transportation Officials (AASHTO)
Dynatest & SME. Flexible Pavements. The AASHTO method used for analyzing the flexible pavements in Warren County and at Cincinnati is based on the maximum deflection measured at the center of the load plate (DO) and the deflection measured at the outermost sensor (D6). The deflection measured at D6 is used to estimate the sub grade strength. DO and the estimated subgrade strength are then used to estimate the overall strength of the pavement which is expressed by the pavement's Structural Number (SN). The deflection measured at the center of the FWD/HWD load plate is corrected to a standard temperature of 70 deg F prior to determining the pavement strength.
The above method is described in detail in the 1986 AASHTO Pavement Design Guide. However, the following changes were made based on SME' s experience and on published research papers regarding the use of the remaining life factor:
a. The subgrade modulus estimated using the AASHTO method generally result in unreasonably high subgrade moduli. This has been recognized by AASHTO and the 1993 method recommends that the backcalculated subgrade modulus be divided by 3. The 1993 method has not been thoroughly reviewed nor used extensively in the industry. Instead, the subgrade moduli for this project were estimated using the so-called Hogg model, which is well documented in the literature.
b. The remaining life factor (FrJ is set equal to 1 rather than the factors recommended in the 1986 method. The 1993 method abandons the use of this factor when determining the required overlay thickness. Several research papers have been written regarding this issue, recommending the use of 1 for the Frl factor.
Some of the composite pavements which exhibited relatively high deflections were also analyzed as flexible pavements. This condition was basically due to limitations in the rigid pavement analysis method.
Dynatest & SME. Rigid and Composite Pavements. The rigid pavement analysis method is described in detail in the 1993 AASHTO Pavement Design Guide. In summary, the deflections measured at the sensors located at 0, 12, 24 , and 36 inches from the center of the FWD/HWD load plate are used to compute the dynamic modulus of sub grade reaction (k-value) and the effective concrete layer modulus. The dynamic k-value is divided by 2 to obtain the static k-value normally used in rigid pavement design. The required slab thickness to carry the forecasted traffic is then estimated using this static k-value, the measured joint load transfer, the in-situ concrete moduli, the modulus of rupture estimated from the concrete layer moduli, and the drainage factor selected for the site.
The effective thickness of the slab is reduced based on the results of a visual condition survey. Factors to adjust for the condition of joints and cracks, the presence and extent of durability cracking, and the amount of fatigue damage are used to reduce the measured slab thickness to an effective thickness.
The difference between the thickness of the new slab and the thickness of the effective slab is used to estimate the thickness of the required overlay. A factor is used to transfer the required concrete thickness into an equivalent thickness of asphalt concrete.
74 APPENDIX E @

The analysis of composite pavements is very similar to that of rigid pavements. However, different values are assigned to each of the factors discussed above which are used to calculate the effective thickness of the slab. Also, the deflection due to compression of the asphalt overlay is subtracted from the maximum measured deflection in order to evaluate the condition of the concrete slab. All other steps involved in the overlay analysis of composite pavements are similar to those discussed for rigid pavements.
ERI, Backcalculation. Composite pavements were modeled as a slab on grade with the maximum surface deflection corrected to account for compression in the AC layer. The subgrade was modeled as both dense liquid and elastic solid foundations, however, the dense liquid solution was utilized for overlay design. For the flexible pavements, the deflection at 36 inches from the load plate was used to backcalculate an in situ modulus for the subgrade. The deflection used to backcalculate the subgrade modulus must be measured far enough away that it provides a good estimate of the sub grade modulus, independent of the effects of any layers above, but also close enough such that it is not too small to measure accurately. The 36-inch sensor deflection met the test for adequate distance for all but two of the streets, and was used even for these streets, since the required distance was only slightly more than 36 inches. It should be noted that no temperature adjustment is needed in determining the in situ subgrade modulus since the deflection used is due only to subgrade deformation.
The effective pavement modulus ~ was estimated using the in situ subgrade modulus and the maximum deflection measured under the load plate DO. A correction factor was applied to the actual measured DO values to adjust them to a standard temperature of 68 deg F.
ERI, Design. Overlay design by the AASHTO method is based on the concept of structural deficiency: if the existing pavement's structural capacity is insufficient to support the traffic loadings anticipated over some future design period, an overlay thickness can be determined which will compensate for this deficiency. The required overlay structural capacity can be correct only if the required future structural capacity and the assessment of the existing structural capacity are correct. The primary objective of the structural evaluation is to determine the effective structural capacity of the existing pavement.
Three methods are described for determining effective structural capacity: (1) an NOT method, in which the effective structural number is estimated directly from deflection analysis, (2) a condition survey method, in which the effective structural number is computed from reduced layer coefficients assigned to the pavement layers based on the amount and severity of load-related distress observed, and (3) a remaining life method, in which the structural number is estimated based on the ratio of actual past traffic to expected traffic capacity of the original pavement. The use of each of these methods depends on the availability of deflection, condition, or past traffic data. It is recommended that each of the methods for which the necessary data are available should be used, and the results compared.
The steps followed in analyzing the existing pavement sections are:
a. The required future structural number was determined for each street as a function of the design subgrade modulus and the design traffic for 5-, 10-, and 20- year design ESALs at 50 and 80 percent reliabilities. A value of 0.49 was used for the overall standard deviation of the performance model's prediction. Initial and terminal serviceability levels of 4.2 and 2.5 were used.
@ APPENDIXE75

b. The effective structural number was estimated from the NDT method and the condition method.
c. The AC overlay thickness requirements for the 5-, 10-, and 20- year design periods, for reliability levels of 50 and 80 percent, were determined using the future structural number and the effective structural numbers from NDT and condition methods. A structural coefficient of 0.44 was used to convert the required structural capacity into a required AC overlay thickness.
76 APPENDIX E @
Appendix F Rehabilitation Strategies for Warren County, MS
@ APPENDIX F 77

@
~ ~ ~ ~ 'I \0
Test Section
Jeff Davis Road 0+00 to 160+00
Jeff Davis Road 160+00 to 440+00
Nine Mile Cutoff
Red Bone Road
Recommended Rehabilitation Options Warren County, MS
Expected Design Life
5 Years 10 Years
Pulverize existing AC Pulverize existing AC surface, blend with existing surface, blend with existing base course and recompact, base course and recompact,
add Double BST 1 add 2" DGAC2
Fix all localized distresses Fix all localized distresses and R&R3 where needed, add and R&R where needed, add
seal coat or other suitable minimum 1%" DGAC surface treatment
Fix all localized distresses Fix all localized distresses and R&R where needed, add and R&R where needed, add
seal coat or other suitable 11h" DGAC surface treatment
Fix all localized distresses Fix all localized distresses and R&R where necessary, and R&R where necessary, add minimum ItA" DGAC add 1%" DGAC
or Apply asphalt/rubber chip
seal
20 years
Pulverize existing AC surface, blend with existing base course and recompact,
add 3" DGAC I
I
Fix all localized distresses and R&R where needed, add
21h" DGAC
Fix all localized distresses and R&R where needed, add
2%"DGAC
Fix all localized distresses and R&R where necessary,
add 21h" DGAC or
Pulverize existing AC surface, blend with existing base course and recompact,
add 3" DGAC

QC <=
~ ~ ~ ~
@ Test Section
U.S. Highway 80
Gibson Road
Mount Alban Road
Recommended Rehabilitation Options Warren County, MS
Expected Design Life
5 Years 10 Years
Localized patching and Repair broken slabs plus routine maintenance to diamond grinding
restore/maintain ride quality or Apply stress relieving layer4,
add 2" DGAC
Localized patching and Fix all localized distresses routine maintenance as and R&R where needed, add
required 11h"DGAC or or
Fix all localized distresses Pulverize existing AC and R&R where needed, add surface, blend with existing
minimum 11,4" DGAC base course and recompact, add Double BST
Repair/reinforce pavement Repair/reinforce pavement edges, fix all localized edges, fix all localized
distresses and R&R where distresses and R&R where necessary, add minimum necessary, add Ilh" DGAC
l1,4"DGAC or
Apply asphalt/rubber chip seal
20 years
Crack & seat (or rubblize), add 3" DGAC
or Stabilize joints, add 2" asphalt rubber hot mix
overlay
Fix all localized distresses and R&:R where needed, add
21h"DGAC or
Pulverize existing AC surface, blend with existing base course and recompact,
add 3" DGAC
Repair/reinforce pavement edges, fix all localized
distresses and R&R where necessary, add 21h" DGAC
or Pulverize existing AC
surface, blend with existing base course and recompact,
add 3" DGAC
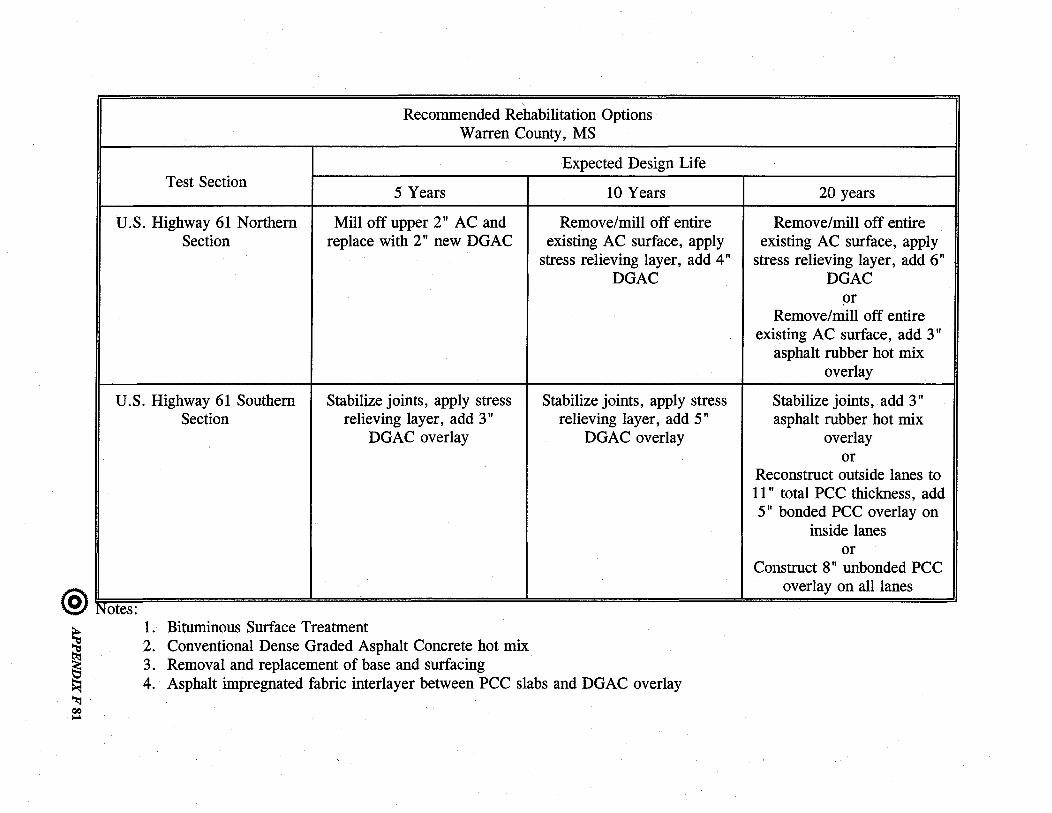
Recommended Rehabilitation Options Warren County, MS
Expected Design Life Test Section
5 Years 10 Years
U.S. Highway 61 Northern Mill off upper 2" AC and Remove/mill off entire Section replace with 2" new DGAC
U.S. Highway 61 Southern Stabilize joints, apply stress
@ Notes: 1.
~ 2. "tI
~ 3.
Section relieving layer, add 3" DGAC overlay
Bituminous Surface Treatment Conventional Dense Graded Asphalt Concrete hot mix Removal and replacement of base and surfacing
existing AC surface, apply stress relieving layer, add 4"
DGAC
Stabilize joints, apply stress relieving layer, add 5"
DGAC overlay
~ 4. Asphalt impregnated fabric interlayer between PCC slabs and DGAC overlay ~ QC I-'
20 years
Remove/mill off entire existing AC surface, apply
stress relieving layer, add 6" DGAC
or Remove/mill off entire
existing AC surface, add 3" asphalt rubber hot mix
overlay
Stabilize joints, add 3" asphalt rubber hot mix
overlay or
Reconstruct outside lanes to 11" total PCC thickness, add 5" bonded PCC overlay on
inside lanes or
Construct 8" unbonded PCC overlay on all lanes
Appendix G Cincinnati, OH Test Sections
@ APPENDIX G 83
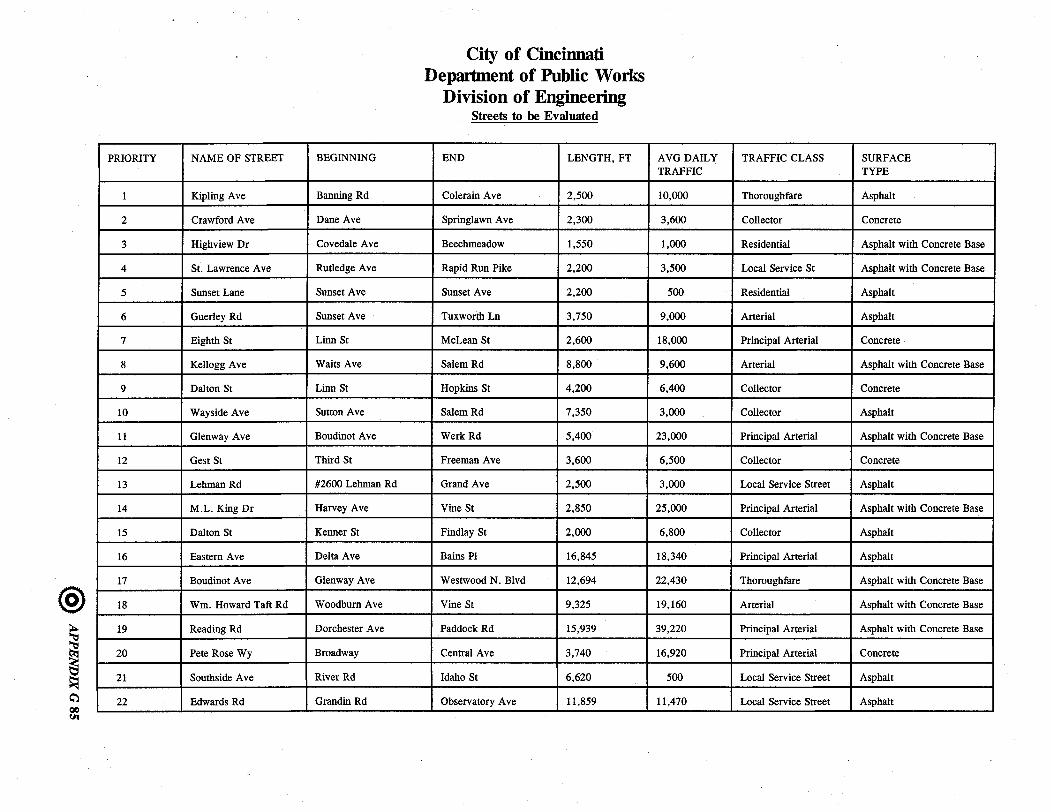
@
~ § ~ ~ QO !II
PRIORITY
1
2
3
4
5
6
7
8
9
10
11
12
13
14
15
16
17
18
19
20
21
22
NAME OF STREET
Kipling Ave
Crawford Ave
Highview Dr
St. Lawrence Ave
Sunset Lane
GuerJey Rd
Eighth St
Kellogg Ave
Dalton St
Wayside Ave
Glenway Ave
Gest St
Lehman Rd
M.L. King Dr
Dalton St
Eastern Ave
Boudinot Ave
Wm. Howard Taft Rd
Reading Rd
Pete Rose Wy
Southside Ave
Edwards Rd
BEGINNING
Banning Rd
Dane Ave
Covedale Ave
Rutledge Ave
Sunset Ave
Sunset Ave
Linn St
Waits Ave
Linn St
Sutton Ave
Boudinot Ave
Third St
#2600 Lehman Rd
Harvey Ave
Kenner St
Delta Ave
Glenway Ave
WoodbumAve
Dorchester Ave
Broadway
River Rd
Grandin Rd
City of Cincinnati Department of Public Works
Division of Engineering Streets to be Evaluated
END LENGTH,FT
Colerain Ave 2,500
Springlawn Ave 2,300
Beechmeadow 1,550
Rapid Run Pike 2,200
Sunset Ave 2,200
Tuxworth Ln 3,750
McLean St 2,600
Salem Rd 8,800
Hopkins St 4,200
Salem Rd 7,350
Werk Rd 5,400
Freeman Ave 3,600
Grand Ave 2,500
Vine St 2,850
Findlay St 2,000
Bains PI 16,845
Westwood N. Blvd 12,694
Vine St 9,325
Paddock Rd 15;939
Central Ave 3,740
Idaho St 6,620
Observatory Ave 11,859
AVG DAILY TRAFFIC
10,000
3,600
1,000
3,500
500
9,000
18,000
9,600
6,400
3,000
23,000
6,500
3,000
25,000
6,800
18,340
22,430
19,160
39,220
16,920
500
11,470
TRAFFIC CLASS SURFACE TYPE
Thoroughfare Asphalt
Collector Concrete
Residential Asphalt with Concrete Base
Local Service St Asphalt with Concrete Base
Residential Asphalt
Arterial Asphalt
Principal Arterial Concrete
Arterial Asphalt with Concrete Base
Collector Concrete
Collector Asphalt
Principal Arterial Asphalt with Concrete Base
Collector Concrete
Local Service Street Asphalt
Principal Arterial Asphalt with Concrete Base
Collector Asphalt
Principal Arterial Asphalt
Thoroughfare Asphalt with Concrete Base
Arterial Asphalt with Concrete Base
Principal Arterial Asphalt with Concrete Base
Principal Arterial Concrete
Local Service Street Asphalt
Local Service Street Asphalt
Appendix H Rehabilitation Strategies for Cincinnati, OH
@ APPENDIX H 87
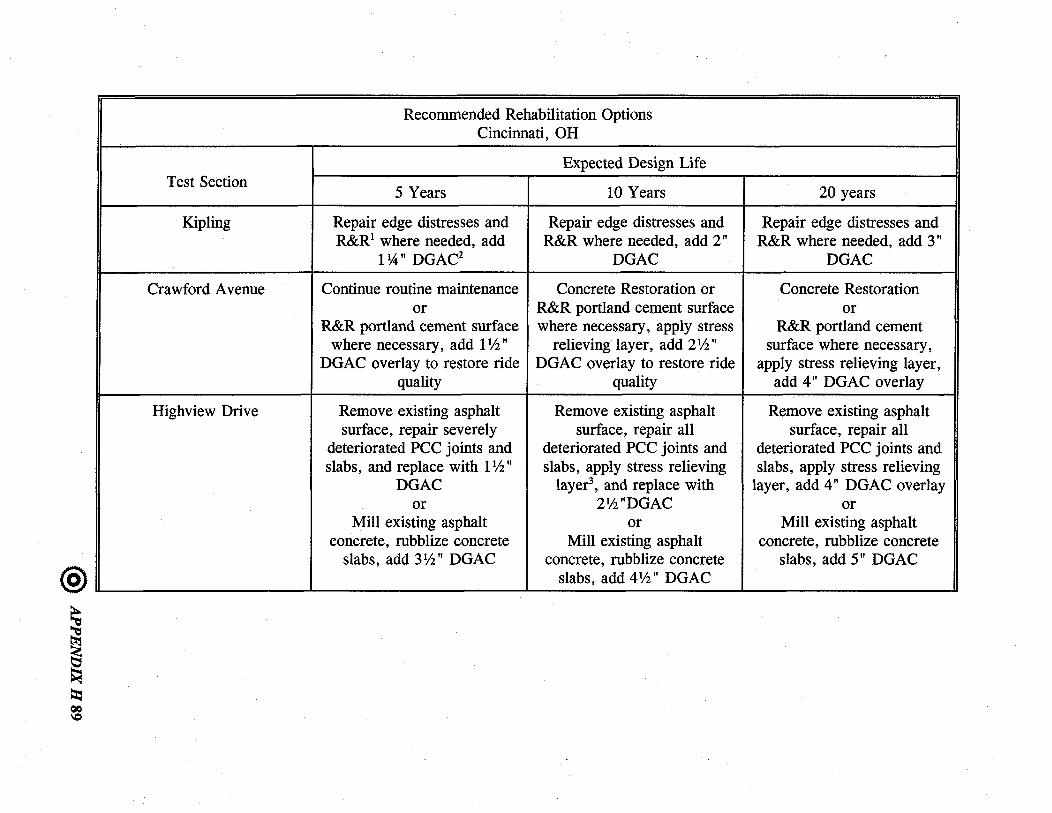
@
~ ~ ~ tx= ClIO ~
--
Test Section
Kipling
Crawford Avenue
Highview Drive
Recommended Rehabilitation Options Cincinnati, OH
Expected Design Life
5 Years 10 Years
Repair edge distresses and Repair edge distresses and R&R 1 where needed, add R&R where needed, add 2"
1~" DGAC2 DGAC
Continue routine maintenance Concrete Restoration or or R&R portland cement surface
R&R portland cement surface where necessary, apply stress where necessary, add I1h" relieving layer, add 21h"
DGAC overlay to restore ride DGAC overlay to restore ride quality quality
Remove existing asphalt Remove existing asphalt surface, repair severely surface, repair all
deteriorated PCC joints and deteriorated PCC joints and slabs, and replace with I1h" slabs, apply stress relieving
DGAC layer3, and replace with or 21h"DGAC
Mill existing asphalt or concrete, rubblize concrete Mill existing asphalt
slabs, add 31h" DGAC concrete, rubblize concrete slabs, add 41h" DGAC
20 years
Repair edge distresses and R&R where needed, add 3"
DGAC
Concrete Restoration or
R&R portland cement surface where necessary,
apply stress relieving layer, add 4" DGAC overlay
Remove existing asphalt surface, repair all
deteriorated PCC joints and slabs, apply stress relieving
layer, add 4" DGAC overlay or
Mill existing asphalt concrete, rubblize concrete
slabs, add 5" DGAC

\C> Q
~ ~ ~ ~ ~
@
Test Section
St. Lawrence Avenue
Sunset Lane
Guerley Road
Recommended Rehabilitation Options Cincinnati, OH
Expected Design Life
5 Years 10 Years
Continue routine maintenance Remove existing asphalt surface, repair severely
deteriorated PCC joints and slabs, replace with 21h"
DGAC or
Mill existing asphalt concrete, rubblize concrete
slabs, add 4" DGAC
Localized patching, add Ilh" Same as 5 years DGAC overlay to restore ride
quality
Fix all localized distresses, Fix all localized distresses, R&R where necessary, add R&R where necessary, add
Ilh" DGAC overlay 2" DGAC overlay or
Apply 1 ~" asphalt rubber hot mix overlay
---------- ------
20 years
Remove existing asphalt surface, repair damaged
PCC joints and slabs, apply stress relieving layer, add 4"
DGAC overlay or
Mill existing asphalt concrete, rubblize concrete
slabs, add 5" DGAC
Same as 5 years
Fix all localized distresses, R&R where necessary, add
3" DGAC overlay or
Apply 2" asphalt rubber hot mix overlay
or Pulverize existing asphalt
surfacing, blend with existing base course,
..... recompact, add 3" DGAC

® ~ ~ ~ t:x:: IC
"'""
Test Section
Eight Street
Kellogg Avenue
Recommended Rehabilitation Options Cincinnati, OH
Expected Design Life
5 Years 10 Years
Continue routine/repair Repair damaged PCC joints maintenance and slabs, apply stress
relieving layer, add 2" DGAC overlay
or Repair damaged PCC joints and slabs, add Ph" asphalt
rubber hot mix overlay
Continue routine maintenance Remove existing asphalt surface, repair damaged PCC joints and slabs, apply stress
relieving layer, add 21h" DGAC overlay
or Remove existing asphalt
surface, repair damaged PCC joints and slabs, add 2" asphalt rubber hot mix
overlay
20 years
Repair damaged PCC joints and slabs, apply stress relieving layer, add 3"
DGAC overlay or
Repair damaged PCC joints and slabs, add 2" asphalt rubber hot mix overlay
Remove existing asphalt surface, repair damaged
PCC joints and slabs, apply stress relieving layer, add 4"
DGAC overlay or
Remove existing asphalt surface, repair damaged
PCC joints and slabs, add 3" asphalt rubber hot mix
overlay ----------

\C:> N
~ ~ ~ ~
@
Test Section
Dalton Street Southern Section
Wayside Avenue
Glenway Avenue
Recommended Rehabilitation Options Cincinnati, OH
Expected Design Life
5 Years 10 Years
Continue routine maintenance Repair damaged PCC joints and slabs, apply stress relieving layer, add 2"
DGAC overlay or
Repair damaged PCC joints and slabs, add 11h" asphalt
rubber hot mix overlay
Continue routine maintenance 11h" DGAC overlay
Continue routine maintenance Apply stress relieving layer, add 2lh" DGAC
or Apply 2" asphalt rubber hot
mix overlay
20 years
Repair damaged PCC joints and slabs, apply stress relieving layer, add 3"
DGAC overlay or
Repair damaged PCC joints and slabs, add 2" asphalt rubber hot mix overlay
21h" DGAC overlay
Remove existing asphalt surface, repair damaged
PCC joints and slabs, apply stress relieving layer, add 4"
DGAC overlay or
Remove existing asphalt surface, repair damaged
PCC joints and slabs, add 3" asphalt rubber hot mix
overlay

® ~ ~ ~ t:t: IC ~
Test Section
Gest Street
Lehman Road
Recommended Rehabilitation Options Cincinnati, OH
Expected Design Life
5 Years 10 Years
Continue routine maintenance Repair damaged PCC joints and slabs, apply stress relieving layer, add 2"
DGAC overlay or
Repair damaged PCC joints and slabs, add 1lh." asphalt
rubber hot mix overlay
Repair all localized Install edge drains, repair all distresses, R&R where localized distresses, R&R
necessary, add 1lh." DGAC where necessary, add 2" overlay DGAC overlay
20 years
Repair damaged PCC joints and slabs, apply stress relieving layer, add 3"
DGAC overlay or
Repair damaged PCC joints and slabs, add 2" asphalt rubber hot mix overlay
or Rubblize PCC and place 4"
AC
Pulverize existing asphalt surfacing, blend with existing base course,
recompact, install underdrains between stations
8+00 and 17+00, add 3" DGAC over entire project
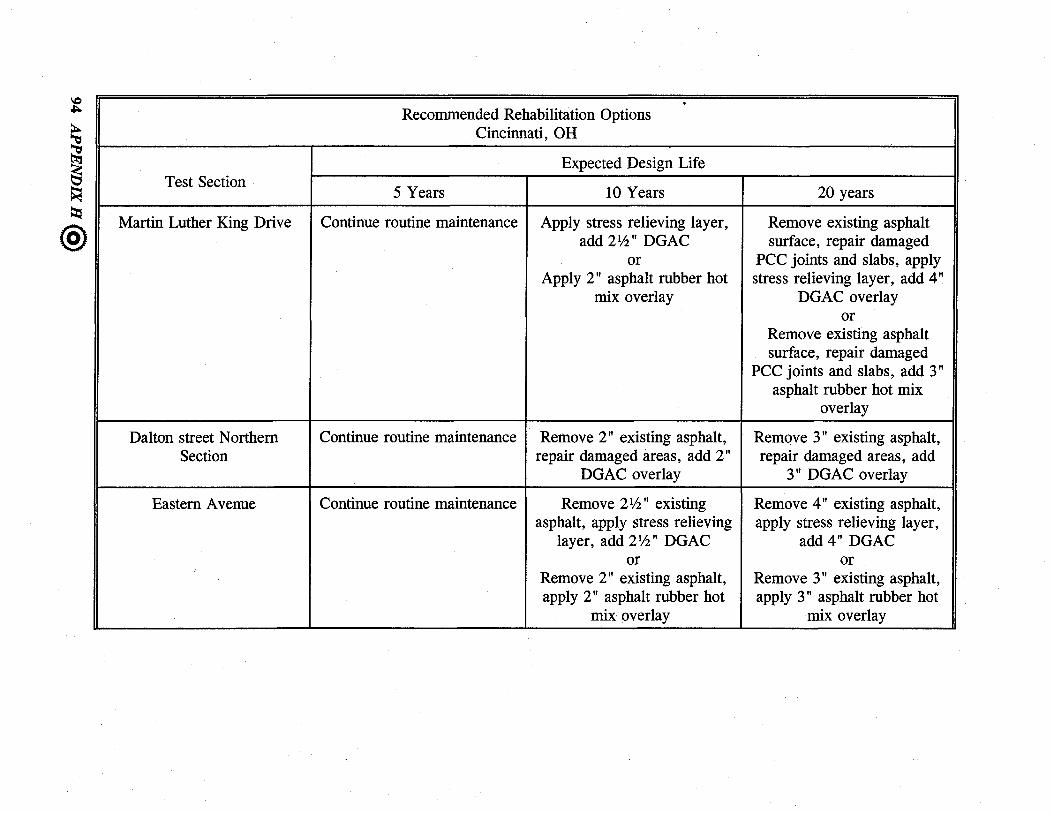
\C) ~
~ ~ ~ ~
®
Test Section
Martin Luther King Drive
Dalton street Northern Section
Eastern Avenue
. Recommended Rehabilitation Options
Cincinnati, OR
Expected Design Life
5 Years 10 Years
Continue routine maintenance Apply stress relieving layer, add 21h" DGAC
or Apply 2" asphalt rubber hot
mix overlay
Continue routine maintenance Remove 2" existing asphalt, repair damaged areas, add 2"
DGAC overlay
Continue routine maintenance Remove 21h" existing asphalt, apply stress relieving
layer, add 21h" DGAC or
Remove 2" existing asphalt, apply 2" asphalt rubber hot
mix, overlay
20 years
Remove existing asphalt surface, repair damaged
PCC joints and slabs, apply stress relieving layer, add 4"
DGAC overlay or
Remove existing asphalt surface, repair damaged
PCC joints and slabs, add 3" asphalt rubber hot mix
overlay
Remove 3" existing asphalt, repair damaged areas, add
3" DGAC overlay
Remove 4" existing asphalt, apply stress relieving layer,
add 4" DGAC or
Remove 3" existing asphalt, apply 3" asphalt rubber hot
mix overlay

@
~ ~ ~ I:l:: \C (II
Test Section
Boudinot Avenue
Recommended Rehabilitation Options Cincinnati, OH
Expected Design Life
5 Years 10 Years
Continue routine maintenance Remove existing asphalt surface, repair damaged PCC joints and slabs, apply stress
relieving layer, add 21h" DGAC overlay
or Remove existing asphalt
surface, repair damaged PCC joints and slabs, add 2" asphalt rubber hot mix
overlay
20 years
Remove existing asphalt surface, repair damaged
PCC joints and slabs, apply stress relieving layer, add 4"
DGAC overlay or
Remove existing asphalt surface, repair damaged
PCC joints and slabs, add 3" asphalt rubber hot mix
overlay
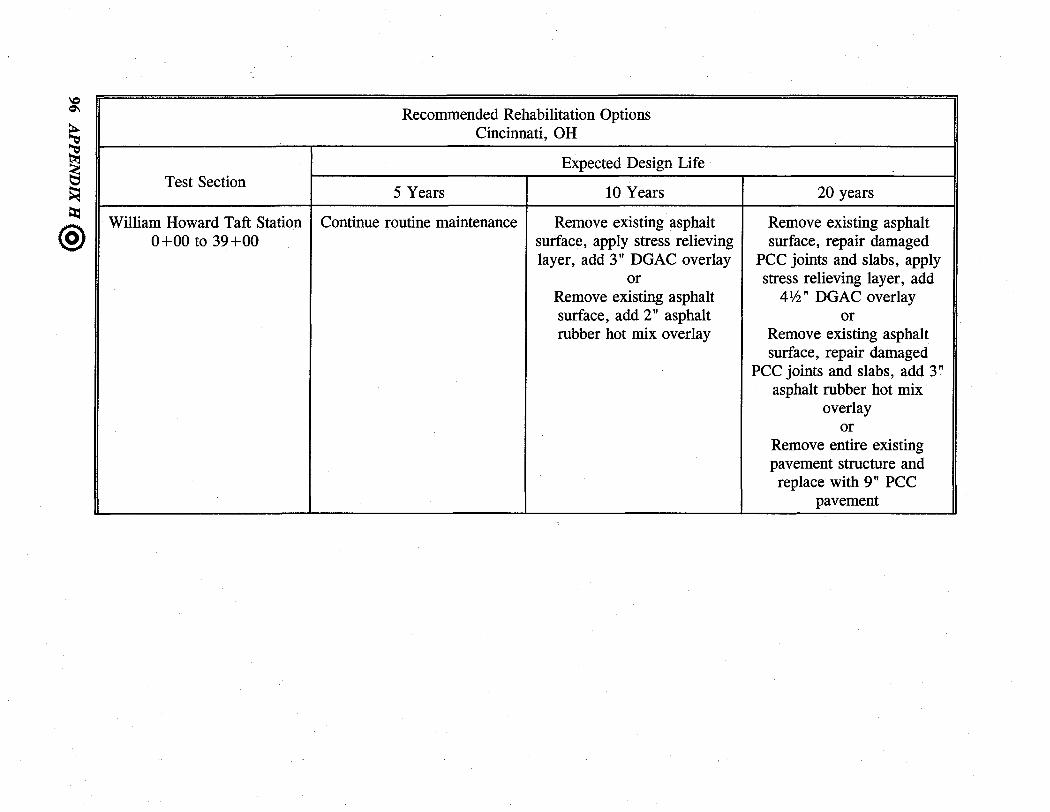
~ Q'I
~ ~ ~ ~ t:I:l
@
Test Section
William Howard Taft Station 0+00 to 39+00
Recommended Rehabilitation Options Cincinnati, OH
Expected Design Life
5 Years 10 Years
Continue routine maintenance Remove existing asphalt surface, apply stress relieving layer, add 3" DGAC overlay
or Remove existing asphalt surface, add 2" asphalt rubber hot mix overlay
20 years
Remove existing asphalt surface, repair damaged
PCC joints and slabs, apply stress relieving layer, add
4th" DGAC overlay or
Remove existing asphalt surface, repair damaged
PCC joints and slabs, add 3" asphalt rubber hot mix
overlay or
Remove entire existing pavement structure and replace with 9" PCC
pavement

@ ~ ~ ~ ~ I:z:l \C ~
Test Section
William Howard Taft Station 39+00 to 93+84
Reading Road
Recommended Rehabilitation Options Cincinnati, OH
Expected Design Life
5 Years 10 Years
Remove existing asphalt Remove existing asphalt surface, repair damaged PCC surface, repair damaged PCC joints and slabs, apply stress joints and slabs, apply stress
relieving layer, add Ilh" relieving layer, add 2lh" DGAC overlay DGAC overlay
or Remove existing asphalt
surface, repair damaged PCC joints and slabs, add Ph"
asphalt rubber hot mix overlay
Continue routine maintenance Remove 2lh" of existing asphalt surface, apply stress
relieving layer, add 2lh" DGAC overlay
or Remove 2" of existing asphalt surface, add 2" asphalt rubber hot mix
overlay
;20 years
Remove existing asphalt surface, repair damaged
PCC joints and slabs, apply stress relieving layer, add 4"
DGAC overlay or
Remove existing asphalt surface, repair damaged
PCC joints and slabs, add 21h" asphalt rubber hot mix
overlay
Remove 4" of existing asphalt surface, apply stress
relieving layer, add 4" DGAC overlay
or Remove 3" of existing asphalt surface, add 3" asphalt rubber hot mix
overlay

~ 00
~ ~ ~ b:l
®
Notes:
Recommended Rehabilitation Options Cincinnati, OH
Expected Design Life Test Section
5 Years 10 Years
Pete Rose Way Continue routine maintenance Conduct localized concrete pavement restoration as
required
Soutside Avenue Continue routine maintenance Maintain/restore surface texture with surface treatment or minimum DGAC overlay
Edwards Road Apply I1h" DGAC overlay to Remove 2" of existing restore ride quality and asphalt surface, repair
appearance distressed areas, add 21h" DGAC overlay
or Repair distressed areas, add 2" asphalt rubber hot mix
overlay
1. Removal and replacement of base and surfacing 2. Conventional Dense Graded Asphalt Concrete hot mix 3. Asphalt impregnated fabric interlayer between PCC slabs and DGAC overlay
20 years
Repair damaged PCC joints and slabs, apply stress relieving layer, add 3"
DGAC overlay or
Repair damaged PCC joints and slabs, add 2" asphalt rubber hot mix overlay
Maintain/restore surface texture with surface
treatment or minimum DGAC overlay
Pulverize existing asphalt surfacing, blend with existing base course,
recompact, add 4" DGAC over entire project

Appendix I Berkeley, CA Test Sections
® APPENDIX I 99
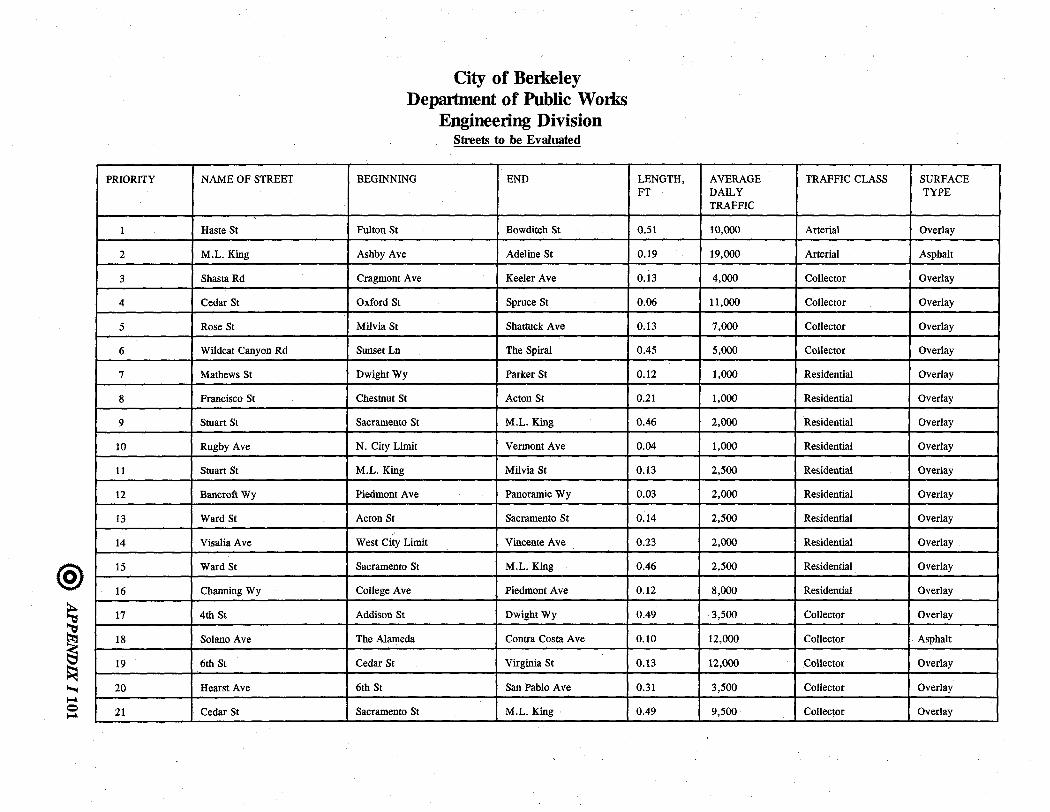
@
~ ~ ~ ~ .... Q ....
PRIORITY
1
2
3
4
5
6
7
8
9
10
11
12
13
14
15
16
17
18
19
20
21
NAME OF STREET
Haste St
M.L. King
Shasta Rd
Cedar St
Rose St
Wildcat Canyon Rd
Mathews St
Francisco St
Stuart St
Rugby Ave
Stuart St
Bancroft Wy
Ward St
Visalia Ave
Ward St
Channing Wy
4th St
Solano Ave
6th St
Hearst Ave
Cedar St
City of BeIkeley Department of Public Works
Engineering Division Streets to be Evaluated
BEGINNING END
Fulton St Bowditch St
Ashby Ave Adeline St
Cragmont Ave Keeler Ave
Oxford St Spruce St
Milvia St Shattuck Ave
Sunset Ln The Spiral
DwightWy Parker St
Chestnut St Acton St
Sacramento St M.L. King
N. City Limit Vermont Ave
M.L. King Milvia St
Piedmont Ave Panoramic Wy
Acton St Sacramento St
West City Limit Vincente Ave
Sacramento St M.L. King
College Ave Piedmont Ave
Addison St DwigbtWy
The Alameda Contra Costa Ave
Cedar St Virginia St
6th St San Pablo Ave
Sacramento St M.L. King
LENGTH, AVERAGE TRAFFIC CLASS SURFACE FT DAILY TYPE
TRAFFIC
0.51 10,000 Arterial Overlay
0.19 19,000 Arterial Asphalt
0.13 4,000 Collector Overlay
0.06 11,000 Collector Overlay
0.13 7,000 Collector Overlay
0.45 5,000 Collector Overlay
0.12 1,000 Residential Overlay
0.21 1,000 Residential Overlay
0.46 2,000 Residential Overlay
0.04 1,000 Residential Overlay
0.13 2,500 Residential Overlay
0.03 2,000 Residential Overlay
0.14 2,500 Residential Overlay
0.23 2,000 Residential Overlay
0.46 2,500 Residential Overlay I
0.12 8,000 Residential Overlay I
0.49 3,500 Collector Overlay
0.10 12,000 Collector Asphalt
0.13 12,000 Collector Overlay
0.31 3,500 Collector Overlay
0.49 9,500 Collector Overlay

""'" Q N
~ ~ ~ ~
@
PRIORITY
22
23
24
25
26
28
29
31
32
33
34
35
36
37
38
39
40
41
42
43
45
46
47
48
49
NAME OF STREET
Cedar St
Woolsey St
West St
62nd St
8th St
Jones St
Euclid Ave (NB)
Grant St
Regal Rd
Parker St
Vine St
Bonita Ave
Vine St
Neilson St
Euclid Ave
Henry St
Curtis St
Vine St
Bonita Ave
Channing Way
Mendocino Ave
Napa Ave
Adeline St
Adeline St
M.L. King
BEGINNING END
6th St San Pablo Ave
Tremont St Telegraph Ave
Bancroft Wy Dwight Wy
M.L. King City Limit
Columbus School DwightWy
4th St 6th St
Beg of Divided Rd End of Divided Rd
Rose St Cedar St
Marin Ave Euclid Ave
4th St San Pablo Ave
Milvia St Shattuck Ave
Rose St Vine St
M.L. King Miliva St
North City Limit Bartd
End of Divided Rd Eunice St
Rose St Vine St
North City Limit Hopkins St
Edith St Grant St
Cedar St Virginia St
10th St San Pablo Ave
Arlington Ave Los Angeles Ave
The Alameda Hopkins St
Derby St Stuart St
Alcatraz Ave South City Limit
Adeline St South City Limit
LENGTH, AVERAGE TRAFFIC CLASS SURFACE FT DAILY TYPE
TRAFFIC
0.31 11,000 Collector Overlay
0.43 4,000 Residential Overlay
0.25 1,000 Residential Overlay
0.10 1,000 Residential Overlay
0.32 1,500 Residential Overlay
0.13 1,500 Residential Overlay
0.16 3,000 Residential Concrete
0.25 1,500 Residential Overlay
0.10 1,500 Residential Overlay
0.44 2,500 Residential Overlay
0.13 5,000 Residential Overlay
0.13 2,000 Residential Overlay
0.13 3,500 Residential Overlay
0.17 2,000 Residential Overlay
0.17 6,000 Residential Overlay
0.13 4,000 Residential Overlay
0.45 2,500 Residential Overlay
0.06 2,000 Residential Overlay
0.13 2,000 Residential Overlay
0.05 3,500 Residential Overlay
0.31 1,000 Residential Overlay
0.18 800 Residential Overlay
0.14 17,000 Arterial Concrete
0.20 36,000 Arterial Asphalt
0.06 38,000 Arterial Asphalt

@
~ ~ ~ ~ ~ <:> ~
PRIORITY
50
51
53
54
55
56
57
58
59
60
63
64
65
66
67
68
69
71
72
73
74
76
77
80
81
NAME OF STREET
Hearst Ave
Sacramento St
Hearst Ave
Seawall Dr
Arcade Ave
California St
Seawall Dr
Prince St
Russell St
Ward St
Oxford St
Hearst Ave
Oxford St
Oxford St
Indian Rock Ave
Russell St
Russell St
Parker St
Alvarado Rd
Hearst Ave
Webster St
Walnut St
Gilman St
Yolo Ave
Addison St
BEGINNING END
Oxford St Spruce St
Oregon St Ashby Ave
McGee Ave M.L. King
University Ave South End
Grizzly Peak Blvd Fairlawn Dr
Oregon St Ashby Ave
North End University Ave
Sacramento St M.L. King
Milvia St Adeline St
Shattuck St Fulton St
University Ave Bancroft Wy
M.L. King Milvia St
Berkeley Way University Ave
Hearst Ave Berkeley Wy
The Circle Santa Barbara Rd
Claremont Blvd East City Limit
College Ave Claremont Blvd
Fulton St Dana St
Bridge Rd North City Limit
San Pablo Ave Acton St
College Ave Claremont Ave
Berkeley Wy University Ave
State P/L 6th St
Milvia Ave Sutter St
Sacramento St M.L. King
LENGTH, AVERAGE TRAFFIC CLASS SURFACE FT DAILY TYPE
TRAFFIC
0.05 25,000 Arterial Overlay
0.19 24,000 Arterial Asphalt
0.26 6,500 Collector Overlay
0.16 3,500 Residential Asphalt
0.06 1,000 Residential Overlay
0.18 3,000 Residential Overlay
0.26 3,500 Residential Overlay
0.42 2,000 Residential Overlay
0.02 1,500 Residential Overlay
0.15 1,500 Residential Overlay
0.32 30,000 Arterial Overlay
0.13 7,500 Arterial Overlay
0.06 28,000 Arterial Overlay
0~05 28,000 Arterial Overlay
0.41 2,000 Residential Overlay
0.03 8,000 Residential Overlay
0.48 2,000 Residential Overlay
0.25 2,500 Residential Overlay
0.36 3,000 Residential Overlay
0.45 3,500 Residential Overlay
0.33 1,500 Residential Overlay
0.06 1,500 Residential Overlay
0.28 21,000 Arterial Overlay
0.07 1,000 Residential Overlay
0.50 2,500 Residential Overlay
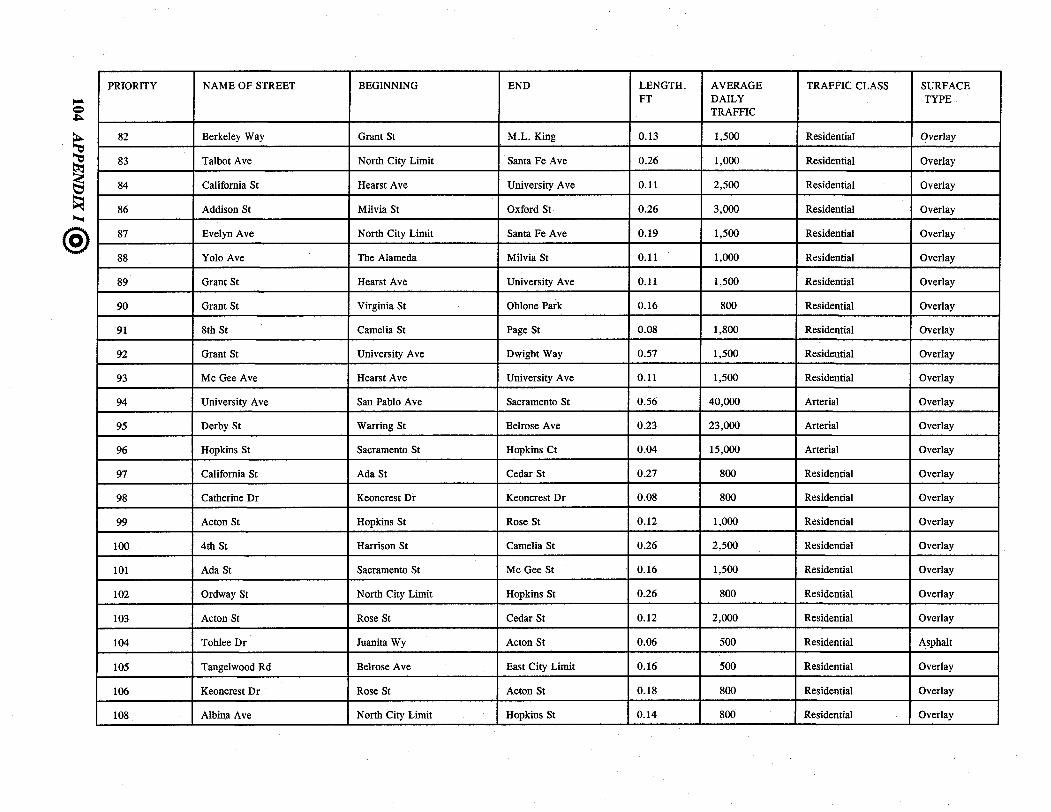
~ Q .a;..
~ ~ ~ ~ .....
@
PRIORITY
82
83
84
86
87
88
89
90
91
92
93
94
95
96
97
98
99
100
101
102
103
104
105
106
108
NAME OF STREET
Berkeley Way
Talbot Ave
California St
Addison St
Evelyn Ave
Yolo Ave
Grant St
Grant St
8th St
Grant St
Mc Gee Ave
University Ave
Derby St
Hopkins St
California St
Catherine Dr
Acton St
4th St
Ada St
Ordway St
Acton St
Tohlee Dr
Tangelwood Rd
Keoncrest Dr
Albina Ave
BEGINNING
Grant St
North City Limit
Hearst Ave
Milvia St
North City Limit
The Alameda
Hearst Ave
Virginia St
Camelia St
University Ave
Hearst Ave
San Pablo Ave
Warring St
Sacramento St
Ada St
Keoncrest Dr
Hopkins St
Harrison St
Sacramento St
North City Limit
Rose St
Juanita Wy
Belrose Ave
Rose St
North City Limit
END LENGTH, AVERAGE TRAFFIC CLASS SURFACE FT DAILY TYPE
TRAFFIC
M.L. King 0.13 1,500 Residential Overlay
Santa Fe Ave 0.26 1,000 Residential Overlay
University Ave 0.11 2,500 Residential Overlay
Oxford St 0.26 3,000 Residential Overlay
Santa Fe Ave 0.19 1,500 Residential Overlay
Milvia St 0.11 1,000 Residential Overlay
University Ave 0.11 1,500 Residential Overlay
Ohlone Park 0.16 800 Residential Overlay
Page St 0.08 1,800 Residential Overlay
Dwight Way 0.57 1,500 Residential Overlay
University Ave 0.11 1,500 Residential Overlay
Sacramento St 0.56 40,000 Arterial Overlay
Belrose Ave 0.23 23,000 Arterial Overlay
Hopkins Ct 0.04 15,000 Arterial Overlay
Cedar St 0.27 800 Residential Overlay
Keoncrest Dr 0.08 800 Residential Overlay
Rose St 0.12 1,000 Residential Overlay
Camelia St 0.26 2,500 Residential Overlay
Mc Gee St 0.16 1,500 Residential Overlay
Hopkins St 0.26 800 Residential Overlay
Cedar St 0.12 2,000 Residential Overlay
Acton St 0.06 500 Residential Asphalt
East City Limit 0.16 500 Residential Overlay
Acton St 0.18 800 Residential Overlay
Hopkins St 0.14 800 Residential Overlay

@
~ ~ ~ ""'" I-l Q (It
PRIORITY
109
110
III
112
123
124
129
138
140
144
145
146
159
166
167
168
169 ....... _-
NAME OF STREET
Hopkins St
Hopkins St
College Ave
College Ave
Dwight Wy
DwightWy
Haskell St
Piedmont Crescent
Prospect St
The Uplands
Telegraph Ave
Telegraph Ave
Cedar St
University Ave
7th St
7th St
East Frontage Rd
BEGINNING END
Gilman St Sacramento St
Peralta Ave Gilman St
Derby St Ashby Ave
DwightWy Derby St
Sacramento St M.L. King
Milvia Wy Shattuck Ave
San Pablo Ave Acton St
DwightWy Warring St
US Campus (Stadium) Dwight Wy
Hillcrest Rd Tunnel Rd
Dwight Wy Ward St
Ward St Ashby Ave
Shattuck Ave Oxford St
6th St San Pablo Ave
DwightWy Grayson St
Grayson St Heinz Ave
Gilman St University Ave
LENGTH, AVERAGE TRAFFIC CLASS SURFACE FT DAILY TYPE
TRAFFIC
0.10 17,000 Residential Overlay
0.27 4,000 Residential Overlay
0.35 18,000 Arterial Overlay
0.52 16,000 Arterial Overlay
0.50 14,000 Arterial Overlay
0.13 15,000 Arterial Overlay
0.29 1,000 Residential Overlay
0.05 22,000 Collector Overlay
0.24 2,500 Residential Overlay
0.30 2,500 Residential Overlay
0.33 21,000 Arterial Overlay
0.30 28,000 Arterial Overlay
0.12 9,000 Collector Overlay
0.31 45,000 Arterial Overlay
0.35 19,000 Collector Overlay
0.13 19,000 Collector Overlay
0.81 6,000 Collector Overlay
Appendix J Rehabilitation Strategies for Berkeley, CA
@ APPENDIX J 107

@
~ ~ ~ ~ .... = IC
Priority Street Name
No.
1 Haste St.
2 Martin Luther King
3 Shasta Rd.
4 Cedar St.
5 Rose St.
6 Wildcat Canyon Rd.
7 Mathews St.
8 Francisco St.
9 Stuart St.
10 Rugby Ave.
11 Stuart St.
12 Bancraft Way
13 Ward St.
14 Visalia Ave.
15 Ward St.
16 Channing Way
17 Fourth St.
18 Solano Ave.
19 Sixth St.
ML = Mill FDP = Full Depth Patching SC = Seal Cracks ST = Surface Treatment
Traffic Area Class Sq. Ft.
A 107200
A 29550
C 27200
C 12060
C 24300
C 57600
R 23220
R 33900
R 86580
R 5880
R 23760
R 4860
R 26172
R 29160
R 87732
R 22680
C 93960
C 22440
C 32400
Recommended Rehabilitation Options Berkeley, CA
Year PCI % Existing AC
Alligator AC (in) Oveday(in)
1963 72 2 5.00 2.00
1971 55 1 16.00 2.00
1969 57 5 1.50 3.50
1957 47 3 5.00 2.00
1950 72 1 3.50 2.00
1969 45 6 4.00 3.00
1969 43 8 2.00 2.00
1950 44 9 1.50 4.00
1948 41 10 2.00 4.00
1963 52 5
1947 42 23 2.00 4.00
1963 41 11 2.50 2.50
1952 67 2 2.00 2.00
1960 51 1 3.50 2.00
1976 44 8 1.00 4.00
1964 50 1 4.50 2.0
1969 46 12 1.50 5.50
1960 61 1 5.00 2.00
1969 55 10 7.00 5.50
Notes: 1. Delay A.C. overlay if there is no safety hazard.
Routine Maintenance Comments
Pre-Oveday T"'1!tme,nt
ML 1", FDP
ML2", FDP
FDP, SC
ML2", FDP
ML 1", FDP
FDP, SC
ML 1", FDP
ML 4", Recompact Base See Note 1
ML 4", Recompact Base See Note 1
This section was not tested, follow the M&R for Priority No. 14
ML 4", Recompact Base See Note 1
ML 2.5", Recompact Base See Note 1
FDP, SC
FDP. SC
ML 4", Recompact Base See Note 1
FDP, SC
ML 5.5", Recompact Base See Note 1
FDP, SC
ML 7", Recompact Base See Note 1
2. Redo the PCI survey for newly defined pavement sections before applyiug any M&R and confirm the recommend M&R based on new distress data

"'"" "'"" = ~ ~ ~ ~
@
I I
Priority StnletName
No.
20 Hearst Ave.
21 Cedar St.
22 Cedar St.
23 Woolsey St.
24 West St.
25 Sixty-Second St.
26.1 Eighth St.
26.2 Eighth St.
28 Jones St.
29 Euclid Ave. (NBl
31 Grant St.
32 Regal Rd.
33 Parker St.
34 Vine St.
35 Bonita Ave.
36 Vine St.
37 Neilson St.
38 Euclid Ave.
39 Henry St.
40 Curtis St.
ML = Mill FDP = Full Depth Patching SC = Seal Cracks ST = Surface Treatment
Traffic Class
C
C
C
R
R
R
R
R
R
R
R
R
R
R
R
R
R
R
R
R
- -----
Area Sq. Ft.
59400
93600
64350
82620
47700
18900
61380
24660
15300
47700
12100
83700
24120
23760
23940
23140
36900
23760
72000
Recommended Rehabilitation Options Berkeley, CA
-----------------
Year PCI % 'Existing AC
Alligator AC (in) Overlay (in)
1950 59 1 4.50 2.00
1964 73 2 4.50 2.00
1958 47 8 6.50 0.00
1952 46 1 2.75 2.00
1974 70 2 3.00 2.00
1967 45 8 5.00 2.00
1950 68 9 1.50 4.50
1950 68 9 4.50 0.00
1952 42 2 3.00 2.00
1965 43 0 1.00 2.00
1965 61 2 4.00 0.00
1950 48 7 4.00 0.00
1963 50 8 3.00 2.00
1966 50 5 7.00 0.00
1952 61 2 3.50 2.00
1966 54 4 3.00 2.00
1950 64 4 3.00 2.00
1965 46 0 3.50 2.00
1965 50 2 4.00 3.00
1950 66 3 4.00 3.00
RoUtine ,Maintenance Comments
Pre-Overlay Treatment
FDP,SC
ML I", FDP
FDP, SC
ML 1.5", FDP
ML 1.5", FDP
ML2", FDP
ML 4.5" Recompact Base See Notes 1 & 2
Apply M&R Policy See Note 2
ML 0.5", FDP
ML 1", Saw Joints in Overlay
FDP, ST
FDP, SC, ST
FDP
FDP,ST
ML I", FDP
FDP
FDP
ML2"
ML1", FDP
FDP
Notes: 1. Delay A.C. overlay if there is no safety hazard. 2. Redo the PCI survey for newly defined pavement sections before applying any M&R and confirm the recommend M&R based on new
distress data

@
~ ~ ~ ~ ~ ~ ~
Priority Street Name
No.
41 Vine St.
42 Bonita Ave.
43 Channing Way
45 Mendocino Ave.
46 Napa Ave.
47 Adeline St.
48 Adeline St.
49 Martin Luther King
50 Hearst Ave.
51 Sacramento St.
53 Hearst Ave.
54 Seawall Dr.
55 Arcade Ave.
56 California St.
57 Seawall Dr.
58.1 Prince St.
58.2 Prince St.
59 Russell St.
60 Ward St.
63 Oxford St.
ML = Mill FDP = Full Depth Patching SC = Seal Cracks ST = Surface Treatment
Traffic Area Class Sq. Ft.
R 12060
R 24120
R 6000
R 52800
R 1536
A 60000
A 79420
A 25460
A 14500
A 57176
C 48780
R 23800
R 7750
R 39900
R 37800
R 79920
R
R 4140
R 28080
A 135200
Recommended Rehabilitation Options Berkeley, CA
Year PC! '% Existin; AC
Alligator AC (in) Overlay (in)
1968 52 4 3.50 0.00
1958 62 1 2.00 2.00
1966 52 7 4.00 2.00
1960 41 16 3.00 3.00
1966 40 6 3.00 2.00
1969 57 0, 15.00 0.00
1977 59 0 12.00 0.00
1971 57 0 16.00 0.00
1984 51 4 6.00 2.50
1980 61 2 6.50 2.00
1959 44 19 3.00 4.50
1962 48 3 3.00 3.00
1950 46 5 3.50 2.00
1946 44 19 1.50 2.00
1962 74 7 2.00 2.00
1967 71 2 3.00 2.00
1967 71 2 3.75 0.00
1966 50 3 13.00 0.00
1966 48 8 2.00 2.00
1964 58 10 6.00 5.50
Notes: 1. Delay A.C. overlay if there is no safety hazard.
Routine MalntelUlllCe Comments
Pre~OveriIlY Treatment
FDP, ST
FDP
MLl", FDP
ML 3", Recompact Base See Note 1
ML 1", FDP
SC
SC
SC,ST
FDP
ML 1.5", FDP
ML 4.5", Recompact Base See Note 1
ML 0.5", FDP
ML 1.5", FDP
ML 2", Recompact Base See Note 1
FDP
ML 1.5", FDP See Note 2
Apply M&R Policy See Note 2
FDP,SC
FDP, SC
ML 6", Recompact Base See Note 1
2. Redo the PCI survey for newly defined pavement sections before IlPplying any M&R and confinn the recommend M&R based on new distress data
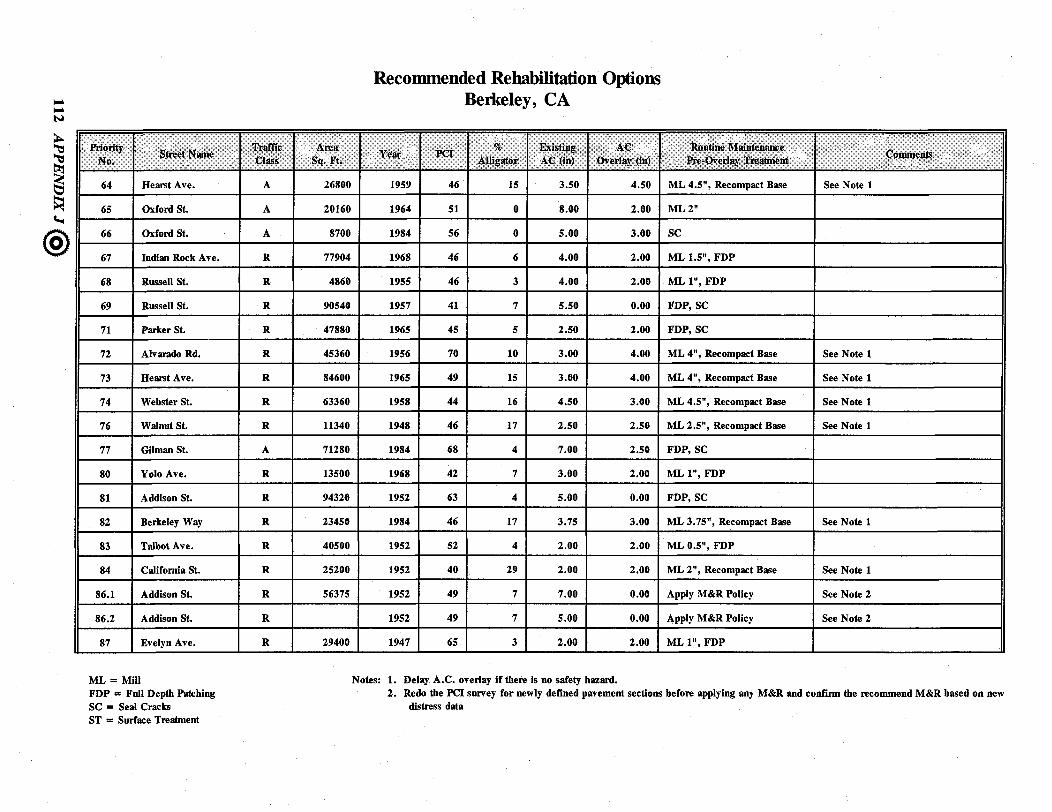
I-" I-" N
~ ~ ~ ~ ~
@
Priority Street.NllIlle
No.
64 Hearst Ave.
65 Oxford St.
66 Oxford St.
67 Indian Rock Ave.
68 Russell St.
69 Russell St.
71 Parker St.
72 Alvarado Rd.
73 Hearst Ave.
74 Webster St.
76 Walnut St.
77 Gilman St.
80 Yolo Ave.
81 Addison St.
82 Berkeley Way
83 Talbot Ave.
84 California St.
86.1 Addison St.
86.2 Addison St.
87 Evelyn Ave.
ML = Mill FDP = Full Depth Patching SC = Seal Cracks ST = Surface Treatment
Traffic Area Class Sq. Ft.
A 26800
A 20160
A 8700
R 77904
R 4860
R 90540
R 47880
R 45360
R 84600
R 63360
R 11340
A 71280
R 13500
R 94320
R 23450
R 40500
R 25200
R 56375
R
R 29400
Recommended Rehabilitation Options Berkeley, CA
Year PCI ~, Existing AC
Alligator At:: (in) Overlay (iu)
1959 46 15 3.50 4.50
1964 51 0 8.00 2.00
1984 56 0 5.00 3.00
1968 46 6 4.00 2.00
1955 46 3 4.00 2.00
1957 41 7 5.50 0.00
1965 45 5 2.50 2.00
1956 70 10 3.00 4.00
1965 49 15 3.00 4.00
1958 44 16 4.50 3.00
1948 46 17 2.50 2.50
1984 68 4 7.00 2.50
1968 42 7 3.00 2.00
1952 63 4 5.00 0.00
1984 46 17 3.75 3.00
1952 52 4 2.00 2.00
1952 40 29 2.00 2.00
1952 49 7 7.00 0.00
1952 49 7 5.00 0.00
1947 65 3 2.00 2.00
Notes: 1. Delay A.C. overlay if there is no safety hazard.
Routine Maintenance Comments
Pre-Overlay Treatment
ML 4.5", Recompact Base See Note 1
ML2"
SC
ML 1.5", FDP
ML I", FDP
FDP, SC
FDP,SC
ML 4", Recompact Base See Note 1
ML 4", Recompact Base See Note 1
ML 4.5", Recompact Base See Note 1
ML 2.5", Recompact Base See Note 1
FDP, SC
ML I", FDP
FDP, SC
ML 3.75", Recompact Base See Note 1
MLO.5", FDP
ML 2", Recompact Base See Note 1
Apply M&R Policy See Note 2
Apply M&R Policy See Note 2
ML I", FDP
2. Redo the PCI survey for newly defined pavement sections before applying any M&R and confirm the recommend M&R based on new distress data
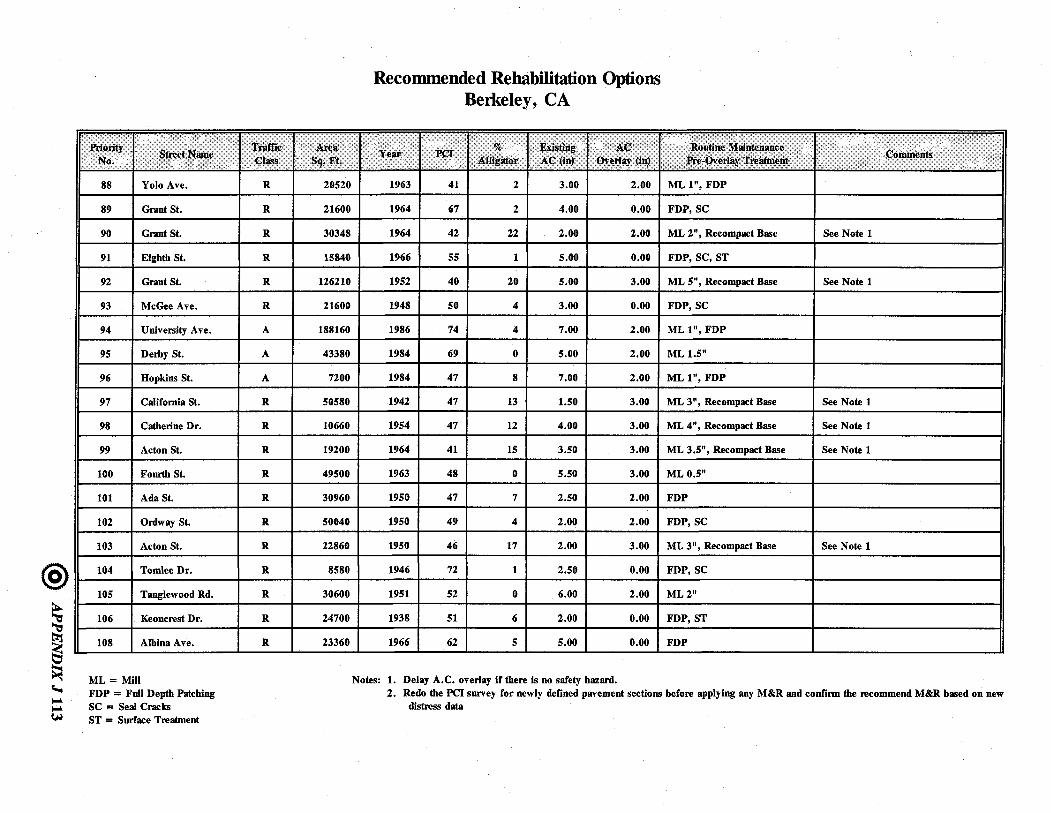
@
~ ~ ~ c.... .... .... ~
Priority Street Name
No.
88 Yolo Ave.
89 Grant St.
90 Grant St.
91 Eighth St.
92 Grant St.
93 McGee Ave.
94 University Ave.
95 Derby St.
96 Hopkins St.
97 California St.
98 Catherine Dr.
99 Acton St.
100 Fourth St.
101 Ada St.
102 Ordway St.
103 Acton St.
104 Tomlee Dr.
105 Tanglewood Rd.
106 Keoncrest Dr.
108 Albina Ave.
ML = Mill FDP = Full Depth Patching SC = Seal Cracks ST = Surface Treatment
Traffic Area Class Sq. Ft.
R 20520
R 21600
R 30348
R 15840
R 126210
R 21600
A 188160
A 43380
A 7200
R 50580
R 10660
R 19200
R 49500
R 30960
R 50040
R 22860
R 8580
R 30600
R 24700
R 23360
Recommended Rehabilitation Options Berkeley, CA
Year PC! % Existing AC
Alligator AC (in) Overlay (in)
1963 41 2 3.00 2.00
1964 67 2 4.00 0.00
1964 42 22 2.00 2.00
1966 55 1 5.00 0.00
1952 40 20 5.00 3.00
1948 50 4 3.00 0.00
1986 74 4 7.00 2.00
1984 69 0 5.00 2.00
1984 47 8 7.00 2.00
1942 47 13 1.50 3.00
1954 47 12 4.00 3.00
1964 41 15 3.50 3.00
1963 48 0 5.50 3.00
1950 47 7 2.50 2.00
1950 49 4 2.00 2.00
1950 46 17 2.00 3.00
1946 72 1 2.50 0.00
1951 52 0 6.00 2.00
1938 51 6 2.00 0.00
1966 62 5 5.00 0.00
Notes: 1. Delay A.C. overlay if there is no safety hazard.
Routine Maintenance Comments
~-Overlay Treiltment
ML 1", FDP
FDP, SC
ML 2", Recompact Base See Note 1
FDP, SC, ST
ML 5", Recompact Base See Note 1
FDP,SC
ML1", FDP
ML 1.5"
ML1", FDP
ML 3", Recompact Base See Note 1
ML 4", Recompact Base See Note 1
ML 3.5", Recompact Base See Note 1
MLO.5"
FDP
FDP, SC
ML 3", Recompact Base See Note 1
FDP,SC
ML2"
FDP, ST
FDP
2. Redo the PCI survey for newly defined pavement sections before applying any M&R and confirm the recommend M&R based on new distress data
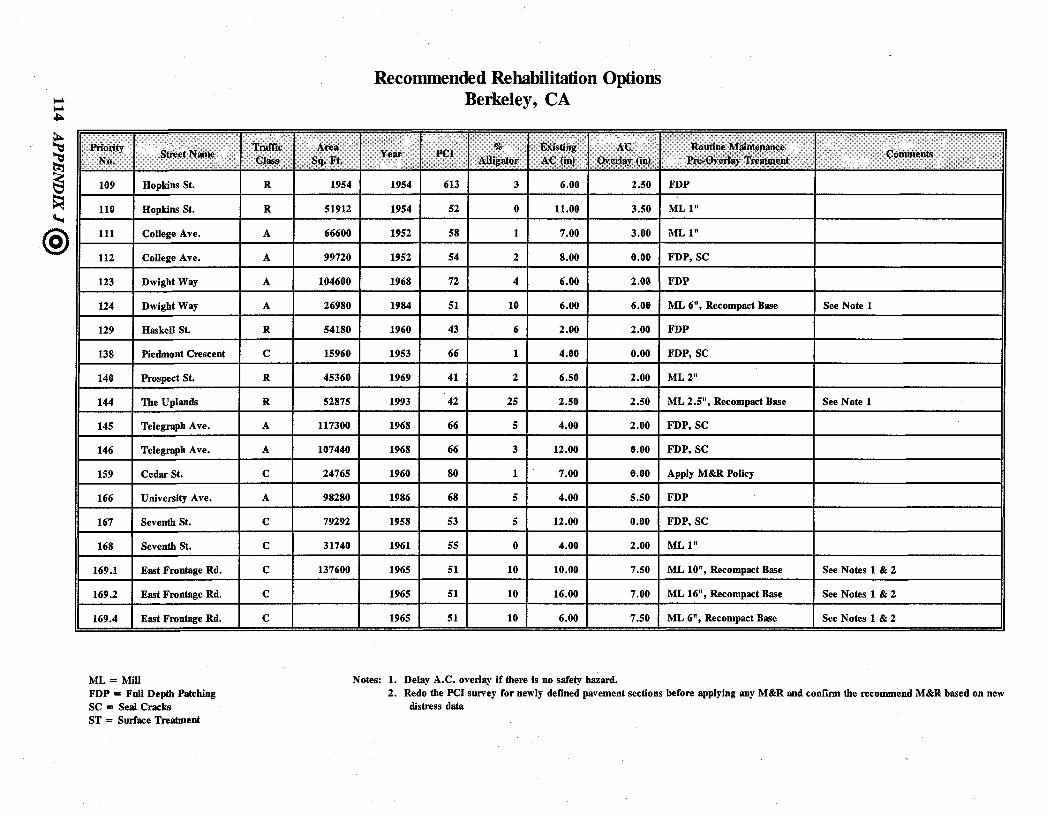
~ ~ .I:Jo,
~ ~ ~ "'-t
@
Prionty Street Name
No.
109 Hopkins St.
110 Hopkins St.
111 College Ave.
112 College Ave.
123 Dwight Way
124 Dwight Way
129 Haskell St.
138 Piedmont Crescent
140 Prospect St.
144 The Uplands
145 Telegraph Ave.
146 Telegraph Ave.
159 Cedar St.
166 University Ave.
167 Seventh St.
168 Seventh St.
169.1 East Frontage Rd.
169.2 East Frontage Rd.
169.4 East Frontage Rd.
ML = Mill FDP = Full Depth Patching SC = Seal Cracks ST = Surface Treatment
Traffic "Area Class Sq. Ft.
R 1954
R 51912
A 66600
A 99720
A 104600
A 26980
R 54180
C 15960
R 45360
R 52875
A 117300
A 107440
C 24765
A 98280
C 79292
C 31740
C 137600
C
C
Recommended Rehabilitation Options Berkeley, CA
----
Year PCI % Existillg AC
Alligator AC (in) Overlay (in)
1954 613 3 6.00 2.50
1954 52 0 11.00 3.50
1952 58 1 7.00 3.00
1952 54 2 8.00 0.00
1968 72 4 6.00 2.00
1984 51 10 6.00 6.00
1960 43 6 2.00 2.00
1953 66 1 4.00 0.00
1969 41 2 6.50 2.00
1993 42 25 2.50 2.50
1968 66 5 4.00 2.00
1968 66 3 12.00 0.00
1960 80 1 7.00 0.00
1986 68 5 4.00 5.50
1958 53 5 12.00 0.00
1961 55 0 4.00 2.00
1965 51 10 10.00 7.50
1965 51 10 16.00 7.00
1965 51 10 6.00 7.50
Notes: 1. Delay A.C. overlay if there is no safety hazard.
----_.-
Routine ~ilintenance Comments
Pre-Overlay Treatment
FDP
ML1"
ML1" I
FDP, SC
FDP
ML 6", Recompact Base See Note 1
FDP
FDP, SC
ML2"
ML 2.5", Recompact Base See Note 1
FDP,SC
FDP, SC
Apply M&R Policy
FDP
FDP,SC
ML1"
ML 10", Recompact Base See Notes 1 & 2
ML 16", Recompact Base See Notes 1 & 2
ML 6", Recompact Base See Notes 1 & 2
2. Redo the PCI survey for newly defined pavement sections before applying any M&R and confirm the recommend M&R based on new distress data

AppendixK Recommended Specifications Template for a Request for Bid
@ APPENDIX K 115
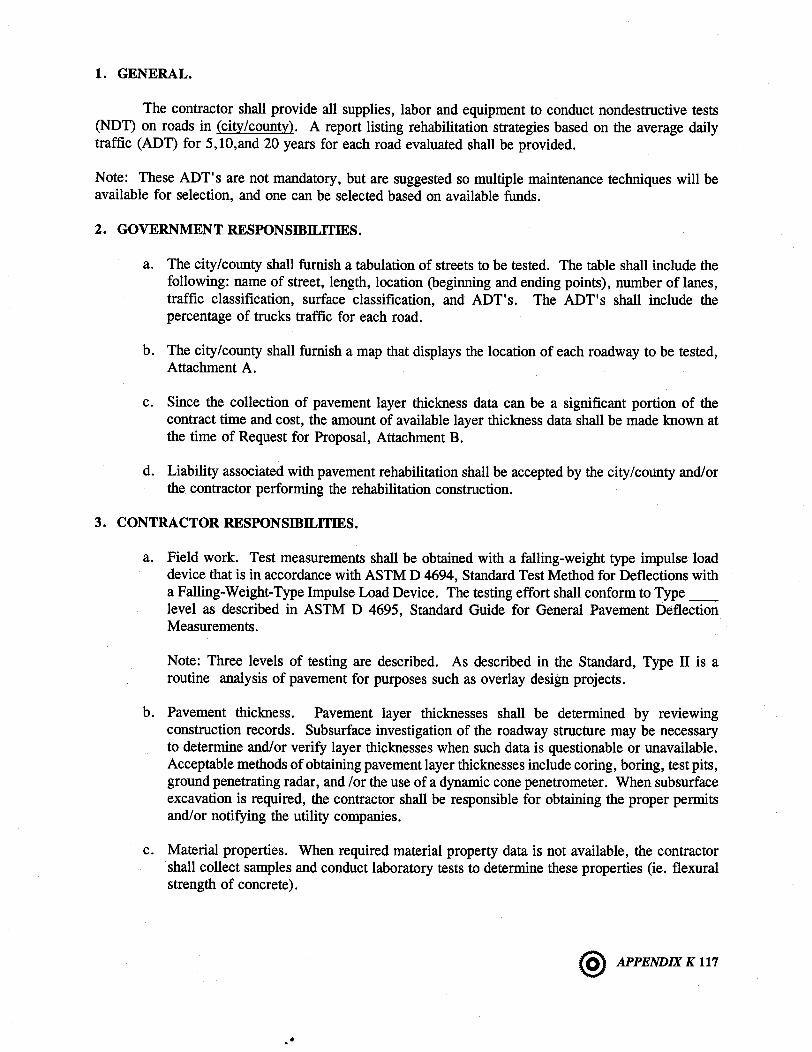
1. GENERAL.
The contractor shall provide all supplies, labor and equipment to conduct nondestructive tests (NDT) on roads in (city/county). A report listing rehabilitation strategies based on the average daily traffic (ADT) for 5,lO,and 20 years for each road evaluated shall be provided.
Note: These ADT's are not mandatory, but are suggested so multiple maintenance techniques will be available for selection, and one can be selected based on available funds.
2. GOVERNMENT RESPONSmILITIES.
a. The city/county shall furnish a tabulation of streets to be tested. The table shall include the following: name of street, length, location (beginning and ending points), number of lanes, traffic classification, surface classification, and ADT's. The ADT's shall include the percentage of trucks traffic for each road.
b. The city/county shall furnish a map that displays the location of each roadway to be tested, Attachment A.
c. Since the collection of pavement layer thickness data can be a significant portion of the contract time and cost, the amount of available layer thickness data shall be made known at the time of Request for Proposal, Attachment B.
d. Liability associated with pavement rehabilitation shall be accepted by the city/county and/or the contractor performing the rehabilitation construction.
3. CONTRACTOR RESPONSmILITIES.
a. Field work. Test measurements shall be obtained with a falling-weight type impulse load device that is in accordance with ASTM D 4694, Standard Test Method for Deflections with a Falling-Weight-Type Impulse Load Device. The testing effort shall conform to Type __ level as described in ASTM D 4695, Standard Guide for General Pavement Deflection Measurements.
Note: Three levels of testing are described. As described in the Standard, Type II is a routine analysis of pavement for purposes such as overlay design projects.
b. Pavement thickness. Pavement layer thicknesses shall be determined by reviewing construction records. Subsurface investigation of the roadway structure may be necessary to determine and/or verify layer thicknesses when such data is questionable or unavailable. Acceptable methods of obtaining pavement layer thicknesses include coring, boring, test pits, ground penetrating radar, and / or the use of a dynamic cone penetrometer. When subsurface excavation is required, the contractor shall be responsible for obtaining the proper permits and/or notifying the utility companies.
c. Material properties. When required material property data is not available, the contractor shall collect samples and conduct laboratory tests to determine these properties (ie. flexural strength of concrete).
@ APPENDIXK117
..
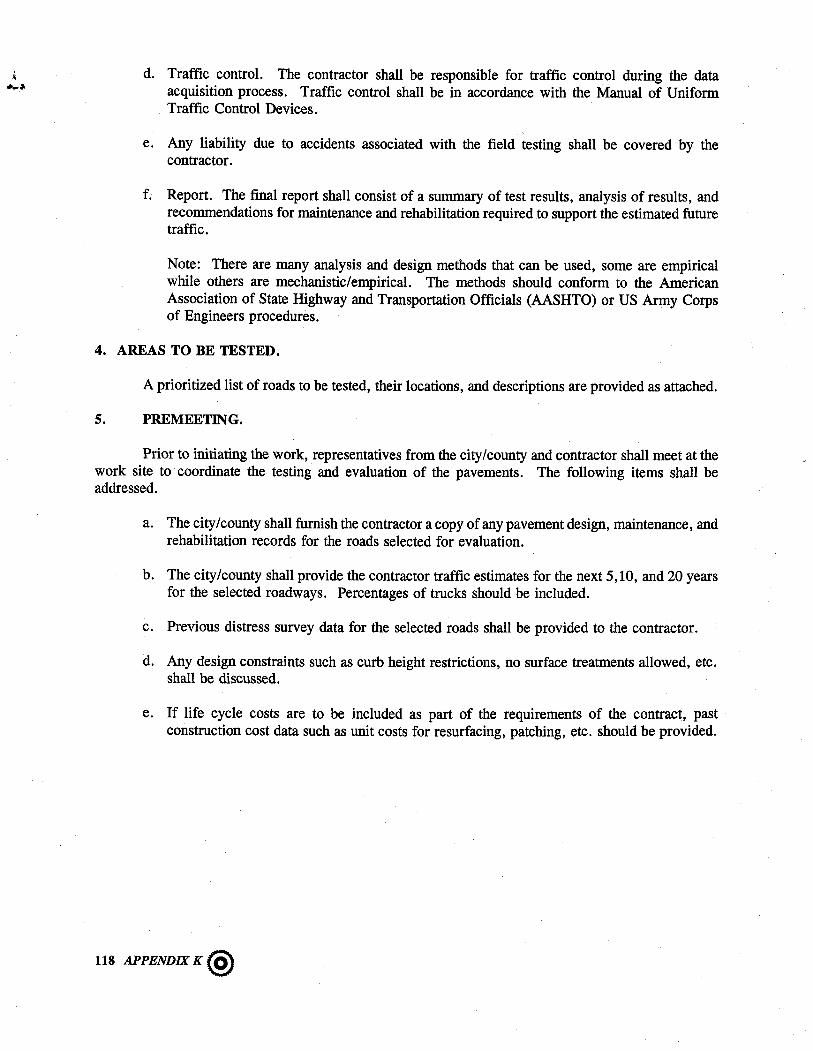
d. Traffic control. The contractor shall be responsible for traffic control during the data acquisition process. Traffic control shall be in accordance with the Manual of Uniform Traffic Control Devices.
e. Any liability due to accidents associated with the field testing shall be covered by the contractor.
f. Report. The final report shall consist of a summary of test results, analysis of results, and recommendations for maintenance and rehabilitation required to support the estimated future traffic.
Note: There are many analysis and design methods that can be used, some are empirical while others are mechanistic/empirical. The methods should conform to the American Association of State Highway and Transportation Officials (AASHTO) or US Army Corps of Engineers procedures.
4. AREAS TO BE TESTED.
A prioritized list of roads to be tested, their locations, and descriptions are provided as attached.
5. PREMEETING.
Prior to initiating the work, representatives from the city/county and contractor shall meet at the work site to coordinate the testing and evaluation of the pavements. The following items shall be addressed.
a. The city/county shall furnish the contractor a copy of any pavement design, maintenance, and rehabilitation records for the roads selected for evaluation.
b. The city/county shall provide the contractor traffic estimates for the next 5,10, and 20 years for the selected roadways. Percentages of trucks should be included.
c. Previous distress survey data for the selected roads shall be provided to the contractor.
d. Any design constraints such as curb height restrictions, no surface treatments allowed, etc. shall be discussed.
e. If life cycle costs are to be included as part of the requirements of the contract, past construction cost data such as unit costs for resurfacing, patching, etc. should be provided.
118 APPENDIX K @

o RID C?1j- FI5 -/{
S EPA RAT 0 R
2721 COPPER CREEK RD HERNDON, VA 20171
www.imageworldllc.com 703-793-9692