federal ministry of education education sector status report - planipolis
TRANSCRIPT
FEDERAL MINISTRY OF EDUCATION
EDUCATION SECTOR STATUS REPORT
MAY, 2003
ii
EDUCATION SECTOR STATUS REPORT
MAY, 2003
Chairman of the Steering Committee
Geoffrey O. Enukora
Other Members of the Steering Committee
Adebayo I. Ali, Hubert Charles, Brigitte Duces, Rosemary Nwangwu, Emmanuel J. Okon, Don Taylor, Rosalind A. Ukpong
Secretary to the Steering Committee
Emmanuel Kalu
Editorial Consultants
James Urwick, Peter Williams
iii
TABLE OF CONTENTS
Section Page Preface ……………………………………………………………………….. vii Executive Summary ……………………………………………………….. ix Abbreviations ………………………………………………………………... xvi Chapter One: Context and Background ……………………………………... 1 History and Political Structure; Geography; Society and Culture; Demography; Economy. Chapter Two: Evolving Educational Policies and Priorities ………………… 7 Introduction; The Challenges at Independence; The Post-independence Period, 1960-66; The Period of Oil Boom and Expansion, 1966-79; The Period of Austerity, 1979-99; Developments under Renewed Civilian Rule since 1999: Educational Development in Nigeria, 1999-2003. Chapter Three: Structure and Management of the Educational System ……………………………………………………………………….. 17 Organisation of the Educational System; Structure of the Federal Ministry of Education; Legal Framework; National Council on Education; Responsibilities and Functions of the Various Levels of Government; Management. Chapter Four: Early Childhood Education …………………………………... 29 Introduction; Objectives; Non-formal Child Care Centres; Pre-primary Schools; Quality Assurance; Service Providers; Provision of Resources; Costs and Benefits; Milestones and Innovations. Chapter Five: Primary Education ……………………………………………. 37 The Basic Education Framework; Scope and Objectives of Primary Education; Access: General Indicators; Enrolment: Geographical Variations in Access; Gender Ratio; Attrition and Completion Rates; The Rate of Transition to Junior Secondary Education; Learning Achievement; Teaching and Learning: the Quality of Provision; Supervision and Management; Community and Private Sector Participation; Nigeria’s Situation in the International Context; Nomadic Education; Access, Curriculum and Problems; Special Education; Access, Curriculum and Problems; Achievements and Constraints in Primary Education. Chapter Six: Junior Secondary Education …………………………………... 51 Scope and Objectives; Access: General Indicators; Rate of Transition to the Senior Secondary Level; The Curriculum; Management and Supervision; Achievements and Challenges in Junior Secondary Education. Chapter Seven: Senior Secondary Education ……………………………….. 55 Introduction; Goals and Objectives; Access and Participation; Internal Efficiency; Curriculum; Teaching and Learning; Assessment System; Supervision and Support; School Management; Funding of Secondary Education; Sources of Funding Secondary Education; ETF Funding of State Secondary Schools, 1999-2002; Achievements; Challenges.
iv
Section Page Chapter Eight: Adult and Non-formal Education …………………………… 67 Introduction; Concept and Programmes; Nigeria’s Literacy Profile; Access to Adult and Non-formal Education Programmes; Enrolment in Literacy Programmes; Curriculum and Instruction; Facilities; Instructors; Open Apprenticeship Scheme; Milestones; The Funding Challenge. Chapter Nine: Islamic Education ……………………………………………. 75 Historical Background; Levels of Islamic Education; The Challenge of Integration; Milestones. Chapter Ten: Technology and Science Education …………………………... 81 Content, Purpose and Scope; Modes of Curriculum Design and Delivery; Technology and Science Education in Nigeria before 1977; Technology and Science Education in the National Policy on Education; Participation in Technology and Science Education Programmes; Inclusion; Administration of Technology and Science Education; The Problems of Technology and Science Teacher Production and Utilisation; Milestones; Mission for the 21st Century; Future Challenges. Chapter Eleven: Teacher Education …………………………………………. 95 Introduction; Access to the Teaching Profession; Teacher Supply and Demand; The Content of Teacher Education Programmes; Opportunities for Professional Development; The Private Costs of Training; Quality Assurance and Internal Efficiency; Teacher Quality in Schools; Gender; The Morale and Status of Teachers; Milestones and Innovations in Teacher Education. Chapter Twelve: University Education ……………………………………… 105 The Idea of University Education; Trends in the Development of University Education in Nigeria; Participation in University Education; Quantity and Quality in University Education; The Root Problems in Nigeria; Current Reform Efforts and New Initiatives; The Way Forward. Chapter Thirteen: Educational Finance ……………………………………… 121 Historical Perspectives; Sources of Revenue; Federal Government Expenditures; State Government Expenditures; Local Government Expenditures; Community Financing; The Education Tax Fund; International Sources of Financing; Financial Responsibilities; Public Unit Cost by Level of Education; Private Education and Household Expenditure on Education; Allocation Mechanism; The Challenges of UBE; Conclusions. Chapter Fourteen: Education and Employment …………………………….. 139 Educational Policy and Manpower Supply; Manpower Demand; Brain Drain. Chapter Fifteen: Achievements, Critical Issues and Challenges …………… 145 Introduction; The Universal Basic Education Scheme; Early Childhood Education; Primary Education; Secondary Education; Technology and Science Education; University Education; Adult and Non-Formal Education; Teachers and Teacher Education; Data Collection; Quality Assurance; HIV/AIDS and Education; Management and Funding of Education; Partnerships; Capacity Building for Management; Disadvantaged Groups; Education and the World of Work; Conclusion.
v
Section Page Annexes I. Projected Growth of School-age Populations. ………………………. 155 II. Primary School Enrolments, 1999-2002. ……………………………. 156 III. Primary Education: Enrolments, Population Projections and
GERs, 2000-2001. …………………………………………………… 160 IV. Primary Education: Comparison of GER Estimates from Different
Sources. ……………………………………………………………… 162 V. Secondary School Enrolments, 1999-2002. …………………………. 164 VI. Secondary School Enrolments, Population Projections and
GERs at the National Level, 1999-2002. ……………………………. 168 VII. Major Educational Parastatal Organisations. ………………………... 169 VIII. WAEC Results, Credit and Above, by Subject. …………………….. 173 IX. 2001 Polytechnic Enrolment. ………………………………………... 176 X. Teacher Demand and Supply for Vocational Subjects in
6 States, 2003 ………………………………………………………... 177 XI. Demand and Supply of Technology Teachers. ……………………… 178 XII. University Enrolment, 2001/2, by Level. ……………………………. 181 XIII. University Enrolment, 2001/2, by Discipline. ………………………. 182 XIV. UME/DE Applications and Admissions, by Field of Study
and Gender. ………………………………………………………….. 184 XV. Members of the ESSR Reference Committee. ………………………. 185 References …………………………………………………………………… 187

vi
vii
PREFACE The Honourable Minister of Education, Professor A.B. Borishade set up an eight-member Steering Committee to produce an Education Sector Status Report, as at May 2003. This committee was inaugurated by the Permanent Secretary, Federal Ministry of Education, Ambassador G.B. Preware, on 7th February, 2003. Its members were as follows:
Mr. G.O. Enukora, retired Permanent Secretary, FME - Chairman Mr. A.I. Ali, Department of Educational Support Services, FME - Member Dr. (Mrs.) Rosemary Nwangwu, ESA Unit, FME - Member Mr. E.J. Okon, Department of Technology and Science Education, FME - Member Dr. (Mrs.) R.A. Ukpong, Department of Planning, Research and Statistics, FME - Member Mr. Hubert Charles, UNESCO (Nigeria) - Member Mrs. Brigitte Duces, World Bank (Nigeria) - Member Dr. Don Taylor, DFID (Nigeria) - Member Mr. Emma Kalu, ESA Unit, FME - Secretary
The committee was given two broad terms of reference, as follows:
• To develop an Education Sector Status Report (ESSR). • To review the current Education Sector Analysis (ESA) process.
As part of its first term of reference, the committee was asked to use existing information and materials; identify achievements, critical issues and challenges; indicate major directions and policy options; and identify major gaps in knowledge to be filled through future ESA work. The committee was supported by two international consultants, Professor Peter Williams and Dr James Urwick, whose participation was made possible by the UK Department for International Development DFID). It met regularly throughout the duration of its assignment. It drew up a work plan, which was duly approved by the Honourable Minister. In order to facilitate its work, it established a Core Writing Team as well as a Reference Committee in which many agencies in the education sector and civil society were represented. The members of the Core Writing Team are Mr. A.I. Ali, Dr. (Mrs.) Rosemary Nwangwu, Mr. E.J. Okon and Dr. (Mrs.) Rosalind Ukpong. The list of members of the Reference Committee is as given in Annex XV of this report. The Core Writing Team worked very hard to produce the initial drafts on schedule for the consideration of the Steering Committee. After due approval by this committee, the first draft was referred to the Reference Committee for its study, comments and observations. With the help of those inputs, the second draft was subsequently produced and referred back to the Reference Committee. Thereafter, the final report (ESSR 2003) was produced. In terms of the highlights of the structure and content of the report, the following are noteworthy. The report is sub-divided into fifteen chapters spanning the entire
viii
spectrum of education in Nigeria. While Chapter 1 deals with the context and background of education in Nigeria, Chapter 2 is on policies and priorities. Chapter 3 is devoted to the structure and management of the educational system, while Chapters 4-7 examine the various levels of children’s education: early childhood, primary, junior secondary and senior secondary education. Chapters 8-12 cover adult and non-formal education, Islamic education, technology and science education, teacher education and university education. Chapters 13 and 14 discuss educational finance as well as education and employment in the system as a whole. The last chapter discusses recent achievements of the educational system, critical issues, and the challenges that it faces. The executive summary at the beginning of the report highlights the main points and issues raised in the chapters. The page of the report preceding Chapter 1 gives the full meanings of the abbreviations used, while various annexes and a list of the references cited are provided after Chapter 15. I wish to point out that the report relating to the Steering Committee’s second term of reference is being submitted separately. On behalf of the members of the Steering Committee on ESSR 2003, I would like to convey our sincere appreciation to the Honourable Minister of Education as well as to the Permanent Secretary of the Ministry for the opportunity given to the members of the committee to serve the nation in this all-important area. Our appreciation also goes to the two international consultants, the members of the Core Writing Team and their supporting staff, who have had to work tirelessly under pressure in order to deliver the report on schedule. We wish also to extend our special thanks to the World Bank, UNESCO and DFID for their support and co-operation as well as to the NCCE for providing the Committee with office space and meeting venues and to the ESA Unit of FME for facilitating the Committee’s work. Finally, we thank the members of the Reference Committee for their invaluable contributions, which helped to improve not only the text but also the data presented in the report.
G. O. Enukora, NPOM, Chairman, Steering Committee,
ESSR 2003.
20th May, 2003.
ix
EXECUTIVE SUMMARY This Education Sector Status Report (ESSR) seeks to present the current status of the educational system as at May, 2003. It identifies the achievements of the present administration, the critical issues and challenges facing the sector today, and the major policy options and directions for the future. It is an output of the Education Sector Analysis and is based on existing information and sources. ESSR is in fifteen chapters, summarised below, covering all levels and aspects of education in Nigeria. Context and Background A review of the educational system of Nigeria must take into account the historical, cultural, social and economic characteristics of the nation. Nigerians are people with varied languages and ethnic identities, living in varied vegetation belts from the rain forest to the dry savannah. But they are unified by common traditional values, such as those of hospitality and respect for elders, as well as the common political heritage. Nigeria’s existence as a single territory dates from 1914, and her independence from 1960. The two main religions, Islam and Christianity, have both made important contributions to educational practice. The country is a federation, with 36 states and a Federal Capital Territory, Abuja. It has experienced long periods of military rule, but returned to civilian rule in 1999. Nigeria is the most populous country in Africa. The population was found by the 1991 Census to be about 89 million and is projected to be 135 million by the year 2010. Children below the age of 16 form about 45% of the population. Agriculture remains the dominant means of livelihood, but is no longer the main source of public revenue. Nigeria became a major exporter of oil in the 1970s, when both formal education and other services expanded dramatically. The downturn in oil revenue after 1979, however, combined with other factors to bring about gradual impoverishment during the two decades that followed. The present government recognises a need to diversify exports and reduce the dependence on crude oil. Evolving Educational Policies and Priorities The educational policies and priorities of Nigerian governments have evolved in response to changing political and economic circumstances. At the time of independence the production of high-level manpower was a priority, and the 1960s therefore saw a rapid expansion of university and secondary education. There were, however, large and persistent differences between North and South in educational participation, management and policy. It was only after the civil war of 1967-70 had ended and the oil boom had begun that the Federal Government was able to enforce more uniform educational policies. These included the public take-over of grant-aided schools in most states, the launching of a national scheme for universal primary education (UPE) in 1976, and the publication of a comprehensive National Policy on Education in 1977. The National Policy established programmes of 6 years for primary, 3 years for junior secondary, 3 years for senior secondary and 4 years for
x
university education, and outlined a national curriculum for schools. The UPE scheme was marred by inadequate planning, but nevertheless resulted in a doubling of primary enrolment within a decade. The period, 1979-99, was marked by instability and financial inadequacy in the management of the education sector. The economic downturn of the 1980s brought an end to the expansion of primary education after 1986. It also led to unpaid teachers’ salaries, the degeneration of educational facilities at all levels, and strikes in schools and universities. One response to these problems was the establishment of a more centralised and uniform administration of primary education, headed by the National Primary Education Commission, in 1988. Following Nigeria’s participation in the Jomtien Conference on Education For All in 1990, the Federal Government made a renewed commitment to adult literacy and introduced the concept of a 9-year basic education programme covering the primary and junior secondary levels. The civilian administration which assumed office in 1999 quickly launched the Universal Basic Education (UBE) programme. It also initiated an education sector analysis (ESA) as a starting-point for long-term planning and reform. In order to increase the effectiveness of basic education and other social services, it has shown willingness to collaborate with civil society organisations and with international agencies. At higher levels in the system, the policy focus has been on quality control, on strengthening technical and vocational education, and on encouraging alternative modes of access to higher education. Structure and Management of the Educational System The legal framework of education in Nigeria is based on the current 1999 Constitution, together with relevant federal and state laws from the past. The constitution defines the nation’s educational objectives and regulates the sharing of responsibilities for education among the three levels of government – federal, state and local. The major statutory responsibilities of the Federal Government in the education sector are ones of policy formulation, co-ordination and monitoring. In addition, the Federal Government has direct control of a large proportion of the universities and other tertiary institutions, and of a small number of secondary schools. Both Federal and State Governments are legally empowered to establish parastatals, through which some of their responsibilities are discharged, and these are widely used at the federal level. State Governments control most secondary schools and a considerable proportion of the tertiary institutions. Local Governments have since 1976 been delegated responsibilities for the management of primary schools, under the guidance of higher levels of government. As a result of a Supreme Court ruling of 5th April 2002, the jurisdiction of the Federal Government with regard to primary education has ceased to cover special financing through first line charge allocation.
xi
Early Childhood Education Early childhood education is a critical part of overall human development. The National Policy on Education (NPE) defines the objectives of early childhood education to include a smooth transition from home to school and adequate care for children while their parents are at work. Government intervention at this level, however, is generally limited to setting standards, providing curriculum guidelines and training teachers while service delivery depends on the private sector. This situation effectively limits access to the minority of households that can afford the fees. The wider development of pre-primary classes attached to primary schools is suggested, in view of the cost effectiveness of such arrangements and the fact that they are already working well in some states. It is also proposed that indigenous cultural realities play a greater part in the curriculum. Primary Education The discussion of primary education in this report also covers nomadic and special education in the context of basic education. In 1999 the Obasanjo administration launched the present Universal Basic Education (UBE) programme, ahead of the Dakar 2000 framework on Education For All (EFA). The six EFA goals were later integrated into the UBE blueprint. There is mixed evidence about the progress so far of efforts to expand participation in primary education and to improve its outcomes. There is a shortage of qualified teachers and infrastructure, both of which combine to reduce the internal efficiency of the system. Public primary schools are managed and supervised by an established system of State Primary Education Boards and Local Government Education Authorities. However, a major task is to foster more effective participation by local communities in the management and maintenance of primary schools. A special nomadic education programme is provided by the National Commission for Nomadic Education (NCNE) for the children of migrant herding and fishing communities. The programme has witnessed increased enrolment of nomadic children in schools and participation of adults in literacy courses. Special education for disabled and gifted children has not received prominence in the UBE programme. Records of student enrolment and completion are scanty and there are few programmes on the ground for mainstreaming the disabled. There are very few schools for gifted children. Attention has been given to the professional development of teachers for UBE, just as increased enrolment is pursued with vigour. Nigeria is however, still striving to make a positive mark on the international scorecard for its universal education programme. Junior Secondary Education The junior secondary education is the education received after primary education for a period of three years and is intended to be free and compulsory. The level of participation in junior secondary education has not been encouraging because of the low rate of transition from primary to junior secondary level. Junior secondary
xii
education also shares school buildings and teaching staff with the senior secondary level. Both the completion and transition rates are encouraging even though most students transit to senior secondary rather than technical schools. The curriculum is both academic and pre-vocational, providing opportunities for career choice. There is a shortage of teachers to handle the pre-vocational subjects, coupled with inadequate equipment. Management and supervision are a concurrent responsibility of the state and federal governments. Some private individuals and organisations also run and manage secondary schools. The challenges at this level include low enrolment of girls in the North and poor retention of boys in the South-East, both of which deserve special attention. Senior Secondary Education The senior secondary level includes both an academic curriculum provided in general secondary schools and other curricula provided in technical colleges and vocational centres, all intended for pupils who successfully complete junior secondary education. In practice, the proportion of such pupils who enter the vocational institutions is much lower than the target of 30% specified in the NPE. This is partly because pupils and their parents show a strong preference for the academic curriculum and partly because in some states sufficient places are not available in technical colleges. An integrated approach to the curriculum has been adopted, with the intention of providing varied experiences capable of meeting the immediate and future needs of pupils. The implementation has, however, been criticised as being over-ambitious, resulting in subject overload, and insufficiently attuned to the needs of the labour market, particularly in the technical and vocational courses. Tasks such as the development of multi-cultural awareness and of skills in information technology have not been addressed adequately. The shortcomings in implementation are partly due to insufficient retraining and professional support for teachers. A high rate of failure in the science subjects reflects inadequate staffing and resources. Adult and Non-Formal Education The learning needs of the many young people who do not reach the senior secondary level widens the agenda of adult and non-formal education. Another factor contributing to the need for this type of education is the low level of achievement among school leavers. This report considers the implications of these problems for adult education delivery. The expansion of curriculum content, through the development of three non-formal curricula – for boys, girls and Qur’anic education – is acknowledged. The increase of enrolment in literacy classes to about 407,000 in 2002 has, however, not done much to improve Nigeria’s literacy rates of 57% for men and 49% for women. The open apprenticeship scheme is a strong link between non-formal education and the nation’s poverty eradication programme. Some innovative practices in adult education include applications of the REFLECT methodology and various integrated community development programmes.
xiii
Islamic Education Islamic education is an important tradition both in the formal and in the non-formal delivery of education in Nigeria. Having its own curricula from the elementary to the university level, Islamic education is recognised as a system offering important academic qualities. The fact that a significant proportion of the population passes through the elementary level of the system makes it an important part of the public sector. The problems of the education offered through this system, however, include the restricted curriculum offering and limited training of the teachers. At the basic level, the curriculum needs to be integrated with the formal elements of secular education. Considerable progress has been made in this direction in some states. Technology and Science Education Another strand in the various levels of the educational system is technology and science education. Technology education includes pre-vocational education at the primary and junior secondary levels, vocational training in technical colleges and vocational centres, technical education in polytechnics and monotechnics, and some professional education in universities. The approach to curriculum design in technology and science education is to integrate general education with professional studies in order to produce a knowledge-based work force. The limited effectiveness of technology and science education has been a result of its comparatively high costs, its demand for uncommon aptitudes, and the perceived higher social status of literary education. The government, however, is promoting both technology education and science education as instruments of national development that deserve priority. For this purpose, national master-plans have been drawn up and are being implemented. Teacher Education The gaps between policy provisions and the reality in practice are among the issues discussed in this report with reference to teacher education. These gaps are particularly obvious in teacher demand and supply and in the adoption of the Nigeria Certificate of Education (NCE) as the minimum qualification for teaching. Some states have surpluses of teachers in particular categories, while others have severe shortages. The number of applicants for pre-service teacher education has declined, and the low status of teaching is seen as a major contributory factor. Although there are increased opportunities for teacher upgrading, the need for teachers’ classroom skills to be moulded towards teaching initial literacy and promoting active learning, especially at the primary level, is presented in this report as a challenge for teacher educators and policy-makers. Another problem is the quality of the in-service distance learning programmes and the lack of effective follow-up. At the university level, the threat of “brain drain” to the system is no less serious, but steps are being taken to enhance teaching skills at that level.
xiv
University Education The function of universities is to promote higher learning and in so doing to produce the high-level manpower required for national development. Nigeria is adopting a three-stream system, in which the polytechnics and Colleges of Education become degree-awarding institutions and share with the universities the function of high-level manpower production: but the role of the universities remains central. The development of the universities has been conditioned by Nigeria’s changing economic circumstances. Of great influence was the oil boom era, which encouraged tastes and levels of spending that the recessive economy cannot now sustain. This, together with rising social demand, is the background to the wreckage of the past glories of the universities and the present problems of unprofessional practices, examination malpractice and cultism. The government, while attempting to restore the quality of existing universities, has revived the National Open University in order to widen the opportunities for access. It is also part of current government policy to restore autonomy to universities. Educational Finance Education funding comes from many different sources, but the main one for all levels of government is public revenue from taxation. Public expenditure is reported to be distributed among the primary, secondary and tertiary education levels roughly in the proportions of 30%, 30% and 40%. The public funding for direct government expenditure includes payments from the Education Tax Fund (ETF), mainly for capital expenditures. The Federal Government’s expenditure on education has in recent years been below 12% of its overall expenditure, the trend being largely downward. Each level of education has at various times been a concurrent responsibility of both Federal and State Governments, although the Federal Government has been most heavily involved at the tertiary level. The increasing demands of education on public finances at a time when government revenues are stagnant or even falling requires either finding additional sources of financial support, reducing unit costs through greater efficiency, diverting resources from other lower priority uses, or some combination of such measures. Another source of financial and other assistance to education in Nigeria is the international donor agencies, both multilateral and bilateral. Of the assistance provided by these agencies over the past decade, that of the World Bank, which is specifically a lending institution, has been quantitatively the most significant. The efforts of the U.N. agencies and the bilateral agencies have focused on capacity building, technical assistance, experimental initiatives and research. Education and Employment An important function of education is to produce skills for gainful employment, and every level of the formal educational system makes a contribution to the labour
xv
force. Millions leave school every year to enter the labour market. Many of these young people become unemployed for some time: the level of unemployment was estimated to be 12.7% in 2002. A further problem is that of mismatch between the skills with which students graduate from tertiary institutions and those required for the healthy development of the economy. Efforts are being made to maintain constant consultation between the various stakeholders in manpower production. The government has also identified seven “economic impact areas” for high-level manpower production over the next five years. These areas are petroleum, gas, agriculture, manufacturing, solid minerals, tourism and ICT. Achievements, Critical Issues and Challenges
The last chapter of this report reflects on the achievements and initiatives of the present administration and highlights the challenges that remain in each sub-sector. The significant achievements include the successful launching of the UBE scheme and the establishment of the EFA unit. In the area of early childhood education, it is suggested that government endorsement of the Dakar goals entails an obligation to give more leadership. Despite commendable rehabilitation efforts that have taken place in the primary and secondary sub-sectors, major challenges that remain are to improve on the current levels of participation, especially those of girls. In the area of technology and science education, the steps taken to refocus policy now call for systematic and committed implementation of policy. In higher education, the challenges of cultism and examination malpractice, if not seriously addressed, could mar the efforts to modernise and to enhance quality and access.
In discussing such pervasive issues as teacher supply, quality assurance, HIV/AIDS, management, funding and the building of partnerships, this chapter highlights the areas that are most troubling in education. The imbalance in teacher demand and supply, across states and subject specialisations, remains a difficult issue. To enhance the quality of education, the FIS must be empowered to play a more proactive role. The government will need to build partnerships with various communities and organisations, including book publishers, in order to make an impact. The threat of HIV/AIDS must be addressed in the education sector before it reaches a crisis point.
Other challenges that are highlighted are those of training educational administrators as better human resource managers and of bringing disadvantaged groups into the mainstream of education delivery. The lack of coherence between educational output and the skills needed by the national economy is also presented as an important problem in the search for an education that is meaningful and relevant.
xvi
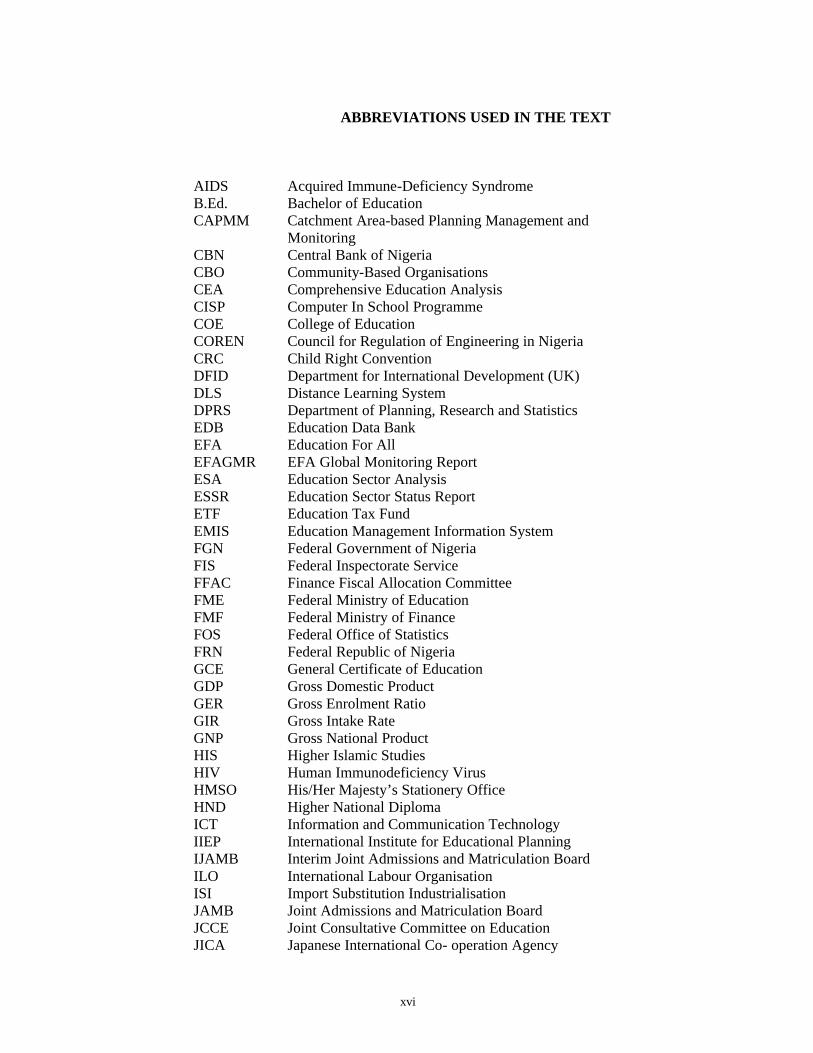
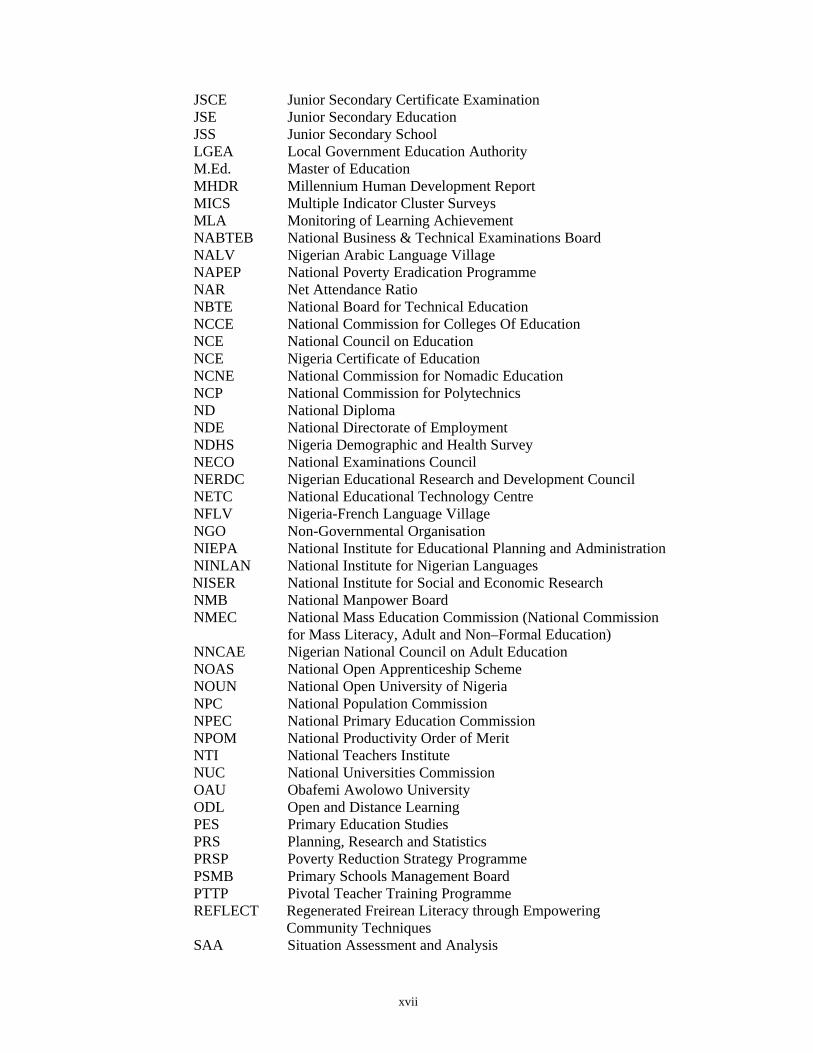
ABBREVIATIONS USED IN THE TEXT
AIDS Acquired Immune-Deficiency Syndrome
B.Ed. Bachelor of Education CAPMM Catchment Area-based Planning Management and
Monitoring CBN Central Bank of Nigeria
CBO Community-Based Organisations CEA Comprehensive Education Analysis
CISP Computer In School Programme COE College of Education COREN Council for Regulation of Engineering in Nigeria CRC Child Right Convention
DFID Department for International Development (UK) DLS Distance Learning System
DPRS Department of Planning, Research and Statistics EDB Education Data Bank
EFA Education For All EFAGMR EFA Global Monitoring Report
ESA Education Sector Analysis ESSR Education Sector Status Report
ETF Education Tax Fund EMIS Education Management Information System FGN Federal Government of Nigeria FIS Federal Inspectorate Service FFAC Finance Fiscal Allocation Committee
FME Federal Ministry of Education FMF Federal Ministry of Finance FOS Federal Office of Statistics FRN Federal Republic of Nigeria
GCE General Certificate of Education GDP Gross Domestic Product
GER Gross Enrolment Ratio GIR Gross Intake Rate GNP Gross National Product HIS Higher Islamic Studies HIV Human Immunodeficiency Virus HMSO His/Her Majesty’s Stationery Office
HND Higher National Diploma ICT Information and Communication Technology
IIEP International Institute for Educational Planning IJAMB Interim Joint Admissions and Matriculation Board
ILO International Labour Organisation ISI Import Substitution Industrialisation
JAMB Joint Admissions and Matriculation Board JCCE Joint Consultative Committee on Education JICA Japanese International Co- operation Agency
xvii
JSCE Junior Secondary Certificate Examination JSE Junior Secondary Education
JSS Junior Secondary School LGEA Local Government Education Authority M.Ed. Master of Education
MHDR Millennium Human Development Report MICS Multiple Indicator Cluster Surveys MLA Monitoring of Learning Achievement
NABTEB National Business & Technical Examinations Board NALV Nigerian Arabic Language Village NAPEP National Poverty Eradication Programme NAR Net Attendance Ratio
NBTE National Board for Technical Education NCCE National Commission for Colleges Of Education NCE National Council on Education NCE Nigeria Certificate of Education NCNE National Commission for Nomadic Education NCP National Commission for Polytechnics
ND National Diploma NDE National Directorate of Employment
NDHS Nigeria Demographic and Health Survey NECO National Examinations Council NERDC Nigerian Educational Research and Development Council NETC National Educational Technology Centre NFLV Nigeria-French Language Village NGO Non-Governmental Organisation
NIEPA National Institute for Educational Planning and Administration NINLAN National Institute for Nigerian Languages
NISER National Institute for Social and Economic Research NMB National Manpower Board NMEC National Mass Education Commission (National Commission
for Mass Literacy, Adult and Non–Formal Education) NNCAE Nigerian National Council on Adult Education NOAS National Open Apprenticeship Scheme
NOUN National Open University of Nigeria NPC National Population Commission NPEC National Primary Education Commission NPOM National Productivity Order of Merit NTI National Teachers Institute NUC National Universities Commission OAU Obafemi Awolowo University
ODL Open and Distance Learning PES Primary Education Studies PRS Planning, Research and Statistics
PRSP Poverty Reduction Strategy Programme PSMB Primary Schools Management Board
PTTP Pivotal Teacher Training Programme REFLECT Regenerated Freirean Literacy through Empowering
Community Techniques SAA Situation Assessment and Analysis
xviii
SAP Structural Adjustment Programme SAPA Situation and Policy Analysis SME Small and Medium Scale Enterprises SMEC State Mass Education Commission
SMOE State Ministries of Education SPEB State Primary Education Board SSCE Senior Secondary Certificate Examination
SSE Senior Secondary Education STM Science, Technology & Mathematics STVE Science, Technology & Vocational Education TFR Total Fertility Rate TSE Technology & Science Education
TVE Technical Vocational Education TVET Technical & Vocational Education and Training UBE Universal Basic Education UBEC Universal Basic Education Commission
UK United Kingdom UME/DE University Matriculation Examination/Direct Entry UNESCO United Nations Educational, Scientific and Cultural Organisation
UNICEF United Nations Children Fund USAID United States Agency for International Development UPE Universal Primary Education VAT Value Added Tax
WAEC West African Examinations Council
CHAPTER ONE
CONTEXT AND BACKGROUND
History and Political Structure
Nigeria is situated on the western coast of Africa, lying between latitudes 40 and 140 North and between longitudes 30 and 150 East. With a surface area of 923,764 square kilometres, it has borders with Cameroun to the East, Niger and Chad to the North and Benin to the West. To the South it has 800 kilometres of Atlantic coastline along the Gulf of Guinea.
Before the arrival of colonial adventurers on the shores of Nigeria in 1849, different ethnic groups living in different city-states and empires had inhabited the present-day Nigeria. The Hausa, whose language dates from 1000-1500 A.D, inhabited the North. In the South were the Yoruba people who organised themselves into empires in the 16th century. The Binis occupied part of the South as early as 900 A.D., while the Igbo, found east of the Niger, settled around the 16th century (FME, 2002 a).
The formation of Nigeria as a colonial entity could be traced to about 1849 when the British first made a transformational impact on the people and culture of the Niger-Benue area (Afigbo and Uyo, 2000). The process was formally completed in 1914, with the amalgamation of the Protectorates of Northern and Southern Nigeria as one territory with Lagos as its capital. After 1914, however, the two former protectorates continued to have distinct systems of administration.
Before the advent of Western education in the 19th century, there were two forms of education in Nigeria: the indigenous/traditional education and the Islamic education. The indigenous education consisted of general training in character, social, physical, intellectual and vocational development. Its hallmark lay in the preservation of societal culture, values and norms. Islamic education came in the 11th century to Hausaland and Borno. It received a boost from the Jihad of Usman Dan Fodio in the 19th century, which consolidated Islamic studies in all the established emirates in the country. Teaching was done in Arabic, the language of the Qur’an. Many of the higher schools, or madrasas, produced scholars in legal and administrative disciplines. Western education on the other hand came into the country in the 19th century with the introduction of the Christian religion by the European missionaries from 1842. Many mission schools were subsequently established with a curriculum in literacy and numeracy. The products of the schools served as Catechists or as administrative clerks to the colonial rulers. It is instructive to note that the missionaries were able to convert the predominantly pagan South to Christianity with subsequent introduction of Western education; a move that was resisted by the predominantly Muslim North. This resistance in part, accounted for the educational imbalance between the North and the South.
2
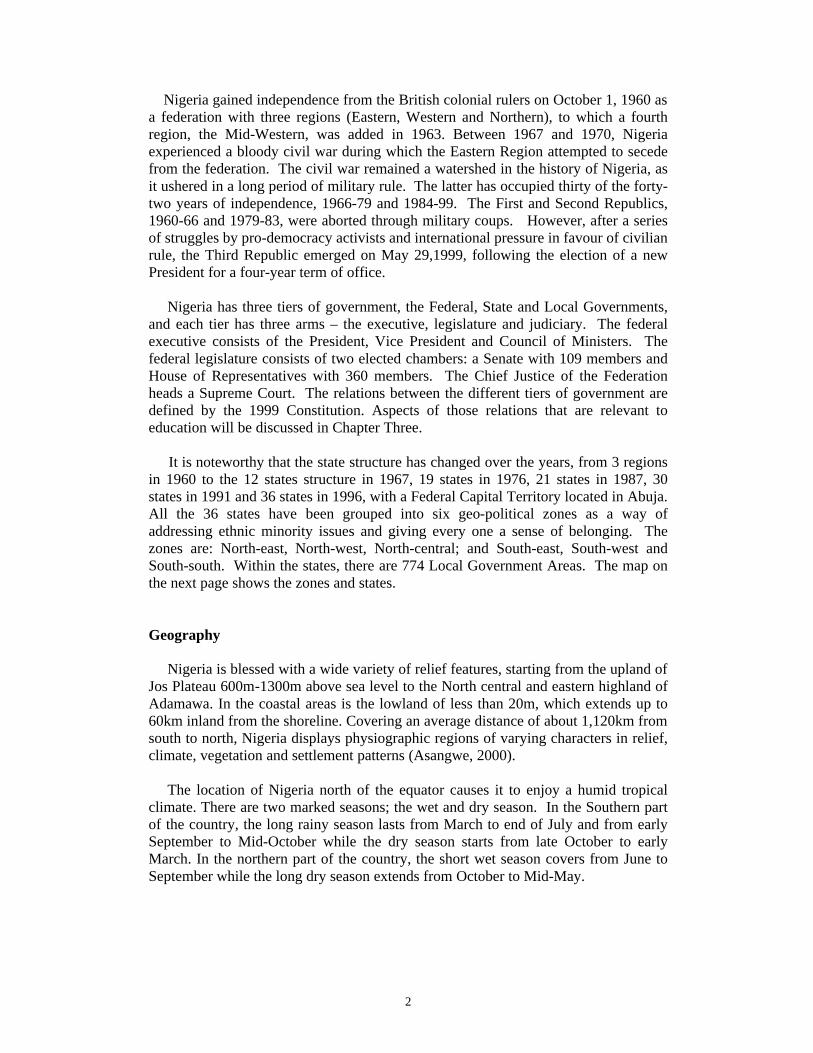
Nigeria gained independence from the British colonial rulers on October 1, 1960 as a federation with three regions (Eastern, Western and Northern), to which a fourth region, the Mid-Western, was added in 1963. Between 1967 and 1970, Nigeria experienced a bloody civil war during which the Eastern Region attempted to secede from the federation. The civil war remained a watershed in the history of Nigeria, as it ushered in a long period of military rule. The latter has occupied thirty of the forty-two years of independence, 1966-79 and 1984-99. The First and Second Republics, 1960-66 and 1979-83, were aborted through military coups. However, after a series of struggles by pro-democracy activists and international pressure in favour of civilian rule, the Third Republic emerged on May 29,1999, following the election of a new President for a four-year term of office. Nigeria has three tiers of government, the Federal, State and Local Governments, and each tier has three arms – the executive, legislature and judiciary. The federal executive consists of the President, Vice President and Council of Ministers. The federal legislature consists of two elected chambers: a Senate with 109 members and House of Representatives with 360 members. The Chief Justice of the Federation heads a Supreme Court. The relations between the different tiers of government are defined by the 1999 Constitution. Aspects of those relations that are relevant to education will be discussed in Chapter Three. It is noteworthy that the state structure has changed over the years, from 3 regions in 1960 to the 12 states structure in 1967, 19 states in 1976, 21 states in 1987, 30 states in 1991 and 36 states in 1996, with a Federal Capital Territory located in Abuja. All the 36 states have been grouped into six geo-political zones as a way of addressing ethnic minority issues and giving every one a sense of belonging. The zones are: North-east, North-west, North-central; and South-east, South-west and South-south. Within the states, there are 774 Local Government Areas. The map on the next page shows the zones and states. Geography Nigeria is blessed with a wide variety of relief features, starting from the upland of Jos Plateau 600m-1300m above sea level to the North central and eastern highland of Adamawa. In the coastal areas is the lowland of less than 20m, which extends up to 60km inland from the shoreline. Covering an average distance of about 1,120km from south to north, Nigeria displays physiographic regions of varying characters in relief, climate, vegetation and settlement patterns (Asangwe, 2000). The location of Nigeria north of the equator causes it to enjoy a humid tropical climate. There are two marked seasons; the wet and dry season. In the Southern part of the country, the long rainy season lasts from March to end of July and from early September to Mid-October while the dry season starts from late October to early March. In the northern part of the country, the short wet season covers from June to September while the long dry season extends from October to Mid-May.
3
4
The vegetation belts are of two main types: the forest and the savannah. The forest region consists of saline water swamp; the freshwater swamp; and the tropical evergreen rainforest. The saline water swamp is found in Badagry and Lekki Peninsular of about 1.5 km. to over 30 km. width in Sapele area. The fresh water swamp stretches from west to east covering parts of Ogun, Benin, Imo, Niger Delta and Cross River. The tropical evergreen forest stretches from the western border of Nigeria with Benin Republic through a narrow stretch on the Niger-Benue River System. The savannah vegetation consists of 3 types. Guinea savannah is the most extensive vegetation covering the middle part of the country. It extends from Ondo, Edo, Anambra and Enugu states in the south through Oyo to beyond Zaria in Kaduna state. The Sudan savannah stretches from the Sokoto plains to the entire north-eastern part. The Sahel savannah is found in the extreme North-East, close to the Lake Chad region. Society and Culture There are some 350 languages and ethnic groups in Nigeria. These groups are distinguishable by geographical location, language, mode of dress, food, system of marriage and family organisation: but there is some overlap in language and organisational forms. The members of each ethnic group share common identity, beliefs, and tradition and often look to the group for mutual assistance and defence. Despite the uniqueness of each ethnic group, the cultural diversity in the country has remained a source of strength and unity. As a result of increased social interaction, the Nigerians of today share one another’s ethnic cultural practices. Nigeria upholds the culture of hospitality and respect for parents, elders and traditional institutions. Traditional family units are essentially patriarchal, with little regard for women in decision-making. Traditional culture also favours the male child and is one of the reasons why boys enjoy more educational opportunities than girls in most parts of the country. Data from the National Demographic and Health Survey (NDHS) show that Nigerian men have, on average, had three more years of schooling than their female counterparts. Furthermore, the Multiple Indicator Cluster Survey (FOS and UNICEF,1999) shows that illiteracy rates are much higher for women, 59% compared with 42% for men (NPC/UNICEF, 2001) There are three major ethnic groups. These are the Hausa/Fulani to the North, the Igbo, found in the South-east, and the Yoruba, found in the South-west. While English language is the adopted lingua franca, other languages used in literary works in the country include Hausa, Igbo, Yoruba, Edo, Urhobo, Igala, Efik, Tiv, Ibibio,Izon, Kanura, Fulfulde and Nupe. The two dominant religions are Christianity and Islam. The NDHS of 1999 reports that about 45% of the Nigerian population is Muslim and 53% is Christian, while less than 2% belongs to the traditional African religions. (NPC/UNICEF, 2001). Religion has affected many aspects of culture, including approaches to education. Islam religion penetrated the country from the 11th century A.D. and established its own educational and judicial institutions mainly in the North. Christianity, which spread in the South after 1842 as a result of missionary efforts, was for a long time closely associated with the spread of formal education. Both major religions have contributed in important ways to the present educational system in Nigeria.
5
Demography The 1991 Population Census, considered to be more reliable than previous censuses and relatively useful for planning purposes, recorded Nigeria’s population as 88,992,220. Of this figure, children below 18years make up approximately 51%. A “median variant” population projection for 2000 put Nigerian children at about 59 million, of which just over 20 million were under 5 years old (NPC/UNICEF, 2001). The large proportion of children in the population presents a big challenge to government in the provision of basic health and education facilities. The maternal and infant mortality rates remain at 10.0 and 75.1 per 1000 live births respectively, while the crude birth and death rates stand at 49.0 and 41.0 per 1000 persons (CBN 2001).
In Nigeria, population figures are regarded as crucial determinants of major decisions about power sharing and resource allocation. With an estimated growth rate of 2.83% per annum, and a total of about 120 million in 2003, the population is projected to be 139 million by 2010. This high rate of growth is due to a high fertility rate, put at 5.9 in the 1991 census. However, a gradual and long-time decline in fertility rates has been observed, attributable to increased education, urbanisation and a decline in infant and child mortality. For instance, women with secondary education have a total fertility rate of 4.9, compared with 5.6 for women with primary education and 6.1 for women without education. In the same vein, urban highest fertility rates are found in the far northern states of Nigeria. Here the average woman has two more children than a woman in the South or the Middle Belt of the Country (NPC/UNICEF 2001). The spatial distribution of the population is uneven: a feature considered to be one of the country’s problems. The 1991 census put the national density at 96 persons per square kilometre. Population densities in different parts of the country range from 50 persons per square kilometre to over 1000. Areas with high densities, such as the South-east, the South-west and core areas of Kano, Katsina, Sokoto and Zamfara states, experience population pressures on land resources, surface water and fuel wood (Ottong, 2000). The age distribution in the 1991 census further showed the proportion of adults (60 years and above) as a mere 3.3% while those under 15 years formed about 45% of the population. There is a high child dependency ratio, of 1:1, which imposes considerable strain on the economy at both family and national levels. This strain is all the greater because of the literacy rate, found by the census to be 57%. Females account for 40% of literate persons overall. Among the lower age group, sex differential in literacy level is substantially narrow as a result of increased efforts in female education in the last three decades. The Universal Basic Education (UBE) programme, launched in 1999, is expected to improve further the overall literacy level among the population.
6
Economy At the time of independence, agriculture remained the mainstay of the Nigerian economy, accounting for about 65% of the Gross Domestic Product (GDP) and 70% of exports. It provided the foreign exchange used to import raw materials and capital goods (Ekpo and Umoh, 2000). Cash crops such as cocoa, palm kernel, cotton, groundnuts and rubber, as well as minerals like tin, coal and bauxite, were exported to the industrialised countries. Through an “import substitution industrialisation” strategy (1960-70), the few local industries were protected and allowed to grow. There were low rates of inflation and unemployment. As from the mid-50s oil was discovered in commercial quantity in Nigeria and by the 1970s it constituted 90% of foreign exchange earnings and about 85% of total exports.
Oil still plays a major role in Nigeria’s economy. Available records from the Central Bank Annual Report of 2001 show that the oil sector still constitutes 76.5% of total revenue. The real annual growth in GDP rose from 3.8% in 2000 to 3.9% in 2001. However, growth in the manufacturing sector has been hampered by irregular supply of petroleum products and intermittent power supply to the sector. The country’s external reserves stood at US $10.45 billion, while the fiscal balance indicated a deficit of N221.1 billion or 4.0% of GDP.
The total external debt outstanding as at December 2001 amounted to US $28.4 billion out of which a total of US $331.8 million (N31.2 billion) has been redeemed by government in the last five years. Government has embarked on privatisation of some major corporations to attract in-flow of foreign direct investment. This has not translated into economic fortune as unemployment level still remained high. Also the persistent depreciation of the Naira vis-à-vis other major currencies since 1995 has affected the tone of business in the country. For example, the average selling rate in 2000 depreciated from N102.10 to N111.96 in 2001. In the parallel market, the Naira exchanged at N132.59 for US $1.00. The subsequent decline in national revenue from oil, and other unfavourable economic conditions, in the period 1978–1986 brought about high inflation, high unemployment, fiscal imbalance and an increase in external borrowing. Many recent gains in education were reversed. In 1986 the Federal Government introduced a Structural Adjustment Programme to bring the economy back to the path of steady and sustainable growth. The effect of SAP was remarkable to the extent that it brought about higher rates of economic growth. These averaged 5.4% a year in 1987–1992 compared with 1.8% a year in 1981-86. Despite the relatively high growth rate, the proportion of the population in extreme poverty rose from 12% to 14%. Low revenues and incomes and high rates of unemployment adversely affected enrolment, retention and achievement at all levels of education. At the inception of the new civilian administration in 1999, however, there were determined plans, as contained in the “Economic Policy of Government, 2000”, to bring the economy back on track. The rate of inflation has been brought to 11% from 14.8% in 2002. The government has also put in place a Poverty Reduction Programme. To reduce the dependence on oil, government has intervened to promote liquefied natural gas production, aluminium smelting and production of bitumen as foreign exchange earners.
7
CHAPTER TWO
EVOLVING EDUCATIONAL POLICIES AND PRIORITIES Introduction Successive governments in Nigeria have used education as a vehicle for social, cultural, political, economic and technological development of the nation. The type of policies evolved to achieve its priorities reflects the character of each administration. The Federal Ministry of Education is statutorily responsible for formulating a National Policy on Education, which guides the nation in pursuit of its educational goals. The Nigerian educational system has witnessed tremendous changes occasioned by the need to develop human and institutional capacities to meet local and global challenges, promote national integration and self-reliance and forge international co-operation. The policy of regionalisation in the 1951 McPherson Constitution allowed each of the three regions, East, North and West, a measure of autonomy. The policy was consolidated in 1954 when Nigeria became a federation with each region enacting different educational laws. This arrangement continued till October 1, 1960 when Nigeria attained independence. Challenges at Independence The educational problems confronting Nigeria at independence were manifold and included the following: • Regional imbalances in educational access and attainment; • Inadequate high-level manpower; • Low level capacity of secondary education; • A school curriculum lacking in science and technology and regarded as
bookish; • Inadequate provision at tertiary level; • Fragmented education management; • Few specialized professional and support services; • Shortage of qualified primary and secondary school teachers; • Lack of qualified teachers in technical education; • Lack of a truly national education policy.
8
The lack of uniformity in the educational system was evident right from the primary school level. Primary education varied from 6 to 8 years. The Western Region had launched a Universal Primary Education (UPE) programme in 1955 followed by the Eastern Region and Lagos in 1957. The Northern Region, where education was almost free, engaged in expansion and development of literacy in the rural areas. There was disparity between the North and the South in educational provision. Voluntary agencies, private proprietors and local communities owned schools and co-operated with the government in the management and provision of educational facilities. As some schools were assisted by the government, the level of school fees varied. There was keen competition among the various schools.
Secondary education, which is the reservoir for recruitment of high-level manpower training, was in high demand. However it was offered in different forms such as Secondary Grammar Schools, Secondary Modern Schools (of 3years only in the West), Secondary Commercial Colleges; High Schools and Comprehensive High Schools. The curriculum varied in all schools. Science and technology were not taught in some schools, while there were no funds to provide science laboratories and equipment. Another common problem was the shortage of graduate teachers leading to employment of expatriate contract teachers at high cost and dependence on volunteer teachers from abroad. Technical and vocational education was at a low ebb. Whereas technical education was required in an emerging nation for the production of skilled manpower for marine, railway and works departments, the technical curriculum at school level was limited to the production of craftsmen and artisans. Farm produce was exported to industrialised countries and there was a need to train technical personnel for raw material processing. Teacher training institutions were very few and far between. In 1963, there were 15,967 Grade II primary school teachers out of a staff strength of 94,176 (Taiwo, 1980). Provision of higher education, particularly university education, was grossly inadequate in relation to requirements. University College Ibadan (now University of Ibadan) took over from Yaba Higher College in 1948 and remained the only University till 1960 with the tasks of meeting the manpower needs of the nation. The intake of undergraduates was very low, with first enrolment of 104 students including 3 only females (Taiwo, 1980). Another problem was the strictly “metropolitan” curriculum at Ibadan, not yet adapted to the African environment.
The Post Independence Period, 1960 – 1966 The educational policies and programmes enunciated by the different regional governments were carried over to independence and beyond. The UPE programmes that commenced in the West and Lagos in 1955 and 1957 respectively were pursued until 1976. The same programme embarked on in the East in 1957 was modified into 3 years of fee-paying and another 3 years of non-fee paying school attendance until 1966. The segregation of primary education into junior and senior primary in the North was cancelled, while the length of primary education was reduced to 6 years. Although the UPE programmes witnessed an explosion in enrolment, they were later beset with problems of low funding, inadequate and low quality of teachers and lack of co-operation from the local communities.
9
In the secondary education sub-sector, enrolment rose from 135,434 in 1960 to 211,879 in 1963 (Taiwo, 1980). The 3 years secondary modern school of the West and Mid-West became unpopular and was phased out. The Secondary Grammar Schools were more popular and highly rated compared to the privately-owned Commercial Colleges. At the end of the fifth year, the West African Examinations Council (WAEC), established in 1951, conducted an external examination for the students in Grammar Schools while those in Commercial Colleges sat for the Royal Society of Arts (RSA) of London certificate examination. Except in the government colleges, the sixth form programme (Higher School Certificate) no longer enjoyed patronage as candidates could enter higher institutions at secondary school certificate level. To demonstrate its desire to use education for national integration, government in 1966 established the first set of Federal Government colleges at Sokoto, Warri and Okposi (later moved to Enugu in 1974). In addition to Queen’s College (1927) and King’s College (1909), the colleges were designed and operated as centres of unity and excellence, with adequate provision of staff and facilities. The main problem of secondary education at this time was insufficient graduate teachers to improve the quality of teaching/learning. On another plane, there was rapid expansion in technical and vocational education. In 1966, there were about 73 institutions (Trade Centres, Craft Schools, and Technical Institutes) across the country, with pupil enrolment of 15,509 out of which 1,412 were females (Adesola, 2002). Like the secondary education sub-sector, shortage of technical instructors and high running costs were then as now the bane of technical education programmes.
A major achievement at this time was the phasing out of the Grade III teachers programme while the six Advanced Teachers Colleges, established in 1962, ran the Nigeria Certificate of Education (NCE) courses. The NCE programme was designed to produce teachers for the lower forms of secondary education, a policy that has remained in force up to the present day. With little modification to the Ashby Commission’s Recommendations of 1960, Government converted the three existing Nigerian Colleges of Arts, Science and Technology at Ibadan, Zaria and Enugu into regional universities in 1962 as University of Ife (now Obafemi Awolowo University), Ahmadu Bello University, Zaria, and the University of Nigeria, Enugu campus. The University of Lagos was established in the same year. The University of Nigeria, Nsukka was however established in 1960.
The Period of Oil Boom and Expansion 1966 –1979 The period 1966 to 1979 brought about the centralisation of education policies. The civil war between July 6, 1967 and January 15, 1970 had a devastating effect in the East, where many schools were destroyed and households became impoverished. In assuaging the effects of the war, federal government embarked on a policy of reconciliation, reconstruction and rehabilitation. With the creation of twelve states in 1967 and additional seven states in 1976, government engaged in rapid expansion of educational institutions with the objective of improving wider access to education at all levels. Gross Domestic Product (GDP) grew positively by 6.2% annually between 1970 and 1978 while oil accounted for almost 90% of foreign exchange earnings and 85% of total exports (Ekpo, et al. 2000). This wealth impacted positively on the educational system in many ways. The Udoji Salary Review Commission 1975, went
10
a long way to improve the lot of teachers and attracted many graduates to the teaching profession just as government took over the financing of teacher education. With the establishment of the University of Benin in 1970, five more universities were added in 1975 and six polytechnics between 1977 and 1979. In 1977 the Joint Admissions and Matriculation Board (JAMB) was established to streamline admission polices into Nigerian Universities. The Federal Government also took-over all private and mission schools, thereby bringing uniformity to the educational system in the country. It also established more institutions such as 13 Advanced Teachers Colleges, 3 Grade 1 Teachers Colleges; 35 Federal Government Colleges and Girls’ Colleges and 3 Federal Schools of Arts and Science (FRN, 1990). These institutional expansions resulted in increased enrolment levels. For example between 1970 and 1973 primary schools enrolment increased from 3,515,827 to 4,746,808; secondary schools from 310,054 to 448,904; secondary technical and vocational schools from 13,645 to 22,588; teacher training from 32,314 to 46,951 and Universities from 14,502 to 23,173 (Taiwo, 1980). This process of expansion and unification called for control of the quality of education. The Federal Inspectorate Service (FIS) was therefore established as an autonomous body in 1973 with branches in all the states (FME, 2002 b). It had the responsibility for quality control of all educational institutions below the tertiary level (FRN, 1998). The introduction of the national UPE programme aimed at improving access to school by providing free primary education for all children. This attempt at a UPE programme nationally also ran into difficulties. There were 6 million children enrolled in 1976 (as against a projected 2.3 million) and this figure doubled to 12 million in 1980. Above all, the decline in oil revenue forced the economy into recession with little financial provision to education to address shortage of qualified teachers, classrooms and infrastructure needed for the programme.
The National Curriculum Conference of 1969 tackled the issue of a national curriculum. The conference, which was put together by Nigeria Educational Research Council, evolved a national philosophy of education and means of controlling public education in the country. The report of the conference also led to the adoption of the National Policy on Education (NPE) first published in 1977 and later revised in 1981 and 1998. The important features of the policy were its outline of a philosophy for Nigerian education; promotion of the teaching of Nigerian languages; introduction of guidance and counselling in schools; diversified curriculum with pre-vocational and vocational/technical subjects and a 6-3-3-4 educational structure for the country. This new structure provides for 6 years primary education, 3 years junior secondary and 3 years senior secondary education and 4 years tertiary education. The NPE also embraced pre-primary education, adult and non-formal education and special education, especially children with disabilities. With the firm adoption of the UBE policy (pre-Dakar), the 6-3-3-4 structure is expected to metamorphose into a 9-3-4 structure.
Meanwhile, there is no strong legal framework to ensure implementation of the National Policy on Education. Nwana notes that in the early 80s and 90s, many higher institutions in the country abused the policy by extending the duration of secondary education through the establishment of school of basic studies and remedial studies of 1-2yrs duration. (Nwana, 2000). Some private institutions also run Advanced Level General Certificate of Education (GCE A/L) programmes as
11
qualification for foreign and local university admission. If the practice is acceptable as avenue for grade improvement, appropriate provision and amendment should be made to the policy.
Period of Austerity 1979 to 1999 The period from 1979 to 1999 could be described as one of instability and financial inadequacy in the educational sector in Nigeria (Ocho, 1995; Nwagwu, 1998). A new civilian administration was established in 1979 with a constitution that provided for education under the concurrent legislative list. This provision is similar to Schedule II Item L of the 1999 constitution, whereby both the National and State Assemblies can make laws on education. There was rapid expansion in education but this was short-lived. The economic depression of the 1980s brought a sharp decline to resources allocated to education. Government could no longer fund education adequately and this led parents to seek for alternatives in private schools which sprang up at all levels. In the primary education sub-sector, the gross enrolment ratio (GER), which had increased from 32% in 1965 and 40% in 1975/76 to 93% in 1982/83, declined to around 78% in 1990 (World Bank, 1994). Also per student expenditure declined considerably within the same period.
A series of strike actions embarked upon by teachers due to several months of unpaid salaries just as the Government withdrew from financing primary education in 1981 and transferred its management to state and local government levels. However, the Federal Government came to the rescue in 1988 by establishing the National Primary Education Commission (NPEC) to cater for the management, policy and allocation of funds to the primary education sub-sector. Although dissolved in 1991, NPEC was again re-established in 1993. The State Primary Education Boards (SPEBs), and local Government Education Authorities (LGEAs), were additional structures put in place for the management and disbursement of funds received from NPEC.
The products of the 1976 UPE gradually transited into Junior Secondary One in twelve states in 1982, while the remaining states completed transition in 1984 (5 states) and 1985 (2 states). A spate of policy somersaults began when another military regime in 1984 abolished all existing private institutions and prohibited the opening of new ones via Decree No. 14 of 1984. The government guaranteed uniformity in the education system by establishing the Education (National Minimum Standard and Establishment of Institutions) Amendment Decree. This decree modifies the first published in 1985 (Decree No. 12) and empowers the National Universities Commission (NUC) to assess and accredit academic programmes. Like the NUC, other relevant bodies such as National Council for Colleges of Education (NCCE) and National Board for Technical Education (NBTE) were set up through enabling decrees. Yoloye describes the functions of the three bodies as those of assisting to plan, organise, manage, fund, supervise and monitor the provision and development of university education, teacher education and technical and technological education and institutions respectively (FME, 2002a). As the government grappled with the Structural Adjustment Programme (SAP) in 1986 to bring the economy back on track, most of the schools managed by government started
12
to experience progressive deterioration of facilities and declining standard due to poor funding, management and supervision.
Some changes and innovations were introduced into the education policy from 1990 to 1992 after Nigeria adopted the “World Declaration on Education for All” and endorsed the Jomtien “Framework for Action to meet Basic Learning Needs”. Subsequently, the National Mass Literacy, Adult and Non-formal Education Commission was established via Decree 17 of 1990 to develop strategies for co-ordinating, monitoring and promoting literacy and post-literacy programmes nation-wide. The National Commission for Nomadic Education was similarly established via NCNE Act Cap 243, laws of the Federal Republic of Nigeria, 1990 to cater for the education of the nomads and migrant fishermen. The Jomtien goal of Education for All was further addressed with the introduction of a nine-year Basic Education programme in 1992 for children between ages 6 to 15. The programme aimed at universalising access to education, removing gender inequality and ensuring retention in schools. This laudable programme did not achieve the desired objectives during the 1990s.
Meanwhile, there were steady increases in the number and enrolment in the tertiary institutions. Okebukola records a total of 37 universities and 62 colleges of Education in 1996 with student population of 234,581 and 80,000 respectively, while the polytechnics and Colleges of Technology numbering 41 in 1998 had student population of 78,102 (Okebukola, 2000). The high demand, and poor funding caused many problems for the university system. While some lecturers left the country for greener pastures, others put pressure on government for improved welfare package and upgrading of facilities. This has resulted in endless strike actions. Nwana recalls the cancellation of the entire 1993/94 academic year for lack of effective teaching/learning (Nwana, 2000). Thus far, the state of education up to 1999 remained unstable, depressed and required urgent diagnosis and remedy. Educational Developments in Nigeria from 1999 to 2003. The administration of President Olusegun Obasanjo that was sworn-in on 29th May, 1999 inherited an education system on the verge of collapse. This much the President admitted during his address at the World Education Forum, Dakar, 27th April 2000, when he said: “In Nigeria, our administration is fully conscious of the decline of our educational standards and the decay of the whole system within the last couple of decades. Our educational system is as it stands a living proof of the damages that bad governance can do to our society and social structure”. (FME 2000). At the inception of the administration, a number of approaches were adopted, involving a wide range consultation with stakeholders for viable strategies for the attainment of educational goals. Some of these approaches include:
• Mini-summit on Universal Basic Education (Nov. 29th-Dec. 1st, 1999) to
canvass support of all stakeholders and international communities in the review of UBE blueprint and facilitate smooth implementation of the programme.
13
• FME-Donor Agency Co-ordination Meeting (18th-20th April, 2000), to acquaint the international community, especially the donor agencies with the policy thrust and priority programmes of the government in the education sector.
• National stakeholders Consultation on Education (30th-1st August, 2000), for
diagnosing and charting a new course for a socially responsive education programme.
• National Workshop on Distance Education in Nigeria. (27th-9th September,
2000), in collaboration with Commonwealth of Learning, Vancouver, UNESCO and UNICEF, aimed at repositioning the relevance of distance education as a cost-effective alternative in improving access to basic education.
• National Seminar on Technical and Vocational Education (TVE) (31st
October-2nd November 2000), to produce a blueprint for revamping and repositioning technical and vocational education in the country.
• National Education for All (EFA) Forum in collaboration with UNESCO,
UNICEF and the Education Tax Fund (July 29-August 1st, 2001), aimed at developing a comprehensive National EFA Action Plan and ensuring success of EFA goals.
• Inauguration of National Implementation Committee on Computer In Schools
(CISP) (January 18th, 2002), to lay foundation for ICT delivery at the basic education level.
• National Stakeholders Workshop on Education Sector Analysis (17th-20th
February 2002) in collaboration with UNESCO, to draw wider participation and foster clearer understanding of ESA process.
• National Summit on Higher Education, (11th-15th March, 2002), aimed at
repositioning higher education in the country. • Forum on Cost and Financing of Education In Nigeria. (18th-19th September,
2002) to provide avenue for stakeholders to discuss issues of education cost and financing.
• High Level Group (HLG) meeting on Education for All (EFA), (18th -20th
November, 2002), organised by UNESCO to review progress on EFA. The first policy thrust of the new administration was the Universal Basic Education (UBE) Programme which it launched on September 30th, 1999 in Sokoto. In launching the programme, the President in his speech admitted that the UBE is an ambitious and very costly programme, but assured that funds would be made available for properly equipping the schools (FME, 2000). Since the launch of UBE in 1999, more students have been enrolled. About 17.9 million children were enrolled
14
in primary schools in 1999. This increased to 19.2 million in 2000 and 19.4 million in 2001 (FME Baseline Survey data). In order to produce additional teachers for the UBE programme, the National Teachers Institute (NTI) organised the Pivotal Teacher Training Programmes (PTTP) through its Distance Learning System (DLS). About 300, 000 teachers have been produced. Teachers throughout the country are now better motivated through improved salaries. To arrest the dearth and uneven distribution of teachers in certain localities or states, the government has introduced a two-year service in a Teachers’ Corps programme. The programme will deploy teachers to any part of the country. It is also aimed cementing ethnic ties and encouraging distribution of teachers to greater areas of need. Another area of concern to the present administration is technical and vocational education, which has been reviewed to make the programme attractive to parents and students. As a first step, the federal technical colleges have been converted to federal science and technical colleges. They offer a 6-year programme cycle: a 3-year junior cycle for primary school certificate holders; a 3-year senior technical and senior science cycle for the product of the JS, and a 1-year-post secondary advanced technical cycle after a two-year industrial experience. The aim is to produce a skilled and competent work-force to support the economy. Again with the support of UNESCO, government is revising the curricula programme. NBTE is making efforts to enable polytechnics attain the 70:30 ratio in favour of production-based programme as distinct from service-based programmes. In terms of quality control of education, the Inspectorate Service has been given a boost by investing heavily in the provision of working tools, revision and production of training manuals and intensive training and retraining of inspectors which commenced in year 2000. With the assistance of UNESCO and DFID, the Education Sector Analysis (ESA) is undertaking a thorough review of Federal Inspectorate Services (FIS) in order to reposition it. In the higher education sub-sector the problems of access, quality, funding and management have been confronted. The three regulatory bodies on higher education, NUC, NCCE and NBTE, have been vigilant in quality assurance. All illegal satellite campuses have been banned in order to sustain the quality of education at that level. In exercising their constitutional rights private organisations sought for and obtained approval to run private universities. The present administration approved 4 private universities (one on July 31st, 2001, and three on February 12, 2002) in addition to the earlier 3, of May 10th, 1999 making a total of 47 universities. The Virtual Library Project launched in February, 2002, was meant to rejuvenate Nigerian universities through the provision of current books, journals, and other information resources using digital technology. It will also enhance scholarship, research and lifelong learning through the establishment of permanent access to shared digital archival collections. Promotion of access to higher education has encouraged government to embark on the National Open and Distance Learning Programme (ODL). This was done through the revival of the National Open University of Nigeria (NOUN), which will open study centres in each state capital. NOUN is expected to cater for the higher
15
education needs of about 200,000 students by the end of 2003. Government has also resuscitated the Federal Government Scholarship Award for studies in Nigeria and overseas 12,000 students benefited from the award in 2002. As the spread of HIV/AIDS became rampant, government established the HIV/AIDS unit in the Ministry in April, 2002 with the responsibility of creating awareness among children and youth on the scourge of HIV/AIDS. The Nigerian Educational Research and Development Council (NERDC) was saddled with the task of the designing a curriculum on Family Life and HIV/AIDS education.
The jinx on data collection and processing seemed to have been broken with the successful conduct of a nation-wide school census in February, 2002. Government has therefore promoted the Education Management Information System (EMIS) through a series of capacity reinforcement programmes and has come up with only one set of data through the Baseline 2002 Survey. The Education Sector Analysis (ESA) was set up by government with the support of UNESCO, World Bank, DFID and JICA to develop a long-term basis for educational planning and reform. It is also expected to strengthen analytical approaches and evidence-based policy formulation.
The government slogan, “Education For All (EFA) is the responsibility of all”, has informed the appointment of a member of a civil society organisation as the Co-ordinator of EFA programmes in the country. Ideals for the achievement of EFA goals were put together at the National EFA Forum held in Abuja in 2001. The National EFA Action Plan that will emerge will emphasise the strong commitment of the government to EFA goals, while building on the principle of participation of critical stakeholders.
A number of donor agencies and international development partners have contributed significantly to the efforts of the Obasanjo administration in the education sector. They include UNESCO, UNICEF, UNDP, the World Bank, DFID, ADB, USAID and JICA. Some of the donor-funded projects include:
• World Bank Primary Education Project II (PEP II CR 3346-UNI), to
strengthen human resources, curriculum improvement, data base, teaching/learning environment and HIV/AIDS awareness.
• World Bank/DFID UBE Project, to provide support for FME and UBE
implementing parastatals and 16 state governments. • Literacy Enhancement Assistance Programme – USAID: Improvement of
literacy and numeracy in primary and Islamiyya schools in three states. • International EFA Week and 2nd High level Group Meeting in EFA -
UNESCO. • Child - Friendly School Initiative – UNICEF. • Self-Help Project – World Bank PEP II, creating conducive teaching and
learning environments in primary schools so as to increase access and quality in schooling.
16
• Japan’s International Cooperation Agency (JICA) Assistance in Primary education, to rehabilitate primary schools in three pilot states.
Despite the achievements so far, very little could be seen at the secondary education level. However, the greatest obstacle to achieving educational goals at all levels is the low level of financial allocation to the education sector. The country has never met the 26% of total budgetary allocation to education recommended by UNESCO. The total federal allocation to education had been on decline from 11.13% in 1999, 8.70% in 2000 and 7.0% in 2001 (FME/UBE/CBN 2002). There is also apparent lopsidedness in the funding of the various sub-sectors, with higher education seemingly receiving a greater share than the UBE sector, as discussed further in Chapter Thirteen.
17
CHAPTER THREE
STRUCTURE AND MANAGEMENT OF THE EDUCATIONAL SYSTEM Organisation of the Educational System Figures 3.1 and 3.2 summarise the structure of the formal educational system, showing characteristics of the different levels of education. The Nigerian educational system has evolved through a series of reforms since independence. These reforms were designed to provide a good organisational structure that would enable the nation to achieve her national goals of social, political, economic and technological advancement. Two notable developments, the 1969 National Curriculum Conference and Simeon Adebo’s “Report of the Seminar on a National Policy on Education” in 1973, led to the publication of the National Policy on Education in 1977. The National Policy on Education reflected new developments in the society and the educational system at the time. The “6-5-2-3” structure of education had been rejected at the 1969 National Curriculum Conference in favour of a “6-3-3-4” structure, an important consideration being the desire to expand access to the tertiary level. Thus, under the National Policy on Education, adopted in 1977 and revised in 1981,1995 and 1998, Nigeria has a 6-3-3-4 educational system, offering six years of primary, three years of junior secondary, three years of senior secondary and four years of higher education. The system also includes adult and non-formal education programmes, a variety of teacher education programmes, and some programmes for children with disabilities (see NPC/UNICEF, 2001, pp. 189-190). The National Policy is currently undergoing another revision to reflect new issues and programmes such as the Education Sector Analysis, the “Education For All” campaign, the repositioning of the Federal Inspectorate Services, and the private universities. The reinstatement of the Higher School Certificate has received approval by the Federal Executive Council, and this is to be piloted in the sciences in selected Federal Government Colleges in 2003. The UBE embraces the first nine years of schooling, but pre-primary education remains a voluntary element in the educational system. Non-formal programmes consist of functional literacy, remedial, continuing, vocational, aesthetic, and cultural, political and environmental education for youths and adults outside the formal school system. The non-formal system allows for exit and re-entry at desired points or times in life. There is also provision for movement from the non-formal to the formal parts of the system.
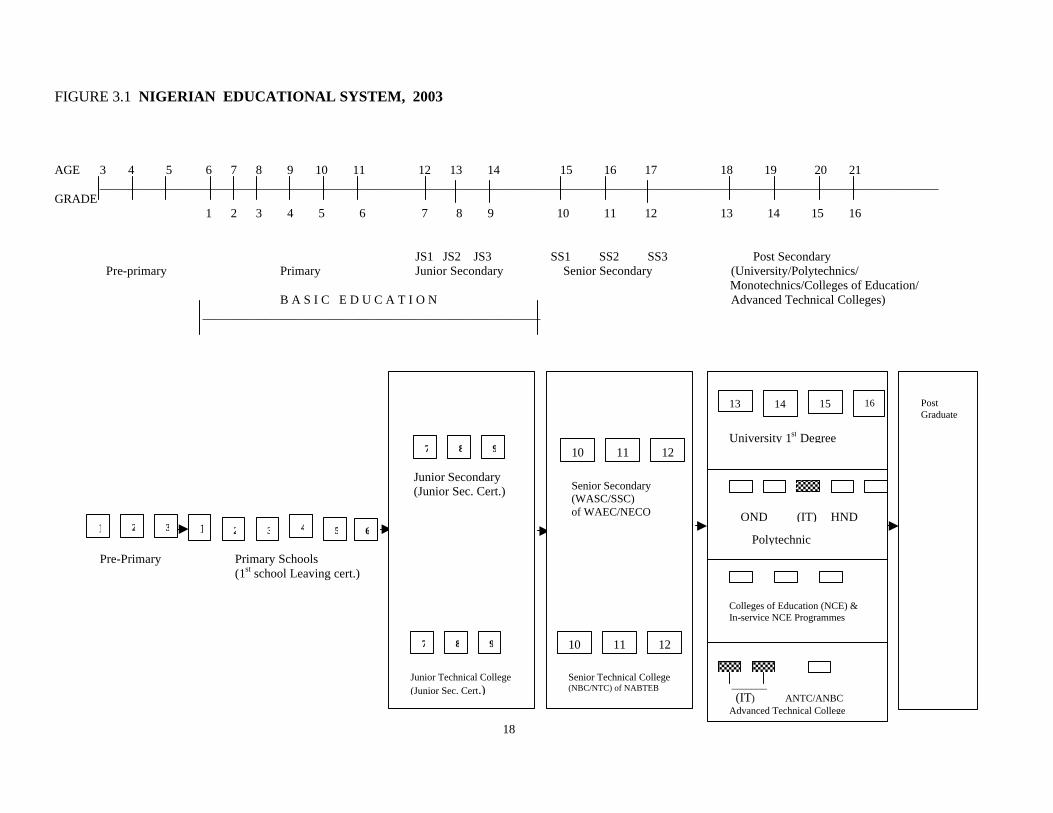
18
FIGURE 3.1 NIGERIAN EDUCATIONAL SYSTEM, 2003 AGE 3 4 5 6 7 8 9 10 11 12 13 14 15 16 17 18 19 20 21 ______________________________________________________________________________________________________________________________________ GRADE 1 2 3 4 5 6 7 8 9 10 11 12 13 14 15 16 JS1 JS2 JS3 SS1 SS2 SS3 Post Secondary Pre-primary Primary Junior Secondary Senior Secondary (University/Polytechnics/ Monotechnics/Colleges of Education/ B A S I C E D U C A T I O N Advanced Technical Colleges) ______________________________________________________ M.ED Ph
Pre-Primary Primary Schools (1st school Leaving cert.)
13 15 16 14
University 1st Degree
1 2 3 1 2 3 4 5 6
9
10 11 12
Senior Secondary (WASC/SSC) of WAEC/NECO
10 11 12
Senior Technical College (NBC/NTC) of NABTEB
987
_______ (IT) ANTC/ANBC Advanced Technical College
OND (IT) HND
Polytechnic
Junior Secondary (Junior Sec. Cert.)
87
Junior Technical College (Junior Sec. Cert.)
Colleges of Education (NCE) & In-service NCE Programmes
Post Graduate
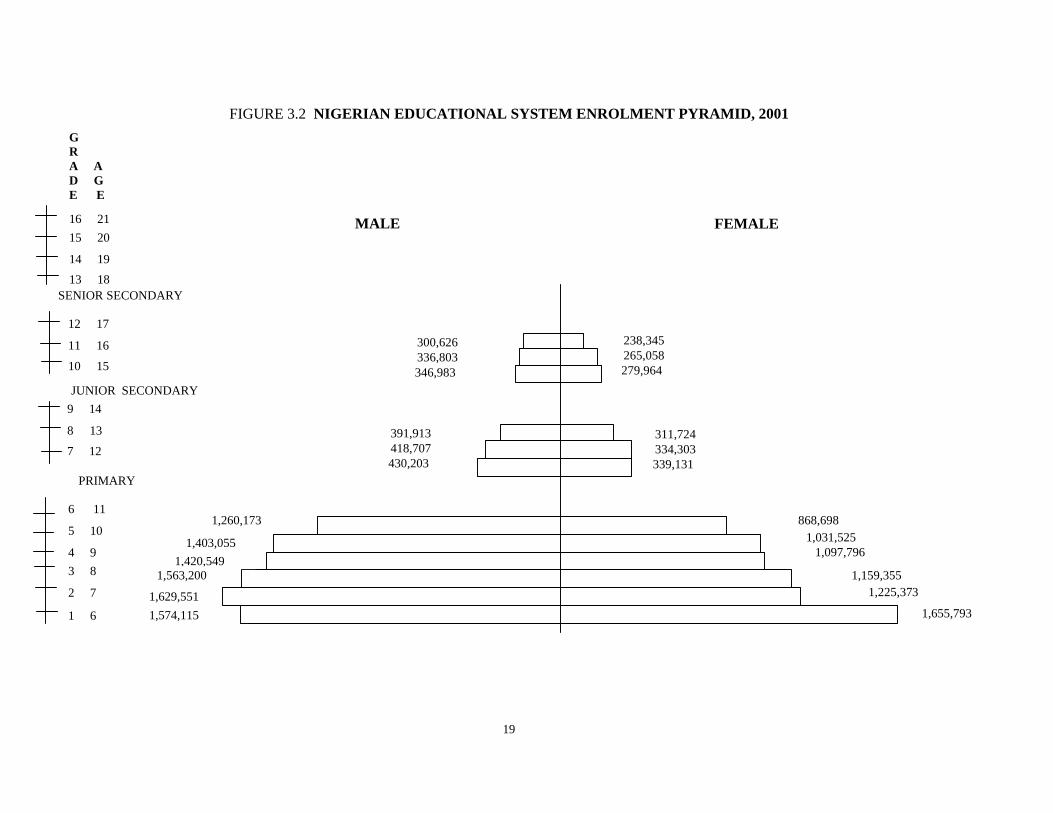
19
FIGURE 3.2 NIGERIAN EDUCATIONAL SYSTEM ENROLMENT PYRAMID, 2001
6 11
5 10
4 9
3 8
2 7
1 6
PRIMARY
9 14
8 13
7 12
JUNIOR SECONDARY
12 17
11 16
10 15
SENIOR SECONDARY
TERTIARY 16 21
15 20
14 19
13 18
G R A A D G E E
300,626 336,803 346,983
391,913 418,707 430,203
1,260,173
1,403,055 1,420,549
1,563,200
1,629,551 1,574,115 1,655,793
1,225,373 1,159,355
1,097,796 1,031,525
868,698
311,724 334,303 339,131
238,345 265,058 279,964
MALE FEMALE
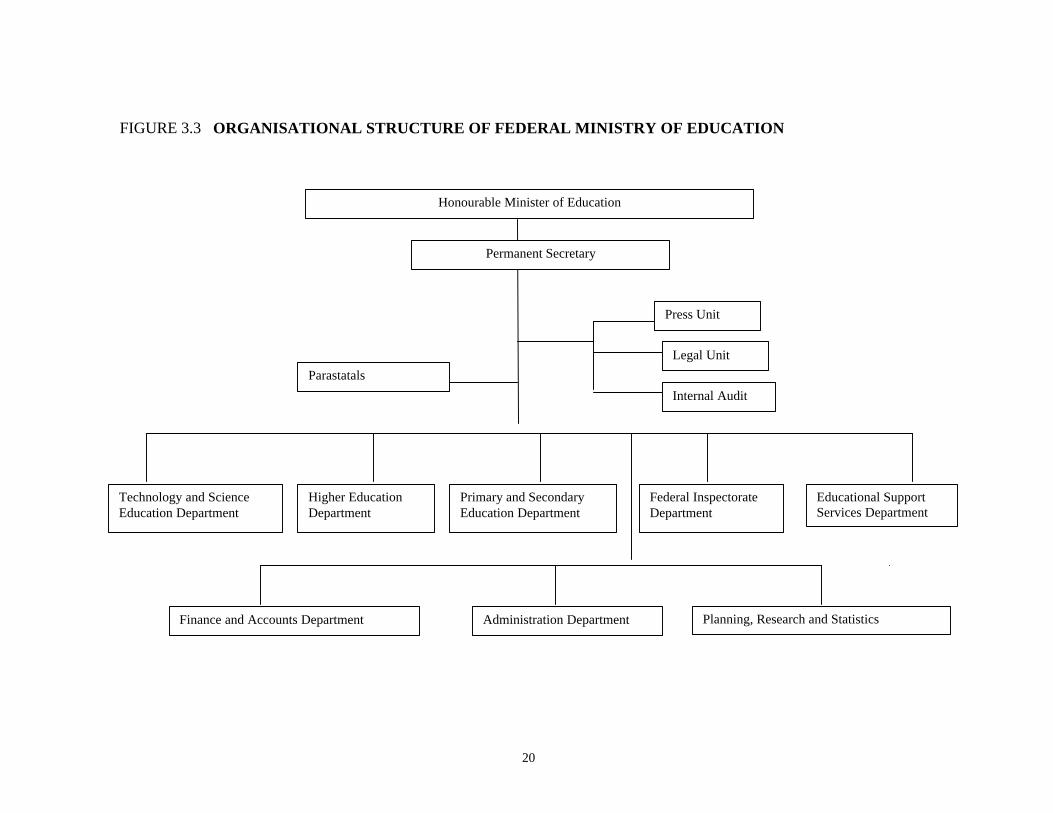
20
FIGURE 3.3 ORGANISATIONAL STRUCTURE OF FEDERAL MINISTRY OF EDUCATION
Honourable Minister of Education
Parastatals
Press Unit
Legal Unit
Internal Audit
Technology and Science Education Department
Primary and Secondary Education Department
Higher Education Department
Federal Inspectorate Department
Planning, Research and Statistics Department
Administration Department
Educational Support Services Department
Finance and Accounts Department
Permanent Secretary
21
Structure and Functions of the Federal Ministry of Education (FME) For effective and efficient discharge of its statutory functions, FME is structured into 8 departments. Of these, 3 are common services departments, namely Planning Research and Statistics, Administration, Finance and Accounts, while 5 are operations departments – Primary and Secondary Education, Higher Education, Technology and Science Education, Educational Support Services and the Federal Inspectorate Services whose operational foci are defined by the statutory mandate of the Ministry. There are also three statutory units: Press Unit, Legal Unit and the Internal Audit. See Figure 3.3 for illustration of the organogram. The State Ministries of Education have similar structures to those of the Federal Ministry of Education, for example having the three services departments, although the operations departments vary according to the needs of the various states. Recent research by Orbach (2003) shows that Planning, Research and Statistics Departments have poor levels of staffing and resources, at all levels of government, compared with other functions such as personnel management and school supervision. Orbach also reports inadequate levels of skill and training for the planning and research tasks, and a tendency for the departments concerned to be more dedicated to physical planning, tendering matters and the supervision of contractors, than to general educational planning. For example, in 2001 there were only 100 staff deployed to the PRS Department of the FME, as against a total staff of 31,883 (excluding parastatals) and 1,473 in Administration. The PRS department collects a series of data on enrolment and facilities and conducts a census of teachers, but data collection has not been effective due to logistical problems. There is dearth of reliable information on schools as the department has had difficulties in collecting reliable statistics. This bears out the comment of Sofolahan (1998) that one of the greatest administrative obstacles to achieving the set goals of the National Policy on Education has been the use of inadequate or unreliable data in the making of major policy decisions. Within the Planning Division, there is the Education Data Bank, which has organised the annual school census and processed the raw data obtained. The PRS departments are also in charge of research. Orbach (2003) finds that there is a capacity gap here as very few staff in these departments have been trained to plan or conduct research. The staff are usually ex-teachers, or architects or civil engineers with little knowledge of research methodology and statistics and the Orbach report indicates that their ability to conduct analytical work is limited. Lack of interest could also be a factor. In any case, the fact that the volume of research in the Federal Ministry and its parastatals has not been large lends credence to the idea of low capacity. The Educational Support Services Department gives support services to all the departments of the Ministry in areas that cut across departmental responsibilities. It evaluates qualifications; disseminates information on accredited institutions and courses in Nigeria and overseas; co-ordinates international co-operation in education; and adopts strategies that would lead to the reduction of HIV prevalence. The Technology and Science Education Department is responsible for pre-vocational and vocational education
22
as well as primary and secondary science education. It is also responsible for establishing and managing federal science and technical colleges. The Higher Education Department supervises tertiary institutions in collaboration with the relevant parastatals. It strives to promote an environment which facilitates learning, scholarship and crisis-free tertiary education. The Primary and Secondary Department is responsible for primary and secondary education matters nation-wide in accordance with the provision of the ministry and in particular the management of the Federal Government Colleges. The Federal Inspectorate Services Department is the quality control unit of the ministry and monitors the quality of primary and secondary education nation-wide. The Administration and Supply Department is responsible for personnel matters and office and stores management. The Finance and Accounts Department manages the budget of the Ministry. Legal Framework A major source of the law on education in Nigeria is the 1999 Constitution which like the 1979 Constitution provided both the nation’s educational objectives and the legal framework for the devolution of power and responsibilities for legislation on education among the three tiers of government. All federal and state laws, and all executive policies of government on education matters must respect the provisions of the constitution. The contemporary education laws and edicts and Acts of Parliament in Nigeria derive their sources from the regional laws, current constitutional provision and decrees, and edicts. They have been enacted on various aspects of education with each having specific objectives and orientation. Some are on primary and secondary education, such as the NPEC Act, UBE Act and Nomadic Education Acts. Others are targeted at higher education, such as NUC, NBTE and NCCE Acts. A few have focussed on examinations, such as those concerned with JAMB, NECO and examination malpractices. Many of the responsibilities of both Federal and States Ministries of Education are discharged through their parastatals. These are established in line with enabling laws by federal and state governments respectively, based on powers granted them over education by the constitution. The National Policy on Education is a source of information on how Nigerian education should be structured, organised and administered while the Public Service has government rules and regulations for educational administrators and managers. The Nigerian educational system is dynamic and laws must continue to give backing to education to guarantee a successful implementation of its policies. The education laws enable the government to take proper control of education and all related activities. They promote regulations for the development of the system and curriculum changes, and help to define the powers of functionaries and agencies as well as the implications of teacher registration and professionalism in teaching (Olagboye and Fadipe, 1998, 23). The administration and control of education are vested by law in the Federal and State Governments, with some responsibilities delegated to Local Governments (Taiwo, 1980). The 1999 constitutional provision accords concurrent legislative status to education.
23
With the Supreme Court Ruling of April 5, 2002, the jurisdiction of the Federal Government with regard to primary education has ceased to cover special financing through first line charge allocation. The latter was found to be inconsistent with the 1999 Constitution. Rather, State Governments are to receive direct allocations from the Federation Account for funding primary schools in their areas of jurisdiction. The responsibility of the Federal Government in the provision of general national guidelines, evaluation, monitoring and benchmarking for basic education, of which primary education is a part, still stands. While Section 4 (4) of the Constitution empowers the Federal Government to establish universities, post primary institutions, only Section 18 empowers it to provide equal and adequate educational opportunities at all levels. National Council on Education The Federal Ministry of Education has statutory responsibility for formulating, harmonising and co-ordinating policies and monitoring quality in service delivery in the education sector. The Federal Ministry of Education is itself advised by the National Council on Education, the highest policy-making body specifically for educational matters. The Council consists of the Federal Minister of Education and the State Commissioners for Education, and is in turn assisted by a Joint Consultative Committee on Education (JCCE), composed of professional officers of the Federal and State Ministries of Education. The JCCE, with its own consultative Reference Committees is an important feedback mechanism for federal policy. The Federal Ministry of Education takes responsibility for policy co-ordination and all federal level activities on education. Policy decisions are reached by consensus in the National Council on Education for implementation by the various states and local governments, but provisions are made for local adjustments to particular circumstances. For instance, the basic policy relating to structure, curriculum and school year is determined nationally, while selections of staff and other specific resources are carried out at the state and local government levels. These institutions have in general stood the test of time. There has, however, been some tension between central control and the spirit of federalism, in certain areas of educational management. Another problem has been discontinuity, due to changes of government, in the implementation of educational policies at the federal level. Responsibilities and Functions of the Various Levels of Government The basic legal framework for educational management in the country, as provided in the 1999 Constitution, spells out basic national objectives for education. It states that the government should seek to ensure equal and adequate educational opportunities at all levels, to promote science and technology, and to eradicate illiteracy. Education is accorded concurrent legislative status in both the 1979 and the 1999 Constitutions. This means that both Federal and State Governments have legislative jurisdiction and corresponding functional responsibilities with respect to education. There
24
is a division of labour, though not articulated fully, among the three tiers of government with respect to the different levels of the education system. A few functions are exclusively assigned to the Federal or State Governments, though most functions are treated as responsibilities shared by the three levels of government – federal, state and local (Orbach, 2003, p. 3). Both Federal and State Governments can legislate on, establish and manage institutions for the purposes of providing university, technological, professional or post-primary education. States can make laws with respect to technical, vocational, post-primary or other forms of education. Local Governments have a formal responsibility (dating from the Local Government Decree of 1976) for providing and maintaining primary education, subject to necessary assistance from the states. The constitution envisages that, in the primary and secondary education sub-sectors, the Federal Government’s main role is to determine national policy, set standards (including curriculum) and monitor performance, while the States design, develop and deliver the services. In practice, however, the Federal Government has, for most of the period from 1988 to the present, directly influenced the financing and management of primary education through what Orbach (2003) describes as a “parallel structure” of special institutions at federal and state level. The period from 1979 to 1988 had been one of increasing economic difficulties and of much improvisation in the financing and management of primary education (see Hinchliffe, 1989). In the southern states, State and Local Governments generally shared responsibility for teachers’ salaries; in most of the northern states, Local Governments were responsible, but were subject to much supervision by State Ministries of Local Government. Decree 31 of 1988 introduced a more reliable and uniform pattern of funding by making the cost of primary teachers’ salaries a first charge on the Federation Account. It established a National Primary Education Commission (NPEC) at the centre, and Primary Schools Management Boards (PSMBs) at the state level, through which funds for salaries were channelled directly to the Local Government Education Authorities (LGEAs). LGEA budgets were separated from those of the Local Governments. The PSMBs also took over most of the supervision of LGEAs, and were then monitored by the NPEC. In 1991 this system was abruptly terminated by Decree 3, which gave full responsibility for primary education to the Local Governments. However, after a period of “incessant and prolonged strike actions” by primary school teachers over non-payment of salaries, Decree 96 of 1993 restored the system of 1988 (Okoro, 1998, p. 46). With the scope of basic education encompassing the 3 years of junior secondary school, a new commission, the Universal Basic Education Commission (UBE) replaced NPEC. NPEC had tended to acquire increased managerial functions in the later 1990s. The direct federal funding of primary education was stopped as a result of a Supreme Court ruling of April 2002, to the effect that it was unconstitutional for the Federal Government to circumvent the State Governments in funding primary education. This led to the withdrawal of a UBE Bill in the House of Representatives, which had assumed that UBE programmes would benefit from “first charge” financing. At present, therefore,
25
LGEAs receive their funds from State Governments, while the SPEBs retain an important managerial role. Some commentators, including Orbach (2003) see this latest development as an opportunity to establish an improved “division of labour” between the various levels of government. Orbach argues that that it could be used to develop the managerial capacity of State Governments and to promote a more integrated planning of education at state level. Others consider that the system restored in 1993 was effective in maintaining regular payment of teachers’ salaries and should be retained (e.g. Francis et al., 1998, p. 55). Whatever the outcome of the debate, there is a need to determine who is accountable for what in the areas of concurrent responsibility. In the long run, improving the capacity to manage education both at the state and at the local government levels is necessarily an important goal. Management Over time, the power and responsibilities of the various levels of government have changed with changes in the constitution and perceived abilities of each government to undertake the financial and managerial responsibilities assigned. Thus, no single tier of government has absolute responsibility for any sub-sector; rather there are varying degrees of overlap. Both the Federal and the State Governments finance and manage their own tertiary institutions: universities, polytechnics and teacher training colleges. At the secondary level, there are 83 Federal Government Colleges and 19 Federal Science and Technical Colleges, spread across the states. All other public secondary schools are managed and financed by State Governments, through State Ministries of Education. As Hinchliffe notes (2002), financing and management structures have been stable for tertiary and secondary education, unlike the case of primary education. Local Government Education Authorities (LGEAs) manage public primary schools, with help from the State Primary Education Boards (SPEBs), and their financing has already been discussed above. Although local communities are supposed to be directly involved in the management of public primary schools through District and Village Education Committees and Parent-Teacher Associations (PTAs), the reality on the ground is generally different. While the Committees have not functioned as intended, PTAs are cast in a supporting role rather than a managerial one. At the school level, however, effective enrolment, attendance and learning do depend on the co-operative efforts of school staff, pupils, households and local communities. Private and community schools at all levels have to comply with minimum standards prescribed by state laws. Quality control of all schools, both public and private, is through inspection and supervision by the various levels of government. Networks of non-governmental organisations collaborate with State and Federal Ministries of Education in the management of non-formal education programmes. At the federal and state levels, there are inspectorates which monitor and evaluate schools below the tertiary level, and LGEAs also inspect primary schools. The Federal Inspectorate Services (FIS) Department, established in 1973, monitors the performance of primary and secondary education throughout the country. In 2002, it had a total of 1502 staff, consisting of 398
26
inspectors and 1104 other staff. These are distributed amongst the national headquarters, 6 zonal offices and 36 state offices and FCT. There are inspection guidelines in various subjects to aid inspection for improving the content and quality of education. A common criticism is that the stipulated minimum standards are not stated in measurable terms when it comes to the implementation of curriculum content. There is also a problem of uneven distribution of federal inspectors in the various state offices. While some have fewer than 5 inspectors, others have as many as 20 (FME, 2003). A recent report (NPC/UNICEF, 2001) criticises the various inspectorates, both state and federal, for ineffective performance, attributing this to inadequate funding and training (p. 161). Other monitoring units may be mentioned briefly. UBEC has a monitoring and evaluation department concerned with all aspects of the primary education programmes, while the Departments of Planning, Research and Statistics of the Federal and State Ministries of Education and SPEBs also have monitoring and evaluation branches concerned with specific projects and programmes of their institutions. Educational Parastatals The Federal Ministry of Education is linked up to its parastatals through its operations and services departments for purposes of supervision. The structure and organisation of the parastatals resemble those of the parent ministry. There are 21 parastatals under FME, classified into four major groups based on their basic functions. They are the supervisory and regulatory parastatals – NUC, NBTE, NCCE, UBE, NMEC, NCNE; those for research, development and training – NERDC, NMC, NLN, NTI, NIEPA; those for measurement, evaluation and examinations – WAEC, JAMB, NBEM, NABTEB, and those for language training and development – NFLV, NINLAN, NALV (see Annex VII for a summary). Nearly all these parastatals have their governing councils. State Governments also have educational parastatals. Major examples are Teaching Service Commissions, Science and Technical Education Boards, State Primary Education Boards (SPEBs), State Mass Education Commissions (SMECs), Governing Councils of tertiary institutions and Scholarship Boards. The proposed UBE Commission (UBEC, at present the UBE Programme) would be the main co-ordinating body for all components of basic education: primary education, junior secondary education, and all forms of non-formal education. There are also special commissions at the federal level for adult literacy (NMEC) and for the education of nomadic children and adults (NCNE). Since these commissions predate the UBE Programme, their relationship with it requires clarification. Arrangements to harmonise management between UBEC and the State Ministries of Education are under consideration too, since facilities and staff are shared by junior and senior secondary schools in most cases.
27
At the tertiary level, four national commissions monitor both federal and state institutions. These are the NUC, for universities, the NBTE for polytechnics, the NCCE for colleges of education, and NOUN for the National Open University. Other important national commissions are NERDC, for educational research; NIEPA, for the improvement of educational planning and administration; and NTI, charged with responsibilities for upgrading of teachers through in-service training, and for teachers’ professional development through workshop, seminars and conferences. External examinations for schools are administered partly by an international body (WAEC), partly by national bodies (NECO, NABTEB and JAMB), and partly by state bodies. (For a summary of the functions of all these bodies, see Annex VII.)

28
29
CHAPTER FOUR
EARLY CHILDHOOD EDUCATION Introduction In this chapter, a broad categorization of early childhood education and non-formal childcare centres is used to depict the community-based informal types, and pre-primary schools to depict the more organized formalized types. Both types are referred to as Early Childhood Education. The National Policy on Education (1998) describes pre-primary education as the education given in an educational institution to children aged 3 to 5 plus prior to their entering the primary school. Described as a period of rapid physical growth, including the development of the brain almost to its full adult size, this stage of life is also regarded as a critical period for the development of cognitive functions (UNICEF, 2001). Care, health, nutrition and stimulation are regarded as the key factors for child growth and development in these formative years. National expectations for education at this level affirm the stipulations for the level in the Child Rights Convention (CRC) all of which were given a new impetus in Dakar World Education Forum and are emphasized under the 1999 UBE Programme. Objectives
The purposes of pre-primary education as specified in Section 13 of the Policy reiterate the critical importance of these factors. The policy states that the purpose of pre-primary education shall be to effect a smooth transition from home to the school; prepare the child for the primary level of education; provide adequate care and supervision for the children while their parents are at work (on the farms, in the markets, offices, etc.); inculcate social norms; inculcate in the child the spirit of enquiry and creativity through the exploration of nature, the environment, art, music and playing with toys, etc; develop a sense of cooperation and team spirit; learn good habits especially good health habits and teach the rudiments of numbers, letters, colours, shapes and forms through play.
The two sections, which follow, will consider both the availability and quality of the existing-child care centres and pre-primary schools. Critical issues that relate to this sub sector of education are identified, with particular concern for their implications for meeting the Universal Basic Education (UBE) goal and the Dakar Framework for Action. Non-Formal Child-Care Centres
The growth of childcare centres (often described as day-care centres) has been closely linked to the growth of female employment. Government involvement in the provision of child-care centres began on agreement among FGN (NERDC), Bernard Van
30
Leer Foundation and UNICEF, which led to the establishment of 5 pilot projects in rural communities for disadvantaged rural children. The success of these projects and subsequent replication efforts has been widely documented (FGN/UNICEF, 1993; FME, 2000; NPC/UNICEF, 2001: ESA, 2003).
Non-formal childcare centres are the kinds of facilities that are categorized as day-care centres, which have sprung up to meet the increasing demand of mothers who now work outside the home. A further categorization is possible here to depict centres which are well established with full facilities and those either organized by the women themselves, or set up by the community or run by individuals who are neither trained nor in any way oriented in such care but rely on their own child rearing instincts to look after a collection of children to fill an immediate need.
The FGN/UNICEF report (2001) discusses two major categories of non-formal day-care centres namely:
The ‘superior’ type in purpose-built facilities which have generally high standards but charge high fees and so are accessible only to the children of the elite, and the informal day-care centres in poorer areas of the cities, operating usually in impoverished, overcrowded facilities and with neither the materials nor the professional staff needed to provide appropriate stimulation for young children (p.38).
Enrolment in both categories of centres was 47% of a total of 18,836 children in
the sampled centres for children aged 25-36 months and 37% for fewer than 6 months (FGN/UNICEF, 1993).
The Situation and Policy Analysis (SAPA) of Basic Education provides what is perhaps the most authoritative information concerning these non-formal day-care facilities. The document attests to a general recognition and acceptance among the sampled mothers of the need for early childhood education and asserts that day-care centres are readily available with 57 percent less than 1 km away from the children’s homes. The few cases where a distance of more than 5 km is recorded occurred generally in large cities and urban centres especially in Lagos, Kano, Kaduna, Port Harcourt and Ibadan. A negative aspect to this is that as many as 44% of the sampled centres are located close to major roads (perhaps for ease of access), 4.1% are located near record shops and markets while 2.8% are located near hotels and motels.
The SAPA survey also found that these centres operate in purpose-built facilities (24%); homes (30.8%); flats (10.5%); single-room apartments (14.0%); churches and mosques (16.2%); garages (1.6%); and open spaces (2.4%). None of these outfits have the full complement of play facilities. All the centres had chalk- boards, charts and poster of sorts.
In the area of learning and instruction, field reports show that many of the children in these centres are made to sleep a lot of the time (55%) while 41.6% spend most of the time playing with toys. Teaching is mostly done in English (77% of the time)
31
while local language is used 7.5% of the time in rural communities (FGN/UNICEF,1993). The report found, under welfare, that most had clean water and toilet facilities while 18.9% had medical supplies, 2.7% had sick bays, 14.6% had visiting doctors and 38.9% had no medical facilities.
Most of the landmark activities undertaken by the Federal Government in this sub-sector of education are done in partnership with development partners. By 1996, for instance, the FGN/UNICEF partnership on the pilot project of community-based care had been replicated in 10 more states of the Federation. This initiative resulted in the establishment of 2,045 early childcare centres with 75,000 children. The number of these centres grew to more than 7,300 for 400,000 children in 12 states during the next phase of implementation. Despite these achievements and the various training programmes provided for teachers, parents and community members, access to day-care centres is still beyond the reach of many Nigerian children.
A further national survey is necessary to determine what the situation is with the centres since the last national count of 1993 with the SAPA report. In almost every street in large cities, child-minding centres are run with the children grouped around a motherly (and sometimes not so motherly) figure who leads them in songs, play and generally keeps an eye on them until their mothers are able to pick them up. At mid-day or later, the children are seen being walked home from their centres by young people. These guardians normally referred to as ‘ aunties’ and ‘uncles’, drop off their young charges from door to door and the next day another round begins.
Pre-Primary Schools
It is estimated that about 12,000 pre-primary schools are registered with government (NPC/UNICEF, 2001) from an estimated figure of 4,200 in 1985 and approximately 8,300 in 1992 (FGN/UNICEF, 1993). This indicates a rapid growth in educational provision at this level.
According to the MICS (FOS/UNICEF, 1999) data, however, only about 18% of Nigerian children aged 36-59 months attend pre-primary centres. Female enrolment according to the same source was 19% while male enrolment was 18% showing an insignificant difference between boys and girls in access. The report on the other hand shows regional disparities in access and very significant differences between urban (37%) and rural (12%) areas (FGN/UNICEF, 2001).
The curriculum taught at these centres is broad-based covering a wide range of subjects. The SAPA document was not specific on whether the curriculum in use is the approved Guidelines. However, it focuses on English Language, Mathematics/Arithmetic, Local Language, Moral/Religious Instruction, Writing, Reading, Poems/Rhymes and Elementary Science/Nature Study. These constitute an average of 28 periods a week, 30 minutes each day of break and 25 minutes each day of play. The English Language is used 93.2 percent of the time in the sampled areas as the medium of communication.
32
Nutrition is an important part of the care given to children at this time so school meals are important aspects of the school life. The children eat well with their diet incorporating fish, beans and bean products which are brought from home (68%), and procured from food vendors (26%). Quality Assurance
A curriculum guideline was developed between NERDC and UNICEF along with several training manuals. This is in line with the policy provision of government to control quality in pre-school. The distribution patterns for these guidelines however, leaves much to be desired as several centres operate without the guidelines and most have never set eyes on the training manual let alone being trained in their use.
This is not unconnected with the issue of non-supervision of these centres. The national policy of non-direct government intervention at this level may also be a factor constraining qualitative growth in the sub sector. This reality is perhaps a major contributory factor to the seemingly undirected state of affairs in this sub sector. Simple quality control issues such as choice of site for the centres (already reported earlier to be sited in inappropriate places), affirm the lack of direction in the sub- sector.
The SAPA document reports, however, a relatively respectable level of internal efficiency with attrition rate as low as 2.3 %. Promotion of children from one class to another increased especially from Nursery 1 to 2. Attendance was fairly regular with malaria fever (85.7%); measles (62.4%); cough (60.8%); intestinal disorders (17.0%) and guinea worm (2.4%) recorded as common causes of absenteeism. Teachers were relatively well qualified with over 25% of the 5281 teachers holding the NCE Certificates. Over 60% of these teachers were females (FGN/UNICEF, 1993). Service Providers
It is important to point out the fact that the provision of both child-care centres and pre-primary education is almost entirely a private affair. Although some state governments have established models of primary/pre-primary school linkages, yet the major service providers in this areas are sole and private persons. The government specifies for itself the responsibilities of promoting the training of qualified pre-primary schoolteachers in adequate number, contributing to the development of suitable curriculum and controlling the quality of such institutions, and encourages as much private participation as possible in service provision.
Sole proprietors, private sector, community and religious organisations own about
80 percent of the centres sampled in SAPA, while 10 percent are owned by government through its supervisory agencies. These assertions are reaffirmed in the Comprehensive Education Analysis (CEA) document (FGN, 2002).
33
Costs and Benefits of Early Childhood Education
As government intervention in this sub-sector has been limited to setting standards, training teachers and to an extent developing materials, the direct costs of maintaining children’s participation at this level lies with parents and community members. The category of responsibility to which government has committed itself accounts for the financial input that government makes in the sub-sector. In the provision of instructional materials for instance, government has collaborated, albeit heavily, with UNICEF and Bernard Van Leer in carrying this role. Data up to 1999 show that several documents including a Curriculum Guideline (although needing updating) and several Training Manuals and pre-school Readers for various categories of providers and learners have been developed. Although the distribution patterns of these materials have not matched expectations, yet the existence of these materials lend credence to a visible attempt to add quality to the system.
In the area of training, the project agreement between FGN, UNICEF and Bernard Van Leer has led to the training and capacity building of 1,056 desk officers, 15,409 care givers and 1,232 para-teachers between 1991 and 1999 (FGN, 2000). It should be pointed out however, that although modules have been developed for the training packages used to conduct training for these teachers, the mode of delivery is largely often non-formal and varies among providers. The training programmes are almost always conducted by NGOs, CBOs and church organizations (within the project agreement framework, of course); not much can be said on the quality and standard of delivery across providers. Thus, motley assortments of techniques, some not too qualitative, are identified in this area. Efforts must be made to make better use of these manuals already developed for more standardized packaging.
This brings up the issue of teachers for pre-primary. With COEs not so active in
teacher specialization in pre-primary education, one finds that the teachers employed in pre-primary schools are mostly NCE graduates, university graduates who may or may not have read education or young school leavers. Surprisingly the SAPA report found that the sampled nursery schools are reasonably well staffed with 25% of the 5,281 teachers sampled holding NCE certificates while 175 were actually graduates with specialization in pre-primary education. Non-documented sources through observation show that many school leavers who find no job on completion actually end up teaching in nursery and pre-primary schools. The need for teachers in this area is constantly expanding. There is need to critically examine the teachers needs in this area and determine how these needs can be met.
The direct costs of maintaining a child at this level of education for parents has
risen steadily over the years from as little as N20 a month per child in the day-care center in the 1970s (Onibokun, 1977) to as much as N20,000 per term obtainable at present. The types of facilities that are described in this report are actually available on the basis of affordability. Parents have to make this choice according to their economic and social status. The costs are incurred on child-minding charges (day-care centres); school fees (pre-primary schools); uniforms (optional but very popular among the less elitist
34
facilities); and lunch packs and reading materials. Transportation to a large extent also has cost implications especially if the center or pre-school is not located near the home. Two factors determine which service a parent will go for, namely: the mother’s working status and place of work; and affordability. Children are either placed in day-care centres or pre-schools where their mothers or older siblings can easily pick them up at close of work, business or school. This means that the facility eventually chosen by a parent may not necessarily be the one closest to home. The transport element comes in where the center is not located close to home.
Fees for childcare centres are widely varied and determined by the type of facilities.
They range from about N300 per month to N10,000 per year, and there are even extremes of N50,000.00 per year in Lagos metropolis. The additional costs of uniforms, lunch and transportation (where necessary) amount to a unit cost of about N7,300 per term totalling N21, 900 per year. This estimate is based on an average of N50.00 for transport per day, N50.00 for lunch per day and N800.00 for uniform purchased once a year. The cost of uniforms varies according to school and location. Lunch costs may also vary according to socio-economic status. The cost of reading materials is often built into the tuition (fees).
For pre-primary schools, costs are higher and determined by the neighbourhood, status or class. Popular models of formal pre-primary schools are often linked with primary and sometimes secondary levels (within the same premises and owned by the same proprietor). Parents often find it convenient to place both pre-school and primary school children within the same school premises. The costs of services provided at this level are higher and also varies across states and standards. In the Lagos metropolis for instance, costs can be as high as N50,000 per term and as low as N2000 per term. Monthly fees are not popular at this level. In Cross River State, a study found that costs ranged between N6000 and N10,000 per year (Agusiobu, 2003). Most parents find these costs high especially in view of the fact that lunch, books and uniforms are significant non-inclusive aspects of the costs mentioned above.
Mothers as a result resort to taking their children along with them to the market or roadside wherever their occupations are. The number of children seen around their mothers in very harsh market environments and even at roadsides is on the increase. Although other factors such as ignorance and uncertainty (handing one’s child over to someone else to look after as it were) could be at play here, one may not completely rule out the fact that a lot more children may get sent to well organized child care centres and pre-schools if the costs are affordable.
The presence of such young children in markets has led some NGOs to canvass the establishment of day-care centres in the markets. The Federal Ministry of Women’s Affairs and Youth Development in collaboration with UNICEF, has undertaken social mobilization, advocacy and sensitisation involving women at this level. Some centres have actually been established in some markets in recognition of the need to provide these children with appropriate learning experiences.
35
The fact is that parents unwittingly weigh the costs of providing education against what they may regard as their priorities. Often being ignorant of the importance of proper stimulation at this time for subsequent performance at the levels they recognise, they unwittingly make choices against the ‘extra burden’ of beginning to pay school fees so soon as it were. Costs can therefore be said to be a critical issue in access to pre-school education. The structure of service delivery at present makes the service available only to those who can afford to pay for it. Yet it is so critical that children must begin early to be exposed to proper stimulation. Can government afford to continue ignoring this level of education, the level at which the foundation for subsequent performance is laid?
Already some states have begun experimenting (some have actually gone beyond
experimentation) with pre-primary/primary school linkages and the results are increased access and greater cost-effectiveness. For instance, the same school facilities are used and the same staff, with very little extra support if any.
The choice that government would ultimately make as to whether to intervene
directly or not must be weighted against the odds and interplay of various factors. The current reality, however, is that the data that government needs to compute actual unit costs of educating one child at the pre-primary level are not easily available. Urwick (2002) found in the Jos area that the cost to the household of pre-primary schooling is much the same as the cost of private primary schooling. The choice to use pre-primary education is, however, only being made by parents who understand its import. Those parents who do not (and these form the majority), simply ignore that service. It does appear that the gap between private and public provision of pre-primary education must be bridged in order to increase access for all.
A government decision on the extent of intervention in the pre-primary sub-sector
must be seen in the light of the established advantage that children who have received pre-primary education have over those who have not. Commitments to increasing learning achievement must, as of necessity, begin at streamlining, standardizing and adding quality to the early care that the Nigerian child receives.
Milestones and innovations
As has been noted earlier, in recognition of the importance of adequate stimulation at this level, and partly in an attempt to release more (who may get denied schooling opportunities to look after younger siblings) a few state governments have introduced pre-primary primary linkage programmes in public primary schools. A few states including Oyo have done remarkably well in this linkage. It is hoped that more states can adopt this practice and that way provide leadership in this area.
The idea of crèches is also being pushed forward and implemented by various state governments. Trained assistants under the state Ministry of Women Affairs and Youth Development establish childcare centres/nursery schools in government secretariats and run them. This practice exists in Lagos State and is a good way of providing leadership.
36
The UBE Bill holds greater potential for government involvement in pre-primary education. Because pre-primary education is an important component of the UBE programme, it is expected that the passing of the bill will accord the necessary statutory backing for greater Federal Government involvement in the sub-sector.
Such intervention is necessary for the streamlining activities of service providers in this sub-sector. The diversity of service packages here, especially in the areas of costs and quality assurance, needs to be somewhat controlled. Otherwise participation in childcare and pre-primary education will remain on a take-it or leave it basis or at worst based on affordability. Both criteria do not enhance the chances of increasing the performance of children at school or meeting the first of the six EFA goals.
Another challenge for pre-primary education is to strengthen the indigenous content of the knowledge transmitted to children at this level. The ESA unit is involved with analysing what exists now and how they can be incorporated in the curriculum.
37
CHAPTER FIVE
PRIMARY EDUCATION The Basic Education Framework The National Policy on Education (FGN, 1998) provides the 6-3-3-4 system of education, which translates to six-year primary education, three-year junior secondary education, three-year senior secondary education and four-year tertiary education. The first nine years of schooling up to the end of junior secondary level is regarded as the basic education segment. Following the 1990 Jomtien Declaration and Framework for Action on Education for All by the year 2000, Nigeria introduced a nine-year basic education programme in 1992. It was designed for children between the ages six and fifteen. The programme envisaged that children would remain in school until completion of junior secondary education and acquire basic competencies and life-long skills. The failure of many countries to meet the Jomtien goals necessitated the adoption in 2000 of the Dakar Framework for Action and a commitment to achieve Education for All (EFA) by the year 2015. The Dakar Framework sets six major EFA goals and proposes twelve major strategies for achieving the goals. The present administration launched the Universal Basic Education (UBE) programme in 1999, seven months ahead of “Dakar 2000”and integrated the six EFA goals into the UBE Blueprint. The UBE programme seeks to make the formal levels of primary and junior secondary education universal, free and compulsory. It further embraces skill acquisition programmes for out-of-school youth; adult literacy, and education for disadvantaged groups such as nomads. In pursuance of the EFA goals for primary education, the government adopted a participatory approach to ensure that the programme responds to the needs of the people. It further embarked on public enlightenment and social mobilisation to ensure full community involvement. Scope and Objectives of Primary Education Primary education is the education given in institutions for children aged 6 to 11 (FRN, 1998) and has a duration of six years. In Nigeria and other E-9 countries, primary education forms the base of the 9-year basic education programme. It is tuition free, universal and compulsory. The objectives of primary education are derived from the National Policy on Education. One of the objectives is to equip the individual with a solid base for scientific and reflective thinking through the inculcation of permanent literacy and numeracy. The individual that has passed through primary education must have imbibed a sound attitude and character training to enable the recipient to adapt to the changing environment. Indeed, at the end of primary education programme, the recipient
38
must have acquired manipulative skills necessary to function effectively in the society within the limit of his capacity. Access: General Indicators Access to primary education has been a source of concern to successive administrations in the country. In view of the past efforts of governments at universalising access (the Universal Primary Education (UPE) of the regional governments in the 50s, the Federal Government UPE programme of 1976, the universal basic education of 1992, and lately the Universal Basic Education (UBE) programme of 1999), one would expect a near 100% enrolment of all school age children in the country. In Nigeria, the official age for admission into Primary One is six years. Access to primary education can be determined using the apparent (gross) intake rate and the net intake rate. The gross intake rate is a rough estimate of access to Primary One. It is the total number of new entrants to Primary One irrespective of age, expressed as a percentage of population of children of the official age of entry (6 years). If the rate exceeds 100%, either under-age or over-age pupils have been admitted. The net intake rate cannot be estimated, as data are not available on the ages of children in school. In 1991, the gross intake rate was 99% for both boys and girls nationally. It rose to 100% in 1993 and fell steadily to 80% in 1996. This trend is similar among the sexes when disaggregated. Thus the 107% for boys in 1991 rose to 110% in 1993, indicating presence of over or under-age pupils, and declined to 88% in 1996. Similarly, the girls highest gross intake of 89% in 1992 declined to 73% in 1996 (FME, 2000). The Comprehensive Education Analysis (FME, 2000) reports states with over 100% gross intake rate as including Akwa-Ibom, Benue, Borno, Kogi, Ogun, Osun, Plateau, Taraba and Yobe, while those with low intake to Primary One for boys and girls are Sokoto, Kebbi, Jigawa, Bauchi and Anambra States. It must be mentioned that all the enrolment and GER rates from the Education Data Bank (EDB) and the UBE Programme relate to the public sector only. Enrolment Primary schools in Nigeria have witnessed a phenomenal increase in enrolment over the years. From 2.9 million in 1960, the enrolment figure rose to 3.5 million in 1970, 4.7 million in 1973 and 8.2 million at the inception of UPE in 1976 (Taiwo; 1980). The public sector enrolment figure rose to 13.6 million in 1990 and 16.2 million in 1994, before declining to 14.1 million in 1996 (55% male and 45% female) (FME, 2000). With the introduction of UBE in 1999, the enrolment trend has picked up again, reaching 17.9 million in 1999, 19.2 million in 2000 and 19.4 million in 2001 (FME Baseline Survey data covering both public and private sectors). Equally the number of government primary schools rose from 40,204 in 1997 (Francis, 1998) to 49,306 in 2001 (UBE data). Annex II shows a national summary of primary school statistics, 1999-2001.
39
For primary education the gross enrolment ratio (GER) is calculated as the total number of pupils enrolled in Primary One to Six irrespective of age, as a percentage of the population of 6-11 year old children. If the GER exceeds 100%, this indicates enrolment of over-age children as a result of late entry or repetition. It is the most readily available measure of participation. According to FME data, the GER rose from 68% in 1994 but declined to 70% in 1996 nationally for both sexes (FME, 2000). The results of the 1995 and 1999 Multiple Indicator Cluster Surveys (MICS) also show a decline of the GER at that time. Thus the 1999 GER of 81% is lower than the 1995 GER of 84% (FOS/UNICEF, 1995, 1999). It is believed that economic downturn, unfavourable political climate and poor financing occasioned this decline in GER between 1993 and 1996. With that trend, it was not surprising that Nigeria did not achieve the Jomtien EFA goals for 2000. The FME baseline enrolment data, covering both public and private schools, and recent population projections, give national GERs of 94.5% for 2000 and 93.1% for 2001 (see Annex III). But the data for most states are inconsistent with those of the 1999 MICS survey (see Annex IV). Another problem is that the breakdown of the enrolments for 2000 and 2001 by public and private sectors has not yet been provided, so that they cannot be compared directly with the EDB data for the 1990s. So the effect of the UBE enrolment drive is not yet clear. The baseline data for 1999-2001 indicate a fairly stable level of enrolment nation-wide, but there are some variations by zone and by gender (see Table 5.1 and Figure 5.1). The net attendance ratio (NAR) is the percentage of children aged 6-11 attending primary school. The 1999 MICS report gives estimates of the NAR, indicating that it was lowest for six year olds (39%) and highest for nine year olds (67%). It finds that the main reason for the low NAR is that children tend to start primary school late (FOS/UNICEF, 1999). This was corroborated by the 1999 Demographic and Health Survey, which found that 43% of children aged 6-10 were not in school (MOH, 1999). The surveys indicate that over three-fifths of Nigerian children do not enter primary school at the official age for Primary One (NPC/UNICEF 2001). The primary school NARs for each gender in Nigeria (61% for boys and 57% for girls) are lower than the averages for Sub-Saharan Africa.
Geographical Variations in Access
There are variations in access to primary education in different states, between genders, and between urban and rural areas. (On trends in gender differences, see Table 5.1.) The 1999 MICS showed that NAR is much higher in the South (e.g. 81% in the South West survey zone) than in the North (e.g. 28% in the North-West zone). Some states in the North, notably Jigawa, Bauchi, Katsina, Sokoto, Kebbi, Yobe have primary schools with less than 25% NAR. In some southern states notably Imo, Anambra, Enugu, Cross-River, a steady decline in NAR was observed from 1993-1996. This disturbing trend led to boys dropping out of school to pick a trade or join apprenticeship. Factors such as economic downturn, low value placed on education, poor funding and poor political climate engineered the decline.
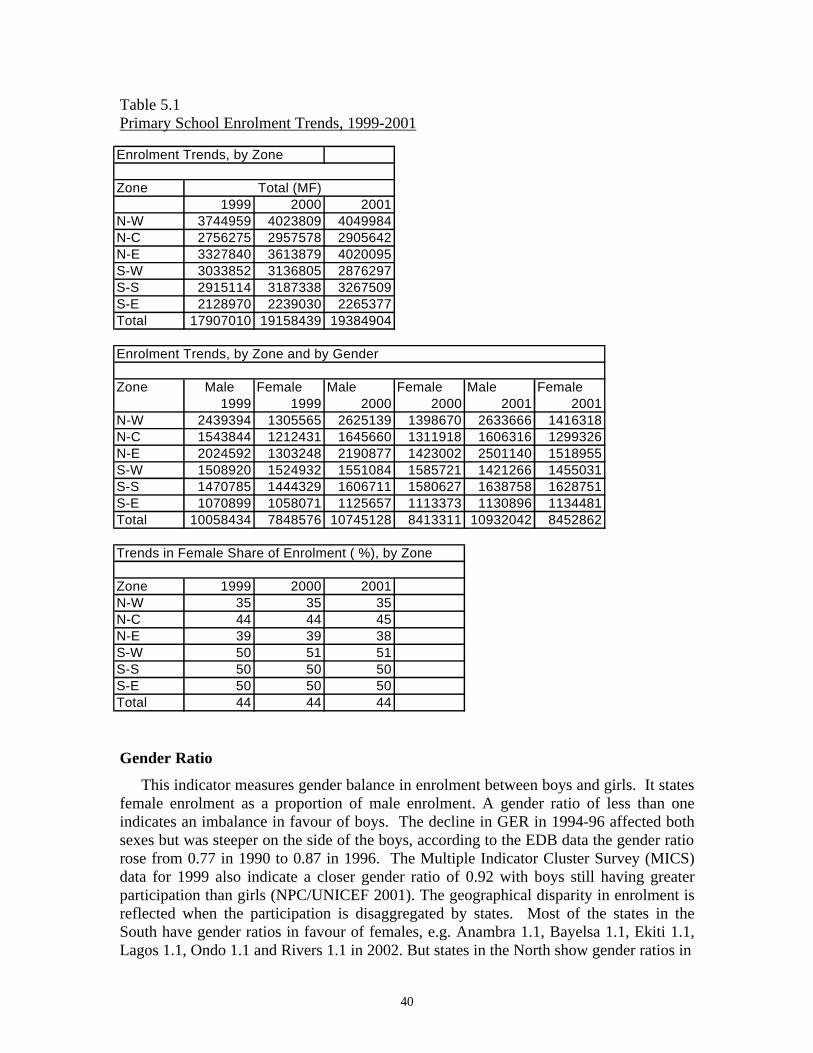
40
Table 5.1 Primary School Enrolment Trends, 1999-2001
Gender Ratio
This indicator measures gender balance in enrolment between boys and girls. It states female enrolment as a proportion of male enrolment. A gender ratio of less than one indicates an imbalance in favour of boys. The decline in GER in 1994-96 affected both sexes but was steeper on the side of the boys, according to the EDB data the gender ratio rose from 0.77 in 1990 to 0.87 in 1996. The Multiple Indicator Cluster Survey (MICS) data for 1999 also indicate a closer gender ratio of 0.92 with boys still having greater participation than girls (NPC/UNICEF 2001). The geographical disparity in enrolment is reflected when the participation is disaggregated by states. Most of the states in the South have gender ratios in favour of females, e.g. Anambra 1.1, Bayelsa 1.1, Ekiti 1.1, Lagos 1.1, Ondo 1.1 and Rivers 1.1 in 2002. But states in the North show gender ratios in
Enrolment Trends, by Zone
Zone1999 2000 2001
N-W 3744959 4023809 4049984N-C 2756275 2957578 2905642N-E 3327840 3613879 4020095S-W 3033852 3136805 2876297S-S 2915114 3187338 3267509S-E 2128970 2239030 2265377Total 17907010 19158439 19384904
Enrolment Trends, by Zone and by Gender
Zone Male Female Male Female Male Female1999 1999 2000 2000 2001 2001
N-W 2439394 1305565 2625139 1398670 2633666 1416318N-C 1543844 1212431 1645660 1311918 1606316 1299326N-E 2024592 1303248 2190877 1423002 2501140 1518955S-W 1508920 1524932 1551084 1585721 1421266 1455031S-S 1470785 1444329 1606711 1580627 1638758 1628751S-E 1070899 1058071 1125657 1113373 1130896 1134481Total 10058434 7848576 10745128 8413311 10932042 8452862
Trends in Female Share of Enrolment ( %), by Zone
Zone 1999 2000 2001N-W 35 35 35N-C 44 44 45N-E 39 39 38S-W 50 51 51S-S 50 50 50S-E 50 50 50Total 44 44 44
Total (MF)
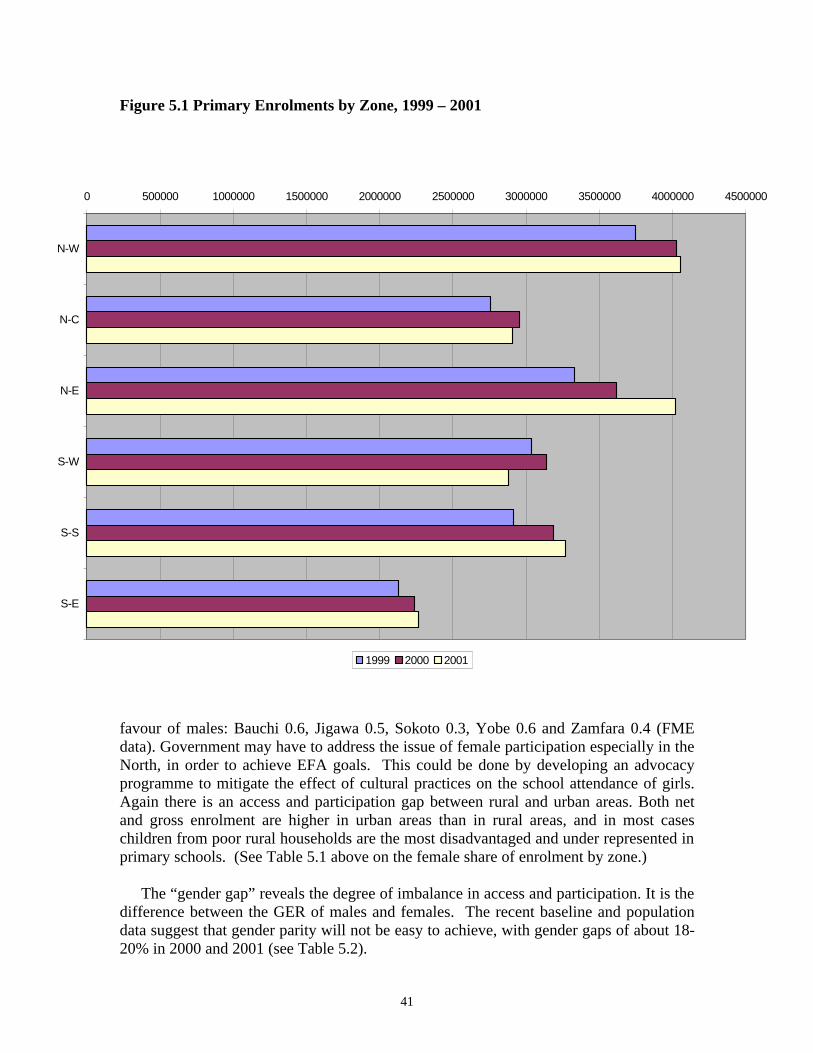
41
Figure 5.1 Primary Enrolments by Zone, 1999 – 2001
favour of males: Bauchi 0.6, Jigawa 0.5, Sokoto 0.3, Yobe 0.6 and Zamfara 0.4 (FME data). Government may have to address the issue of female participation especially in the North, in order to achieve EFA goals. This could be done by developing an advocacy programme to mitigate the effect of cultural practices on the school attendance of girls. Again there is an access and participation gap between rural and urban areas. Both net and gross enrolment are higher in urban areas than in rural areas, and in most cases children from poor rural households are the most disadvantaged and under represented in primary schools. (See Table 5.1 above on the female share of enrolment by zone.) The “gender gap” reveals the degree of imbalance in access and participation. It is the difference between the GER of males and females. The recent baseline and population data suggest that gender parity will not be easy to achieve, with gender gaps of about 18-20% in 2000 and 2001 (see Table 5.2).
0 500000 1000000 1500000 2000000 2500000 3000000 3500000 4000000 4500000
N-W
N-C
N-E
S-W
S-S
S-E
1999 2000 2001
42
Table 5.2 Primary School Gender Gap Year GER males GER females Gender Gap 2000 105.3% 85.2% 20.1% 2001 100.4% 82.6% 17.8% Sources: Based on data from FME and the National Population Commission. Attrition and Completion Rates Information on attrition and completing rates is difficult to obtain because of the paucity of data. The attrition rate is calculated by taking the number of pupils enrolled in a given class in year n+1 as a percentage of the number of pupils enrolled in the preceding class in year n. In 1990-95 attrition rate was highest, at 12%, from Primary One to Two. Children moving from Primary Five to Six also recorded a high attrition rate of 8%. Some pupils may be withdrawn at this stage by their parents to attempt the qualifying examination to secondary school, while others may drop to pick a trade or matrimonial engagements. The apparent completion rate is calculated as the number of children enrolled in Primary Six as a percentage of the number of children in Primary One five years earlier. (A more precise statistic would take account of repeaters, for whom data are not available.) The apparent completion rates for 1998 in Table 5.3 below show the high level of wastage at the primary level in Nigeria, only slightly higher for girls than for boys. Table 5.3 Apparent Completion Rates of Public Primary Education, by Gender, 1998 Gender P1, 1992/93 P6, 1997/98 Apparent Completion Female 1,430,890 868,698 61% Male 1,932,919 1,287,254 67% Total 3,363,809 2,155,952 64% Source: EDB data. The Rate of Transition to Junior Secondary Education Transition is taken to mean movement of students from one education level to another. The rate of transition from the primary to the junior secondary level can be measured roughly as the enrolment of Junior Secondary One (JS1), as a proportion of the previous
43
year’s enrolment in Primary Six (P6). The rate of transition from primary school to junior secondary school is not only low but also was on decline from 1990 to 1995. The transition rate, which was 48% in 1990, declined to 38% in 1997 (EDB data). In fact less than half of the pupils who complete primary education move into junior secondary school. Transition rate is a key indicator for Universal Basic Education. The low transition rate is mainly a result of the poverty of households and the high opportunity cost of junior secondary school attendance. To achieve EFA in 2015, government must improve existing education facilities and teachers’ morale through greater financial commitment to the education sector. (See Table 5.4) Table 5.4 Transition Rate from P6 to JS1, 1990 & 1997 (Public Sector) Year of Transition P6 JS1 Transition Rate 1990 1,606,299 (1989/90) 767,419 (1990/91) 48% 1997 2,042,819 (1996/97) 769,289 (1997/98) 38% Source: EDB data.
Learning Achievement External tests or examinations are intended to provide an objective basis for monitoring students learning achievement at different stages of education. In 1996, a national Monitoring of Learning Achievement (MLA) exercise was first carried out in Nigeria on Primary 4 students. It was a method of determining the amount of learning that takes place in core subjects. The result of MLA showed low achievement levels in three key areas: literacy, numeracy and life-skills. Performance on the literacy test was the lowest of the three, with a mean score of 25%. The national mean for life-skill, was 36.86% while that of Mathematics was 32%. However, all the tests were carried out in the English language, and this made some students with high exposure to English to score higher. The result further showed that students generally tended to perform better on oral tests compared to written tests. While students in private schools achieved higher scores than those in public schools, students in urban schools, scored higher than those in rural schools. As with other indicators, there were considerable differences in achievement levels across the states. As a follow-up action, the UBE conducted a National assessment of learning achievement of primary 5 pupils in English and Mathematics in 2001. The results were astonishingly disturbing, showing again low level of achievement in English, 40% and mathematics, 34%. The results of MLA (low students learning achievement) proved that the internal efficiency is low. It is a reflection of the poor quality of the resources (including the teachers) provided in primary schools. The school environment must be child-friendly and conducive to learning. There must be regularity of teachers’ pay, teacher training on the job and adequacy of instructional/learning materials in all schools. Above all quality must go along with universal access and equity in education and this the government can provide through urgent restructuring of the inspectorate
44
service to be able to carry out regular quality control, capacity building and advisory roles. Teaching and Learning: the Quality of Provision. The primary school curriculum consists of Language, Mathematics, Science, Social Studies, Physical and Health Education, Religious Knowledge and Vocational Subjects. (FRN, 1998). Emphasis is placed on the use of language of the local environment in the first three years as a medium of instruction. A normal class lesson lasts 30 minutes, during which the teacher uses practical demonstration, experimental and exploratory or interactive methods of teaching. Instructional and learning materials such as textbooks, science equipment, chalk and chalkboards and charts are generally inadequate in most rural schools thus making effective delivery of curriculum difficult to achieve. The school environment in most public schools lacks adequate facilities like gender-sensitive toilets, a recreation ground and a source of potable water. Indeed classroom facilities are inadequate. Of the 332,408 classrooms in the 44, 292 primary schools in the country in 1999, the UBE Respond Data showed that only 140,134 are in good condition, leaving 157,819 to be massively rehabilitated. The system will also require additional 285,920 classrooms to be able to accommodate 511,939 streams in different classes. One must recognise the Federal Government’s assistance to states and local governments in the provision of basic infrastructure. It has, for example, contracted the construction of 3,096 three-classroom blocks with toilets, stores and head teachers’ office in the 774 LGAs. The rate of progress is, however, rather slow as only 1,500 have been completed, 1,501 are on-going and 95 units have been abandoned (information from the UBE Commission, 2003). It is yet to be seen what further progress will be made now that the Supreme Court ruling of April 2002 has transferred the construction, renovation and furnishing of UBE classrooms to the states. As at 2001, there were 488,164 teachers in 49,326 primary schools in Nigeria (FME, 2001). The teaching staff are made up of graduates with and without teaching qualifications; holders of the Nigeria Certificate of Education (NCE); Grade II teachers and 20% teachers without teaching qualification. In 1990-96, there was significant improvement in teaching strength with more females than males. As at 2001, the national pupil-teacher ratio had reached 1:40, the maximum specified by the National Policy of Education (FME, 1998). There are disparities in this ratio among the states. The 2001 data show 111 pupils per teacher in Yobe, 44 in Borno, 41 in Jigawa, 52 in Sokoto, 22 in Lagos, 38 in Ondo, 59 in Abia and 68 in Edo. Thus states with the lowest participation rates and lowest girls’ enrolment recorded shortages of teaching staff. The quality of teachers produced for the UBE deserves greater attention. With a total staff strength of 429,098 in public primary schools in 1999, it was estimated that an additional 772,338 teachers would be required for a successful UBE at the universal ratio of 1:40. The on-going Pivotal Teacher Training Programme (PTTP) is a child of this circumstance. The Nigeria Certificate of Education (NCE) was adopted as the minimum qualification for primary school teachers in 1987 and this principle was reaffirmed by the
45
National Policy of 1998. The low qualification of PTTP products will no doubt impact negatively on the quality of UBE output in due course. Supervision and Management There is a command/control structure in the supervision of primary education in the country. Both the State Primary Education Board (SPEB) and the State Ministry of Education are involved in primary school supervision and inspection. At the state level, management of primary education resides with the SPEB while at the local government level, it is managed by the LGEA. Since the introduction of UBE, both SPEB and LGEA are linked with the UBE Commission (UBEC). However, the Supreme Court ruling of April 2002 has relieved the Federal Government of some functions, which are now transferred to the Local Government through the State Primary Education Board (SPEB). They are both overseen by the UBE and Federal Ministry of Education. Specifically, supervision is the main responsibility of the local Government Education Authority (LGEA) and in most cases this is limited to record keeping and the physical aspect of inspection. School supervision is neither a regular nor a sustained activity. Most supervisors have no means of reaching distant schools and only schools close to their offices and houses enjoy frequent supervision. Also schools in the rural areas are visited less frequently than urban schools. The same fate applies to the inspectorate division of the ministry and SPEB. However, teachers’ performance monitoring is carried out at the school level by the head teachers and their assistants. Their role is limited to supervision of lesson plans and schedules of work (Francis; 1998). The current primary school management arrangement between the states and the Local Government Education Authorities (LGEA) needs to be clarified to remove tension, duplication of efforts and wastage of resources. The LGEA should be more empowered with unhindered resources to carry out its statutory functions of supervision, supply and management of schools. In doing this, appropriate measures should be put in place to ensure transparency and accountability of all levels. Community and Private Sector Participation Community and private sector participation in primary education has been related to neglect of public services or low quality of public provisions. Coupled with this is the provision of the National Policy in Education (1998), which allows private individuals and organizations to run nursery and primary schools. Private sector participation in primary education has mushroomed in the last two decades. Participation has involved personal entrepreneurial initiatives or religious or non-governmental organisation efforts in the process of educational development. The schools usually have an adjoining nursery school that feeds pupils into it. They are costlier than public schools, mostly well funded and have more resources per pupil than government schools. The good ones are located in urban or sub-urban centres. Except for a few, the private schools perform well at the national Common Entrance examination into secondary schools. Most of the private schools however, require regular government supervision for the enforcement of
46
standards. Some private sector organisations also contribute 2% of profit after tax to the Education Tax Fund (ETF). Recently, government introduced an innovation of allocating substantial funds for community self-help projects for school improvement. This is to increase community involvement in school management and hold schools accountable to parents and pupils. The World Bank has supported this effort since 1992. Ever since the 1980s, it has been common for local communities, normally working through parent-teacher associations, to provide financial assistance in the form of classroom construction, supply of furniture and equipment and provision of scholarships. They also assist in promoting enrolment and attendance in primary schools.
Nigeria’s Situation in the International Context Since the advent of democratic government, Nigeria has received a number of international supports in her bid to achieve the goals of Education for All (EFA). Her performance in meeting the internationally set goals has equally been a subject of assessment. Using three of the Dakar goals as indicators – those of universal access to primary education, adult literacy and gender parity – the EFA Global Monitoring Report 2002 has ranked Nigeria first among the 21 countries at serious risk of not achieving EFA goals with primary education net enrolment ratio (NER) of less than 80%. Secondly, Nigeria is placed among the list of 40 countries at serious risk of not achieving EFA goals with low adult literacy rate of less than 70%. There was no record on gender parity with which to assess the country (EFAGMR, 2002, pp. 91-93). Furthermore, a recent World Bank report (Bruns, Mingat and Rakotomalala, 2003) places Nigeria in the lowest achieving of four groups of developing countries with respect to “EFA success”. This classification, however, is not due to Nigeria’s primary level GER, recorded as 85%, which is fairly typical of the West African region. The indicators which explain Nigeria’s presence in the lowest group are: (1) her completion rate for primary education; (2) her expenditure on education as proportion of current revenues; (3) the share of her educational expenditure devoted to the primary level, and (4) the share of her expenditure on primary education that is devoted to non-teacher inputs. Nigeria is also placed in a group of 15 “IDA countries” whose completion rates for primary education declined during the 1990s (from 71% to 67% in Nigeria’s case). The same source, however, records Nigeria’s recurrent expenditure on primary education as 1.9% of GDP, somewhat above the average for developing countries. It is not possible to comment comparatively on Nigeria’s preparation of EFA plans, since Nigeria did not respond to the survey of such plan conducted by the UNESCO Regional Bureaus at Dakar in April-May 2002 (see Sow and Sossou, 2002). Although Nigeria is working hard to put in place a National EFA Action Plan (NAP) to deliver EFA to her citizens, the various assessments of UBE are disturbing and call for urgent action to achieve the set goals.
47
Nomadic Education: Purpose and Objectives
The National Commission for Nomadic Education (NCNE) is charged with the responsibility of providing relevant and functional education for the nomads via NCNE Act. cap. 243, Laws of the Federal Republic of Nigeria. 1990. Nomadic education is an arm of primary education provided for the pastoral nomads and migrant fishing communities in a formal setting in accordance with their migratory lifestyle. The pastoral nomads with estimated population of 6.5 million and migrant fishing communities numbering about 2.8 million constitute the most educationally disadvantaged groups in the country, with 1989 literacy levels of 0.2% for pastoralists and 2.0% for fishing communities. The pastoral nomads are found in 31 States in different population proportions in the country where vegetation cover can provide adequate fodder for their cattle. The migrant fishing communities, on the other hand, are found in more than 20 states stretching from the shores of the Niger Delta to the valleys of Adamawa river. The former group provide 90% of the nation’s beef requirements and the latter are responsible for 95% of the fish caught and sold for consumption nationwide. The objectives of nomadic education are derived from the NPE (1998). In specific terms, they include the acquisition of functional literacy and numeracy as well as knowledge and skills to empower the nomads to improve their income earnings. The inculcation of the spirit of humility, sense of belonging and appreciation of moral and religious practices are also cardinal among the objectives. Above all, nomadic education must specifically stimulate and equip the recipients with scientific and analytical modes of thinking to achieve all- round development. Nomadic Education: Access, Curriculum and Problems.
Out of the estimated population of 10 million nomads in the country, about 3.6 million are children of school age. Access to nomadic education has been hampered by a number of factors, notably; a lifestyle of constant migration in search of water, pasture and fish; curriculum irrelevance to the needs, interests and problems of the nomads; the centrality of “child labour” to the production system; and environmental physical barriers to settlement. Nevertheless, the number of pupils enrolled in 1999 for nomadic primary schools is 163,361 in 1369 primary schools. By 2002, the enrolment figure increased to 226,944 pupils in 1,680 nomadic schools, an increase of over 25% in enrolment of which 1,307 are pastorals schools (NCNE, 2002). Since vegetation cover and terrain dictate the pattern of migration, states with lush cover and states with high percentage of Fulani pastoralists recorded high incidence of pupil enrolment e.g. Plateau, Katsina and Adamawa. Other states like Ogun, Ondo, Abia, Anambra and Enugu recorded low enrolment. Among the migrant fishing communities of Rivers, Bayelsa, Akwa-Ibom, Edo, Delta, Ondo and Ogun a total of 169,221 children were enrolled in 301 schools with a teacher population of 3,782 in year 2000, (Tawari, 2002). This is a marked improvement on the 1999 enrolment figure of 40,806 children, an increase of over 400%. There are two types of curriculum used in nomadic schools: the national curriculum and the nomadic curriculum, which reflect the nomadic culture. Nomadic schools are of three types, the fixed/permanent structures, the temporary and the mobile collapsible. The majority of the schools are fixed and they operate the normal five school days a week.
48
The schools open from 7.00am to 12.30p.m. to provide time for herding by the boys and selling of milk and other domestic work by the girls. The pastoral nomadic curriculum consists of the eight subjects taught in normal schools but is lacking in animal husbandry and farming techniques. There are 4,907 teachers to 203,845 pupils, giving a pupil-teacher ratio of 1:42. Of the 4907 teachers, 11.2% are NCE, 41% are Grade II while the remaining are unqualified and upgraded teachers. Nomadic teacher training is undertaken at universities of Maiduguri, Port-Harcourt and the Federal College of Education, Yola. The Usman Danfodiyo University produces curriculum materials used for teaching/learning, while the Universities of Jos and Port Harcourt do further research on nomadic education. Schools in the migrant fishing communities are mostly of temporary structures located in areas with 75% flood. There are a few permanent ones. There are also boat schools with classroom facilities and toilets. The boat goes from one fishing port to another picking nomadic pupils to a safe place and teaching them there. The migrant schools open from 8.00a.m to 2.00p.m and operate the four core subject areas of the national curriculum. A fault with the curriculum is that it does not contain subjects like swimming and fishing relevant to the life of the migrant fishing communities. NCNE has however embarked on curriculum enrichment to suit the educational needs of nomads. There are 3,782 teachers to 169,221 pupils, thus giving a pupil-teacher ratio of 1:45. As result of an intensive teacher development programme, the number of qualified teachers has increased from 486 in 1990 to 3,139 in 2002 (NCNE 2003). School programmes are affected during the peak fishing periods of October/November when pupils are hardly in school. The standard of instruction in nomadic schools is moderately high and encouraging, even though the schools lacked adequate instructional materials and furniture. Between 1992 and 2002, 60,212 nomadic children successfully completed primary education and 21,032 of this figure gained admissions to various secondary schools (NCNE, 2002).
Nomadic education as a component of UBE deserves greater attention in order to achieve EFA goals by 2015. Action should be giving to the provision of more permanent classroom structures, instructional materials and curriculum relevance. Also government should provide adequate financial support and well motivated teaching force for the nomadic education programme.
Special Education
Special education is the education given to children with special needs and the NPE (1998) recognises two categories of children with special needs. There are those with learning difficulties as a result of different kinds of handicaps and are unable to cope with routine class organisation and methods. The second category consists of the specially gifted and talented, who find themselves insufficiently challenged by the regular school programmes. Each category is expected to benefit from free education at all levels while government provides all necessary facilities to ensure access to education.
49
The objectives of special education derived from the National Policy of Education are to: (1) emphasise special provision for the disabled in regular schools, (2) provide functional literacy as well as technical and vocational skills that will enable the disabled to earn a sustainable living, and (3) provide opportunities for the exceptionally gifted children to develop at their own pace in the interest of the nation’s economic and technological development (NPE, 1981). Special Education: Access, Curriculum and Problems There is no current data on the number and calibre of disabled persons now in homes and centres, or the number enrolled in various forms of institutions across the country. In 1975, a survey of special education facilities on integration carried out by Ogbue (1981) shows that there were 32% deaf and partially hearing, 23.6% blind and partially sighted, 44.4% physically handicapped and others. There were 1,682 disabled persons in 26 schools, homes and centres, with 450 staff numbers and about 1,989 other disabled in homes. The population of the disabled student rose to 6,021 by 1977, consisting of 731 deaf and partially hearing, 957 blind and partially sighted, 1,658 physically handicapped, and 3075 in homes. In spite of the dearth of current statistics on special education, each state government as a matter of policy runs a special school for the disabled. The Federal Government also established in 1990, a school for the gifted, the Federal Government Academy, Suleja, and provides integrated programmes for the disabled in seven Federal Government Colleges across the country. Government efforts at the tertiary level is seen in the establishment of departments of special education at the Universities of Ibadan, Jos, Calabar, Bayero University Kano and the Institute of Education, University of Nigeria Nsukka. Middle-level teachers training is also carried out at the Federal College of Education (Special) Oyo. It appears that the prevailing institutional arrangements have not translated into positive programmes that would drive the special education forward. Presently, there is no special provision in the UBE programme for mainstreaming the disabled in regular schools. There are equally no adequate data for planning and addressing the provisional needs of the disabled in the country. All this calls for an urgent research to focus on the extent to which disabled persons can benefit from the UBE programme. Further research should also deal into the integration of the disabled into the world of work. Achievements and Constraints in Primary Education There has been an improvement in the number and enhancement in the professional development of teachers. This has led to the production of 30,000 NCE teachers and 42,000 auxiliary teachers through the PTTP of the National Teachers Institute (UBE 2001). An enrolment drive was carried out to enhance the access, retention and participation of girls, the marginalised and the unreached. This is in addition to the formation of 94 radio programme listening groups to promote nomadic participation in
50
basic education. Across the country, work has been completed by the UBE Commission on the construction of 1,500 three-classroom blocks with head teachers’ offices, stores and VIP toilets. Within the last two years, 148 Child Friendly Schools have been established. In the face of these achievements, cultural factors have continued to retard female enrolment in the North. There is also an increasing unemployment rate, which reinforces negative perceptions of the relevance and value of education provision. The school environment still remains unfriendly in most states with poor infrastructure and facilities. Above all, resource allocation to this sector has not matched the vision and scope of primary education in the country.
51
CHAPTER SIX
JUNIOR SECONDARY EDUCATION Scope and Objectives
Junior secondary education is the education received after primary education. It runs for three years as the last segment of the nine-year basic education programme in Nigeria. With the emergence of the NPE (1977), junior secondary education (JSE) was designed to equip citizens with adequate knowledge and skills required for a useful life in the society. As a matter of policy (though not yet in reality), JSE is tuition free, universal and compulsory. The official age for attendance in JSE is 12 to 14. The objective of junior secondary education is to provide all primary school leavers with opportunities for education of a higher level. It is intended to develop in the individual functional skills and capacities for creative and critical thinking that will enable him or her to make appropriate decision, solve problems and carry out practical tasks. JSE has a comprehensive curriculum, both academic and prevocational in content, designed to give a sound general education and opportunities for career choice. Access: General Indicators Access to junior secondary education in Nigeria is far from universal. Less than half of the pupils who complete primary education move to the junior secondary education (FGN, 2000). This is observable from the transition rate from primary to junior secondary level, which declined from 53% in 1992 to 44% in 1995 (NPC/UNICEF 2001). A recent World Bank Secondary Education Survey (2002) identifies various causes of the low transition rate. Firstly, the conduct of the First School Leaving Certificate Examination eliminates about 25% of those who complete primary school, and state entrance examinations for junior secondary education eliminate another 25%. Secondly, non-adherence to the free-education policy by some states also denies a high proportion of primary school leavers entry into junior secondary level. Thirdly, the opportunity cost of attendance to most Nigerian households that live below poverty line is high. Government must address the problem of low enrolment into junior secondary education if it is to meet the objectives of the UBE Programme. Since the launch of the 9-year basic education programme in 1992, the number of junior secondary “schools” in Nigeria has continued to increase, even through majority of school buildings house both junior and senior secondary sections. The public sector enrolment in the JS rose from 2,237,689 in 1992 to 2,727,830 in 1995, but was somewhat lower in 2002, when the total for the public and private sectors was 2,712,106 (Baseline data). The female share of enrolment has remained steady, at 45% in 1992, 47% in 1995 and 44% in 2002 (see Annex VI).
52
The gross intake rate (GIR) is measured as the total number of new entrants enrolled in Junior Secondary One as a percentage of the total population of the official school age of entry (12 years). From 1992 to 1996, the GIR increased from 32% in 1992, to 37% in 1994 and dropped to 28%. Further analysis revealed that states with lower female participation had a lower GIR and vice versa, e.g. Kano, Jigawa, Kebbi and Yobe in 1995. This trend is indicative of male dominance at JS level in the North. Some of the states with a high female GIR in the South are Lagos, Ogun, and Enugu. Nationally, there was no increase in the percentage of boys gaining admission into junior secondary school between 1992 and 1996.
The trend in gross enrolment ratio (GER) in the mid-90s at the junior secondary level reflected the deterioration of the GIR mentioned above. The GER declined from 41% in 1994 to 34% in 1996 nationally (FME 2000). In the North, the GER fell below 20% in several states (e.g. Jigawa, Yobe, Katsina, Sokoto). While the GER for girls was very low in the North because of historical and cultural factors, the GER for boys in the South-East and South-South remained on decline. In such states as Anambra, Edo, Enugu, Rivers and Akwa Ibom, boys are often withdrawn from junior secondary school to engage in apprenticeship and other informal employment. For recent GERs at the national level, see Annex VI.
The completion rate at the junior secondary level is more satisfactory than at the primary level. About four in every five junior secondary pupils succeed in completing this stage of education. From 1989 to 1994, the drop out rate never exceeded 15%. The completion rate is higher for girls than for boys: 83% compared to 79% for boys in 1995 (NPC/UNICEF, 2001). Rate of Transition to the Senior Secondary Level The transition rate between junior secondary and senior secondary education was close to or above 90% for the period 1990-1995, in contrast with the high level of attrition between the primary and junior secondary levels. A streaming process is used in the transition from junior secondary level to senior secondary level and tests of academic ability, aptitude and vocational interest are used to guide the process. The National Policy on Education recommends transition to various destinations in the following proportions: 60% to senior secondary schools; 20% to technical colleges; 10% to vocational training centres, and 10% to apprenticeships. The higher proportion going to senior secondary school (much higher than 60%) is a result of some negative factors in the educational system. Technical and vocational education have low status. The lack of teachers and equipment has turned Introductory Technology, a core subject, into an optional subject in most schools. More generally, the pre-vocational training offered at the junior secondary level is of poor quality in spite of its high cost. All these are problems which government must address in order to make the nation relevant in a technological world.
53
The Curriculum The curriculum at the junior secondary level is both academic and pre-vocational. This is a significant difference. It is designed to generate interest of students in pre-vocational skills early in life. At this level, the National Policy on Education places greater emphasis on science and technology and the acquisition of knowledge and skills. To ensure a solid base for future manpower development the curriculum prescribes a wide range of subjects that must be offered, leading to a variety of courses and career choices at the senior secondary level. Thus every student most offer (a) a minimum of 10 and a maximum of 13 subjects; (b) all subjects in groups A and (c) and at least one subject each from groups B and C. Group A core subjects are: English Language; French; Mathematics; Language of the environment (L1) and one major Nigerian Language other than that of the environment (L2); Integrated science; Social Studies and Citizenship Education; and Introductory technology. Group B pre-vocational electives are: Agriculture; Business studies; Home economics; Local crafts and Computer education. The emphasis of subjects in Group B is to be on practice. Group C, non-vocational electives, are: Religious Knowledge; Physical and Health Education; Fine Art, Music and Arabic. Assessment of learning achievement is done by the use of continuous assessment, which has four elements: regular class tests; class assignments; take-home assignments, and project, all weighted 30%. The terminal examination is weighted 70%. The Junior Secondary School Certificate Examination (JSCE) is conducted by states individually for most pupils, while the National Examination Council (NECO) conducts an examination for Federal Government Colleges, private schools and a few states. The curriculum of the junior secondary schools is widely thought to be over-ambitious and over-loaded, yet it has not accommodated crucial emerging issues like HIV/AIDS prevalence or the controversial sexuality education. This curriculum problem is a major one for the success of the UBE programme. Since junior secondary education forms part of basic education, Government will have to reconcile its inclusion in UBE with the breadth of the curriculum, and devise a mechanism for reducing the unit cost at this level in order to guarantee universal access. Management and Supervision Management and supervision of junior secondary education (JSE) is the combined responsibilities of the state and Federal Governments. Both of them have been empowered by the provision of Schedule II Part II of the 1999 constitution of the Federal Republic of Nigeria. A directorate in the Federal Ministry manages the 83 Federal Government Colleges. In the states, public schools are managed either by a state Post-Primary Education Board or by a Teaching Service Commission, or by a School Management Board. The body is responsible for teachers’ recruitment and deployment, remuneration, welfare, discipline and disbursement of funds. Management of private schools is in the hands of the proprietor or Board of Governors. The Board exercises its
54
oversight functions on the school Principal and ensures that the school operates in line with the vision of the founders and directives from the government. Thus far, there is no national body to monitor public secondary schools like the National Council for Colleges of Education (NCCE) or the National Universities Commission (NUC). However, following the Supreme Court ruling of 2002 the mandate of UBE was reconceptualised and the body will now carry out quality assurance activities through the Federal Inspectorate Services for this level. This is in addition to bench-marking and setting of minimum standards for primary education. Students’ involvement in school management at this level is channelled through students’ representative councils (SRCs). An SRC is made up of school prefects and class captains who express their views on the events in the school. In both government and private schools, the Parent-Teacher Association (PTA) supplements the efforts of the managing body in the provision of infrastructure. Achievements and Challenges in Junior Secondary Education Achievements at this level of education include the increase in the enrolment of girls and a substantial increase in the transition to the senior secondary level. However, the issue of low funding, a focus on examinations rather than skills development, and inadequate equipment for introductory technology are major constraints at this level. The transition rate from primary to junior secondary school could be improved through mobilisation and sensitisation drives by the government. In the area of curriculum, government should reconcile curriculum goals with the cost of education and devise a way of providing adequate introductory technology equipment to cater for this core aspect of the curriculum. Embarking on a special enrolment drive using women community leaders, community women politicians and women in tertiary institutions to encourage participation by girls could also reduce the gender imbalance in the northern states. In some areas, provision of boarding facilities for girls will go a long way to encourage female attendance. An improvement of employment opportunities and better welfare packages for the employed would stimulate the interest of boys in the South-East and South-South zones. Most importantly, the unit cost of education to the household at this level should be kept as low as possible. Parents have not seen free education to be completely free. Government will need to commit more financial resources to junior secondary education if is really to form part of the basic education for all.
55
CHAPTER SEVEN
SENIOR SECONDARY EDUCATION
Introduction Secondary education is a comprehensive type of education with a core curriculum, designed to broaden the knowledge and outlook of students who “successfully complete the junior secondary school” (FME, 2000, p.138). On completion of junior secondary school, students are expected to proceed either to senior secondary school, preparatory to entry into tertiary institutions or into vocational or technical training institutions for critical skills acquisition (ESA, 2000, p.6). Education at this level also equips pupils with necessary skills to exit school and find employment (Moja, 2000). Senior secondary schooling is of three years duration and the official age for schooling at this level is 15-17 years. The streaming and certification of students from the junior secondary school are influenced by choice to some extent. However, the pupils’ academic ability, aptitude and vocational interest in the Junior School Certificate Examination (JSCE), determine the placement into the different streams. The streaming is designed to achieve a transition ratio of 60:20:10:10 for the entry of junior secondary leavers into senior secondary schools, technical colleges, vocational training centres and apprenticeship schemes respectively. With regard to “separation”, it was always recognised that junior secondary and senior secondary schooling would in many cases take place under the same roof. The old NPE stated that there should be separation where possible (NPE, 1981, p. 16). The senior secondary education system is well established. Between 1988 and 1991, all states of the federation completed the two 3-year cycles of secondary education. The sixth form system that was in existence before then was phased out. Goals and Objectives The goals of senior secondary education as stipulated in the National Policy on Education are to prepare students for “useful living within the society and for higher education” (FRN, 1998, p. 17). The objectives are to ensure there is a balance between literary and vocational goals as well as inspire students with a desire for self- improvement and achievement in later life. Access and Participation Secondary education has expanded considerably over the past decade. The total number of public secondary schools rose from 6,009 in 1992 to 6,844 in 2002 (an increase of 11.4%). Of these, 102 (1.4%) were federal unity schools in 2002.
56
The national population aged 15-17 years in 1998 was estimated at 6,968,448 (FME, 2000), out of which 22.5% of boys and 20.8% of girls gained admission to SS1. Between 1998 and 2002, enrolment had increased from 1.8m to 2.2m (see Table 7.1). The CEA report (FME, 2000) shows that there was a slight gender disparity in favour of boys. The gender gap in the national gross intake reduced from 2.6% in 1992 to 0.4% in 1996. When the data are disaggregated by states, Lagos had a gross intake ratio of 55% for both males and females between 1992 and 1996, the highest in the country, while Ogun and Oyo States had above 40% for both males and females during the same period (FME, 2000, p.132). However the majority of the states in the North-West and North-East Zones had very low gross intake ratios. For instance Sokoto State registered on the average 6% for boys and 1% for girls within the same period. The highest age for entry into SS1 is 18 years, but the majority age range in 1999 was between 15 and 16 years (MICS, 1999). The national gross enrolment ratios (GERs) for the public senior secondary level were in the range of 32-34% in the mid 1990s (FME, 2000), and somewhat lower (25-27%) in 2000-2002 (see Annex VI). Girls’ enrolment at the senior secondary level has been higher than that for boys in virtually all the southern states, especially in the South-East and South-West, with the highest recorded in Lagos, Edo and Delta States in 2002. The imbalance was also pronounced in Enugu, Anambra and Imo states. On the average, the national gender ratio of 110% was recorded at the senior secondary level between 1992 and 1996 (see Table 7.2 and Figure 7.1). This means that participation at this level was in favour of girls during the period. However in some States in the North there were low gender ratios, Sokoto having 32%, the lowest in the country (FME, 2000, p. 140). Internal Efficiency The majority of students completing junior secondary schools education enter general senior secondary programme. The transition rate between the two tiers of secondary education is about 90% in most years for both males and females (NPC/UNICEF, 2001, p.149). This contrasts with the targets in the National Policy on Education which prescribed a 60% transition of pupils from junior secondary to general senior secondary education. The 60% transition to senior secondary is not being adhered to as most students and parents prefer general senior secondary to technical and vocational schools since the latter are being perceived as dumping grounds for less able students. The critical issue of access within the policy of 60% transition to senior secondary is cause of concern. Places in technical college were not available for as many as 20% of junior secondary graduate earmarked for admission into technical colleges, as there are not enough science and technical colleges (FME, 2000, p. 131).
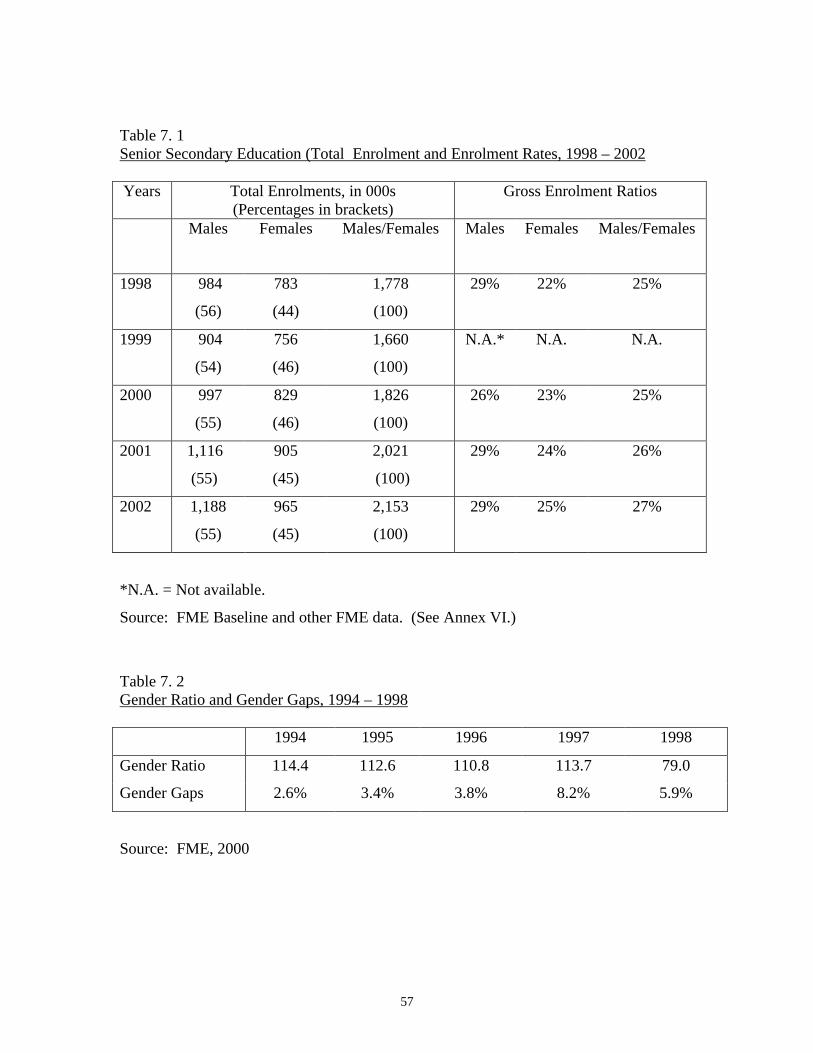
57
Table 7. 1 Senior Secondary Education (Total Enrolment and Enrolment Rates, 1998 – 2002 Years Total Enrolments, in 000s
(Percentages in brackets) Gross Enrolment Ratios
Males Females Males/Females Males Females Males/Females
1998 984
(56)
783
(44)
1,778
(100)
29% 22% 25%
1999 904
(54)
756
(46)
1,660
(100)
N.A.* N.A. N.A.
2000 997
(55)
829
(46)
1,826
(100)
26% 23% 25%
2001 1,116
(55)
905
(45)
2,021
(100)
29% 24% 26%
2002 1,188
(55)
965
(45)
2,153
(100)
29% 25% 27%
*N.A. = Not available.
Source: FME Baseline and other FME data. (See Annex VI.)
Table 7. 2 Gender Ratio and Gender Gaps, 1994 – 1998
1994 1995 1996 1997 1998
Gender Ratio 114.4 112.6 110.8 113.7 79.0
Gender Gaps 2.6% 3.4% 3.8% 8.2% 5.9%
Source: FME, 2000
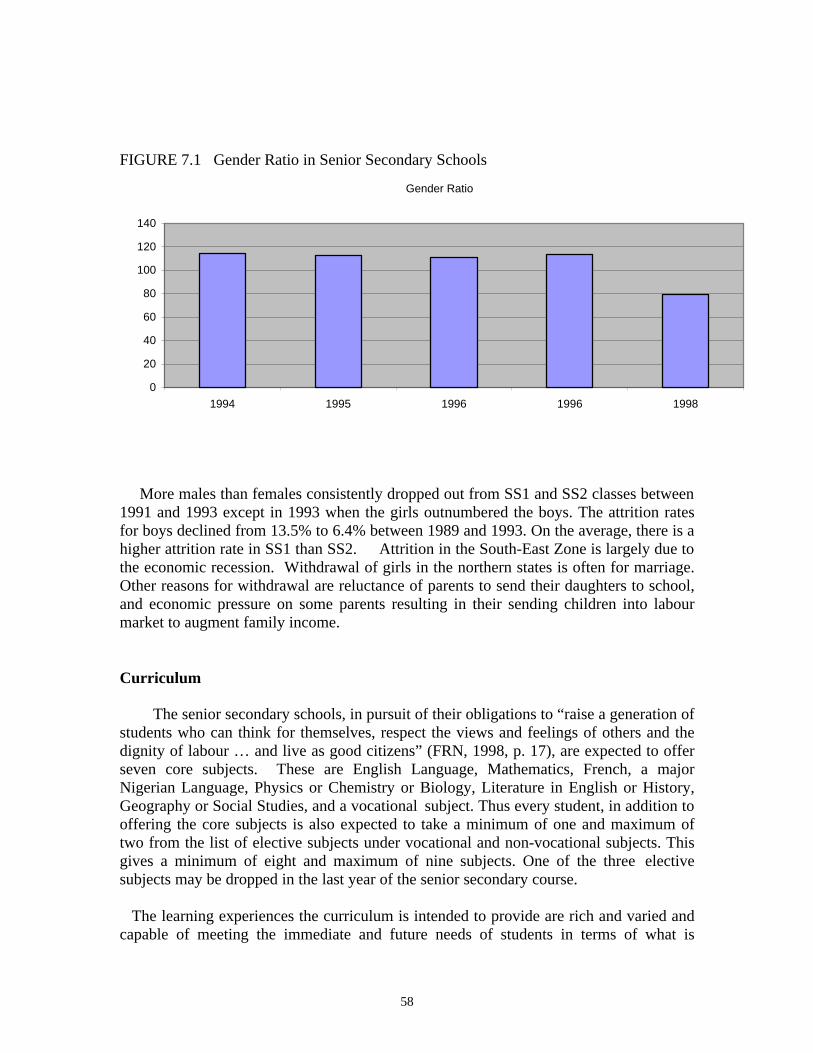
58
FIGURE 7.1 Gender Ratio in Senior Secondary Schools
More males than females consistently dropped out from SS1 and SS2 classes between 1991 and 1993 except in 1993 when the girls outnumbered the boys. The attrition rates for boys declined from 13.5% to 6.4% between 1989 and 1993. On the average, there is a higher attrition rate in SS1 than SS2. Attrition in the South-East Zone is largely due to the economic recession. Withdrawal of girls in the northern states is often for marriage. Other reasons for withdrawal are reluctance of parents to send their daughters to school, and economic pressure on some parents resulting in their sending children into labour market to augment family income. Curriculum The senior secondary schools, in pursuit of their obligations to “raise a generation of students who can think for themselves, respect the views and feelings of others and the dignity of labour … and live as good citizens” (FRN, 1998, p. 17), are expected to offer seven core subjects. These are English Language, Mathematics, French, a major Nigerian Language, Physics or Chemistry or Biology, Literature in English or History, Geography or Social Studies, and a vocational subject. Thus every student, in addition to offering the core subjects is also expected to take a minimum of one and maximum of two from the list of elective subjects under vocational and non-vocational subjects. This gives a minimum of eight and maximum of nine subjects. One of the three elective subjects may be dropped in the last year of the senior secondary course. The learning experiences the curriculum is intended to provide are rich and varied and capable of meeting the immediate and future needs of students in terms of what is
Gender Ratio
0
20
40
60
80
100
120
140
1994 1995 1996 1996 1998
59
prescribed. However, when it comes to implementation, the curriculum of the schools has been criticized for being “over-ambitious, resulting in overload and insufficiently attuned to the needs of the labour market,” particularly in pre-vocational and vocational/ technical courses (NPC/UNICEF, 2001, p. 159). The process of integrating family life education into the secondary school curriculum is almost completed. An integrated curriculum approach has been adopted as opposed to emphasis on single subjects. Implementation of the curriculum indicates that the teachers as implementers failed to understand the underlying approach. Rather, they continued to teach using the old” approach they were accustomed to. The failure in implementation was therefore due to ‘lack of support through rigorous re-training of teachers and continued support during implementation” (Moja, 2000, p. 17). Teaching / Learning The medium of instruction at the senior secondary school is English, the official language in the country. The National Policy on Education (NPE) (1998, p. 44) has prescribed that “there shall not be more than 40 pupils to a class” in secondary schools. The total number of classrooms available in all the secondary schools in 2001 was about 124,229, which resulted in an average of 37 pupils per class (FME Baseline data). It is important to note that over-crowded classrooms have negative impacts on the quality of education received. The staff strength of the senior secondary school cannot be disaggregated from that of the junior secondary school because teaching staff teach at both levels. The national average pupil teacher ratio of 32 is reasonable. In 2002, the average national pupil-teacher was 29.8. The high ratios indicate inadequate staffing, which reduces quality of education offered, while low ratios indication overstaffing – a misallocation of resources. Only teachers with specialisation in the relevant subject area and having Higher National Diploma (HND) with teaching qualification or those possessing University Degree with teaching qualification are considered qualified to teach at the senior secondary level (FME, 2000, p. 146). The NERDC (1997) National Survey of Teacher Supply and Demand in Secondary Schools in attempting to ascertain the number and calibre of teachers required in secondary schools as against supply, came up with the some findings. Only 36.8% of the teachers were qualified to teach English, while 9.5% of those engaged to teach the subject were not qualified. The percentage of senior secondary teachers of any particular subject who were qualified to teach that subject at the senior secondary school level ranged from 11.3 for Arabic to 64.2 for Clothing and Textile. There was no other subject apart from Clothing and Textile where the percentage of teachers qualified to teach it was as high as 48%. The report also stated that only 27.4% of Mathematics teachers were qualified to teach Mathematics to the SSS level. Only the unity schools maintain reasonably high percentages of qualified teachers at the SS level in the sciences, but not in the technical subjects, which they rarely offer (FME, 2000, p. 148). Teacher deficiencies in Mathematics and the sciences help to account for the poor results in these subjects, illustrated by Table 7.3.
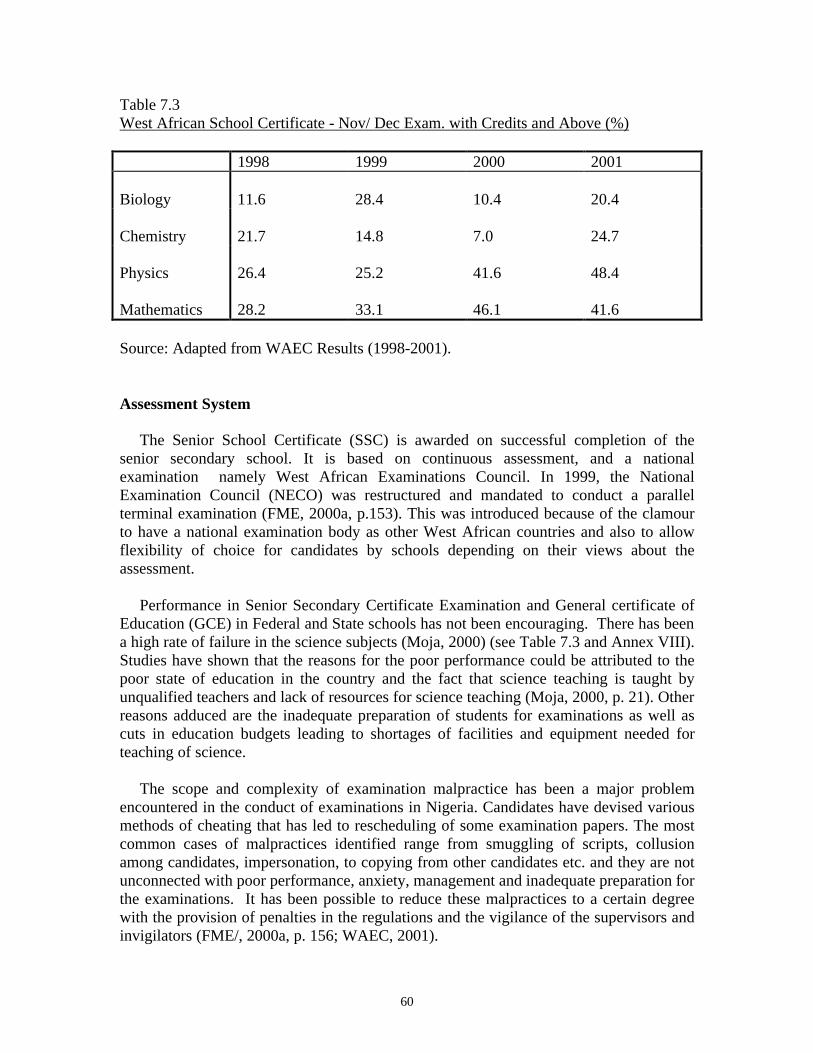
60
Table 7.3 West African School Certificate - Nov/ Dec Exam. with Credits and Above (%) 1998 1999 2000 2001 Biology
11.6
28.4
10.4
20.4
Chemistry
21.7
14.8
7.0
24.7
Physics
26.4
25.2
41.6
48.4
Mathematics
28.2
33.1
46.1
41.6
Source: Adapted from WAEC Results (1998-2001). Assessment System The Senior School Certificate (SSC) is awarded on successful completion of the senior secondary school. It is based on continuous assessment, and a national examination namely West African Examinations Council. In 1999, the National Examination Council (NECO) was restructured and mandated to conduct a parallel terminal examination (FME, 2000a, p.153). This was introduced because of the clamour to have a national examination body as other West African countries and also to allow flexibility of choice for candidates by schools depending on their views about the assessment. Performance in Senior Secondary Certificate Examination and General certificate of Education (GCE) in Federal and State schools has not been encouraging. There has been a high rate of failure in the science subjects (Moja, 2000) (see Table 7.3 and Annex VIII). Studies have shown that the reasons for the poor performance could be attributed to the poor state of education in the country and the fact that science teaching is taught by unqualified teachers and lack of resources for science teaching (Moja, 2000, p. 21). Other reasons adduced are the inadequate preparation of students for examinations as well as cuts in education budgets leading to shortages of facilities and equipment needed for teaching of science. The scope and complexity of examination malpractice has been a major problem encountered in the conduct of examinations in Nigeria. Candidates have devised various methods of cheating that has led to rescheduling of some examination papers. The most common cases of malpractices identified range from smuggling of scripts, collusion among candidates, impersonation, to copying from other candidates etc. and they are not unconnected with poor performance, anxiety, management and inadequate preparation for the examinations. It has been possible to reduce these malpractices to a certain degree with the provision of penalties in the regulations and the vigilance of the supervisors and invigilators (FME/, 2000a, p. 156; WAEC, 2001).
61
The government is in the process of reintroducing the Higher School Certificate Examination (HSCE), as it has been argued that it will provide a more thorough preparation to university and will give a better sift for candidates for university education. In the past, HSCE was perceived as being very demanding, for after the two years duration, candidates were subjected to a terminal examination, which was risky as they ended up failing in most cases. Thus, it was very unpopular and had to be abandoned in favour of other alternatives such as basic studies offered in some universities in the country at that time. It was also seen as a barrier to the expansion of university education. Supervision and Support The Federal Government Colleges are supervised, for quality assurance, by the Federal Inspectorate Services. The State Inspectorate Services, in line with the provisions of the 1999 Constitution, have the mandatory responsibility to inspect their schools, but the Federal Government from time to time exercises inspectorate functions on the state secondary schools. The Federal Inspectorate Services have been plagued by a number of problems over the years. These are “under funding, poor professional skills, lack of mobility, poor staff morale, etc” (FME, 2003). As some states do not have standard inspectorates, there is a lack of systematic quality assurance in the senior secondary schools. Inspections are rare at this level and, when they do occur, are often “of the fire brigade type” (World Bank, 2002, p. 27). School Management Most states have a Post-primary Education Board or Teaching Service Commission (TESCOM) or Schools Management Board responsible for teacher recruitment, deployment, remuneration, welfare, and discipline and for disbursement of funds to secondary schools. In other states, the functions are performed by the Secondary Education Departments of the Ministry of Education. Unfortunately, there is often rivalry between secondary education boards and departments (World Bank, 2002, p. 27) Boards of governors seem to have disappeared from state government owned secondary schools, but are a strong feature in private schools in recent years. These boards monitor the work of the principal, ensures that the school operates in line with expectations of the proprietors and use their influence to attract assistance to the schools (World Bank, 2002, p. 28). The effectiveness of the PTA according to the World Bank report seems to depend on the ownership of the school and the socio-economic status of the parents. They function in the Federal Government Colleges, the missionary schools and the private sector institutions.
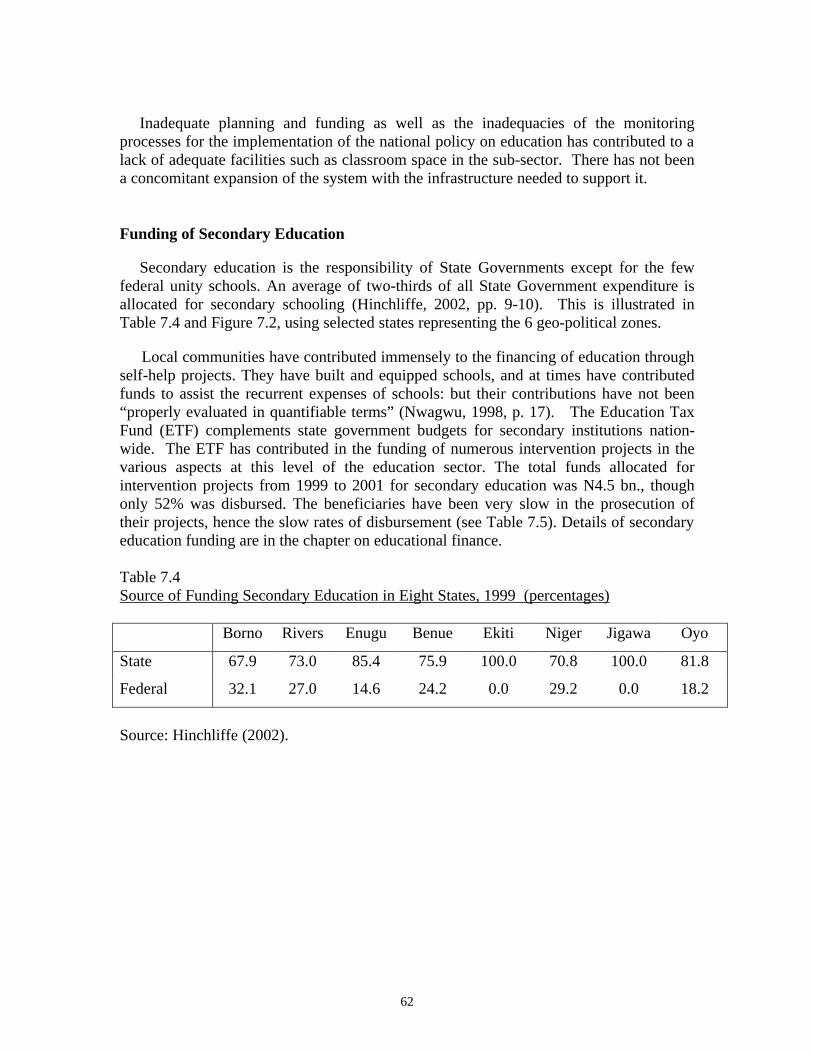
62
Inadequate planning and funding as well as the inadequacies of the monitoring processes for the implementation of the national policy on education has contributed to a lack of adequate facilities such as classroom space in the sub-sector. There has not been a concomitant expansion of the system with the infrastructure needed to support it. Funding of Secondary Education
Secondary education is the responsibility of State Governments except for the few federal unity schools. An average of two-thirds of all State Government expenditure is allocated for secondary schooling (Hinchliffe, 2002, pp. 9-10). This is illustrated in Table 7.4 and Figure 7.2, using selected states representing the 6 geo-political zones.
Local communities have contributed immensely to the financing of education through self-help projects. They have built and equipped schools, and at times have contributed funds to assist the recurrent expenses of schools: but their contributions have not been “properly evaluated in quantifiable terms” (Nwagwu, 1998, p. 17). The Education Tax Fund (ETF) complements state government budgets for secondary institutions nation-wide. The ETF has contributed in the funding of numerous intervention projects in the various aspects at this level of the education sector. The total funds allocated for intervention projects from 1999 to 2001 for secondary education was N4.5 bn., though only 52% was disbursed. The beneficiaries have been very slow in the prosecution of their projects, hence the slow rates of disbursement (see Table 7.5). Details of secondary education funding are in the chapter on educational finance. Table 7.4 Source of Funding Secondary Education in Eight States, 1999 (percentages)
Borno Rivers Enugu Benue Ekiti Niger Jigawa Oyo
State 67.9 73.0 85.4 75.9 100.0 70.8 100.0 81.8
Federal 32.1 27.0 14.6 24.2 0.0 29.2 0.0 18.2
Source: Hinchliffe (2002).
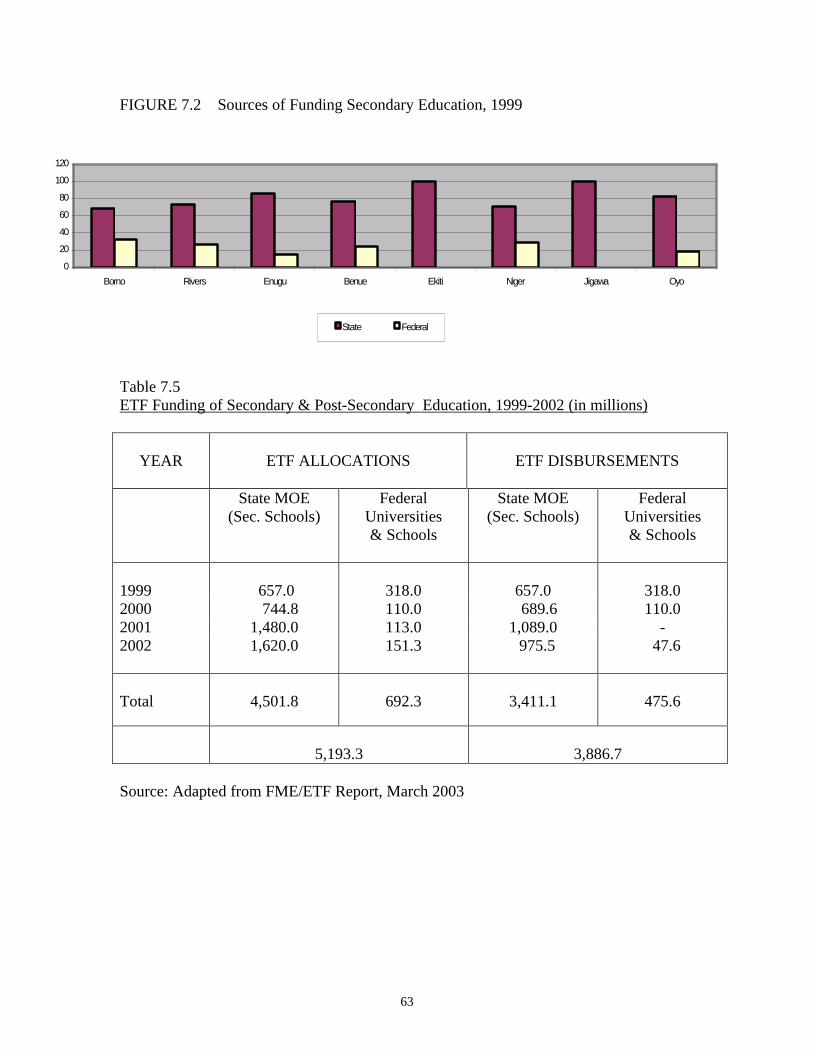
63
FIGURE 7.2 Sources of Funding Secondary Education, 1999
Table 7.5 ETF Funding of Secondary & Post-Secondary Education, 1999-2002 (in millions)
YEAR
ETF ALLOCATIONS
ETF DISBURSEMENTS
State MOE (Sec. Schools)
Federal Universities & Schools
State MOE (Sec. Schools)
Federal Universities & Schools
1999
657.0
318.0
657.0
318.0
2000 744.8 110.0 689.6 110.0 2001 1,480.0 113.0 1,089.0 - 2002
1,620.0 151.3 975.5 47.6
Total
4,501.8
692.3
3,411.1
475.6
5,193.3
3,886.7
Source: Adapted from FME/ETF Report, March 2003
0
20
40
60
80
100
120
Borno Rivers Enugu Benue Ekiti Niger Jigawa Oyo
State Federal
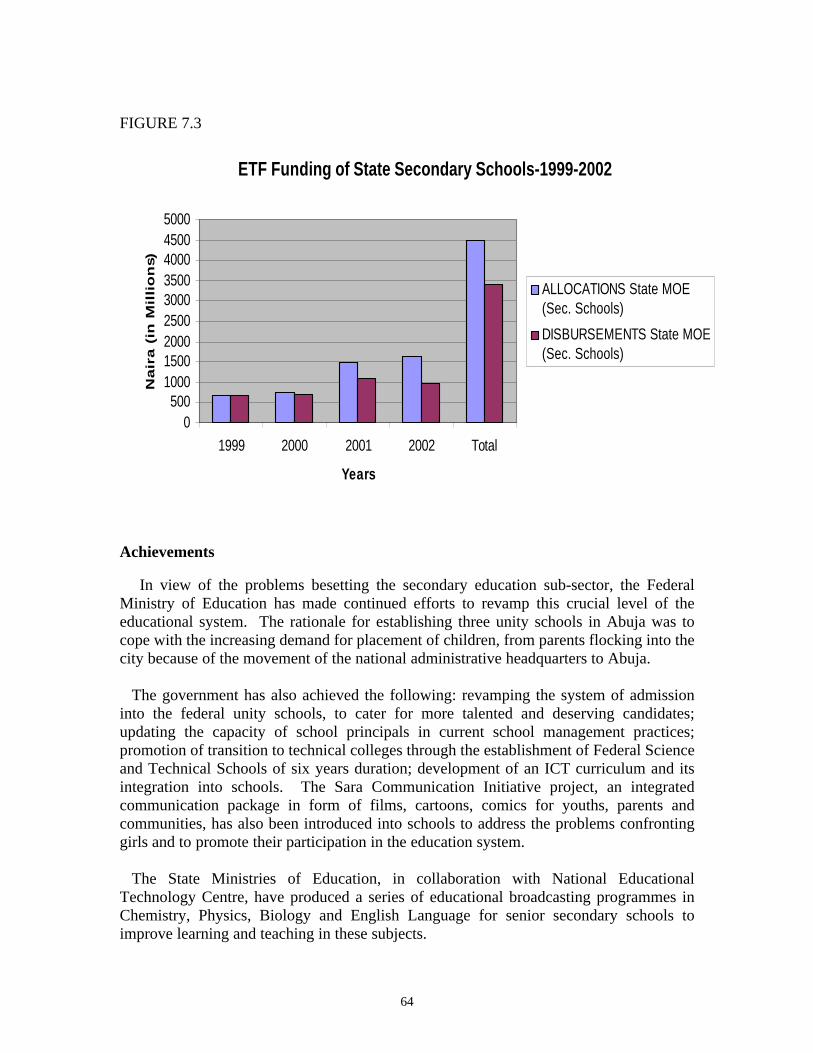
64
FIGURE 7.3 Achievements In view of the problems besetting the secondary education sub-sector, the Federal Ministry of Education has made continued efforts to revamp this crucial level of the educational system. The rationale for establishing three unity schools in Abuja was to cope with the increasing demand for placement of children, from parents flocking into the city because of the movement of the national administrative headquarters to Abuja. The government has also achieved the following: revamping the system of admission into the federal unity schools, to cater for more talented and deserving candidates; updating the capacity of school principals in current school management practices; promotion of transition to technical colleges through the establishment of Federal Science and Technical Schools of six years duration; development of an ICT curriculum and its integration into schools. The Sara Communication Initiative project, an integrated communication package in form of films, cartoons, comics for youths, parents and communities, has also been introduced into schools to address the problems confronting girls and to promote their participation in the education system. The State Ministries of Education, in collaboration with National Educational Technology Centre, have produced a series of educational broadcasting programmes in Chemistry, Physics, Biology and English Language for senior secondary schools to improve learning and teaching in these subjects.
ETF Funding of State Secondary Schools-1999-2002
0500
100015002000250030003500400045005000
1999 2000 2001 2002 Total
Years
Na
ira
(in
Mil
lio
ns)
ALLOCATIONS State MOE(Sec. Schools)
DISBURSEMENTS State MOE(Sec. Schools)
65
Challenges Monitoring of Learning Achievement (MLA) should be carried out at the SSS level. This will assess competencies within specific knowledge domains of a student within the dictates of curricular demands as well as measure the level of pupils’ learning acquisition. It will also analyze the pattern of performance at national and State levels by sector, type of school and gender (FME, 2000a, p. 77). MLA will also reveal the competencies of the teaching staff in handling their various subjects as well as the prevailing environment the child comes from and how it affects performance, which the existing results do not measure. Stimulating demand for senior secondary education is a challenge for the less educationally developed states of the North and South to expand access at the senior secondary level. Thus this should be encouraged as is done in Kano and in Bayelsa by renovating more rural secondary schools, constructing additional classrooms, equipping and furnishing the schools. This will attract students as well teachers to them because of the conducive and enabling environment (World Bank, 2002, p. 14). Training and retraining of various categories of serving teachers who are not fully qualified to teach at the level where they are currently employed to teach is crucial (FME, 2000, p. 157). Diversifying opportunities for senior secondary education is critical, as learners’ needs do vary across time, space, gender, socio-economic conditions, generation, etc. Attention must be paid to the following: “rural, far-flung communities, urban ghettos and the urban poor, girls in all places, boys in some places, adolescents already engaged in economic activities and a wide variety of persons with special learning needs” (World Bank, 2002, p.15). This could be achieved through establishing more technical colleges and vocational centres at the state levels. The curriculum should be enriched to meet the needs of changing times, by emphasising information communication technology and sexuality education especially in the light of the HIV/ AIDS. Emphasis should also be placed on Guidance and Counselling, as reflected in the National Policy on Education, as students at this level need to be guided on career-choices.

66
67
CHAPTER EIGHT
ADULT AND NON-FORMAL EDUCATION
Introduction The National Policy on Education (1998) describes as adult and non-formal, all forms of functional education given to youths and adults outside the formal school system. The aims as specified in the policy are to provide functional literacy and continuing education for adults and youths who have never attended school or did not complete their primary education. The target groups specified in the policy include nomads, migrant fishing families, the disabled and others, and programmes include functional literacy remedial and vocational education. Due largely to the activities of the Nigerian National Council on Adult Education (NNCAE) which was formed by professional adult educators in 1971 to foster the development of adult education, a spate of activities followed to actualize the stipulated goals in the National Policy. For instance, Adult Education sections were established in the Federal Ministry of Education in 1974 and the needs of Adult Education were included in the National Development plans as a result of demands and input from the NNCAE. Perhaps one of the greatest accomplishments of the Council is its recommendation of a ten-year mass literacy campaign between 1982 and 1992. Although not successful, having been crippled by inadequate planning for logistics, this campaign at least taught Nigerians how not to organize a mass literacy campaign. The establishment of the National Commission for Mass Literacy, Adult and Non- Formal Education (NMEC) by Decree 17 of 1990 with very clear mandates in the areas of monitoring, coordination and research on adult education gave a new impetus to adult education activities in Nigeria. State Agencies for Mass Education were also established in the 36 states and Abuja to implement Adult Education programmes. Regarded as part of Nigeria's response to the Jomtien Declaration, NMEC has provided the lead as envisaged in mobilizing support for and participation in mass literacy delivery. This chapter presents the activities and programmes that have gone on in Adult and Non-Formal Education, and documents the responses to emerging challenges in the field since 1999. Concepts and Programmes
Emerging developments have expanded both the scope and target population of adult and non-formal education introducing challenges to which policy must of necessity respond. Regional trends for instance have emerged which call on states to respond to peculiar realities. Adult and non-formal education programmes have therefore had to plan for the boys drop-out syndrome in the South East, low girl-child participation in education in the North and integration of elements of basic education into Quranic
68
schools also in the North. The challenge of equipping these young people with literacy as well as marketable skills is a major one for adult education. At the national level, the low learning achievement being recorded across the country among school children is fast expanding the task of providers and beneficiaries of adult education. Whereas it was easy in the past to assume that length of schooling correlated with literacy attainment, learning achievement tests tell us that it is no longer possible to do so as competencies have dropped drastically (MLA, 1996). With this increase in the number of 'schooled' illiterates as it were, adult education has to cater not only for the education of youths and adults but that of children as well.
In order to cater to the needs of these varied categories of clientele, adult and non- formal education programmes generally on offer are: Basic Literacy; Post-Literacy; Women Education; Functional Literacy; Nomadic Education; Continuing Education; Arabic Integrated Education; Literacy for the Blind; Workers' Education; Vocational Education; Literacy for the Disabled; and Prison Education. These programmes are offered in the various states under the supervision of the State Agencies for Mass Education. Nigeria's Literacy Profile
Literacy is defined as the ability of a person to read and write with understanding, a short simple statement on his or her everyday life. Two major sources provide reliable data concerning the literacy profile of Nigeria. These are the National Population Commission (NPC) Analytical Report (1998) and the Multiple Indicator Cluster Survey (MICS) (1999). The NPC found a literacy level of 57% among Nigerians and showed that 85% of the illiterate population was under 35 years of age. This is the productive age group and the fact that this report was published almost 8 years after it collation (1991) exhibits the information gaps that are apparent. Literacy rates according to urban and rural settings are 90% urban and 62% rural (98% urban male; 79% urban female; 75% rural male; 52% rural female). The MICS data (1999) gives a verdict of "no progress" in reducing either male or female illiteracy and reported deterioration instead from the initial 57% to 49%. For women, the rate declined from 44% to 41% (FGN/UNICEF, 2001). The MICS data shows an adult literacy rate of 55% and 60% for the South West and South East respectively (74% in both zones for males) while the North West and North East record values of 21-22 per cent for females and 40-42 per cent for males. This shows an obvious disparity between the North and the South but criticisms arise when we compare this outcome with our definition of literacy. It is not known whether data collectors asked specifically in which language people could read and write during the data collection exercise. The fact here is that most adults in the North can read and write Arabic but the figures for literacy reflected here may not have captured that fact. This issue has to be properly addressed in order to obtain a clearer picture of the literacy profile across states and regions (FGN/UNICEF, 2001).
69
Nationally, Nigeria's literacy rate of 49% is far below the average of 57% for Sub- Saharan Africa. Some other national examples are Cameroon 72% and Ghana 68% with female literacy also being lower in Nigeria than in the countries mentioned. This is a challenge to adult and non-formal education and needs to be addressed for any meaningful claims to development. The UBE programme clearly tackles this challenge in its blue print. More of these discussions will come up later in this chapter. Access to Adult and Non-Formal Education Programmes
The heightened mobilization efforts of all concerned agencies with the leadership of NMEC and its State Agencies have resulted in a massive awareness and demand for adult education programmes. However, the SAPA document (1993) reports a lack of access to adult education programmes for many adults with as many as 46% of the sampled communities not having access to adult education centres. The document revealed too that even where there is access, participation is restricted on grounds of non-functional programme offerings and other factors including age, unsuitable programme schedule, irrelevant programmes, lack of interest, ill health and husband's refusal among others. The SAPA document concludes that less than 3% of adults have access to adult and non-formal education programmes. This should not be so as consistent mobilization activities have led to the participation of public and private agencies as well as civil society groups in literacy delivery. This seems to be the easiest way of practicalising the “each-one-teach-one-or-fund-the-teaching-of-one” slogan of the NMEC. In areas where NGOs and other civil society groups have set up learning centres, payment of instructors and other problems have derailed the capacity and intentions of the programme. The issue here is that most donor support for literacy delivery does not accommodate the cost of stipend to instructors.
That not withstanding, literacy centres abound in many primary school premises mostly run by state agencies for mass education and NGOs. Churches are also establishing classes for members. Market unions, CBOs and other grassroots associations are also mobilized to establish literacy classes. In the end, these structures seem to be the strongest avenues to explore for taking literacy to the doorstep of everyone (Tahir, 1991). Enrolment in Literacy Programmes
There has been a steady increase in enrolment for adult education from the low 696,367 figure of 1990 and 503,071 of 1991 (SAPA, 1993). The NMEC reports an enrolment figure of 546,256 in 1991 and 1,143,737 in 1996 (consisting of 603,906 males and 539,831 females). Generally, from 1991-1996, the Comprehensive Education Analysis (CEA) observed increase in enrolment by gender from 310,113 for males and 236,143 for females in 1991 to 603,309 for males and 539,831 for females in 1996. The document pointed out the fact that female participation rates in Akwa Ibom, Cross River, Benue, Imo and Abia States were higher than the national female participation rate of 47 %. The NMEC Statistical Digest (2001) published the following enrolment figures for 1997- 2000.
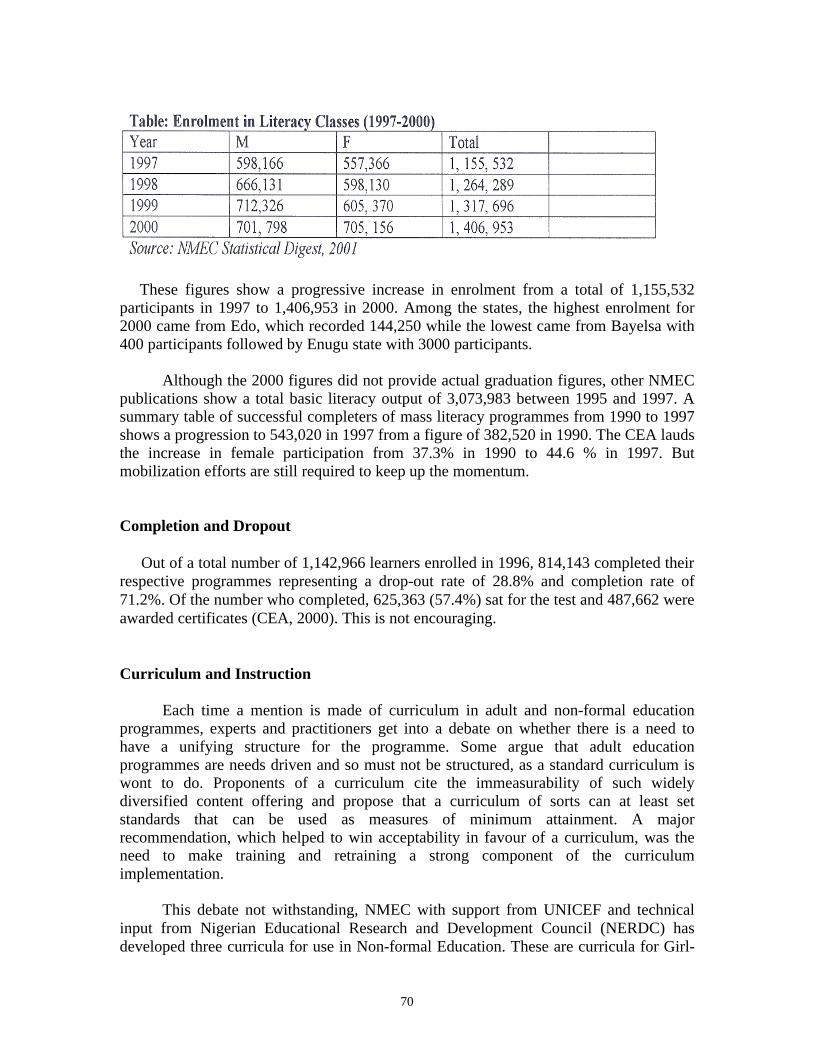
70
These figures show a progressive increase in enrolment from a total of 1,155,532 participants in 1997 to 1,406,953 in 2000. Among the states, the highest enrolment for 2000 came from Edo, which recorded 144,250 while the lowest came from Bayelsa with 400 participants followed by Enugu state with 3000 participants.
Although the 2000 figures did not provide actual graduation figures, other NMEC publications show a total basic literacy output of 3,073,983 between 1995 and 1997. A summary table of successful completers of mass literacy programmes from 1990 to 1997 shows a progression to 543,020 in 1997 from a figure of 382,520 in 1990. The CEA lauds the increase in female participation from 37.3% in 1990 to 44.6 % in 1997. But mobilization efforts are still required to keep up the momentum. Completion and Dropout Out of a total number of 1,142,966 learners enrolled in 1996, 814,143 completed their respective programmes representing a drop-out rate of 28.8% and completion rate of 71.2%. Of the number who completed, 625,363 (57.4%) sat for the test and 487,662 were awarded certificates (CEA, 2000). This is not encouraging. Curriculum and Instruction
Each time a mention is made of curriculum in adult and non-formal education programmes, experts and practitioners get into a debate on whether there is a need to have a unifying structure for the programme. Some argue that adult education programmes are needs driven and so must not be structured, as a standard curriculum is wont to do. Proponents of a curriculum cite the immeasurability of such widely diversified content offering and propose that a curriculum of sorts can at least set standards that can be used as measures of minimum attainment. A major recommendation, which helped to win acceptability in favour of a curriculum, was the need to make training and retraining a strong component of the curriculum implementation.
This debate not withstanding, NMEC with support from UNICEF and technical input from Nigerian Educational Research and Development Council (NERDC) has developed three curricula for use in Non-formal Education. These are curricula for Girl-
71
Child Education, Quranic Schools and Boys Dropout. These curricula, which were developed through wide consultations, are in use in literacy centres around the country. Although the NMEC had planned to document its functionality and acceptance in the field, it has been unable to undertake this exercise owing to funds constraint. It is important to find out how these curricula are being implemented and how responsive they are to the needs of the target groups. Proposals are even now already being considered to review these curricula in order to make them more responsive to emerging local and global information demands.
The Commission has also developed readers and primers for literacy and post-literacy programmes. These reading materials are in circulation among agencies that deliver literacy and are freely distributed to NGOs and other interested organizations. It is not clear, however, the extent to which these materials get to the end users, especially in rural areas. Instructional methods used around these literacy centres are mostly discussion, lecture, drama, and group work. There is, however, a need to train instructors on flexibility in their response to learning situations. Facilities Facilities in use for adult and non-formal learning centres vary according to providers. Understandably, with no minimum specifications in an activity where everyone is encouraged to participate or lend a helping hand, learning centres of all sorts are prevalent in adult education. Classes are held in school buildings, community halls, market places, church buildings, and private compounds and so on. Facilities such as desks, fans and libraries are not always available in these centres. This is discouraging for some learners and reduces participation. Instructors
There are hardly any full-time instructors for adult and non-formal education. They are mostly hired on part-time basis; the turnover rate is quite high. NMEC (2001) reports a figure of 34,692 instructors in 1996 of which 36% were females. A distribution of these instructors by States shows that Benue has the highest number of 2,609 (1,434 males and 1,175 females) while Kano came second with 1,884 instructors (1,413 males and 471 females). Yobe closely followed with 1,852 instructors of which 1,294 were males. A general trend shows more male instructors in the North than females. This has implications for participation of women in adult education programmes in view of the suspicion among men of another male teaching their wives. The need for female role models is also highlighted here, as more women would be allowed to participate if female instructors teach them. Instructor qualification profile ranges from First School Leaving Certificate (for some retired primary school teachers) to Teacher Grade II Certificate, NCE and Graduates with
72
or without teaching experience. The stipend paid to instructors across the states range between N350 and Nl,500. This is poor compared with the kinds of demands made on these instructors and the expectations. Instructors are trained from various sources and by various agencies. Thirteen Government institutions nationwide provide training for instructors. These centres are spread across the regions. Data is not available on the average output of these centres each year but one can assume that the programmes are accessible. However, the mode of sponsorship for participants often determines whether would-be instructors bother to enrol in a programme or not. The development oriented nature of adult and non-formal education makes it a field of interest to many development partners who are willing to get involved in training and retraining of instructors. Apart from formal training programmes, development partners and NGOs sponsor or organize training programmes for instructors. The quality of these programmes, however, may sometimes be difficult to measure. Open Apprenticeship Scheme The National Policy on Education refers to the open apprenticeship scheme under 'Secondary Schools' where it prescribes a 10% transition rate from junior secondary education to the programme. This implies that these young persons must have completed 9 years of compulsory schooling. The Decree establishing the National Directorate of Employment (NDE), however, charges the Directorate with the function of providing apprenticeship programmes for youths and adults in the informal sector. The open apprenticeship scheme is a strong component of the national Poverty Reduction Strategy Programme (PRSP), which receives very strong focus from the Obasanjo administration. Although the national policy prescribes a 10% transition rate into the open apprenticeship scheme, the reality is that pupils leave school after 6 years of schooling or even before and simply drop into the labour market unskilled and illiterate. A negative attitude towards formal education has developed among these young persons as formal schools have simply failed to prepare them for the world of work. They opt to get into apprenticeships at an early age so that they can learn some marketable skills with which to earn a living. They abandon school too early. Emerging as a response to the problem of income-generating skills among school leavers, the NDE has through its National Open Apprenticeship Scheme (NOAS) benefited a total of 589,318 people from 1987 to 1996. For 1997 and 1998, totals of 49,552 and 28,418 were reached. The FGN/UNICEF document describes models of these apprenticeship schemes, where in some cases the apprentice, building on tradition, lives with the master and on certification of competency, gets his or her 'freedom' (p.173). The striking feature of the open apprenticeship scheme is its acceptability to a majority of Nigerians.
73
Milestones
The present administration addressed the challenge of delivering basic education to all age groups in Nigeria as soon as it was sworn into office in 1999. In fact the UBE launch was the first official assignment undertaken by the President with the Lokoja Declaration in August 1999. Two Basic Education Summits were held in succession (1999 and 2000) which all aimed at eliciting dialogue among stakeholders on the problems and challenges of delivering education to all Nigerians wherever they may be. In order to make literacy more relevant and responsive to community needs, the NMEC had adopted the REFLECT approach to adult literacy and has successfully completed programmes in Tomaro, an island community in Lagos state and Kpaduma, another community in the Federal Capital Territory. ActionAid who are the originators of this programme are involved in using the process in the North and are also training more officers in the use of the methodology. The Regenerated Freirean Literacy through Empowering Community Techniques (REFLECT) is ActionAid's contribution to literacy and community development in Nigeria. The REFLECT methodology applies the use of participatory techniques that help to generate discussions and analysis on critical issues that are of concern to the community. The methodology holds a lot of prospects for community participation in adult education and development (Akinyemi, 2003). The British Council has also sponsored a community education programme, which ran for five years between 1997 and 2002. The programme consisted of four projects, which were designed to improve primary schools; adult education centres and build community capacity to manage educational development. The result brought about a degree of community mobilization that according to the reports exceeded expectations while building up along the line, the capacity of Nigerian trainers and consultants (British Council, 2002). This project is worth replicating for its capacity-building component. The government through the National Commission has continued to make reading and writing materials available to learners. The Commission has purchased and distributed 1,460,000 pencils and erasers, 51,600 blackboard dusters, 740,000 exercise books and 78,000 packets of chalk to literacy centres across the country through State Agencies for Mass Education and NGOs. Reading material in Hausa, Igbo, Yoruba and English Languages have been purchased and distributed as follow: Hausa, 300,000; Igbo, 150,000; Yoruba, 94,000; English (Basic and Post-Literacy) 45,000 and 75,000 respectively; Igala, 33,000; and Tiv, 10,000. A total of 3,870 blackboards, 35,000 registers, 126,000 training manuals, 6 computers, 1 photocopier, 4,000 writing aids, 800 sewing machines and 20,000 posters for mobilization have all been distributed appropriately. In the area of capacity-building, a number of persons have been trained in proposal writing, financial and management skills. Training has been replicated on REFLECT and the UNICEF-supported CAP-MM strategy of community development. The Commission has also developed a memorandum of understanding as part of the on-going FGN/UNESCO cooperation for improving community education literacy using the radio.
74
The Funding Challenge A major challenge for adult and non-formal education delivery is the payment of instructors. Most programmes that fail are caused by this lapse. If a strong structure is put in place for instructor remuneration, it is certain that there will be a consistent presence of someone in each learning centre to at least follow up on learners.
75
CHAPTER NINE
ISLAMIC EDUCATION Historical Background The Islamic Education tradition with Arabic as the medium of instruction dates back centuries before the introduction of Christianity and western education. Penetrating first the Northern parts of Nigeria as early as the first century of the second millennium, Islam through the activities of the growing trade across the Sahara, soon grew strong enough in Nigeria to move the capital of the Muslim Empire of Karnem-Bornu from Chad where it originally was to the North East of Nigeria. Islam has as a result spread across Northern Nigeria and the Middle Belt to the South-Western states, where by the 18th and 19th centuries the religion had already made converts. A study of Islamic education must of necessity be tied closely to the growth and spread of Islamic religion across the country. This connection is perhaps strongly rooted in the injunction of the Qur'an that every Muslim is obligated to use prescribed portions of the Arabic text of the Holy Book in his five daily prayers. The injunction in the Qur'an for every believer to "Read: In the name of the Lord who created" (Qu'ran, 96: 11) seems to be a mandate for every Muslim to read albeit in Arabic. Thus, Muslim teachers spread the faith and encouraged converts to acquire Arabic literacy. The importance of Arabic to Islamic education was seen to go far beyond the religious role it played. The FGN/UNICEF document states the fact that
In time, many of {the} traders and scholars became scribes to non-literate local chiefs and rulers... {and so} local events and history began to be documented in the Arabic language, in various northern states, from the old Karnem-Bornu empire in the Sokoto caliphate in the 19th century (spreading into Yorubaland and remaining alive until the 1930s (p. 151).
The Arabic language enjoyed a pride of place in Islamic education. This situation led scholars to regard the period between the establishment of the Sokoto caliphate by the Fulani Jihadists in 1804 and the collapse of that state as a result of British incursion in 1903, as the golden age of the Arabic Language in Northern Nigeria (FGN/UNICEF, 2001: 151). With that era, competence in Arabic was a pre-requisite for appointment (administrative and judicial). Thus, literacy in Arabic was the way to go and educational provision targeted that competence. This remained the case until the British began to subtly introduce the English Language to replace Arabic in the administration of the North and set up educational institution with English as the medium of instruction. The fact that these institutions were better funded than the traditional Islamic type indicated where the control and preference lay so in 1947, it came as no surprise that the Hausa Language rather than the Arabic was named the medium of instruction and in 1954 the McPherson constitution made the English Language the official language of the country.
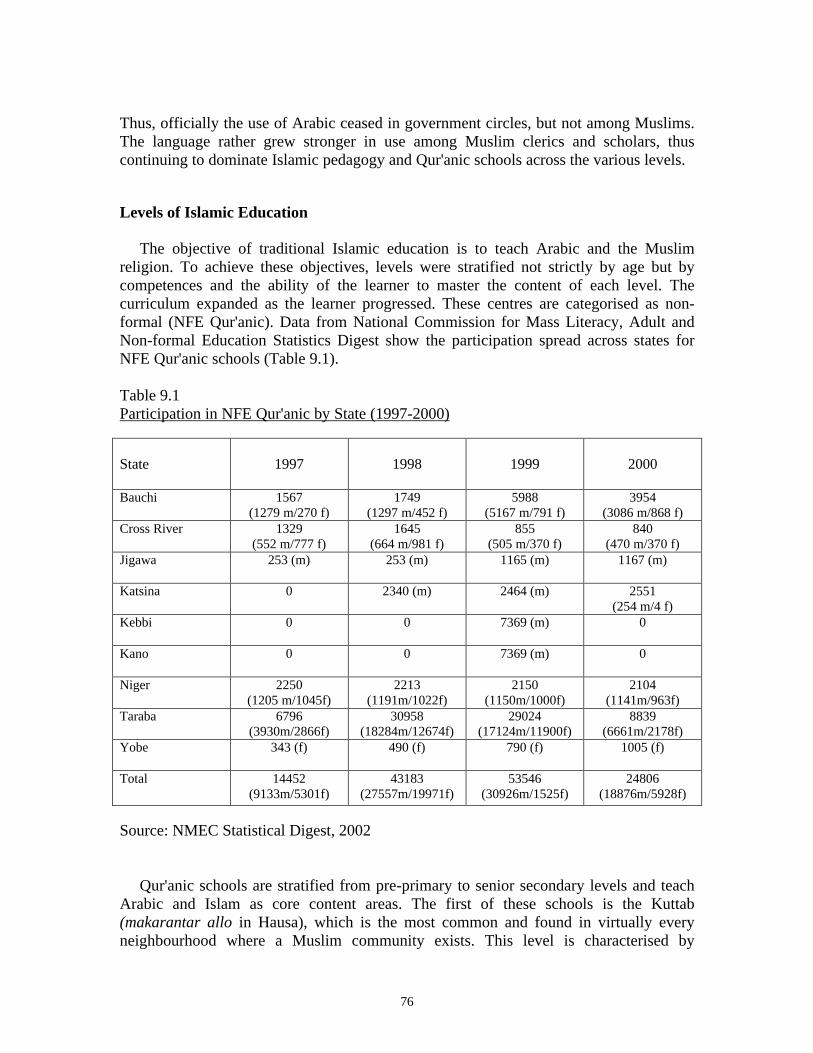
76
Thus, officially the use of Arabic ceased in government circles, but not among Muslims. The language rather grew stronger in use among Muslim clerics and scholars, thus continuing to dominate Islamic pedagogy and Qur'anic schools across the various levels. Levels of Islamic Education The objective of traditional Islamic education is to teach Arabic and the Muslim religion. To achieve these objectives, levels were stratified not strictly by age but by competences and the ability of the learner to master the content of each level. The curriculum expanded as the learner progressed. These centres are categorised as non- formal (NFE Qur'anic). Data from National Commission for Mass Literacy, Adult and Non-formal Education Statistics Digest show the participation spread across states for NFE Qur'anic schools (Table 9.1). Table 9.1 Participation in NFE Qur'anic by State (1997-2000) State
1997
1998
1999
2000
Bauchi 1567
(1279 m/270 f) 1749
(1297 m/452 f) 5988
(5167 m/791 f) 3954
(3086 m/868 f) Cross River 1329
(552 m/777 f) 1645
(664 m/981 f) 855
(505 m/370 f) 840
(470 m/370 f) Jigawa 253 (m) 253 (m) 1165 (m) 1167 (m)
Katsina 0 2340 (m) 2464 (m) 2551
(254 m/4 f) Kebbi 0 0 7369 (m) 0
Kano 0 0 7369 (m) 0
Niger 2250
(1205 m/1045f) 2213
(1191m/1022f) 2150
(1150m/1000f) 2104
(1141m/963f) Taraba 6796
(3930m/2866f) 30958
(18284m/12674f) 29024
(17124m/11900f) 8839
(6661m/2178f) Yobe 343 (f) 490 (f) 790 (f) 1005 (f)
Total 14452
(9133m/5301f) 43183
(27557m/19971f) 53546
(30926m/1525f) 24806
(18876m/5928f) Source: NMEC Statistical Digest, 2002 Qur'anic schools are stratified from pre-primary to senior secondary levels and teach Arabic and Islam as core content areas. The first of these schools is the Kuttab (makarantar allo in Hausa), which is the most common and found in virtually every neighbourhood where a Muslim community exists. This level is characterised by
77
personalised instruction usually by rote/choral in classes manned by a local mallam within the premises of a mosque, inside the courtyard of a private house or under a tree. The curriculum component includes reading and counting but does not include the meaning of the words read or written. Usually the age mix of four to ten years or more (depending on when the pupil has learned to recite the Qur'an is found in these centres. The next stage in the traditional Islamic education system is the Illimiyyah Arabic School (makarantar ilmi). Usually for older children the curriculum is wider. Learners are at this stage introduced to the branches of Islamic studies such as Quranic exegesis, prophetic traditions, Islamic jurisprudence and different branches of Arabic studies including grammar, rhetoric and literature. These subjects are taught in Arabic thus enabling the learners to acquire a heightened mastery of and confidence in the language. As concerns began to be expressed about the ability of learners who have passed through this system to be integrated into the formal western system of education, Muslims on their side became more determined to maintain their own identity. Perhaps these concerns at integration led to the introduction of other subjects regarded as secular into these traditional Islamic schools. Subjects thus introduced included English language, mathematics, geography and elementary science. Government also took steps to make this integration by establishing structure for Arabic education. This somewhat invigorated interest in Islamic education among Muslims led to the emergence of Islamiyya schools. These schools are part of efforts to integrate with the public educational system without losing the essence of the original objectives of traditional Islamiya schools. Championed by the Tijaniyyah Brotherhood in Kano and supported by the Quadiryyah and the Ahmadiyya societies, these schools offer Quranic education from the primary level (libitida) through junior secondary (I'dadi) to upper secondary level (thanaui or tairjihi) with Arabic remaining the medium of instruction. Secular subjects such as mathematics, economics and geography are also taught. The figures show female bias in the primary while the teaching force shows an opposite skew to males rather than females. This may perhaps be contributory to the reason for low girl-child participation in schools. At the tertiary level, government efforts at integration are more visible with the establishment in the 1930s of a structure for Arabic education, which began with Arabic schools at the lower level and with the Arabic Teachers College. Such a school was set up in Kano for Quranic teachers and pupil-teachers to improve their academic standard in Arabic and Islamic studies. The school initially ran a curriculum of four-year certificate course with Arabic as the medium of instruction and did not include English language or any secular subject. The curriculum was later reviewed in 1965 to include business, English, elementary arithmetic, general knowledge and methodology of teaching Arabic and Islamic Studies. Today, modern Arabic private schools are established and run by Muslims. At present, diploma courses are being designed for Higher Islamic Studies (HIS) Certificate holders. This culminates in a three-year diploma course in Shar'iah or Arabic, islamic studies and Hausa and qualifies candidates for entry into the university for first-
78
degree courses. The Bayero University, Kano and Ahmadu Bello University, Zaria at present run these courses. A crop of highly-educated Nigerians is springing up who are versed in Arabic studies and are publishing in the language as well. Government inclusion of Arabic in the National Policy on Education as one of the languages to be taught in schools added impetus to these developments. The Challenge of Integration Integration of the traditional and western education has remained a challenge beginning with the difficulty of classifying traditional Islamic schools. Even when the categorization is made, integration is still not easily accomplished. On the one hand, the mallams and parents distrust western education while on the other hand, little is known among non-Muslim circles of what the mallam actually teaches. Islamic education is thought to be all non-formal but the explanation given here shows that a level of formalisation exists as the pupil advances. Fears are often expressed by the mallams and other concerned muslims that integration would lead to a reduction of the curriculum content of the traditional Islamic education. This they adjudge would lead to a derailment from the original objectives these schools. Be that as it may, the attempts at integration have resulted (in the non-formal sector) in the development of a curriculum on Quranic Education, which successfully infused elements of basic education into Islamic education. There have also since emerged successful models of integration. The FGN/UNICEF document (2001:153) documents the Nizzamiya schools in Sokoto. According to the document, the Government began actual integration of the two systems in 1955 with the first Nizzamiya (integrated) school. The purpose of this school was to allay the fears of parents that their children would lose the essence of Islamic religion if the 'western' element was introduced. To guide the integration process, most governments in the North established Arabic and Islamic Education Boards with the responsibility for coordinating and giving guidelines for integrating the two systems. Thus four integrated secondary schools came into existence in Sokoto (two girls, two boys) and Qur'anic nursery classes have also been attached to some of the schools where children aged 4-5 are taught Qur'anic Education moving on to Primary One after one year. The media of instruction in Nizzamiya primary schools are English and Arabic with Arabic and Islamic religious studies enjoying high status. The schools using the Muslim calendar operate from Saturday to Wednesday with Thursday and Friday as work free. In terms of enrolment, retention and graduation, the FGN/UNICEF document reports a fruitful outcome of integration especially in rural communities where acceptance of the system is said to be very high. According to the report, at least one Nizzamiya School at
79
present exists in each of the 23 LGAs in Sokoto state, totaling 28 across the state, and parents prefer the schools to conventional ones. Milestones Islamic education, as the foregoing discussion shows, is a highly sophisticated system of education. The religious angle places the system at a level where internal efficiency according to its aims and objectives is relatively high in the sense that children are motivated to learn and the teachers motivated to teach. A major challenge has been to bridge the gap between this system of education and the western system. Solutions were sought and found in the integration attempts from which in the past five years, concrete outputs have emerged. At the formal school level, the successful inclusion of secular subjects in the curriculum of the Islamiya schools is a positive development. This infusion has not been very successful in the traditional Quranic school sector. A series of advocacy and sensitisation visits however, resulted in a partial endorsement of a non-formal integrated curriculum by the mallam proprietors of Quranic schools covering life-skills, mathematics, social studies and English language. This curriculum was developed between the National Commission for Mass Literacy, Adult and Non-Formal Education (NMEC) and UNICEF with technical inputs from NERDC. The document has been presented at JCC Plenary and found acceptable. Although studies are not yet available as to its use in the field, the huge participation of stakeholders in the development and at the various critique meetings has given the document a broad chance of acceptability. The work being done at Arewa House, Kaduna through the Northern Education Research Project is a very important milestone. In their Agenda for Action drawn up and formally presented in a forum with His Excellency, the Vice-President of Nigeria, Alhaji Atiku Abubakar as Chief Guest of Honour, the issues of integration were reflected. Part of action that must be taken in 2002-2005 is to “encourage the establishment of more Islamiya schools that would integrate Islamic education and western education; and gradually transform Qur'anic Schools into Islamiya Schools” (Northern Education Project, 2000, p.25). A serious challenge to the education sector, however, is to address the situation of the 'almajirai' who are really children placed under the tutelage of mallams. The Quranic injunction that they and their master should depend on alms from well meaning persons has been influenced by negative modern trends. These children now wander the streets at will, with no control and no skills to become self-reliant ultimately. Many non- governmental organisations (NGOs) are involved in addressing this phenomenon. Success is still very limited as shown by observations in large cities in Northern Nigeria. The problem of these children must be addressed by a careful distinction between religious injunction and a social problem. The mallams will be helpful in this dialogue.

80
81
CHAPTER TEN
TECHNOLOGY AND SCIENCE EDUCATION Concept, Purpose and Scope In Nigeria, it is recognised for the purpose of discrete policy-making and administration, that technology and science are two realms of human endeavour which exist mutually together. Science functions primarily in the realm of “knowing” while technology functions primarily in the realm of “doing”. The two realms are required for national development as Nigeria needs the “knowing” heads with the “doing” hands among its citizens to make progress. For the purpose of clear thinking, Nigeria does not accept the 19th century attempt by science to appropriate technology as "applied science". Consequently, in the education sector, “technology” and “science” are maintained as separate types of education with their purposes, delivery and administrative institutions to enable their separate but mutual development as tools for achieving national aspirations. It is to be noted that where technology and science have close affinities in their practices, they still distinguish themselves by the different purposes they serve. In general, “science education” in Nigeria deals with the study of natural sciences and science occupations. The two types of studies in science are necessary for national development: one leads to fundamental research while the other leads to applied research. On the other hand, "technology education" is a generic term for the study of technologies at all levels of education. Public understanding is focused on technology as public knowledge, skills and procedures for making, doing and using things in specifiable and reproducible ways. By this understanding, “accounting” or “information”, for instance, in so far as its practice is based on specifiable knowledge, skills and procedures is technology (Brooks, 1981: 35). In Nigeria therefore, “technology education” implies any type of education in technology at any level of the national education system – from primary to tertiary level. In this technological age, every occupational study is a study in technology and therefore technology education. The meaning of technology education in practice cuts across the conventional boundary between service and production occupations or service and production industries. By functional and administrative differentiation, technology education comprises four distinct types and levels of education indicated in Table 10.1 below. It is important to note that the fundamental purpose of technology education is to produce all types and levels of technological manpower required by the economy and, in so doing, to extend the realm of practical human possibilities through research. The survival of Nigeria as a nation in the advancing world of technology requires progress towards these two goals.
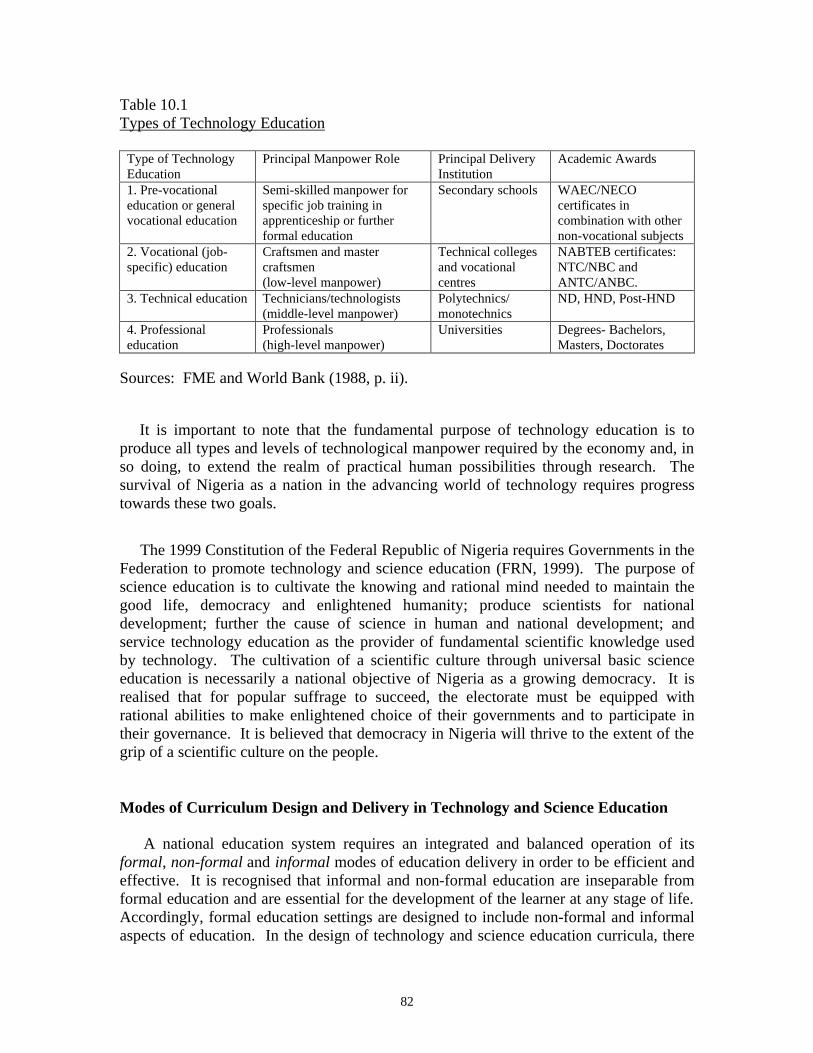
82
Table 10.1 Types of Technology Education
Type of Technology Education
Principal Manpower Role Principal Delivery Institution
Academic Awards
1. Pre-vocational education or general vocational education
Semi-skilled manpower for specific job training in apprenticeship or further formal education
Secondary schools WAEC/NECO certificates in combination with other non-vocational subjects
2. Vocational (job-specific) education
Craftsmen and master craftsmen (low-level manpower)
Technical colleges and vocational centres
NABTEB certificates: NTC/NBC and ANTC/ANBC.
3. Technical education Technicians/technologists (middle-level manpower)
Polytechnics/ monotechnics
ND, HND, Post-HND
4. Professional education
Professionals (high-level manpower)
Universities Degrees- Bachelors, Masters, Doctorates
Sources: FME and World Bank (1988, p. ii). It is important to note that the fundamental purpose of technology education is to produce all types and levels of technological manpower required by the economy and, in so doing, to extend the realm of practical human possibilities through research. The survival of Nigeria as a nation in the advancing world of technology requires progress towards these two goals.
The 1999 Constitution of the Federal Republic of Nigeria requires Governments in the Federation to promote technology and science education (FRN, 1999). The purpose of science education is to cultivate the knowing and rational mind needed to maintain the good life, democracy and enlightened humanity; produce scientists for national development; further the cause of science in human and national development; and service technology education as the provider of fundamental scientific knowledge used by technology. The cultivation of a scientific culture through universal basic science education is necessarily a national objective of Nigeria as a growing democracy. It is realised that for popular suffrage to succeed, the electorate must be equipped with rational abilities to make enlightened choice of their governments and to participate in their governance. It is believed that democracy in Nigeria will thrive to the extent of the grip of a scientific culture on the people. Modes of Curriculum Design and Delivery in Technology and Science Education A national education system requires an integrated and balanced operation of its formal, non-formal and informal modes of education delivery in order to be efficient and effective. It is recognised that informal and non-formal education are inseparable from formal education and are essential for the development of the learner at any stage of life. Accordingly, formal education settings are designed to include non-formal and informal aspects of education. In the design of technology and science education curricula, there
83
is a concern for co-curricular activities, aesthetics and order as necessary elements for complete development of the human personality with sensitivity to perfection, order and beauty. These sensitivities are essential for the cultivation of positive attitude towards quality workmanship or performance in technology and science occupations. The curricula for formal technology and science education are designed to produce the complete person (Faure et al, 1972: pp.153-159) rather than the historic "hand" in production or service. The various facets of the learner’s personality and needs are recognised in the curriculum for each level of education, so that the learner may have a sense of humanity and social sensibility. Each curriculum integrates general education in the study of technology or science and gives exposure to job-market practice through industrial attachment so that education in technology or science occupations may produce professionals who have adequate sensibilities in addition to occupational skills. It is expected that while the professionals benefit from the utilitarian functions of their profession, they should also have ethical consciousness, a sense of contributing to the common good of all in doing so. The National Policy on Education (1998) is clear about this, as it specifies one of the values to be fostered by education as "shared responsibility for the common good of society”. Technology and Science Education in Nigeria before 1977 Nigeria, like other nations, has never been without its types of technology education. In pre-colonial times, the traditional technologies of agriculture, medicine, food preparation and warfare were taught by non-formal methods, but with little or no basis in science. Skills and knowledge were mostly shrouded in traditional mysticism, superstition and guarded family apprenticeship system. When in the 19th century therefore, formal technology and science education came to Nigeria as educational transplants, they had little cultural base to support their beginnings. Formal science teaching started with the establishment of the first secondary school (CMS Grammar School, Lagos) in Nigeria in 1859. From inception, the demand for science was not high in spite of the good prospects for learners for further education in the technology and science professions. Formal technology education, which suffered from low prestige complex in 19th century Britain, was transplanted with this complex to Nigeria in the early 20th century. The colonial government established the Railway Training Institute in 1901 and the Survey School in 1908, in Lagos, as training schools for its own departments. Another landmark was the opening of Yaba Higher College in 1932, to provide a range of advanced vocational courses. The colonial government policy in the name of "relevance", encouraged schools to teach agriculture and crafts avocationally. This policy, however, lacked popular appeal and had very limited outcomes. Nigerian nationalists argued that the policy generally, and the non-university status of Yaba Higher College in particular, were part of an attempt to block the advance of Africans into positions of leadership. In the 1950s, after Yaba Higher College was converted and moved to Ibadan as the University College, Ibadan (in 1948), its vacated facilities were used to establish Yaba
84
Technical Institute. The role of the institute in providing programmes at polytechnic level was then shared by the Nigerian College of Arts, Science and Technology, with campuses at Ibadan, Zaria and Enugu. For the secondary level, the colonial government also opened trade centres at Yaba, Enugu and Kaduna. The regional governments followed the lead and, by 1966, had established 11 technical colleges. These were reputable institutions, adequately funded and popular with employers. Students were given free tool-boxes in addition to training stipend for their upkeep and incentive to remain in training. During the 1970's, however, as tertiary education rapidly developed, they became caricatures of their former selves for lack of adequate funding and management by government as well as respect on the part of the public for manual skills and technical achievement.
An important conceptual landmark in the effort to modernise and vitalise TVE was the publication of the first "National Plan of Vocational and Technical Education in the Republic of Nigeria", prepared by Dr. Adam Skapski (1966). Skapski called for action by "a group of professionally competent educators" united by a sense of mission and aware of relevant achievements in other countries to move the change process forward. He also called for pilot projects, and for "the foundation of an adequately structured general education". Since the publication in 1966, Skapski's master plan has been the spirit of innovation and change in the profile of TVE in Nigeria. Most of the recommendations have been implemented in one form or the other including the 3-3 secondary education policy from 1982, the establishment of NBTE in 1977, ITF in 1971 and uniform educational structure and content nation-wide from 1977; some recommendations are yet to be implemented.
Technology and Science Education in the National Policy on Education The National Policy on Education (effective from 1977) provides for a two-tier secondary education comprising 3 years each of junior and senior secondary education. Their curricula are both academic and pre-vocational in nature. That is, technology is studied at pre-vocational level while the sciences are studied at pre-professional level. According to the policy, the natural sciences at the junior secondary level are to be studied in an integrated manner, while at the senior secondary level they are to be studied as discrete subjects e.g. metalwork, building construction, food and nutrition, typewriting. In the same way, pre-vocational education is offered at the junior secondary level as broad fields such as introductory technology, business studies and home economics. The aims of pre-vocational education are to develop technological literacy, give some exposure to the world of work for wise vocational choice, and promote a positive attitude towards work. At the senior secondary level, they are studies in their discrete component subjects as indicated above. The pre-vocational subjects which may be offered at senior secondary level (from which students may choose one or two) include: Agriculture, Applied Electricity, Auto-Mechanics, Book-keeping and Accounting, Building Construction, Commerce, Computer Studies, Electronics, Clothing and Textiles, Food and Nutrition, Home Management, Metalwork, Woodwork, Technical Drawing,
85
Shorthand and Typewriting. At the senior secondary level pre-vocational education is offered as a preparation for higher education in technology and for useful living. Owing to the high costs of training in pre-vocational subjects, the relative scarcity of technology teachers for them, the expansion of enrolment in secondary education, and the parlous economic circumstances since 1979, it has been exceptionally difficult to implement the goals of the National Policy in this area. Although the National Policy on education is not very explicit about the use of special function schools at the senior secondary level, both Federal and State Governments have in practice chosen to operate a system of technical colleges and science schools, parallel to the general senior secondary schools. The curriculum of the technical colleges is intended to be job-specific rather than pre-vocational. From the late 1980's the Federal Government renewed its commitment to establishing more technical colleges, in the belief that they could make an important contribution in the struggle against youth unemployment and mass poverty. Between 1988 and 2002 the Federal Government established 18 new Federal Technical Colleges. In 2002 these were converted into six-year Federal Science and Technical Colleges, covering both segments of secondary education. These colleges are to offer job-specific training for craftsmen or skilled manpower as well as pre-professional science training for those who are to pursue their further education in science and technology occupations respectively. Participation in Technology and Science Programmes The National Policy on Education (1998) places technical colleges at par with senior secondary schools. The policy envisaged that 20% of students who complete the junior secondary segment would be admitted to technical colleges, while about 60% would enter general senior secondary schools. The reality, however, in 2001, was that the enrolment of 90,038 in 117 technical colleges was about 1.2% of the 7,351,000 enrolment in 7,309 general secondary schools in the country. Furthermore, the transition rate of technology and science students from secondary to tertiary institutions is small. Indeed, the polytechnics are unable to implement the prescribed admissions ratio of 70:30 in favour of production-based programmes. In order to approximate the prescribed admission ratio in production and service-based programmes, the NBTE has decided that effective from the 2003/2004 academic session for the purpose of its accreditation, less than 30% enrolment in State and Private Polytechnics in production-based programmes would be unacceptable. NBTE statistics on the state of disparity between production and service-based programmes in 2000 is shown in annex 6 in respect of 41 polytechnics (federal and state) in the country. By 2000, the overall picture of ratio of enrolment in production to service-based programmes by NBTE statistics was 36:64. In 2001 the Polytechnics enrolled a total of 186,080 out of which females were 74,612 (40%) in ND and HND programmes. In 2002, the enrolment in ND and HND programmes was 197,440 in the 51 Polytechnics (17 Federal, 27 State and 7 Private) in the country while their output graduates were 32,451. Monotechnics in the country comprise 36 Colleges of Agriculture, 39 health science and allied institutions and 12 other specialised
86
monotechnics. NBTE statistics in 2001 indicate a total enrolment of 11,358 with an output of 2964. In 2001, enrolment in Pre-ND courses was 37,500 in 45 Polytechnics, which is about 37.5% of enrolment in ND programmes. It is known that the universities are yet to approximate the prescribed admissions ratio of 60% for technology/science and 40% for arts/humanities-based programmes. In 1991/1992 academic session, new entrants in technology/science programmes in the 37 universities were about 42% of the total enrolment. For 40 universities in 2000, total enrolment was 201825 or 46.5% for technology/science and 232,046 or 53.5% for arts/humanities-based programmes. Female participation was 53,989 or 26.7% in technology/science as against 78,360 or 33.8% in arts/humanities (NUC statistics). Remedial/pre-degree programmes mainly in technology and science programmes was 14,359 or 3.2% of the 448,230 enrolled in 2000 in all universities. Inclusion Efforts are being made to keep technology and science education routes open and flexible against entrenched historical rigidities and to provide opportunities for entrants to compensate for their disadvantaged backgrounds in their study pursuits. This is in keeping with the commitment of government to the implementation of the policy of lifelong education for all. Access is being expanded to accommodate more students who have appropriate aptitudes and can progress in technology and science professions. There is no exclusion mechanism save the prescribed entry requirements. A number of measures are being adopted to ensure a high level of inclusion in technology and science education. One of such measures is special resource provision for the physically challenged in selected and specialised institutions. Another is the provision of open and distance education to take care of the huge number that cannot follow a full-time formal education programme due to their varying conditions of life or their inability to gain admission into full-time tertiary institutions. For this purpose the National Open University has been resuscitated. Both technology and science programmes are included in the curriculum for UBE, and there are programmes for public enlightenment about their importance. There is also public recognition of, and reward for, achievement in these fields. The Government recognises that female participation is a particular problem in these fields. Table 10.2 below gives examples of rates of participation by gender. Among the efforts being made to close the gender gap is the establishment of a science and technical college for girls only by the Federal Government.
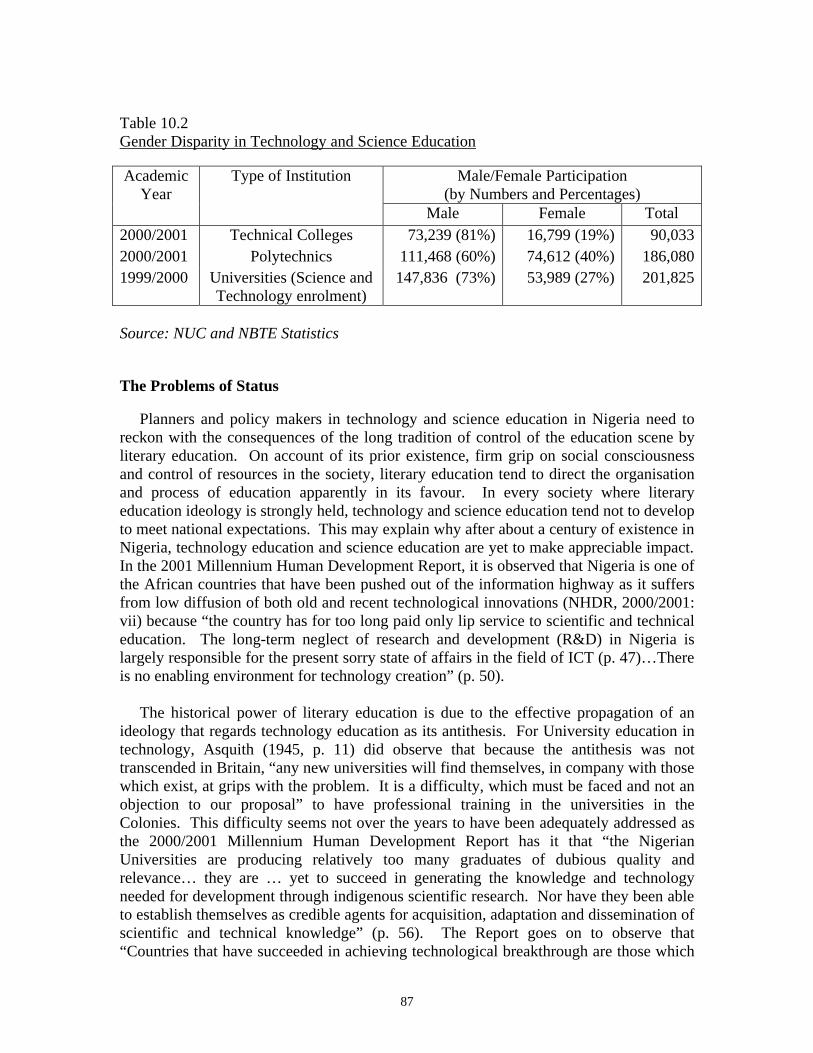
87
Table 10.2 Gender Disparity in Technology and Science Education
Male/Female Participation (by Numbers and Percentages)
Academic Year
Type of Institution
Male Female Total 2000/2001 Technical Colleges 73,239 (81%) 16,799 (19%) 90,033 2000/2001 Polytechnics 111,468 (60%) 74,612 (40%) 186,080 1999/2000 Universities (Science and
Technology enrolment) 147,836 (73%) 53,989 (27%) 201,825
Source: NUC and NBTE Statistics The Problems of Status Planners and policy makers in technology and science education in Nigeria need to reckon with the consequences of the long tradition of control of the education scene by literary education. On account of its prior existence, firm grip on social consciousness and control of resources in the society, literary education tend to direct the organisation and process of education apparently in its favour. In every society where literary education ideology is strongly held, technology and science education tend not to develop to meet national expectations. This may explain why after about a century of existence in Nigeria, technology education and science education are yet to make appreciable impact. In the 2001 Millennium Human Development Report, it is observed that Nigeria is one of the African countries that have been pushed out of the information highway as it suffers from low diffusion of both old and recent technological innovations (NHDR, 2000/2001: vii) because “the country has for too long paid only lip service to scientific and technical education. The long-term neglect of research and development (R&D) in Nigeria is largely responsible for the present sorry state of affairs in the field of ICT (p. 47)…There is no enabling environment for technology creation” (p. 50). The historical power of literary education is due to the effective propagation of an ideology that regards technology education as its antithesis. For University education in technology, Asquith (1945, p. 11) did observe that because the antithesis was not transcended in Britain, “any new universities will find themselves, in company with those which exist, at grips with the problem. It is a difficulty, which must be faced and not an objection to our proposal” to have professional training in the universities in the Colonies. This difficulty seems not over the years to have been adequately addressed as the 2000/2001 Millennium Human Development Report has it that “the Nigerian Universities are producing relatively too many graduates of dubious quality and relevance… they are … yet to succeed in generating the knowledge and technology needed for development through indigenous scientific research. Nor have they been able to establish themselves as credible agents for acquisition, adaptation and dissemination of scientific and technical knowledge” (p. 56). The Report goes on to observe that “Countries that have succeeded in achieving technological breakthrough are those which
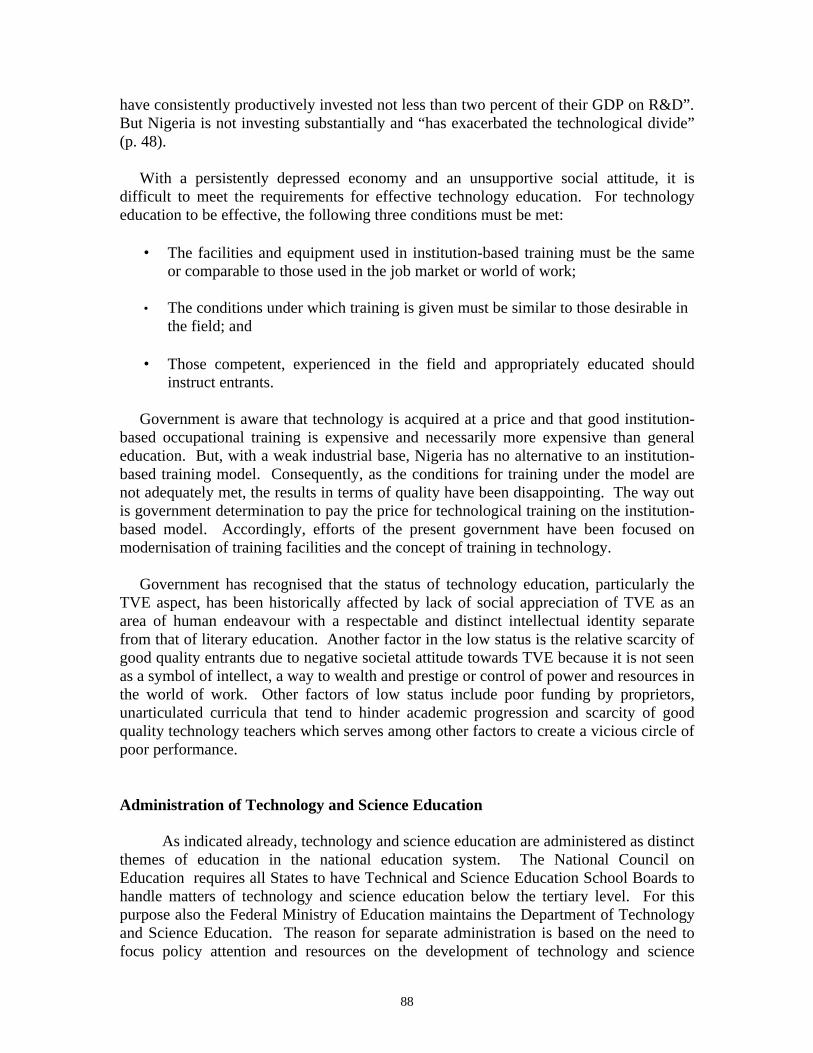
88
have consistently productively invested not less than two percent of their GDP on R&D”. But Nigeria is not investing substantially and “has exacerbated the technological divide” (p. 48). With a persistently depressed economy and an unsupportive social attitude, it is difficult to meet the requirements for effective technology education. For technology education to be effective, the following three conditions must be met:
• The facilities and equipment used in institution-based training must be the same or comparable to those used in the job market or world of work;
• The conditions under which training is given must be similar to those desirable in
the field; and
• Those competent, experienced in the field and appropriately educated should instruct entrants.
Government is aware that technology is acquired at a price and that good institution-based occupational training is expensive and necessarily more expensive than general education. But, with a weak industrial base, Nigeria has no alternative to an institution-based training model. Consequently, as the conditions for training under the model are not adequately met, the results in terms of quality have been disappointing. The way out is government determination to pay the price for technological training on the institution-based model. Accordingly, efforts of the present government have been focused on modernisation of training facilities and the concept of training in technology. Government has recognised that the status of technology education, particularly the TVE aspect, has been historically affected by lack of social appreciation of TVE as an area of human endeavour with a respectable and distinct intellectual identity separate from that of literary education. Another factor in the low status is the relative scarcity of good quality entrants due to negative societal attitude towards TVE because it is not seen as a symbol of intellect, a way to wealth and prestige or control of power and resources in the world of work. Other factors of low status include poor funding by proprietors, unarticulated curricula that tend to hinder academic progression and scarcity of good quality technology teachers which serves among other factors to create a vicious circle of poor performance. Administration of Technology and Science Education
As indicated already, technology and science education are administered as distinct themes of education in the national education system. The National Council on Education requires all States to have Technical and Science Education School Boards to handle matters of technology and science education below the tertiary level. For this purpose also the Federal Ministry of Education maintains the Department of Technology and Science Education. The reason for separate administration is based on the need to focus policy attention and resources on the development of technology and science
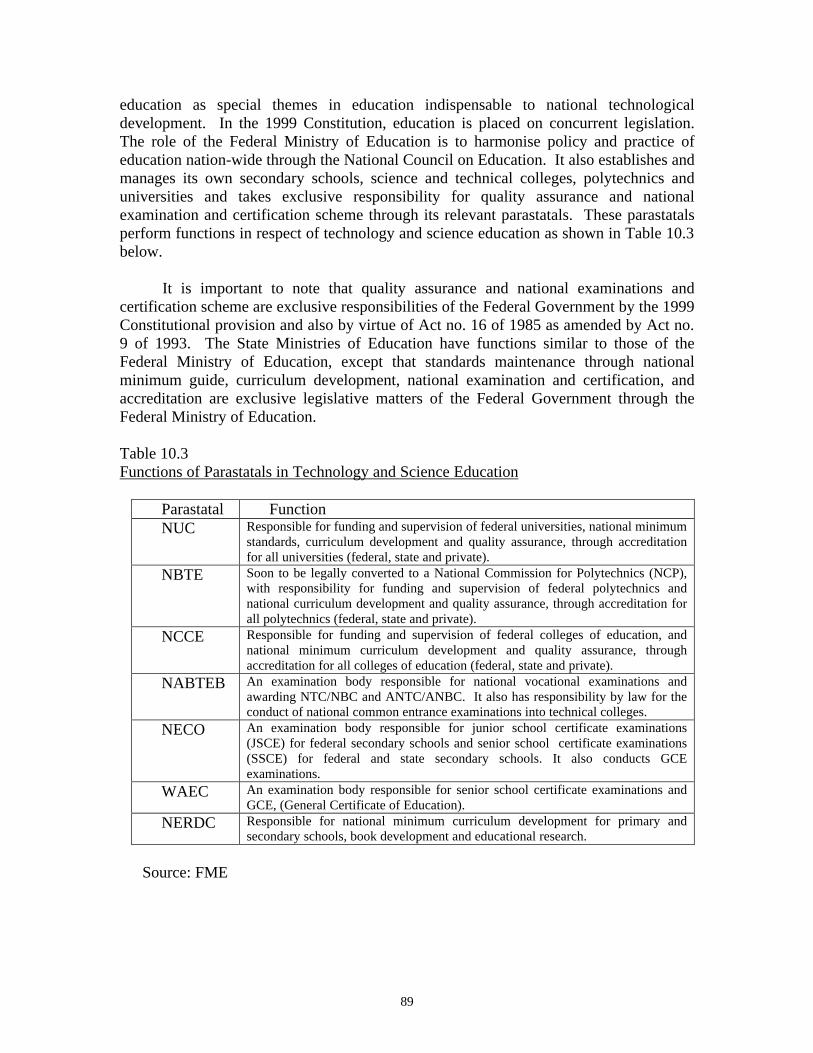
89
education as special themes in education indispensable to national technological development. In the 1999 Constitution, education is placed on concurrent legislation. The role of the Federal Ministry of Education is to harmonise policy and practice of education nation-wide through the National Council on Education. It also establishes and manages its own secondary schools, science and technical colleges, polytechnics and universities and takes exclusive responsibility for quality assurance and national examination and certification scheme through its relevant parastatals. These parastatals perform functions in respect of technology and science education as shown in Table 10.3 below.
It is important to note that quality assurance and national examinations and
certification scheme are exclusive responsibilities of the Federal Government by the 1999 Constitutional provision and also by virtue of Act no. 16 of 1985 as amended by Act no. 9 of 1993. The State Ministries of Education have functions similar to those of the Federal Ministry of Education, except that standards maintenance through national minimum guide, curriculum development, national examination and certification, and accreditation are exclusive legislative matters of the Federal Government through the Federal Ministry of Education. Table 10.3 Functions of Parastatals in Technology and Science Education
Parastatal Function NUC Responsible for funding and supervision of federal universities, national minimum
standards, curriculum development and quality assurance, through accreditation for all universities (federal, state and private).
NBTE Soon to be legally converted to a National Commission for Polytechnics (NCP), with responsibility for funding and supervision of federal polytechnics and national curriculum development and quality assurance, through accreditation for all polytechnics (federal, state and private).
NCCE Responsible for funding and supervision of federal colleges of education, and national minimum curriculum development and quality assurance, through accreditation for all colleges of education (federal, state and private).
NABTEB An examination body responsible for national vocational examinations and awarding NTC/NBC and ANTC/ANBC. It also has responsibility by law for the conduct of national common entrance examinations into technical colleges.
NECO An examination body responsible for junior school certificate examinations (JSCE) for federal secondary schools and senior school certificate examinations (SSCE) for federal and state secondary schools. It also conducts GCE examinations.
WAEC An examination body responsible for senior school certificate examinations and GCE, (General Certificate of Education).
NERDC Responsible for national minimum curriculum development for primary and secondary schools, book development and educational research.
Source: FME
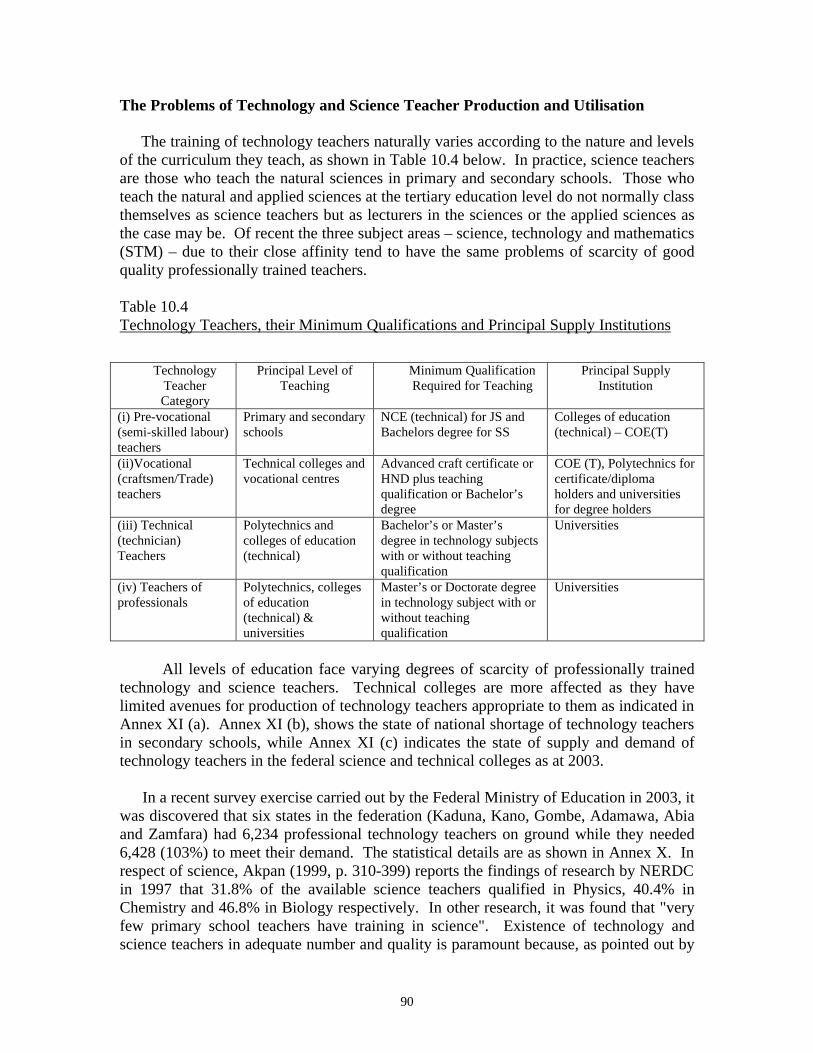
90
The Problems of Technology and Science Teacher Production and Utilisation The training of technology teachers naturally varies according to the nature and levels of the curriculum they teach, as shown in Table 10.4 below. In practice, science teachers are those who teach the natural sciences in primary and secondary schools. Those who teach the natural and applied sciences at the tertiary education level do not normally class themselves as science teachers but as lecturers in the sciences or the applied sciences as the case may be. Of recent the three subject areas – science, technology and mathematics (STM) – due to their close affinity tend to have the same problems of scarcity of good quality professionally trained teachers. Table 10.4 Technology Teachers, their Minimum Qualifications and Principal Supply Institutions
All levels of education face varying degrees of scarcity of professionally trained
technology and science teachers. Technical colleges are more affected as they have limited avenues for production of technology teachers appropriate to them as indicated in Annex XI (a). Annex XI (b), shows the state of national shortage of technology teachers in secondary schools, while Annex XI (c) indicates the state of supply and demand of technology teachers in the federal science and technical colleges as at 2003.
In a recent survey exercise carried out by the Federal Ministry of Education in 2003, it was discovered that six states in the federation (Kaduna, Kano, Gombe, Adamawa, Abia and Zamfara) had 6,234 professional technology teachers on ground while they needed 6,428 (103%) to meet their demand. The statistical details are as shown in Annex X. In respect of science, Akpan (1999, p. 310-399) reports the findings of research by NERDC in 1997 that 31.8% of the available science teachers qualified in Physics, 40.4% in Chemistry and 46.8% in Biology respectively. In other research, it was found that "very few primary school teachers have training in science". Existence of technology and science teachers in adequate number and quality is paramount because, as pointed out by
Technology Teacher Category
Principal Level of Teaching
Minimum Qualification Required for Teaching
Principal Supply Institution
(i) Pre-vocational (semi-skilled labour) teachers
Primary and secondary schools
NCE (technical) for JS and Bachelors degree for SS
Colleges of education (technical) – COE(T)
(ii)Vocational (craftsmen/Trade) teachers
Technical colleges and vocational centres
Advanced craft certificate or HND plus teaching qualification or Bachelor’s degree
COE (T), Polytechnics for certificate/diploma holders and universities for degree holders
(iii) Technical (technician) Teachers
Polytechnics and colleges of education (technical)
Bachelor’s or Master’s degree in technology subjects with or without teaching qualification
Universities
(iv) Teachers of professionals
Polytechnics, colleges of education (technical) & universities
Master’s or Doctorate degree in technology subject with or without teaching qualification
Universities
91
Castro (1985, p. 17), incompetent instructors create the vicious circle of lack of quality which in turn creates a situation where certificates are worthless proof of competence. The problems of poor production and utilisation of technology teachers stem from inadequate conception of the categories of technology teachers required and the method of their training. It is not always considered that a technology teacher should first be a practising professional at the level of his teaching before becoming a pedagogue to transfer his skills to students. As a result technology teachers as currently produced in the concurrent mode of training, lack professional registrable status as well as research competence to engage in further education in their profession. This is due to the fact that the combination of studies in education with the teaching subject in the concurrent mode of training creates teaching subject content deficiency which makes it impossible for the holder of the certificate to qualify for further education in the teaching subject area or to teach the profession in job specific training institutions such as technical colleges, polytechnics and universities. Whether in technology or in science, Nigeria is yet to have a co-ordinated national system of production of teachers appropriate for the various levels of teaching. The present conception of and modes of training of technology teachers only serve to weaken the teaching of technology and science as well as to deter good quality entrants into the teaching profession. Above all, is the disadvantage in terms of a remunerative power and social prestige of those engaged in technology and science teaching compared with those in industry and commerce. Consequently those trained in technology and in science deter teaching as a profession. The remedies proposed for the various problems include the necessity for establishment of a dedicated university for the production of the various categories of science and technology teachers. Such a university is to serve also as national seminar centre for technology and science teacher education. Other remedies include the creation of a national system of production by the proposed university, the creation of special incentives to retain technology and science teachers in teaching, over production to create a glut which shall make for retention of technology and science in teaching. Alternatively, people have seen great values in intensifying public enlightenment to create demand for entry into technology and science teaching. Achievements
The present administration is currently deliberately reshaping the terrain of
technology and science education for better performance. In awareness of the problems that beset the full realisation of the goals of TVE, a national seminar was held in November 2000 in collaboration with UNESCO. The goals of the seminar were to re-engineer and reposition TVE for better performance in the 21st century and to market prescribed reforms to stake holders. The material outcome of the seminar was the preparation of a national master-plan for the development of TVE in the 21st century. Key ideas in the national master plan include the institution of entrepreneurial education at all levels, raising the quality of TVE, expanding access and inclusion, increasing number and improving quality of technology teachers, intensive marketing of TVE, and improving the managerial capacity of the sub-sector.
92
Some modest achievements in the last few years include rehabilitation and expansion of facilities, curriculum revision and teaching capacity building in collaboration with UNESCO. Increased flexibility in the system enables the hitherto excluded products of technical colleges to gain admission more easily into tertiary institutions. There is a gradual change of social attitudes towards technology education and science education, and a focusing of government attention on their development. There is also a growing recognition of the importance of technology and science for the success of democracy, attainment of mass employment and national economic development. TVE with a scheme of financial empowerment of the clientele is now government’s main approach to poverty eradication. NAPEP, as a parastatal of the Federal Government for poverty eradication, spearheads the idea of the use of TVE with financial empowerment of the clientele to eradicate poverty. In 2002, the Federal Government took a further step to reposition TVE for greater advantage in the national education scheme. Major policy innovations in this regard include:
• The reversal of federal technical college craft programmes to full secondary education duration of six years. Students from primary schools are admitted into the junior college component of technical colleges to enable the technical colleges stand a fair chance of having good quality entrants as well as provide an early orientation to students towards technology education and the world of work. In addition, the FME has converted its technical colleges to science and technical colleges offering senior school science and normal craft and advanced craft programmes at senior secondary level to attract entrants.
• Setting up an action plan, following the resolutions of Higher Education Summit
in 2002, to review the policy and mandates of Polytechnics and Colleges of Education to enable them award degrees. Government is therefore considering the adoption of a policy of separate development and independent operation of tertiary institutions. The policy of separate development is geared towards eliminating all forms of marginalisation consequent upon the old tradition.
• Setting up of action plan to review the ceiling in career progression of graduates
and staff of polytechnics and Colleges of Education, so that the historical disparities between university and polytechnic graduates may be eliminated.
• Setting up plans to integrate entrepreneurial education into the scheme of
technology education.
• Introduction of post-HND programmes to enable holders of HND to qualify for professional registration and practice.
93
Mission for the 21st Century The 2nd International Congress on TVE held in Korea, April 1999, set the mission for all nations under UNESCO to use TVE to address the employment and other socio-economic challenges of the early years of this 21st century. These challenges include globalisation, an ever-changing technological scenario, ICT revolution and the consequent rapid pace of social change. For all these, a new paradigm of TVE was required of all member nations in order to make for success. Nigeria therefore, assumed the challenge of creating a new paradigm of TVE by means of the 2000 national master-plan. The mission of TVE in this 21st century is to provide technological orientation to all citizens of Nigeria and produce a knowledge-based skilled workforce to enable the national economy maintain a competitive edge in the world of globalisation, trade liberalisation, technological and social change and political integration. TVE shall produce, through the institution of entrepreneurial education more job-creators than job-seekers. Following the resolution of the 2002 National Summit on Higher Education and the recommendations of the 2000 TVE master-plan, the Federal Government has commenced action to rationalise the system of management of TVE for improved efficiency. It is therefore, intended that the three areas of management functions - proprietorship (founding, funding and supervision), regulation (certification, quality control/assurance) and programmes delivery - should be handled by distinct bodies ultimately. Meanwhile, NBTE as earlier indicated would be converted by law to National Commission for Polytechnics (NCP) to handle both the proprietorship and regulatory functions in education for polytechnics. NABTEB as an examination body would continue to handle vocational examinations and certification. The Federal Ministry of Education would continue to handle its proprietorship functions in respect of its institutions and would take on in addition, the regulatory functions of national curriculum development and accreditation of technical college programmes. As indicated already, the change of Technical College programme duration from three to six years after primary education and the elimination of hindrances to admission of the graduates of technical colleges in tertiary institutions are strategies to market TVE for social acceptance. In the future, a more intensive campaign to promote TVE among students and their parents is to be launched. Nigeria believes in transfer of technology and technology is transferred only by training. Where good quality technology teachers are lacking, technology transfer remains a mirage. Accordingly, the mission of technology education for the 21st century is focused mainly on the production of all categories of good quality technology teachers and their retention in teaching. The Way Forward For the immediate future, efforts of the government will focus on full implementation of the national master plan on TVE, particularly the attainment of the decade goals. Also efforts will be focused on the implementation of the national action plan on the
94
resolutions of the 2002 National Summit on Higher Education. For this purpose, there would be the need to create a National Advisory Council on Technology and Science Education, comprising a group of professionally competent educators who are versed in the fields and could galvanise a sense of mission to drive technology and science education to meet national expectations. The logic of this approach is to involve stakeholders of innovations in the process of implementation.

95
CHAPTER ELEVEN
TEACHER EDUCATION
The teacher is central to the process of education and teacher education is considered to be the foundation for quality and relevance in education at all levels. The National Policy on Education (Nigeria, 1998) clearly articulates the importance attached to teacher education in affirming that “ no education system can rise above the quality of its teachers”. According to the Policy, the goals of teacher education shall be:
• To produce highly motivated, conscientious and efficient classroom teachers for all levels of our education system;
• To encourage further the spirit of enquiry and creativity in teachers;
• To help teachers to fit into the social life of the community and the society at
large and to enhance their commitment to national goals;
• To provide teachers with the intellectual and professional background adequate for their assignment and to make them adaptable to changing conditions;
• To enhance teachers’ commitment to the teaching profession.
In addition, the Policy stipulates that the Nigerian Certificate in Education (NCE)
shall be the minimum entry qualification into teaching and provides that all teachers in educational institutions shall be professionally trained, in relevant teacher education programmes. It requires that teaching services shall be so planned that teachers can transfer from state to state without loss of status. The current reality however, is that the policy making the NCE the minimum requirement is not yet fully effective and neither is the transfer within states without loss of status. Teachers who have transferred have had to accept lower status while some state governments have totally retrenched teachers who are non-indigenes.
These excellent intentions contrast with the massive challenges that teacher education in Nigeria faces. As the mobilization efforts of the Universal Basic Education (UBE) policy result in increased enrolment in primary schools, the issue of teacher capacity to respond to the demand assumes greater importance. This challenge is no less real at the post-primary level, where daily teachers are expected to devise learning experiences which make schooling more enjoyable and relevant. Unless they make such efforts, even more young people will make the decision to leave school before completing the intended nine years of basic education. At the tertiary level, teachers face the intractable problem of working with dilapidated facilities even for the most sophisticated courses. Across these levels, teachers are generally expected to make the best of every bad situation.
96
To what extent are teachers equipped for the task assigned to them in the National
Policy? What manner of education do teachers receive and what retraining opportunities are available for them? What support services are put in place for teacher professional development and subsequent professionalism? This chapter attempts to address these issues. Access to the Teaching Profession
Various routes of entry into the teaching profession are provided by different kinds of institutions. University Faculties of Education, Schools of Education in Polytechnics, and Colleges of Education provide pre-service teacher education. In-service training is provided by University Institutes of Education and The National Teachers Institute (NTI). The latter also provides a new, “pivotal” pre-service programme. One would not be wrong to infer that there appear to be many opportunities for anyone who is interested and minimally qualified to enter the teaching profession. Indeed, a one-year remedial programme has been introduced to give candidates whose entry qualifications are not up to required minimum (of 2-3 school certificate credits) to remedy the defect before moving on to the full NCE programme.
The emphasis on the NCE is a result of the policy (effective since 1987) that this should be the minimum qualification for teaching. The policy was given a boost by the establishment of the National Commission for Colleges of Education (NCCE) in 1989. It led to the phasing out of the Grade II Teachers’ in states where the deadlines for upgrading to NCE were met. Teacher Supply and Demand
A major problem which the country faces is that the above measures, which might have been expected to raise the status of teaching, have not prevented a decline in the demand for pre-service teacher education. A nation-wide survey of secondary school pupils conducted by the NCCE (2000) found that less than 8% expressed a wish to enter colleges of education (COEs). In the selection examination for polytechnics and COEs, held in the 2001/02 academic year, the 14,338 candidates who had applied for admission to the NCE programmes represented only 22.4% of the intake capacity of the COEs (NCCE, 2000). Consequently, the COEs have to depend mainly on their remedial programmes to fill NCE places. Furthermore, Aarons (2003), using data from 12 COEs over a three-year period ending in 2001, observes that a small, and diminishing, proportion of NCE students are specializing in primary education. They tend to prefer courses which would enable them to enter degree programmes or non-teaching careers after graduation. Although it is recognized that the NCE programme is structured in such a way that every NCE teacher can teach in a primary school, yet the fact that these teachers may be mostly subject specialists leads to the conclusion that their focus and interest is subject matter rather than methodology. The primary school teacher ought to
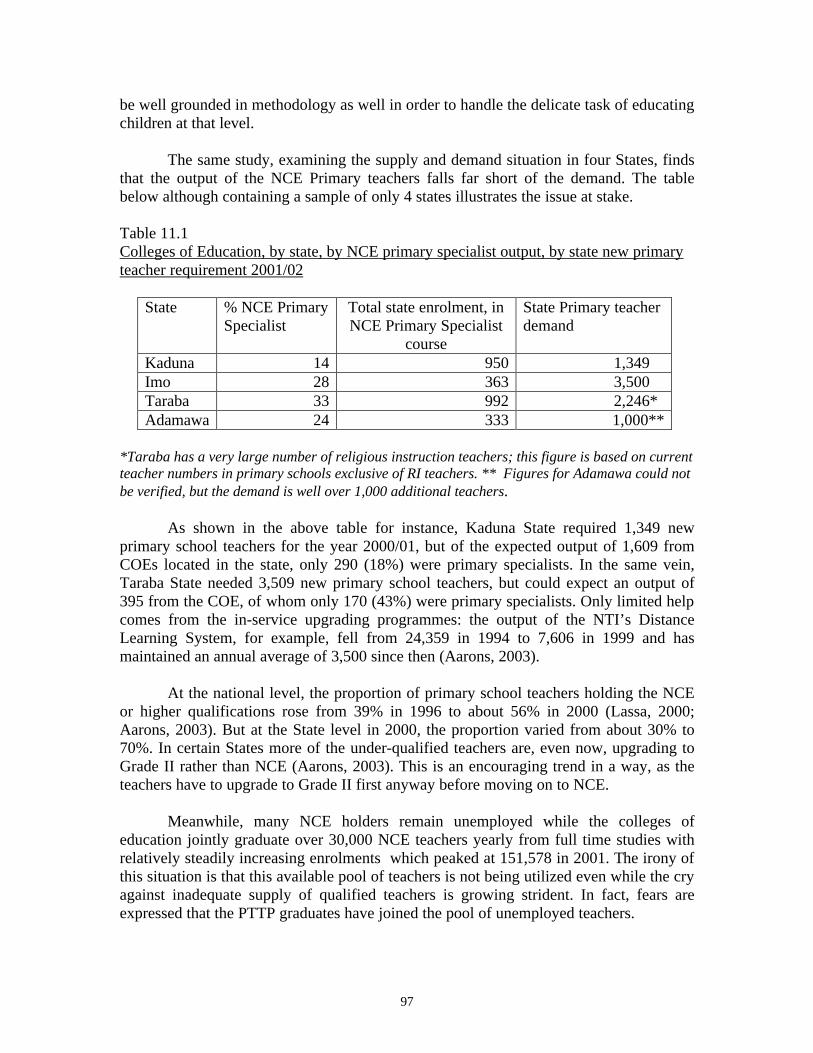
97
be well grounded in methodology as well in order to handle the delicate task of educating children at that level.
The same study, examining the supply and demand situation in four States, finds that the output of the NCE Primary teachers falls far short of the demand. The table below although containing a sample of only 4 states illustrates the issue at stake. Table 11.1 Colleges of Education, by state, by NCE primary specialist output, by state new primary teacher requirement 2001/02
State % NCE Primary Specialist
Total state enrolment, in NCE Primary Specialist
course
State Primary teacher demand
Kaduna 14 950 1,349 Imo 28 363 3,500 Taraba 33 992 2,246* Adamawa 24 333 1,000**
*Taraba has a very large number of religious instruction teachers; this figure is based on current teacher numbers in primary schools exclusive of RI teachers. ** Figures for Adamawa could not be verified, but the demand is well over 1,000 additional teachers.
As shown in the above table for instance, Kaduna State required 1,349 new primary school teachers for the year 2000/01, but of the expected output of 1,609 from COEs located in the state, only 290 (18%) were primary specialists. In the same vein, Taraba State needed 3,509 new primary school teachers, but could expect an output of 395 from the COE, of whom only 170 (43%) were primary specialists. Only limited help comes from the in-service upgrading programmes: the output of the NTI’s Distance Learning System, for example, fell from 24,359 in 1994 to 7,606 in 1999 and has maintained an annual average of 3,500 since then (Aarons, 2003).
At the national level, the proportion of primary school teachers holding the NCE or higher qualifications rose from 39% in 1996 to about 56% in 2000 (Lassa, 2000; Aarons, 2003). But at the State level in 2000, the proportion varied from about 30% to 70%. In certain States more of the under-qualified teachers are, even now, upgrading to Grade II rather than NCE (Aarons, 2003). This is an encouraging trend in a way, as the teachers have to upgrade to Grade II first anyway before moving on to NCE.
Meanwhile, many NCE holders remain unemployed while the colleges of education jointly graduate over 30,000 NCE teachers yearly from full time studies with relatively steadily increasing enrolments which peaked at 151,578 in 2001. The irony of this situation is that this available pool of teachers is not being utilized even while the cry against inadequate supply of qualified teachers is growing strident. In fact, fears are expressed that the PTTP graduates have joined the pool of unemployed teachers.
98
For the secondary level, a World Bank survey (2003) indicates that here too there are serious gaps between demand and supply of teachers, resulting in many over-size classes. Every area of the curriculum is under-serviced. This situation is partly explained by low and poor-quality enrolment in university Faculties of Education. In the 2001/02 session, for instance, only 2.2% of the candidates in the University Matriculation Examination (UME) applied to study Education, whereas 25.8% applied for Administration and 20.3% applied to study Social Sciences (JAMB, 2002). Education would recruit mainly those who were denied access to their field of first choice. The resulting belief that teachers are the “academic dregs” contributes to their low status.
The supply of qualified teachers for the pre-primary level should not be overlooked, since the Government has a responsibility to promote suitable teacher education for this level. This is being done in the NCE programmes with courses available for teacher trainees in early childhood education. The demand for properly trained teachers at the pre-primary level arises as more women engage in work outside the home (see Chapter 4). The Content of Teacher Education Programmes The statutory responsibility for teacher education is vested in COEs, Institutes of Education, polytechnics and NTI (by distance). Teachers are also trained in University Faculties of Education for B.Ed, B.A.Ed. and M.Ed. Programmes. COEs award the Nigerian Certificate in Education (NCE), which is a sub-degree but professionally demanding diploma obtainable after three years of full-time study in a COE. These COEs can therefore be said to be the core of the teacher-training system, expected to produce teachers for the primary and junior secondary levels.
Lassa (2000) identified four major requirements for a teacher preparation programme: general studies; educational studies; studies related to the students’ intended field of teaching; and teaching practice. It is considered that these represent a widely accepted pattern of teacher education. Teacher training in Nigeria adopts this general pattern although with variations in breadth and depth. In the past it was left to the various universities to prescribe minimum standards for their affiliate colleges of education.
Since its establishment in 1989, the NCCE has three times laid down “ Minimum Standards” for the COEs, the most recent edition being published in 2002. The admission requirements for the NCE programme under the Minimum Standards (2002) specify a senior secondary school certificate (SSC), NECO, or General Certificate in Education (GCE) O’ Level with passes in 5 subjects including English, including three credits at the same sitting or four credits at two sittings. Two of the credits must be relevant to the course the candidate wishes to offer. Credits in English and/or Mathematics may be required in some courses to meet departmental requirements. A Grade II Teacher’s Certificate (TCII) with at least 5 years of post-qualification teaching experience, with or without the required number of credits, is also acceptable. Candidates can also apply with an Associate Certificate in Education at merit level and candidates who are successful in
99
the Pre-NCE final examination are also admitted. The selection process is done through JAMB.
The Minimum Standards were designed to produce teachers exposed to a breadth of studies covering all that is required to make them competent professionals. The academic level reached is equivalent to that of the third year of a university Bachelor of Education programme. The 3rd edition of the Minimum Standards has, in response to increasing demands on teachers in the field, increased the number of credits in Primary Education Studies (PES) that are compulsory for all NCE holders. Courses such as Computer Education, Mathematics and General English have also been made compulsory for all NCE students. Thirdly, relevant themes, besides the Nigerian Constitution input of General Studies, have been infused into the NCE curriculum. These themes include Environmental/Conservation Education, Population and Family Life Education, STD/HIV/AIDS Education, and Drug Abuse and Women’s Education. The objective is to improve teachers’ capacity to communicate, and to provide necessary guidance outside their subjects of specialization (NCCE, 2002).
Recent reports from classroom research (Aarons, 2003) indicate that there are other specific improvements needed to the training that teachers received. Deficiencies are identified in teachers’ knowledge and skills in the area of language. They are found to need more skill in teaching initial literacy, number and basic science concepts in the children’s mother tongue, more ability to manage children’s learning needs during the transition to English as the medium of instruction, and more awareness of the importance of language across the curriculum. It is also suggested that they need additional training in the use of instructional time, in promoting active learning, in assessment techniques, and in teacher teamwork. An important issue is whether these needs can best be met through pre-service, or through school-based in-service, training. Opportunities for Professional Development
The National Policy on Education provides that “teacher education shall continue to take cognizance of changes in methodology and in the curriculum” and specifies that “teachers shall be regularly exposed to innovations in their profession”. It recognizes the need for in-service training “as an integral part of continuing teacher education” (Nigeria, 1998, p.34). There is however, a contrast between opportunities for upgrading and those for continuing professional development.
Programmes to up-grade qualifications are available and easily accessible to teachers in service from the variety of institutions already listed. The COEs offer sandwich programmes leading to the NCE by correspondence and vacation courses. Many universities offer part-time B.Ed. programmes. The NTI, as we have mentioned earlier, offers various upgrading programmes through distance education. Teachers themselves consider such programmes to be widely available (Aarons, 2003).
In the area of professional support through school-based in-service workshops, seminars and training programmes, however, there appear to be very limited
100
opportunities. Most teachers in the system have been never exposed to any form of such support programmes and for many, three is a feeling of abandonment to the frustrations and trials that today’s children have become. These results in loss of self-esteem and makes negative attitudes to pupils more likely. Aarons (2003) concludes from recent field studies that “a system of teacher development at school and school cluster level is at the core of improving teaching and learning” and “ could be the main source of professional development opportunities”.
The Private Costs of Training
Some of the obstacles to effective teachers education are matters of cost. In a survey of difficulties encountered by NCE sandwich teachers, exorbitant fees, high cost of materials for practical work, cost of transportation, the wide scope of the course offered and lack of facilities for practical work were identified. The survey observed too that, the more distant the teaching practice posting, the more acute the problems seem to be (NCCE, 1997).
Under the emotive heading, “teachers are paying for their own education”, Aarons (2003) documents the costs incurred by teachers in their education and training. In its sample of COE, the report finds that direct private costs for full-time NCE students in federal colleges range from N15,448 to N91,000 per annum, while in State colleges they range from N27,490 to N17,000. For upgrading to NCE through the part-time programme of NTI’s DLS, costs in the year 2000/01 varied between N27,830 in Imo State and N61,700 in Cross River State. It is noted that the base fee for the NCE DLS programme is N12,000 per annum, hence the additional costs are those incurred for levies, stationery, examination fees, tutorials, practice teaching sites, and so on. These costs have implications for access and raise the need to consider heavier subsidies to increase enrolment in teaching. Stipends have also been used in some countries for this purpose. As the profile of the average education student does not depict affluence, this is a critical issue for policy. Quality Assurance and Internal Efficiency Three factors which are considered important in determining standards in teacher education are the process of selection into training, the programme of study during training, and the institutional factors that relate to teacher preparation. Each of these factors will be considered in turn, with particular reference to the COEs.
Much has been written on the selection process for would-be teachers. The International Labour Organisation (ILO) recommends that teachers should be selected on the basis of moral, intellectual and physical qualities. In the UK, applicants must be seen in face-to-face situations and must be seen to possess certain personal qualities and characteristics before they are admitted for training (Lassa, 2000) Nigerian institutions have in the past varied in the criteria they have used, some being much more thorough than others (Urwick, 1987). In facing the realities of the present shortage of applicants,
101
COEs are certainly not likely to be rigorous about personal characteristics. The main emphasis of the NCCE is on prescribing the minimum academic qualifications mentioned earlier.
The regulation of the curriculum by the NCCE, described earlier, extends to the Pre-NCE Programme (i.e. the remedial programme). Standards are also prescribed in detail for institutional factors: staffing, physical facilities, administrative leadership, discipline and funding. All of these are widely considered to be critical for quality assurance (Lassa, 2000). The NCCE enforces these standards through periodic accreditation visits, and completed the second round of such visits in 2000-01.
Teacher Quality in schools
Overall, teacher quality at the primary level seems to be low, and this reflects on the various part-time and sandwich programmes in which many were trained. There are complaints that the teachers produced by these programmes can barely write an assignment. The fact that, even with increased availability of upgrading opportunities for the NCE, most teachers are upgrading to Teacher Grade II does not help matters. Since the Grade II is a stepping-stone to the NCE, it is expected that these teachers would eventually upgrade to NCE.
Teacher quality is no less reduced at the secondary and post-secondary levels. While at the secondary level the same upgrading phenomenon and lower quality output is evident, at the university level, the “brain drain” affecting the more able and experienced lecturers is a major problem. The reliance on inexperienced lecturers affects the quality of students’ work, and so of the lecturers of the future. This vicious circle contributes to the low status of Education faculties. However, attempts are being made to sharpen the skills of lecturers and to arm them with knowledge of fundamental concepts in teaching. Gender
Teaching is widely thought to be a predominantly female profession. For historical and cultural reasons, however, the northern and southern States continue to exhibit sharp contrasts in enrolment by gender in teacher education. Table 11.2 shows the situation affecting COE environment in five southern and five northern States, in two recent academic years.
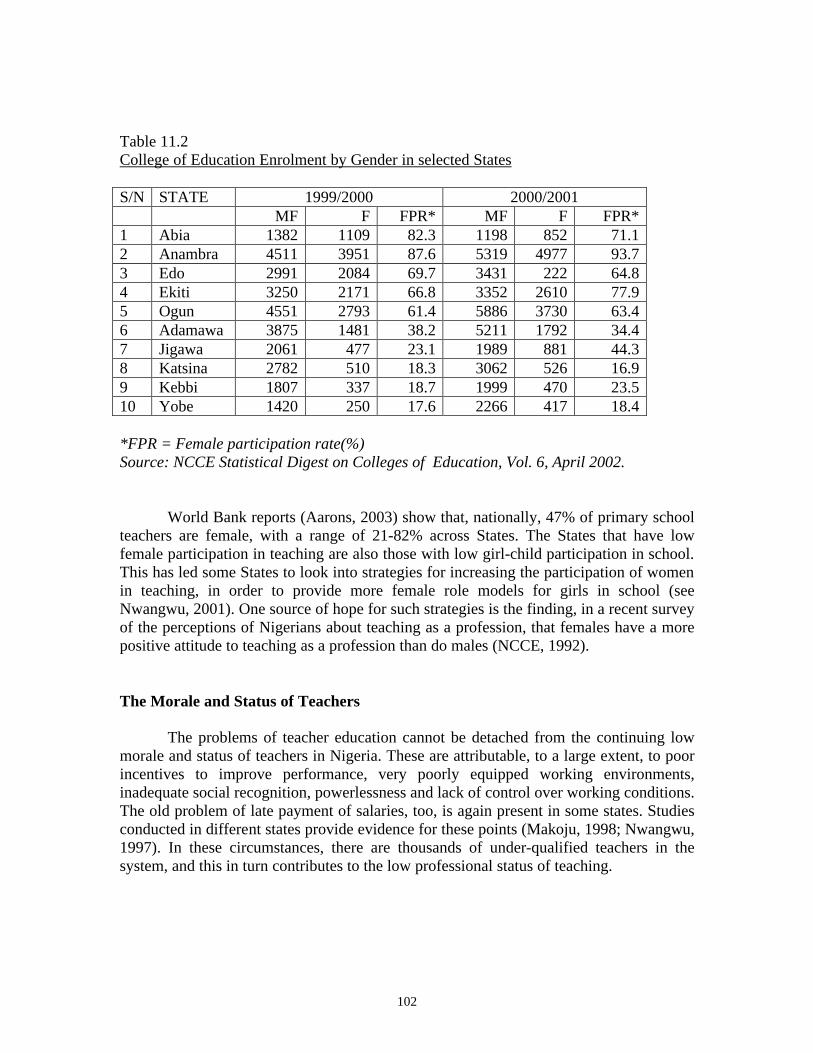
102
Table 11.2 College of Education Enrolment by Gender in selected States S/N STATE 1999/2000 2000/2001 MF F FPR* MF F FPR* 1 Abia 1382 1109 82.3 1198 852 71.1 2 Anambra 4511 3951 87.6 5319 4977 93.7 3 Edo 2991 2084 69.7 3431 222 64.8 4 Ekiti 3250 2171 66.8 3352 2610 77.9 5 Ogun 4551 2793 61.4 5886 3730 63.4 6 Adamawa 3875 1481 38.2 5211 1792 34.4 7 Jigawa 2061 477 23.1 1989 881 44.3 8 Katsina 2782 510 18.3 3062 526 16.9 9 Kebbi 1807 337 18.7 1999 470 23.5 10 Yobe 1420 250 17.6 2266 417 18.4 *FPR = Female participation rate(%) Source: NCCE Statistical Digest on Colleges of Education, Vol. 6, April 2002.
World Bank reports (Aarons, 2003) show that, nationally, 47% of primary school teachers are female, with a range of 21-82% across States. The States that have low female participation in teaching are also those with low girl-child participation in school. This has led some States to look into strategies for increasing the participation of women in teaching, in order to provide more female role models for girls in school (see Nwangwu, 2001). One source of hope for such strategies is the finding, in a recent survey of the perceptions of Nigerians about teaching as a profession, that females have a more positive attitude to teaching as a profession than do males (NCCE, 1992). The Morale and Status of Teachers
The problems of teacher education cannot be detached from the continuing low morale and status of teachers in Nigeria. These are attributable, to a large extent, to poor incentives to improve performance, very poorly equipped working environments, inadequate social recognition, powerlessness and lack of control over working conditions. The old problem of late payment of salaries, too, is again present in some states. Studies conducted in different states provide evidence for these points (Makoju, 1998; Nwangwu, 1997). In these circumstances, there are thousands of under-qualified teachers in the system, and this in turn contributes to the low professional status of teaching.
103
The task of improving teachers’ welfare and commitment to their work must be
sufficiently addressed in any policy reform framework. This is a matter of recognizing the significance of the services they render to the nation, since, as it has been observed, rightly, “the kind of teachers trained and posted to a school may well determined what the next generation of Nigerians will be” (Lassa, 2000). In the context of the UBE policy, it is particularly important to minimise the shortcomings of the past UPE programmes as far as teachers are concerned. In the planning process, as Urwick (1987, p.138) observes, due attention needs to be given to “the existing profile of teachers’ skills and qualifications, the cost of improving this profile and the existing size of the teaching force”. Milestones and Innovations in Teacher Education
Some innovations have been introduced to address the teacher issues raised in this chapter. With the UBE and EFA programmes mobilizing for greater participation of children in basic education, it is important that steps are taken to address the issues of teacher demand and supply, training, welfare and professionalism. The government in apparent moves to address these issues has through appropriate supervisory agencies, introduced several measures.
The Pivotal Teacher Training Programme (PTTP) was introduced to address the teachers shortfall of 279,411 identified in 1999 at the inception of UBE in apparent search for cost-effective alternatives for bridging the gap. The PTTP is a 15-month course including 12 weeks school experience and three-month internship in a primary school. The mode of teaching combines face-to-face contact at weekends and holidays, self-instruction course materials and school experience after which the candidate is qualified to teach.
A two-year capacity-building programme has just been introduced for teachers. This Teacher Corps programme will involve two years of compulsory post-training experience for teachers in an internship capacity.
At the university level, quality is being enhanced by the establishment of three pedagogical centres in selected universities to provide short courses for lecturers in principles and methods of teaching. The National Universities Commission is also involved in recording the teaching models of seasoned lecturers for use as model lessons for other lecturers.
The revitalization of the Teachers’ Registration Council (TRC) is another development for the teaching professional. It is believed that this move will raise the status of teaching as a profession.
104
Critical Issues
A major challenge in teacher education is to balance the demand and supply of teachers across the states. The reality at the moment is that some states are over supplied while others have barely enough teachers to staff half their schools. The National Policy on Education provides for teachers to work in any part of the country unrestricted. Is there a way perhaps of using the framework provided by this policy to redress the imbalance in teacher supply?
It is imperative that the welfare of teachers must be looked into to boost morale.
Perhaps other non-salary inputs may be explored. The quality of teacher training programmes by distance also need to be examined.
A specific case is the PTTP programme which leaves a lot to be desired in deliver across the centres.
105
CHAPTER TWELVE
UNIVERSITY EDUCATION The Idea of University Education The National Policy on Education (1998) reaffirms that universities, polytechnics/monotechnics and Colleges of Education are tertiary education institutions. The goals of tertiary education as specified in the Policy, in summary, are:
• To contribute to national development through relevant high-level manpower training.
• To develop and inculcate proper values for the survival of society.
• To promote scholarship, community service, national unity and international understanding.
Universally, the fundamental mission of universities is to promote the life of the mind through intellectual inquiry and to generate, store and transmit specialised knowledge and sophisticated expertise, higher forms of culture and ethical basis of conduct (Brubacher, 1982, p.12). Not all are capable of profiting from university education, but those who can, should have unhindered access.
In practical terms, universities pursue their universal mission through teaching, research, publication and community service. The distinguishing mark of the university in regard to teaching is award of degrees, which symbolises admittance of the learner to the international community of scholars who are perpetually engaged in the business of extension and sophistication of knowledge. In order to function properly, universities generally exercise self-regulation in academic matters. There is, however, in practice no single, immutable “idea” of the university, to be held in trust for all time in all societies by the corporate guardians of its purity. This is because the university necessarily exists in two worlds: the academic world in which they must maintain their core universal academic values and the civic society in which they are subject to the demands and influences of the polity and the cultures they serve. Universities in Nigeria have to achieve a balance between these two aspects of their mission.
Following its acceptance of the resolutions of the 2002 National Summit on Higher Education, the Federal Government has action plans to “review the policy and mandates of polytechnics and colleges of education to enable them award degrees subject to the availability of appropriate human and material resources”. Thus, Nigeria is considering adopting a three-stream system of higher education. However, it remains to be made clear in due course, whether the academic bureaucracy of the polytechnics and colleges
106
of education would enable them award degrees independently or whether the professorial system of the universities will be adopted.
Given the new policy position of the Federal Government, a variety of avenues for degree studies will become available. These will include: local universities, polytechnics and monotechnics, colleges of education, National Open University and study in universities abroad. This chapter discusses the polytechnics/monotechnics and colleges of education only in passing, as they are covered more fully in chapters 10 and 11 of this report.
The National Open University of Nigeria (NOUN) was resuscitated in 2001 to provide expanded access to university education through a distance learning mode that is flexible, cost-effective, affordable and open to those who qualify but, for reasons of their living conditions, cannot attend the traditional universities. So far, NOUN has focused on putting in place it’s academic and administrative infrastructures and is admitting its pioneer students in 2003 for about 70 different programmes in the arts, humanities, sciences and technology at diploma, bachelors and masters degree levels.
Alongside universities, there is the rising competing phenomenon of professional training schools (e.g. in accountancy and business professions) and also the recognition of professional qualifications in the public service. In this chapter, such professional schools are not considered. Trends in the Development of University Education in Nigeria Three ideological positions may be discernable in the universities in Nigeria. As explained by Faure, et al (1972, p. 56), they are:
• Idealism: which considers that the university exists in and for itself and therefore must be autonomous in all respects and thus supply-driven in its high-level manpower production. Operations rationalization should not be effected; the status quo should not change. The university must be free from the demands of the polity. That is, its relevance to the society must not be looked into. This position incited the protest against Federal Government receiving World Bank credit facility of US $120 million in 1990 to improve the quality of university education (FME, 1990).
• Mechanistic determinism: which represents the position that universities are directly controlled by, or is a reflection of the society. The universities being subsystems of society have no power to effect social change on their own. Corrupt practices, the struggle for “filthy lucre” or cultic practices in the universities are effects of the influence of society for which universities are not responsible. Let society change and the universities will change; the university alone cannot change the society. Indeed, in 1998 the National Association of Pro-chancellors took the position that “the crisis in the universities today emanates from indiscipline in the larger society”.
107
• Voluntarism: which insists that the university is for national development to meet stiff international competition, and respond to the challenges of trade liberalisation, globalisation and technological change. Accordingly, its high-level manpower production should be demand-driven. The university must be deliberately managed to be result-oriented to meet social expectations. This appears to be the position of government, the society and the progressive elements of universities. On this basis the universities themselves have proposed their reform measures.
Phases in the development of Nigerian universities have been conditioned by these ideologies, government policies and economic conditions. It is to be noted that when the expanding colonial administration needed more indigenous high-level manpower, which “study abroad” was not the best means to provide, the idea of the University College, Ibadan, as a satellite campus of the University of London was conceived. The University College, Ibadan, started in 1948 with only 104 students it inherited from Yaba College. Subsequent enrolments were small because of the limited employment capacity in the public service. Administrative officers were mostly required then. Therefore, enrolment was more in the humanities and classics. After about a decade of slow growth and restrictive admission practice, Ibadan was considered to be inadequate for the needs of an independent Nigeria. The University of Nigeria, Nsukka, was established in 1960. Other universities were established in Ife, Lagos and Zaria in 1962 and in Benin in 1970. They all became federal institutions after the civil war.
Regional rivalries of damaging nature heightened from 1960 to 1966 when they culminated in the civil war. When the civil war was over in 1970, the new 12-State structure of Nigeria created by the Gowon Administration in 1967 brought about new educational realities. Both the Federal and State Governments were expanding rapidly. There was need for more high-level manpower to hold controlling positions in the federal and state services and in the growing private and public sector economy due to oil boom. Therefore, the struggle for federal character representation in the federal service and with it, the logic of quota admission in the federal universities took the centre stage. The oil boom decade gave the impetus to the Federal Government to establish at once 7 (seven) more federal universities in 1975: Jos, Calabar, Kano, Maiduguri, Sokoto, Ilorin and Port-Harcourt as second generation federal universities. Some of these universities were taken-over from State Governments to meet their needs. The Federal Government apparently had “unlimited” financial resources to meet the needs of these universities then. Therefore the new universities were planned to have large campuses, grandiose buildings and expensive municipal facilities. Besides, they needed enormous teaching staff outlay which demanded poaching from existing universities as well as expatriates recruitment - all of which the economy could not afford soon after their take-off.
In order to enforce quota admission as a check to educational imbalance and to rationalize the admission process, JAMB was created in 1977. In addition, the Federal Government by Private Universities (Abolition and Prohibition) Act No. 19 of 1984 transferred the provision of university education from concurrent legislation to the exclusive legislation. From that time, the agitation on the part of the southern states to establish state universities on political and economic grounds took the centre stage. The
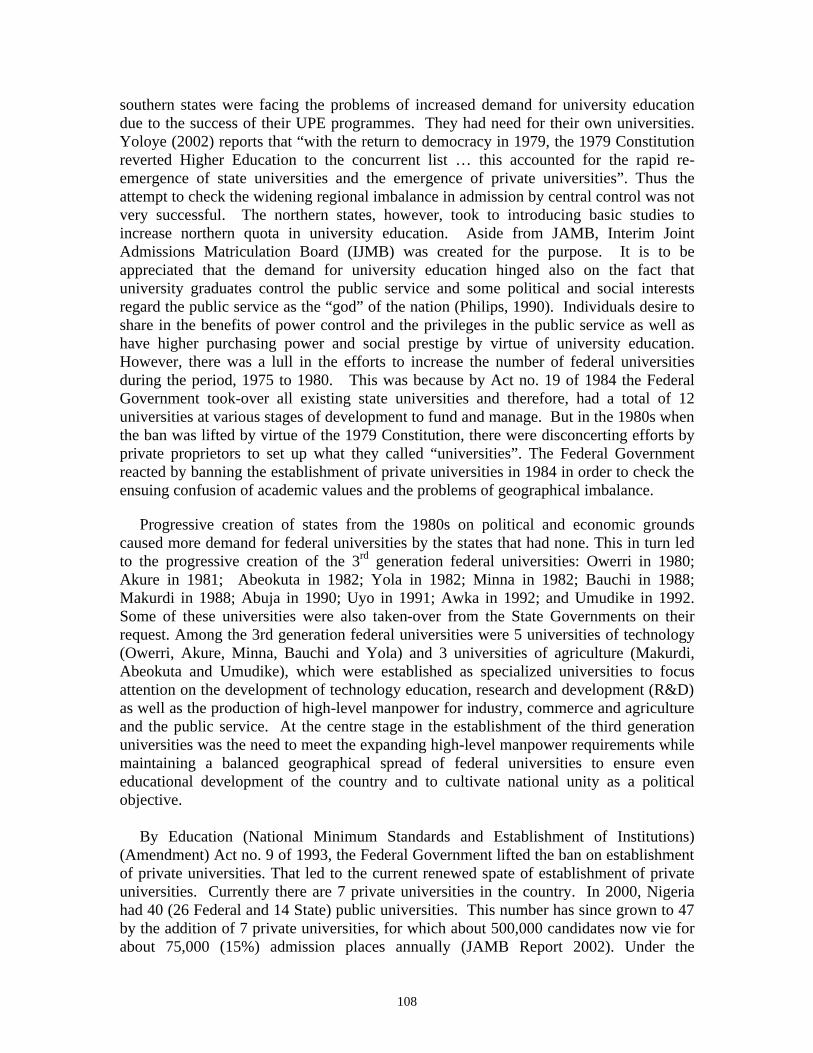
108
southern states were facing the problems of increased demand for university education due to the success of their UPE programmes. They had need for their own universities. Yoloye (2002) reports that “with the return to democracy in 1979, the 1979 Constitution reverted Higher Education to the concurrent list … this accounted for the rapid re-emergence of state universities and the emergence of private universities”. Thus the attempt to check the widening regional imbalance in admission by central control was not very successful. The northern states, however, took to introducing basic studies to increase northern quota in university education. Aside from JAMB, Interim Joint Admissions Matriculation Board (IJMB) was created for the purpose. It is to be appreciated that the demand for university education hinged also on the fact that university graduates control the public service and some political and social interests regard the public service as the “god” of the nation (Philips, 1990). Individuals desire to share in the benefits of power control and the privileges in the public service as well as have higher purchasing power and social prestige by virtue of university education. However, there was a lull in the efforts to increase the number of federal universities during the period, 1975 to 1980. This was because by Act no. 19 of 1984 the Federal Government took-over all existing state universities and therefore, had a total of 12 universities at various stages of development to fund and manage. But in the 1980s when the ban was lifted by virtue of the 1979 Constitution, there were disconcerting efforts by private proprietors to set up what they called “universities”. The Federal Government reacted by banning the establishment of private universities in 1984 in order to check the ensuing confusion of academic values and the problems of geographical imbalance.
Progressive creation of states from the 1980s on political and economic grounds caused more demand for federal universities by the states that had none. This in turn led to the progressive creation of the 3rd generation federal universities: Owerri in 1980; Akure in 1981; Abeokuta in 1982; Yola in 1982; Minna in 1982; Bauchi in 1988; Makurdi in 1988; Abuja in 1990; Uyo in 1991; Awka in 1992; and Umudike in 1992. Some of these universities were also taken-over from the State Governments on their request. Among the 3rd generation federal universities were 5 universities of technology (Owerri, Akure, Minna, Bauchi and Yola) and 3 universities of agriculture (Makurdi, Abeokuta and Umudike), which were established as specialized universities to focus attention on the development of technology education, research and development (R&D) as well as the production of high-level manpower for industry, commerce and agriculture and the public service. At the centre stage in the establishment of the third generation universities was the need to meet the expanding high-level manpower requirements while maintaining a balanced geographical spread of federal universities to ensure even educational development of the country and to cultivate national unity as a political objective. By Education (National Minimum Standards and Establishment of Institutions) (Amendment) Act no. 9 of 1993, the Federal Government lifted the ban on establishment of private universities. That led to the current renewed spate of establishment of private universities. Currently there are 7 private universities in the country. In 2000, Nigeria had 40 (26 Federal and 14 State) public universities. This number has since grown to 47 by the addition of 7 private universities, for which about 500,000 candidates now vie for about 75,000 (15%) admission places annually (JAMB Report 2002). Under the
109
persistent economic depression, universities took to setting up satellite campuses as their auxiliary businesses to cushion the effects of poor pay of lecturers, to increase their internally generated revenue and to serve the under-served clientele and communities. The wild spread of satellite campuses, however, became a matter of serious concern to the Federal Government as most of them exhibited the tendency to exploit students and with a lowering of academic standards. In 2002, the National Council on Education (NCE) banned the existence of satellite campuses located more than 30 kilometres away from the parent campuses in order to restore sanity in university education. When the Federal Government defined educationally disadvantaged states in 1983 for the purpose of redressing educational imbalance, the states that were excluded by such a definition redefined educational disadvantage in terms of shortage of university places in relation to qualified candidates. This was their justification for establishing state universities (Yoloye, 2002) in order to meet their local demand and political expediency. “Study abroad” programmes in respect of university education are not a significant concern of the government outside available overseas scholarships from Commonwealth and other countries. This is mainly because the depreciating value of the local currency makes the cost of overseas studies on a large scale unaffordable. Available statistics indicate that between 2001 and 2002, Nigeria received only 174 foreign awards. However, study abroad has always been a private interest of the Nigerian elites. Due to the various crises in the universities (disruption of academic programmes by frequent strike action, prolonged poor funding, indiscipline, mismanagement and attendant poor academic quality) a minority of Nigerians seek to send their children abroad for university education. According to UNESCO estimates in 2003 about 7,700 Nigerians are currently studying in various countries abroad. This figure, however, gives an incomplete picture as it only covers the main destinations. The Federal Government Scholarship Scheme which was stopped during the military era was resuscitated in 2000. The awards made so far focus on indigent students in the tertiary institutions. In the 2001/02 academic session, a total of 12,068 awards costing about N532 million was made while in the 2002/03 academic session, a total of 16,684 awards costing about N716 million was made. That is, by 2003 the Federal Government has expended about N1,248 million on 28,752 awards. Participation in University Education. The rate of output from senior secondary schools nationwide has been on the increase from 196,819 in 1990 to 636,064 of those who took SSCE/GCE conducted by WAEC in 2000, that is, an annual increase of about 20% (WAEC, 2003/FGN, 2000, p.154). In 2001, a total of 842,072 candidates made up of 494,001 (59%) males and 348,071 (41%) females took JAMB examinations for admission into the universities but only 95,199 (11.3%) candidates made up of 57,993 (61%) males and 37,206 (39%) females secured admission through JAMB, a small proportion of secondary school. In terms of field of study and gender in 2000, the spread of enrolment was as indicated in Table 12.1 below.
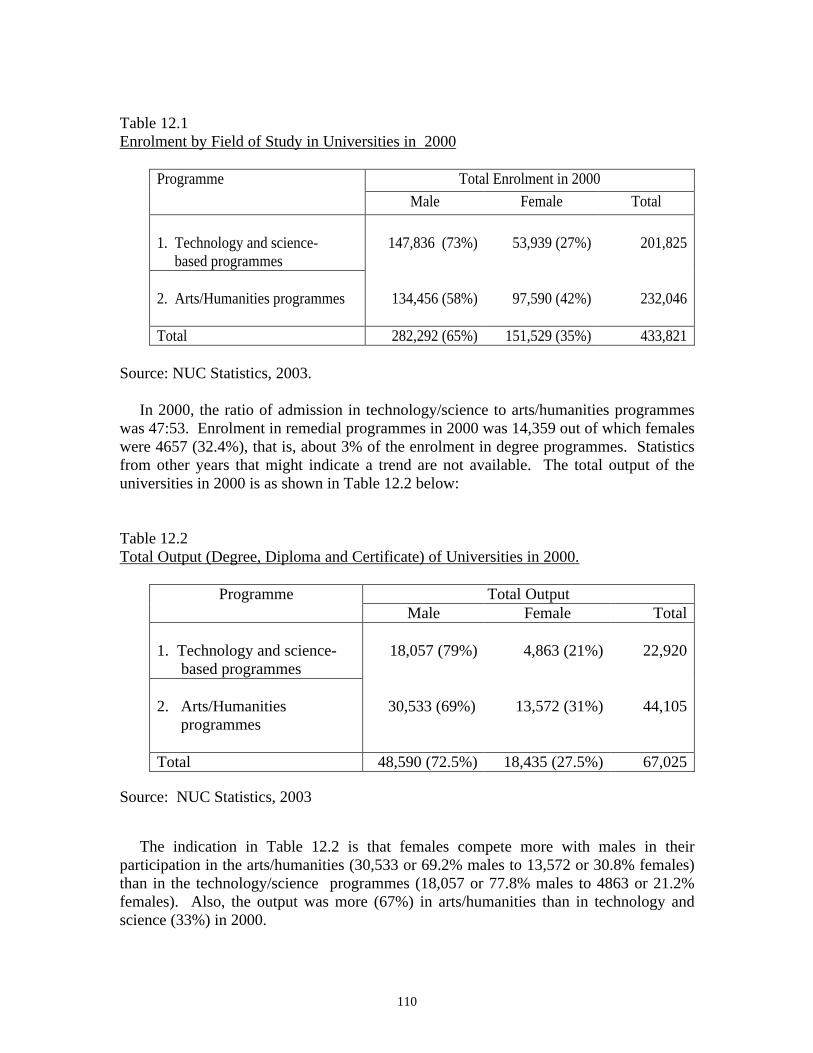
110
Table 12.1 Enrolment by Field of Study in Universities in 2000
Total Enrolment in 2000 Programme Male Female Total
1. Technology and science- based programmes
147,836 (73%)
53,939 (27%)
201,825
2. Arts/Humanities programmes
134,456 (58%)
97,590 (42%)
232,046
Total 282,292 (65%) 151,529 (35%) 433,821
Source: NUC Statistics, 2003. In 2000, the ratio of admission in technology/science to arts/humanities programmes was 47:53. Enrolment in remedial programmes in 2000 was 14,359 out of which females were 4657 (32.4%), that is, about 3% of the enrolment in degree programmes. Statistics from other years that might indicate a trend are not available. The total output of the universities in 2000 is as shown in Table 12.2 below: Table 12.2 Total Output (Degree, Diploma and Certificate) of Universities in 2000.
Total Output Programme Male Female Total
1. Technology and science- based programmes
18,057 (79%)
4,863 (21%)
22,920
2. Arts/Humanities
programmes
30,533 (69%)
13,572 (31%)
44,105
Total 48,590 (72.5%) 18,435 (27.5%) 67,025
Source: NUC Statistics, 2003
The indication in Table 12.2 is that females compete more with males in their participation in the arts/humanities (30,533 or 69.2% males to 13,572 or 30.8% females) than in the technology/science programmes (18,057 or 77.8% males to 4863 or 21.2% females). Also, the output was more (67%) in arts/humanities than in technology and science (33%) in 2000.
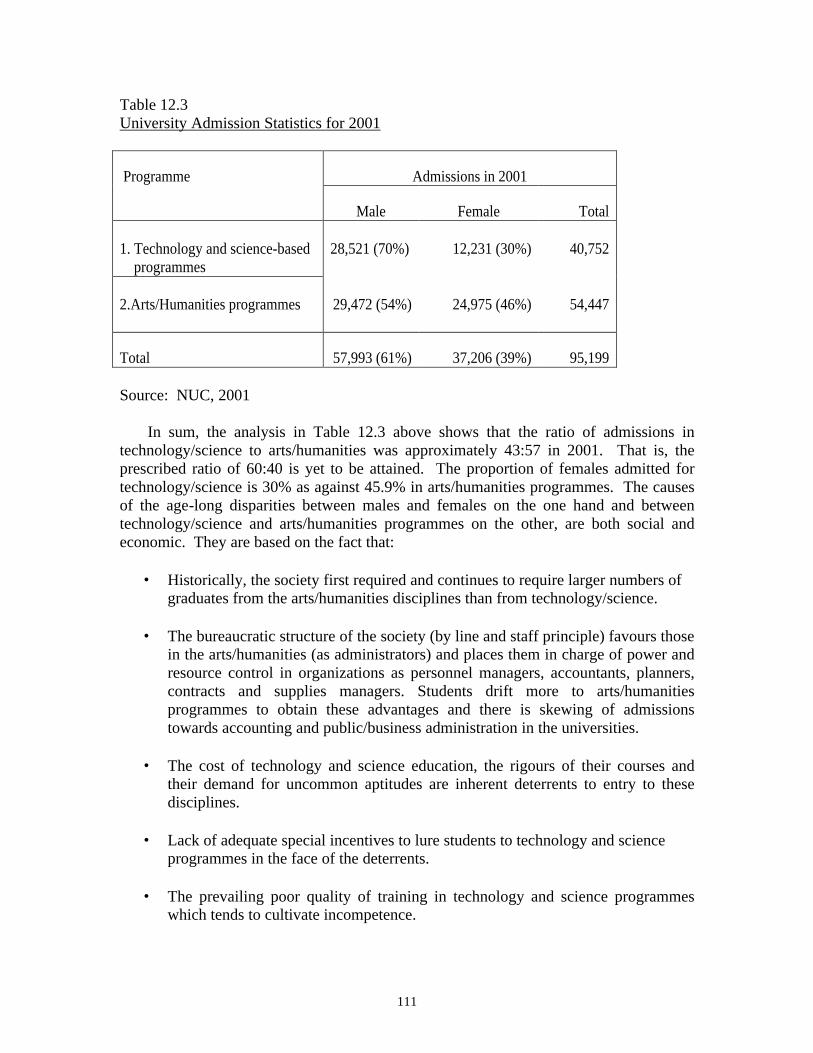
111
Table 12.3 University Admission Statistics for 2001
Admissions in 2001 Programme
Male Female Total 1. Technology and science-based programmes
28,521 (70%)
12,231 (30%)
40,752
2.Arts/Humanities programmes
29,472 (54%)
24,975 (46%)
54,447
Total 57,993 (61%) 37,206 (39%) 95,199 Source: NUC, 2001 In sum, the analysis in Table 12.3 above shows that the ratio of admissions in technology/science to arts/humanities was approximately 43:57 in 2001. That is, the prescribed ratio of 60:40 is yet to be attained. The proportion of females admitted for technology/science is 30% as against 45.9% in arts/humanities programmes. The causes of the age-long disparities between males and females on the one hand and between technology/science and arts/humanities programmes on the other, are both social and economic. They are based on the fact that:
• Historically, the society first required and continues to require larger numbers of graduates from the arts/humanities disciplines than from technology/science.
• The bureaucratic structure of the society (by line and staff principle) favours those
in the arts/humanities (as administrators) and places them in charge of power and resource control in organizations as personnel managers, accountants, planners, contracts and supplies managers. Students drift more to arts/humanities programmes to obtain these advantages and there is skewing of admissions towards accounting and public/business administration in the universities.
• The cost of technology and science education, the rigours of their courses and
their demand for uncommon aptitudes are inherent deterrents to entry to these disciplines.
• Lack of adequate special incentives to lure students to technology and science
programmes in the face of the deterrents.
• The prevailing poor quality of training in technology and science programmes which tends to cultivate incompetence.
112
• Culture stereotyping which excludes women from some occupations. Quantity and Quality in University Education
The National Policy on University Education sets out the cardinal goals as follows:
• To provide self-reliant high-level manpower for national development;
• To develop Nigeria as a united nation with an enlightened ethical citizenry;
• To promote the cause of knowledge through research and scholarship.
The available evidence is that university education in Nigeria had a good beginning from the colonial times and was effective up to the 1970s as an instrument for national development until its nature changed by mass admission from the 1980s. In 1980, total enrolment in the universities was 73,425, but by 1990, enrolment had grown to 180,871, an increase of 246%. Quality fell as an effect of greater numbers of students in the face of diminishing resource input due to worsening economic recession. As stated in this chapter, the 1979 Constitution returned education to concurrent legislation and that ushered in a new era of state and private universities. Unfortunately, by that time, the economic recession had set in. But the 13 federal universities in existence then had set the tradition of campus construction with high profile projects. When economic recession made it impossible for the Federal Government to fund the universities as adequately as in the oil boom era, the universities were thrown into the crisis of facilities dilapidation, project abandonment and unprofessional conduct by staff. FME (1990) reports that: “as student enrolment in the federal universities grew from 97,631 in 1982/83 to about 134,532 (138%) in the 1988/89 academic session … the overall result … was the fall in the quality of university education”. Government has noted further that: “Tertiary institutions have failed to perform optimally in varying respects … Students complete degree programmes without actually becoming knowledgeable in the courses undertaken… the quality of the turn out appear suspect as a very high percentage of graduates have been found to be unable to meet the manpower requirements of vital sectors of the economy” (Federal Ministry of Finance, 2000, pp. 105 and 108). The other factors responsible for the dwindling quality of university education were:
• Introduction of Structural Adjustment Programme (SAP) in 1986 which led to the devaluation of the local currency, high inflation, and decrease in real terms of budgetary allocations to the universities.
• Severe academic staff shortage due to the flight of some lecturers from existing universities to the newly established ones or to universities abroad in search of better prospects.
113
This contrasts with the high reputation that university education in Nigeria enjoyed before the 1980s. The current situation can be gauged from the results of the accreditation exercise carried out by NUC in 1999/2000. Out of 1,198 programmes visited only 136 (11.4 %) obtained full accreditation; 869 (72.5%) had interim accreditation while 193 (16.1%) were denied accreditation. The NUC has put the cost (recurrent and capital) of remedying the various deficiencies in all the federal universities at about N83.5 billion while that of the state universities is put at N19.1 billion making a total system-wide requirement of about N102.6 billion. This is about 115% of Mr. President’s proposed N89.24 billion national budget (recurrent and capital) for 2003. Government has also noticed the “increasing incidents of corruption and lack of integrity within the system …, which undermine the quality of the output of the system (Federal Ministry of Finance, 2000, p. 110). It is also said that the bane of the Nigerian universities is poor staffing. In the 1990s Government observed that the numerical strength of the non-academic staff particularly the junior cadre, was far in excess of requirements for efficiency and effectiveness, (FME, 1990). Okebukola (2002, p. 16) reported a high load of administrative and technical staff that constituted about 76% of staff strength in most federal universities. At the same time, system-wide, there were severe shortages of academic staff to the extent that some universities could not run their post-graduate programmes (see Table 12.4). The overload of the system with non-academic staff implies unjustifiable levels of cost. However, efforts by government since the 1990s to rationalise staffing have not been successful. Indeed, some universities that attempted staff rationalisation process in the 1990s were deterred by their inability to pay terminal entitlements. But this remains a sore point in the university system.
Table 12.4 below gives an analysis of the shortfall in academic staff in the Nigerian universities in 2000. By 2000 NUC statistics, there was a total of 18,328 academic staff to look after 433,871 students and by NUC staffing norms, a total of 33,951 should be in the system. Therefore, the academic staff shortfall was 15,718 (46%) in the Nigerian universities in 2000.
The Root Problems of University Education in Nigeria
It has been observed that university education in Nigeria is in a state of decay (FME, 2000, p.1). Government is aware that the situation portends danger to the country particularly as poor quality graduates who may not be able to effectively hold executive positions in the public service in the future are currently being produced. The decay manifests variously as staff and student indiscipline, poor remuneration and poor service conditions, dilapidated facilities, bad administration, poor funding, enrolment expansion beyond the capacity of facilities, cultism, examination malpractice, strike action, crises of succession of vice-chancellors, sexual harassment, drug abuse and apathy to work and learning. Among the multifaceted problems of the Nigerian universities, cultism, examination malpractice and conflict between staff unions and management appear to pose the greatest danger to the future of Nigeria (on cultism, see Yoloye, 2002, p. 106).
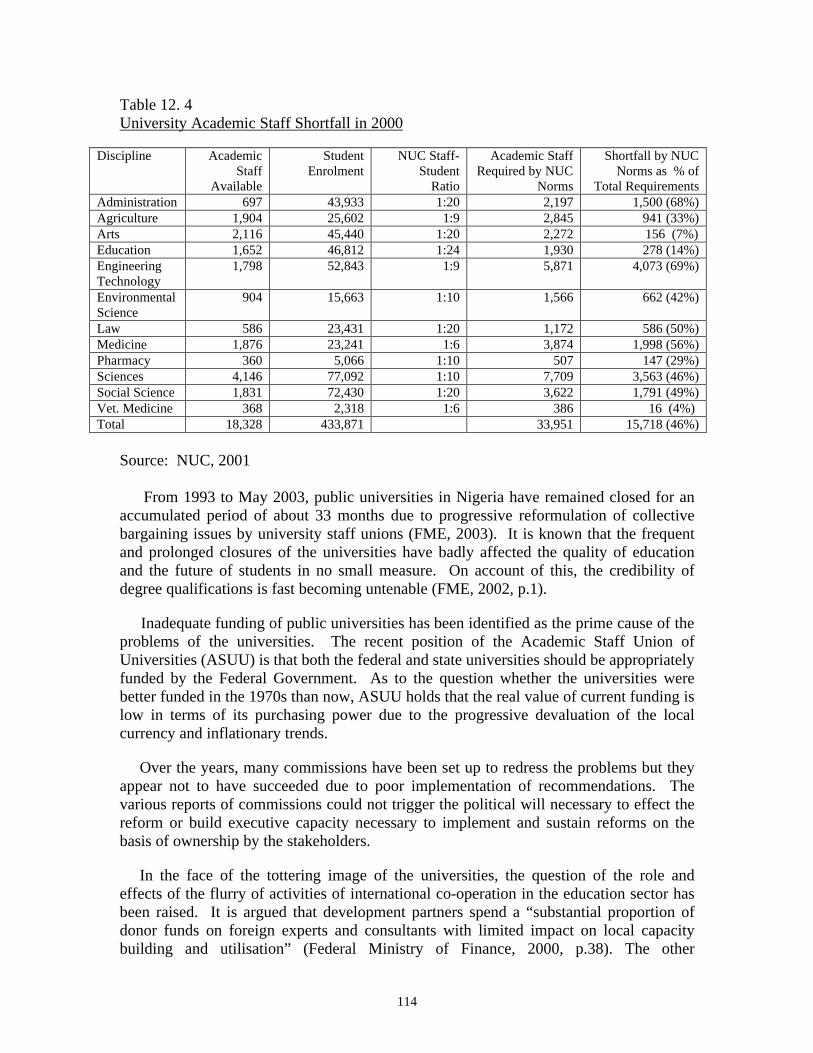
114
Table 12. 4 University Academic Staff Shortfall in 2000
Discipline Academic Staff
Available
Student Enrolment
NUC Staff-Student
Ratio
Academic Staff Required by NUC
Norms
Shortfall by NUC Norms as % of
Total Requirements Administration 697 43,933 1:20 2,197 1,500 (68%) Agriculture 1,904 25,602 1:9 2,845 941 (33%) Arts 2,116 45,440 1:20 2,272 156 (7%) Education 1,652 46,812 1:24 1,930 278 (14%) Engineering Technology
1,798 52,843 1:9 5,871 4,073 (69%)
Environmental Science
904 15,663 1:10 1,566 662 (42%)
Law 586 23,431 1:20 1,172 586 (50%) Medicine 1,876 23,241 1:6 3,874 1,998 (56%) Pharmacy 360 5,066 1:10 507 147 (29%) Sciences 4,146 77,092 1:10 7,709 3,563 (46%) Social Science 1,831 72,430 1:20 3,622 1,791 (49%) Vet. Medicine 368 2,318 1:6 386 16 (4%) Total 18,328 433,871 33,951 15,718 (46%)
Source: NUC, 2001 From 1993 to May 2003, public universities in Nigeria have remained closed for an accumulated period of about 33 months due to progressive reformulation of collective bargaining issues by university staff unions (FME, 2003). It is known that the frequent and prolonged closures of the universities have badly affected the quality of education and the future of students in no small measure. On account of this, the credibility of degree qualifications is fast becoming untenable (FME, 2002, p.1).
Inadequate funding of public universities has been identified as the prime cause of the problems of the universities. The recent position of the Academic Staff Union of Universities (ASUU) is that both the federal and state universities should be appropriately funded by the Federal Government. As to the question whether the universities were better funded in the 1970s than now, ASUU holds that the real value of current funding is low in terms of its purchasing power due to the progressive devaluation of the local currency and inflationary trends.
Over the years, many commissions have been set up to redress the problems but they appear not to have succeeded due to poor implementation of recommendations. The various reports of commissions could not trigger the political will necessary to effect the reform or build executive capacity necessary to implement and sustain reforms on the basis of ownership by the stakeholders.
In the face of the tottering image of the universities, the question of the role and effects of the flurry of activities of international co-operation in the education sector has been raised. It is argued that development partners spend a “substantial proportion of donor funds on foreign experts and consultants with limited impact on local capacity building and utilisation” (Federal Ministry of Finance, 2000, p.38). The other
115
consideration is that more attention has been paid by international development partners to the lower levels of education, to the virtual exclusion of the university education sector. The rule that “where education as a whole is backward, effort is most rewarding when it is directed to higher levels” (Asquith, 1945, p.12) seems not to have been given adequate consideration. Government is aware that the economy is developed by quality high-level manpower produced by the universities. The risk of EFA then lies in its capability of raising the desires for higher education, but without concomitant capability of the country to meet those desires in universities for failure of executive capacity. The challenge now is to reverse this risk through capacity development by the universities.
The Asquith Commission (1945) idea of university education prevailed as the Ibadan model until the ingress of American model through the University of Nigeria, Nsukka in 1960. The idea of Ibadan was the production of “English gentlemen”: the generally educated persons who by the exercise of their disciplined mind would function in and direct any situation, professional or otherwise. But the idea of the University of Nigeria, Nsukka, rested on the spirit of emergent nationalism and vocationalism with liberal education. At the inception, there was open social clash between the two paradigms. Strong criticisms of offering inferior degree qualifications were made against Nsukka. However, not too soon afterward, the Nsukka model prevailed in Nigeria with its course system, continuous assessment, general education studies and utilitarian orientation. Nevertheless, the NUC has noted that, “over 40 years of existence the 30 universities in Nigeria cannot be said to have evolved a readily identifiable uniform system” unlike the over 3,280 universities and colleges in the United State of America (NUC, 2002, p.1). The challenge now for the universities is to create a system of uniform practice to provide for programme articulation and credit transfer, to keep the system open and flexible in line with the economic and political objectives of the nation.
Perhaps no other indicator could be more symptomatic of the sorry state of universities than the problem of lack of books and journal materials for research work, particularly in technology and science. Prima facie, the situation would look like a sign of failure to meet the cardinal objective of being the generator and storehouse of knowledge. The dependence of Nigerian universities on their foreign counterparts for books and journals, though defensible from the point of view of universal sharing of knowledge, is not defensible from the point of view of not making adequate contributions to the world of books and journals as a storehouse of knowledge. The plight of universities in book production in science and technology may be understood by reference to the difficulties of having financial resources to meet production cost. Books on technology and science have a narrow sales market and are unprofitable ventures. In the circumstances, it would seem advisable that government should bear the cost under a special trust fund in support of book production in technology and science fields. As highlighted already, the problems of poor funding started with the collapse of the international oil market in the early 1980s and the consequent depression of the Nigeria economy. Before that time, the country had taken off with the idea of government-driven economy, extensive economic development, encouragement of the attitude of dependence on government, massive importation of luxury goods and conspicuous mass consumption. The private sector, although growing, had neither scope nor the capacity to
116
support government then. The public sector lacked executive capacity which resulted in “poor policy conception, unclear direction, inconsistencies and confusion, (FMF, 2000, p. 14). On the part of the 13 existing universities then, there was the irresistible political and economic demand for expansion of enrolment but without expansion of physical facilities to match. When the oil boom receded, there was no way government could immediately reverse the attitudes and habits of the people or stop the essential capital intensive economic projects that had already taken-off. Government failed to meet the expanding consumption capacity of the economy. For the universities, the net effects were drastic budget cuts, academic staff shortages due to brain drain, lack of library books and journals, the decline of reading culture among students while their aspiration to obtain degrees even by unorthodox means heightened. Facilities broke down without repair or replacement and quality fell (FME, 1990). The Federal Government tried ad hoc measures of injecting extra-budgetary allocations to no avail because the demands of the universities were even known to exceed national budgets then. On staffing, the Federal Government established the Nigeria Expatriate Supplementation Scheme (NESS) which started in 1976 as British assistance but was later taken over and expanded by Government. It operated for some time and then died, due to the depreciating value of the naira, in spite of the support of US $52 million from a World Bank credit facility in 1990. Government could not meet the increasing foreign exchange demands of the scheme. Current Reform Efforts and New Initiatives From the foregoing highlights, the problems of the Nigerian universities could be linked to four prime factors:
• The development of public universities on the basis of dependence on government funding over the years.
• The tradition of expensive development of university facilities.
• The cultural tendency of those in authority to make life difficult, so that normal
rights are not dispensed except by agitation and grim struggle of the beneficiaries, as now captured in the slogan, “la luta continua” (the struggle continues) by staff and students.
• Inadequate executive capacity of those in authority to manage the universities, not
by tradition and experience, but by professional management knowledge. Government sees the response to the attitudinal problem as one of restoring to the universities full autonomy and changing the culture of management from tradition and experience to the use of professional knowledge and skills, acquired through deliberate training of university teachers and managers. Government has therefore accepted to implement the resolutions of the 2002 National Summit on Higher Education that:
117
• All new entrants into the management of higher education institutions should be exposed to appropriate senior management training programmes in order to enhance efficiency.
• New entrants into academic positions should be exposed to pedagogical training
and be properly supervised. For this purpose government is to establish national higher education pedagogy centres for training of lecturers and managers of higher education institutions including universities.
University autonomy is essential to the resolution of the problems of universities. According to Professor P. Okebukola (2002, p. 54), “university autonomy as envisaged by government is a shift in the locus of certain aspects of control and decision making from government and its agencies to the university campus – notably council, senate and management. Autonomy will thus involve the restoration of academic, administration and financial “freedom to all federal universities under the general policy guidelines of government”.
It is known that the problems of funding and management have taken the greatest toll of the universities from the 1980s. The present administration inherited these problems when it assumed office in May 1999. The administration took up the issue of funding and particularly addressed staff remuneration. It has given increased attention to the funding of capital projects within the limits of available resources. Following negotiations with staff unions in 1992 and 1995, a new university staff salary scale was adopted with a variety of fringe benefits. Government is negotiating with ASUU on their demand for full implementation of all collective bargaining agreements. ASUU is yet to shift grounds for a new agreement in the face of economic realities as the Federal Government, the proprietor of federal universities, has done.
In order to build executive capacity, the current mode of operation of government is to consult academics widely on all matters of policy. Government is refocusing its efforts to empower the universities to contribute to and sustain national development. In line with government efforts, the NUC has assumed the challenge of institutionalizing “total quality management” in the universities. It has created for itself the vision and mission “to be a dynamic organization, acting as a catalyst for positive change and innovation, for the delivery of quality university education in Nigeria and ensuring a stable, adequately funded and sustainable university system that will produce globally competitive graduates and world-class research, relevant to national development”. NUC has assumed this positive leadership role, which has been the missing dimension over the years of decay. Its strategic goals for the period 2002-2007 have been set accordingly.
Already, with the strong support of the Federal Government, NUC has introduced new initiatives to stimulate quality university system. These include: virtual library, best practice in university teaching, Nigerian universities management information system (UMIS). Nigerian Universities Network (NUNET), Nigerian universities computer literacy programme (compulit), E-learning, university system annual merit award scheme, pedagogic and management training programme for university staff and managers and database of experts in higher education.
118
A crucial orientation in university education is the idea of entrepreneurial education and auxiliary businesses for the purpose of adequate training of students, and self–sustenance of universities. It is clear that government alone cannot meet the multifarious needs of the universities. Perhaps the future development of this idea in the context autonomy could lead to the resuscitation of the idea of “matching grants”. University autonomy and stability might not be realisable in the context of complete dependency on government funding. Following the resolutions of the 2002 National Summit on Higher Education, an action plan has already been drawn for the implementation of the resolutions. Actual implementation of some aspects of the action plan is currently on course. There is hope that subject to availability of funds, when the action plan is fully implemented within the 5-year period set for it, university education will recapture its original quality. The Way Forward The root causes of the current problems of the Nigerian universities are well known as indicated above. The 2002 National Summit on Higher Education had addressed the identified problems and proffered solutions for which government has worked out implementation plans. The way forward to the restoration of normalcy in the university system appears to be through implementation of the plan of action. In addition, it may be necessary to consider that:
• The existing rigidities in the university education system which serve to hinder students’ academic mobility, should be relaxed by the adoption of the practice of programme articulation and credit transfer, as is characteristic of university education in other countries.
• The study of all types of technology should culminate in the university, as the
mission of the university is to generate and transmit specialised knowledge and sophisticated expertise. Therefore, all forms of study in technology should have a place in the university. For this reason, garment making, catering, carpentry, furniture making, plumbing, welding technology and other types of technologies hitherto excluded should have a place as studies in their own right in the university in the same way as philosophy or history.
• A book policy should be developed whereby the cost of book production
particularly in technology and science is borne by government under special copyright agreement to that effect. This is because books in technology and science have discouragingly narrow and unprofitable sales market and some authors do not have the capacity to fund their book production. For this reason, a National Book Trust Fund should be set up in NERDC to manage technology and science book production for which government should bear the cost.
119
• A national effort should be launched to address factors hindering female participation in technology and science education in the universities.
• The funding of physical development and operation of public universities should
be on the basis of student per capita costs developed by the NUC from time to time and optimum student population.

120
121
CHAPTER THIRTEEN
EDUCATIONAL FINANCE Historical Perspectives
The 1970s were a period of unprecedented economic growth and educational expansion in Nigeria because of the oil boom. The country had enjoyed adequate funding by the Federal Government until 1975, but government programmes were tied to the budget, which itself was overly dependent on petroleum export. The period after 1979 was characterised by general economic crisis and decline of the share of public expenditure received by education. This was partly because of the world-wide economic recession of the 1980s, which resulted in a decline of public expenditure in many countries.
Expenditure on education suffered a large decline in real terms in the first half of
the 1980s, as a result of the sharp fall in oil earnings at the time. Since then there has been little or no recovery and in 1998, federal expenditure on education in real terms was only 23% of its level in 1980 (NPC/UNICEF, 2001, p.164). The decline in expenditure per pupil has been even steeper because of the large increase in the school-age population and school enrolment over the past two decades. Also, since the mid-1980s, there has been a steep decline in capital expenditure. Thus, capital expenditure on education in 1996-98 was on the average less than 17% of its average level in 1980-82. In the 1990s recurrent expenditure accounted for about 75% of total federal expenditure on education and the bulk of this was for staff emoluments. This expenditure pattern has also been typical at the state level.
The precarious condition of the education sector partly stems from the
unanticipated effects of the structural adjustment programme, introduced in 1987 to address distortions in the economy and improve the system of economic management. This led to a reduction in government support to the sector. Other factors were poor governance at both institutional and social levels. Not only was there a tense and uncertain political environment caused by the prolonged military rule, but resources were diverted from the public services to fund changes in the apparatus of government (Balami, 2002, p.2).
Population growth in the country (see Annex I) and efforts towards UBE have resulted in a long-term increase in enrolments. This has occurred at the same time as real levels of expenditure and financial support have declined, leading to overcrowding and declining quality. Competition for dwindling public resources has led to a reduction of the public resources allocated to education. The allocation to the education sector as a share of the national budget has remained relatively low, ranging from 6.45% in 1989 to 11.13% in 1999 and declining to 8.70% and 7.0% in 2000 and 2001 respectively (see Table 13.1 and Figure 13.1) In Nigeria, public spending as share of GNP grew from
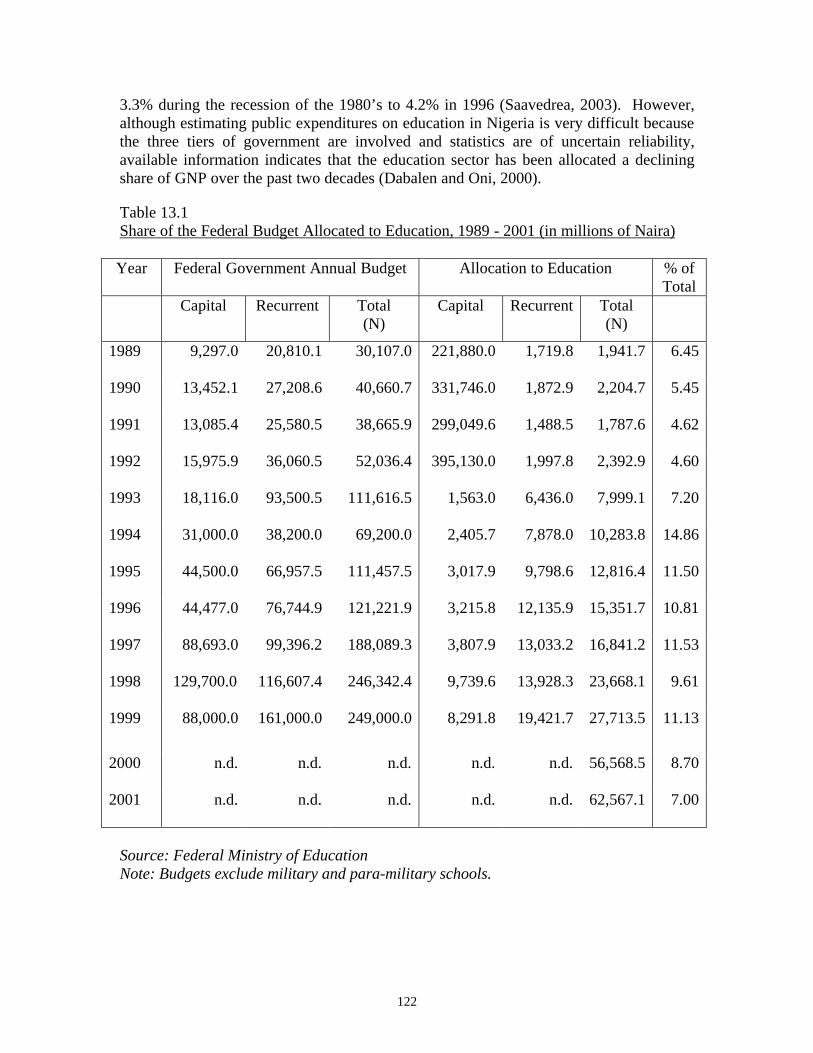
122
3.3% during the recession of the 1980’s to 4.2% in 1996 (Saavedrea, 2003). However, although estimating public expenditures on education in Nigeria is very difficult because the three tiers of government are involved and statistics are of uncertain reliability, available information indicates that the education sector has been allocated a declining share of GNP over the past two decades (Dabalen and Oni, 2000).
Table 13.1 Share of the Federal Budget Allocated to Education, 1989 - 2001 (in millions of Naira) Year Federal Government Annual Budget Allocation to Education % of
Total Capital Recurrent Total
(N) Capital Recurrent Total
(N)
1989 9,297.0 20,810.1
30,107.0 221,880.0 1,719.8 1,941.7 6.45
1990 13,452.1 27,208.6
40,660.7 331,746.0 1,872.9 2,204.7 5.45
1991 13,085.4 25,580.5
38,665.9 299,049.6 1,488.5 1,787.6 4.62
1992 15,975.9 36,060.5
52,036.4 395,130.0 1,997.8 2,392.9 4.60
1993 18,116.0 93,500.5
111,616.5 1,563.0 6,436.0 7,999.1 7.20
1994 31,000.0 38,200.0
69,200.0 2,405.7 7,878.0 10,283.8 14.86
1995 44,500.0 66,957.5
111,457.5 3,017.9 9,798.6 12,816.4 11.50
1996 44,477.0 76,744.9
121,221.9 3,215.8 12,135.9 15,351.7 10.81
1997 88,693.0 99,396.2
188,089.3 3,807.9 13,033.2 16,841.2 11.53
1998 129,700.0 116,607.4
246,342.4 9,739.6 13,928.3 23,668.1 9.61
1999 88,000.0 161,000.0
249,000.0 8,291.8 19,421.7 27,713.5 11.13
2000 n.d. n.d.
n.d. n.d. n.d. 56,568.5 8.70
2001 n.d. n.d.
n.d. n.d. n.d. 62,567.1 7.00
Source: Federal Ministry of Education Note: Budgets exclude military and para-military schools.
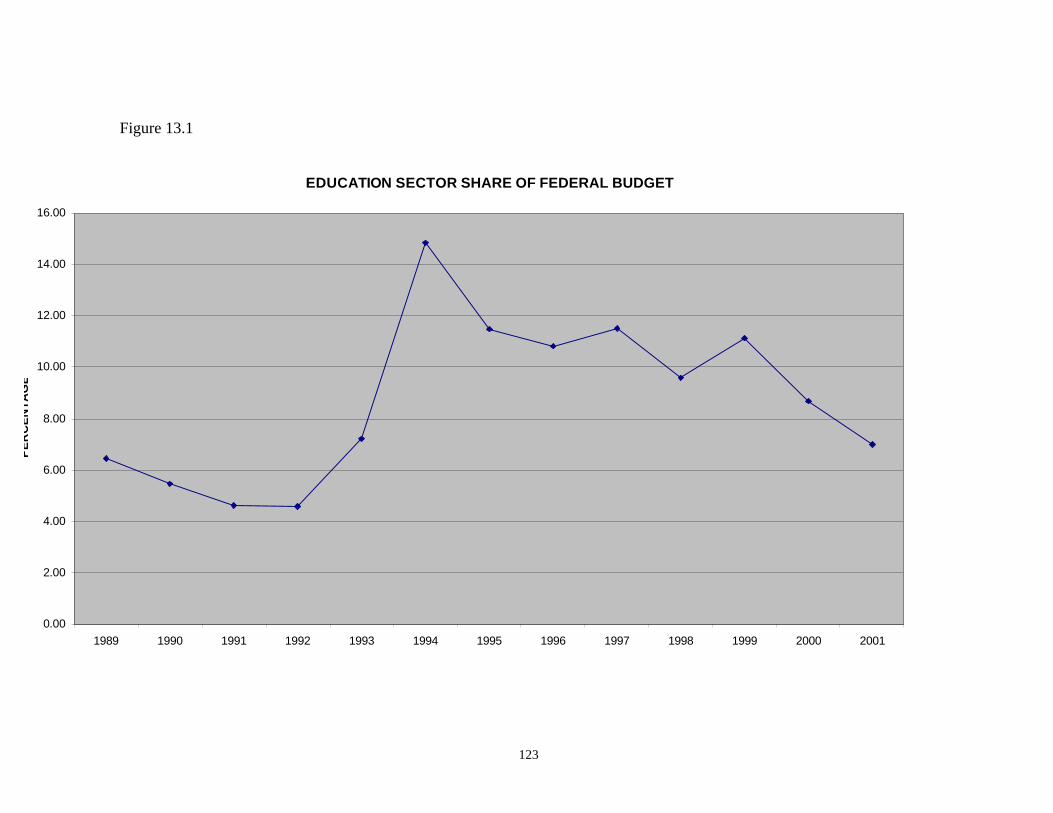
123
Figure 13.1
EDUCATION SECTOR SHARE OF FEDERAL BUDGET
0.00
2.00
4.00
6.00
8.00
10.00
12.00
14.00
16.00
1989 1990 1991 1992 1993 1994 1995 1996 1997 1998 1999 2000 2001
PE
RC
EN
TA
GE
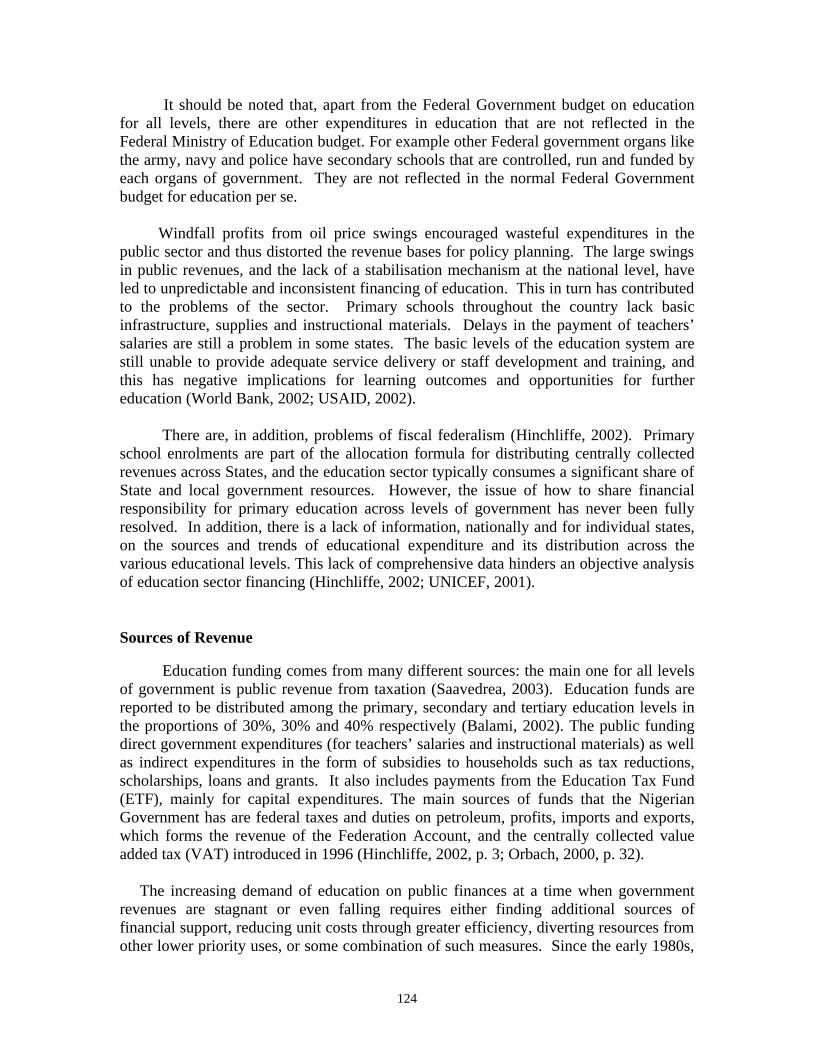
124
It should be noted that, apart from the Federal Government budget on education for all levels, there are other expenditures in education that are not reflected in the Federal Ministry of Education budget. For example other Federal government organs like the army, navy and police have secondary schools that are controlled, run and funded by each organs of government. They are not reflected in the normal Federal Government budget for education per se.
Windfall profits from oil price swings encouraged wasteful expenditures in the public sector and thus distorted the revenue bases for policy planning. The large swings in public revenues, and the lack of a stabilisation mechanism at the national level, have led to unpredictable and inconsistent financing of education. This in turn has contributed to the problems of the sector. Primary schools throughout the country lack basic infrastructure, supplies and instructional materials. Delays in the payment of teachers’ salaries are still a problem in some states. The basic levels of the education system are still unable to provide adequate service delivery or staff development and training, and this has negative implications for learning outcomes and opportunities for further education (World Bank, 2002; USAID, 2002).
There are, in addition, problems of fiscal federalism (Hinchliffe, 2002). Primary
school enrolments are part of the allocation formula for distributing centrally collected revenues across States, and the education sector typically consumes a significant share of State and local government resources. However, the issue of how to share financial responsibility for primary education across levels of government has never been fully resolved. In addition, there is a lack of information, nationally and for individual states, on the sources and trends of educational expenditure and its distribution across the various educational levels. This lack of comprehensive data hinders an objective analysis of education sector financing (Hinchliffe, 2002; UNICEF, 2001).
Sources of Revenue
Education funding comes from many different sources: the main one for all levels of government is public revenue from taxation (Saavedrea, 2003). Education funds are reported to be distributed among the primary, secondary and tertiary education levels in the proportions of 30%, 30% and 40% respectively (Balami, 2002). The public funding direct government expenditures (for teachers’ salaries and instructional materials) as well as indirect expenditures in the form of subsidies to households such as tax reductions, scholarships, loans and grants. It also includes payments from the Education Tax Fund (ETF), mainly for capital expenditures. The main sources of funds that the Nigerian Government has are federal taxes and duties on petroleum, profits, imports and exports, which forms the revenue of the Federation Account, and the centrally collected value added tax (VAT) introduced in 1996 (Hinchliffe, 2002, p. 3; Orbach, 2000, p. 32).
The increasing demand of education on public finances at a time when government revenues are stagnant or even falling requires either finding additional sources of financial support, reducing unit costs through greater efficiency, diverting resources from other lower priority uses, or some combination of such measures. Since the early 1980s,
125
therefore, considerable attention has been given, in Nigeria and elsewhere, to greater use of corporate, community and household sources of finance for education. At present, private sources account for about 20% of total national expenditure on education. In addition, some financial support is available from international donors, particularly in the form of loans. The donors include multilateral and bilateral agencies, multinational corporations and philanthropic foundations (Saavedrea, 2003). Federal Government Expenditures
In the period 1997-2002, the Federal Government’s expenditure on education has been below 12% of its overall expenditure, the trend being largely downward. Of this share, 70-80% has been for recurrent items, except in 2000 when the capital expenditure rose to 45% of the total. Each level of education has at various times been a concurrent responsibility of both Federal and State Governments, although the Federal Government has been most heavily involved at the tertiary level, allocating at least 68% of its total education expenditure to this level between 1996 and 2002. In the same years the average share of the secondary level has been 14.5% (for federal colleges) and that of the primary level has been 11.5%. The latter expenditure has been on an ad hoc basis, resulting from specific initiatives such as construction and renovation of classrooms (Hinchliffe, 2002, p. 9). The budgeting process, in Hinchliffe’s opinion, lacks incentives for rational allocations, as some federal institutions have been relatively under-funded (p. 9). State Government Expenditure
States’ revenues are dominated by allocations from the Federation Account and from the centrally collected VAT. Their internally generated revenue constituted 20-25% of the total between 1995 and 2000. The State Governments are involved in the funding of each level of education, though to different degrees. They fund most of secondary education and a significant part of tertiary education. Until April 2002, they did not in practice control the funding of primary education, but they now do so. The latter change will be discussed further in a later section.
Education expenditures as a share of total State government expenditure, and its distribution across levels of education, varied considerably over the period 1995-99. The size of the share devoted to education is a cause of concern. The median share in 1999, for example, was only 18% and had been declining in most states. On the pattern of funding across levels of education, an average of two-thirds of all State government expenditures were then for secondary schooling, 11% for primary education and 19% for tertiary education. States with state universities, however, spent on average 34% on tertiary education (Hinchliffe, 2002, pp. 9-10). Table 13.2 and Figure 13.2 show the pattern for selected states.
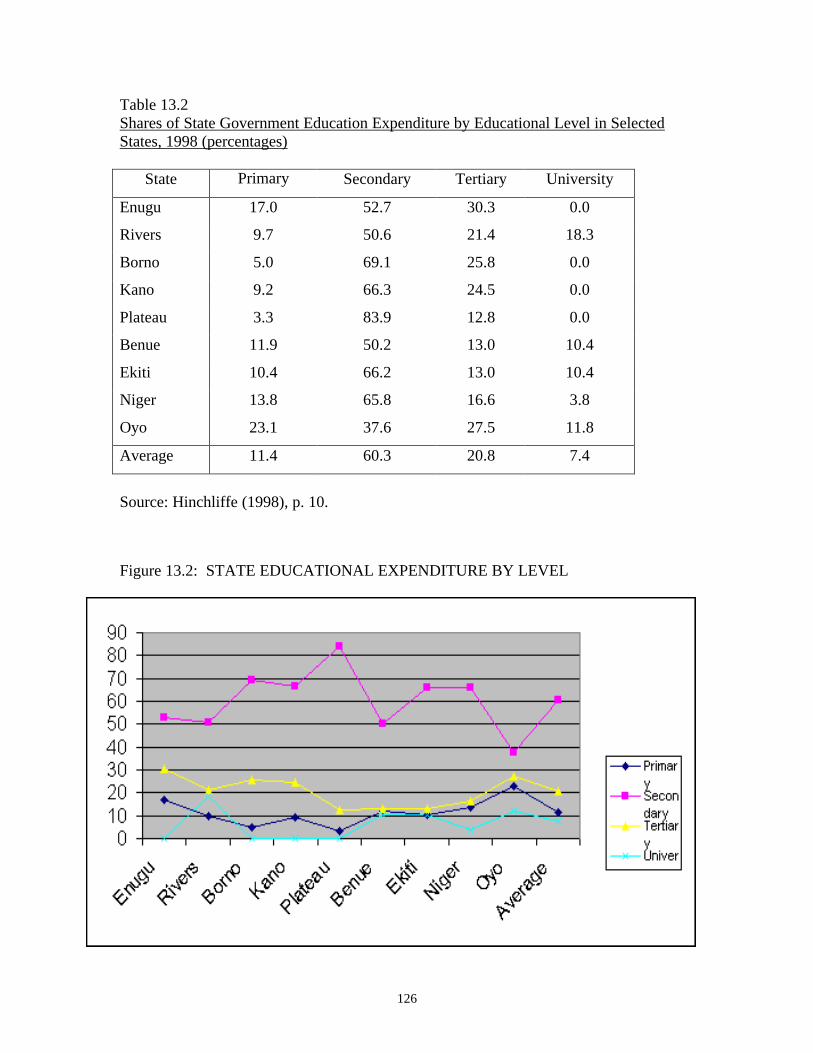
126
Table 13.2 Shares of State Government Education Expenditure by Educational Level in Selected States, 1998 (percentages)
State Primary Secondary Tertiary University
Enugu 17.0 52.7 30.3 0.0
Rivers 9.7 50.6 21.4 18.3
Borno 5.0 69.1 25.8 0.0
Kano 9.2 66.3 24.5 0.0
Plateau 3.3 83.9 12.8 0.0
Benue 11.9 50.2 13.0 10.4
Ekiti 10.4 66.2 13.0 10.4
Niger 13.8 65.8 16.6 3.8
Oyo 23.1 37.6 27.5 11.8
Average 11.4 60.3 20.8 7.4
Source: Hinchliffe (1998), p. 10.
Figure 13.2: STATE EDUCATIONAL EXPENDITURE BY LEVEL
Local Government Expenditures
Like the states, Local Governments have revenues from three sources: statutory allocations from the Federation Account, proceeds from the centrally collected VAT and
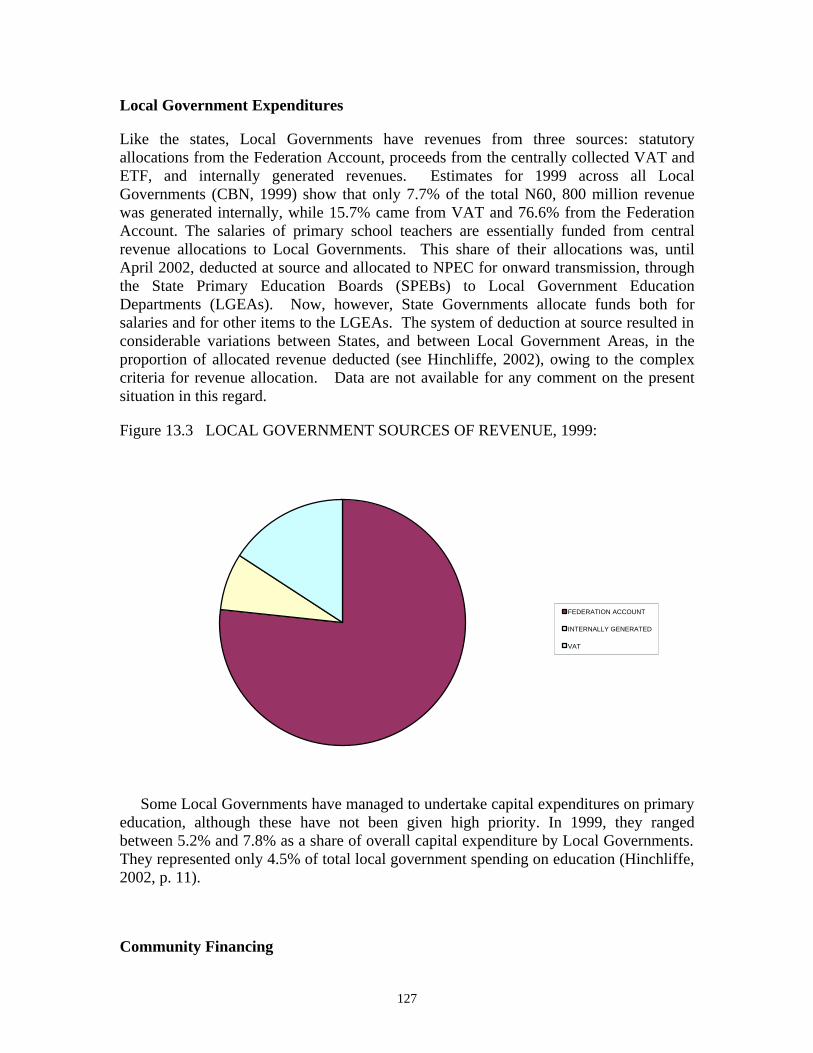
127
Local Government Expenditures
Like the states, Local Governments have revenues from three sources: statutory allocations from the Federation Account, proceeds from the centrally collected VAT and ETF, and internally generated revenues. Estimates for 1999 across all Local Governments (CBN, 1999) show that only 7.7% of the total N60, 800 million revenue was generated internally, while 15.7% came from VAT and 76.6% from the Federation Account. The salaries of primary school teachers are essentially funded from central revenue allocations to Local Governments. This share of their allocations was, until April 2002, deducted at source and allocated to NPEC for onward transmission, through the State Primary Education Boards (SPEBs) to Local Government Education Departments (LGEAs). Now, however, State Governments allocate funds both for salaries and for other items to the LGEAs. The system of deduction at source resulted in considerable variations between States, and between Local Government Areas, in the proportion of allocated revenue deducted (see Hinchliffe, 2002), owing to the complex criteria for revenue allocation. Data are not available for any comment on the present situation in this regard.
Figure 13.3 LOCAL GOVERNMENT SOURCES OF REVENUE, 1999:
Some Local Governments have managed to undertake capital expenditures on primary education, although these have not been given high priority. In 1999, they ranged between 5.2% and 7.8% as a share of overall capital expenditure by Local Governments. They represented only 4.5% of total local government spending on education (Hinchliffe, 2002, p. 11).
Community Financing
FEDERATION ACCOUNT
INTERNALLY GENERATED
VAT
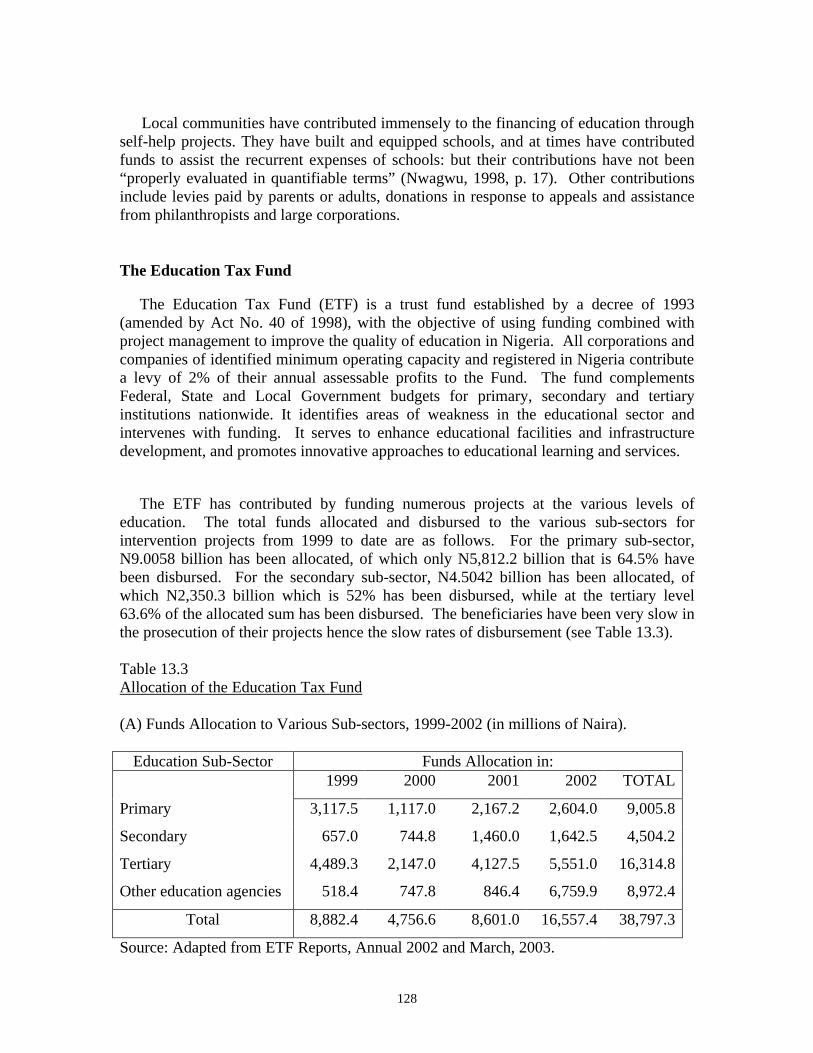
128
Local communities have contributed immensely to the financing of education through self-help projects. They have built and equipped schools, and at times have contributed funds to assist the recurrent expenses of schools: but their contributions have not been “properly evaluated in quantifiable terms” (Nwagwu, 1998, p. 17). Other contributions include levies paid by parents or adults, donations in response to appeals and assistance from philanthropists and large corporations. The Education Tax Fund
The Education Tax Fund (ETF) is a trust fund established by a decree of 1993 (amended by Act No. 40 of 1998), with the objective of using funding combined with project management to improve the quality of education in Nigeria. All corporations and companies of identified minimum operating capacity and registered in Nigeria contribute a levy of 2% of their annual assessable profits to the Fund. The fund complements Federal, State and Local Government budgets for primary, secondary and tertiary institutions nationwide. It identifies areas of weakness in the educational sector and intervenes with funding. It serves to enhance educational facilities and infrastructure development, and promotes innovative approaches to educational learning and services.
The ETF has contributed by funding numerous projects at the various levels of education. The total funds allocated and disbursed to the various sub-sectors for intervention projects from 1999 to date are as follows. For the primary sub-sector, N9.0058 billion has been allocated, of which only N5,812.2 billion that is 64.5% have been disbursed. For the secondary sub-sector, N4.5042 billion has been allocated, of which N2,350.3 billion which is 52% has been disbursed, while at the tertiary level 63.6% of the allocated sum has been disbursed. The beneficiaries have been very slow in the prosecution of their projects hence the slow rates of disbursement (see Table 13.3). Table 13.3 Allocation of the Education Tax Fund (A) Funds Allocation to Various Sub-sectors, 1999-2002 (in millions of Naira).
Education Sub-Sector Funds Allocation in: 1999 2000 2001 2002 TOTAL
Primary 3,117.5 1,117.0 2,167.2 2,604.0 9,005.8
Secondary 657.0 744.8 1,460.0 1,642.5 4,504.2
Tertiary 4,489.3 2,147.0 4,127.5 5,551.0 16,314.8
Other education agencies 518.4 747.8 846.4 6,759.9 8,972.4
Total 8,882.4 4,756.6 8,601.0 16,557.4 38,797.3
Source: Adapted from ETF Reports, Annual 2002 and March, 2003.
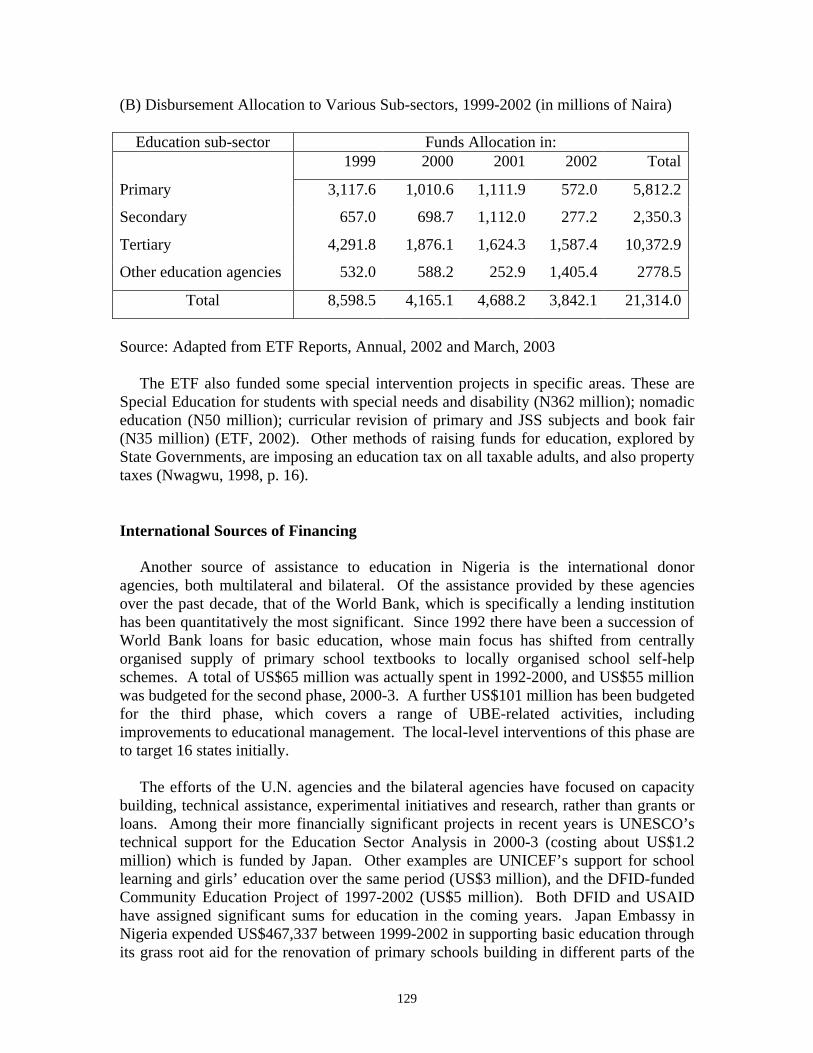
129
(B) Disbursement Allocation to Various Sub-sectors, 1999-2002 (in millions of Naira)
Education sub-sector Funds Allocation in: 1999 2000 2001 2002 Total
Primary 3,117.6 1,010.6 1,111.9 572.0 5,812.2
Secondary 657.0 698.7 1,112.0 277.2 2,350.3
Tertiary 4,291.8 1,876.1 1,624.3 1,587.4 10,372.9
Other education agencies 532.0 588.2 252.9 1,405.4 2778.5
Total 8,598.5 4,165.1 4,688.2 3,842.1 21,314.0
Source: Adapted from ETF Reports, Annual, 2002 and March, 2003 The ETF also funded some special intervention projects in specific areas. These are Special Education for students with special needs and disability (N362 million); nomadic education (N50 million); curricular revision of primary and JSS subjects and book fair (N35 million) (ETF, 2002). Other methods of raising funds for education, explored by State Governments, are imposing an education tax on all taxable adults, and also property taxes (Nwagwu, 1998, p. 16). International Sources of Financing Another source of assistance to education in Nigeria is the international donor agencies, both multilateral and bilateral. Of the assistance provided by these agencies over the past decade, that of the World Bank, which is specifically a lending institution has been quantitatively the most significant. Since 1992 there have been a succession of World Bank loans for basic education, whose main focus has shifted from centrally organised supply of primary school textbooks to locally organised school self-help schemes. A total of US$65 million was actually spent in 1992-2000, and US$55 million was budgeted for the second phase, 2000-3. A further US$101 million has been budgeted for the third phase, which covers a range of UBE-related activities, including improvements to educational management. The local-level interventions of this phase are to target 16 states initially. The efforts of the U.N. agencies and the bilateral agencies have focused on capacity building, technical assistance, experimental initiatives and research, rather than grants or loans. Among their more financially significant projects in recent years is UNESCO’s technical support for the Education Sector Analysis in 2000-3 (costing about US$1.2 million) which is funded by Japan. Other examples are UNICEF’s support for school learning and girls’ education over the same period (US$3 million), and the DFID-funded Community Education Project of 1997-2002 (US$5 million). Both DFID and USAID have assigned significant sums for education in the coming years. Japan Embassy in Nigeria expended US$467,337 between 1999-2002 in supporting basic education through its grass root aid for the renovation of primary schools building in different parts of the
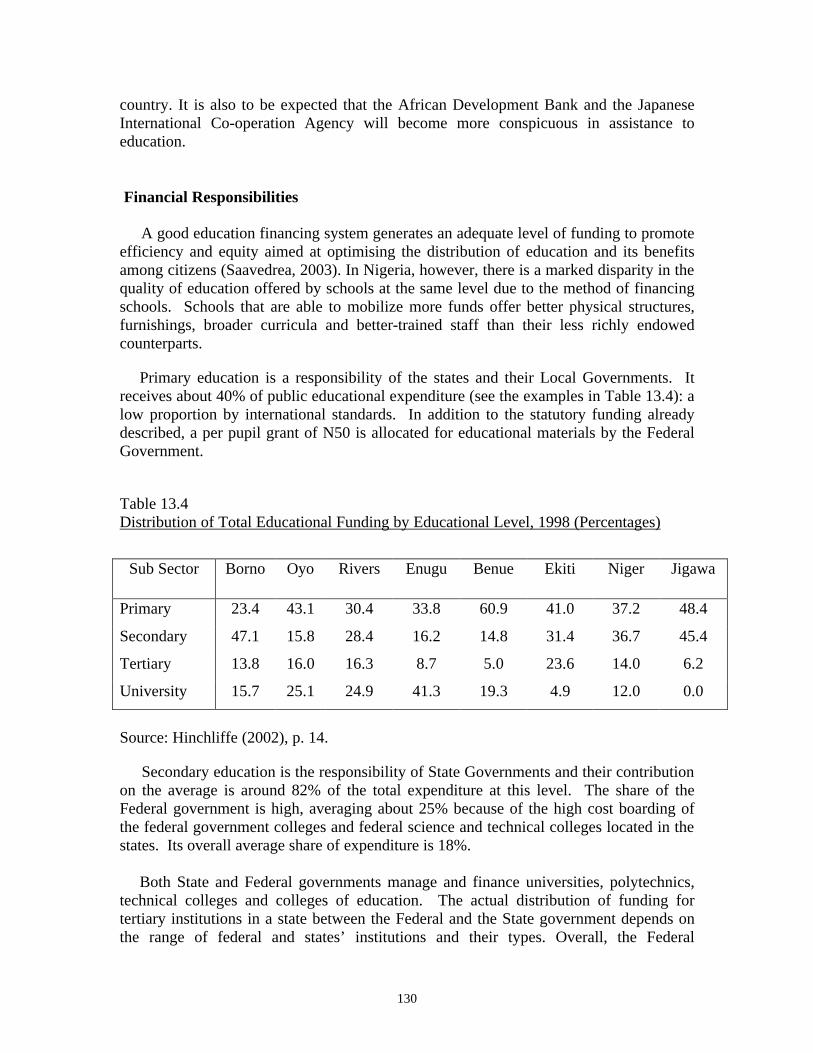
130
country. It is also to be expected that the African Development Bank and the Japanese International Co-operation Agency will become more conspicuous in assistance to education. Financial Responsibilities A good education financing system generates an adequate level of funding to promote efficiency and equity aimed at optimising the distribution of education and its benefits among citizens (Saavedrea, 2003). In Nigeria, however, there is a marked disparity in the quality of education offered by schools at the same level due to the method of financing schools. Schools that are able to mobilize more funds offer better physical structures, furnishings, broader curricula and better-trained staff than their less richly endowed counterparts.
Primary education is a responsibility of the states and their Local Governments. It receives about 40% of public educational expenditure (see the examples in Table 13.4): a low proportion by international standards. In addition to the statutory funding already described, a per pupil grant of N50 is allocated for educational materials by the Federal Government.
Table 13.4 Distribution of Total Educational Funding by Educational Level, 1998 (Percentages)
Sub Sector Borno Oyo Rivers Enugu Benue Ekiti Niger Jigawa
Primary 23.4 43.1 30.4 33.8 60.9 41.0 37.2 48.4
Secondary 47.1 15.8 28.4 16.2 14.8 31.4 36.7 45.4
Tertiary 13.8 16.0 16.3 8.7 5.0 23.6 14.0 6.2
University 15.7 25.1 24.9 41.3 19.3 4.9 12.0 0.0
Source: Hinchliffe (2002), p. 14.
Secondary education is the responsibility of State Governments and their contribution on the average is around 82% of the total expenditure at this level. The share of the Federal government is high, averaging about 25% because of the high cost boarding of the federal government colleges and federal science and technical colleges located in the states. Its overall average share of expenditure is 18%. Both State and Federal governments manage and finance universities, polytechnics, technical colleges and colleges of education. The actual distribution of funding for tertiary institutions in a state between the Federal and the State government depends on the range of federal and states’ institutions and their types. Overall, the Federal
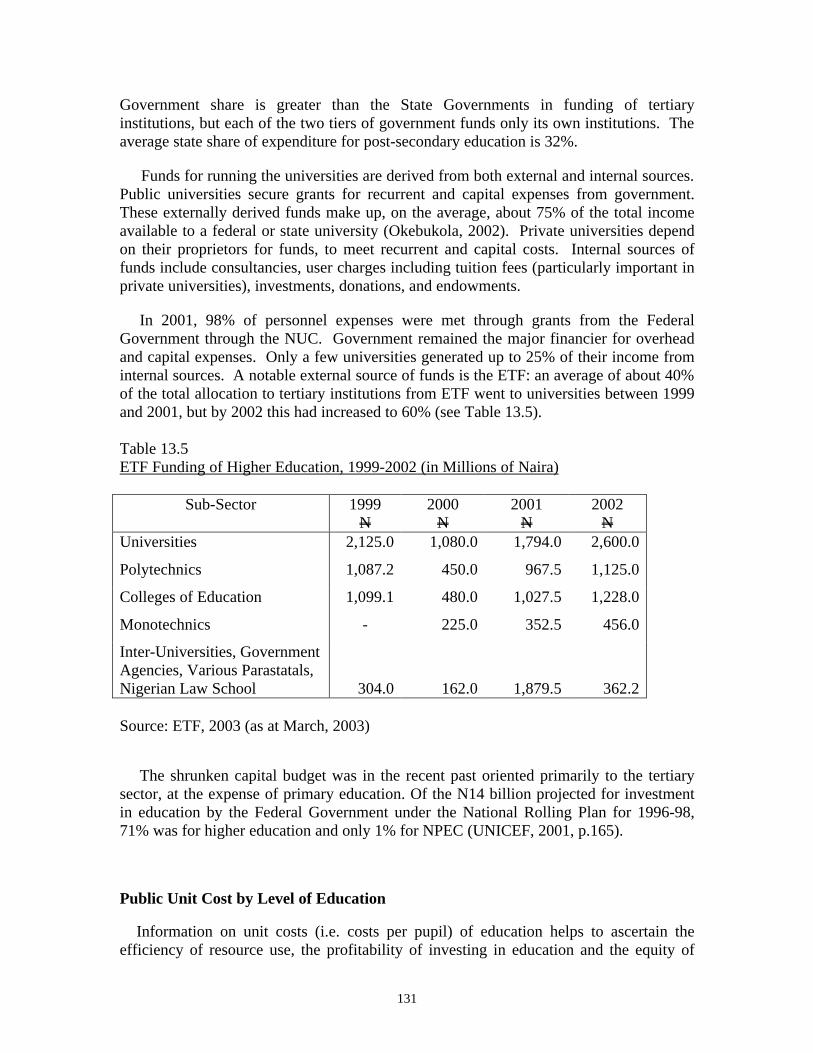
131
Government share is greater than the State Governments in funding of tertiary institutions, but each of the two tiers of government funds only its own institutions. The average state share of expenditure for post-secondary education is 32%.
Funds for running the universities are derived from both external and internal sources. Public universities secure grants for recurrent and capital expenses from government. These externally derived funds make up, on the average, about 75% of the total income available to a federal or state university (Okebukola, 2002). Private universities depend on their proprietors for funds, to meet recurrent and capital costs. Internal sources of funds include consultancies, user charges including tuition fees (particularly important in private universities), investments, donations, and endowments.
In 2001, 98% of personnel expenses were met through grants from the Federal Government through the NUC. Government remained the major financier for overhead and capital expenses. Only a few universities generated up to 25% of their income from internal sources. A notable external source of funds is the ETF: an average of about 40% of the total allocation to tertiary institutions from ETF went to universities between 1999 and 2001, but by 2002 this had increased to 60% (see Table 13.5). Table 13.5 ETF Funding of Higher Education, 1999-2002 (in Millions of Naira)
Sub-Sector 1999 N
2000 N
2001 N
2002 N
Universities 2,125.0 1,080.0 1,794.0 2,600.0
Polytechnics 1,087.2 450.0 967.5 1,125.0
Colleges of Education 1,099.1 480.0 1,027.5 1,228.0
Monotechnics - 225.0 352.5 456.0
Inter-Universities, Government Agencies, Various Parastatals, Nigerian Law School
304.0
162.0
1,879.5
362.2 Source: ETF, 2003 (as at March, 2003)
The shrunken capital budget was in the recent past oriented primarily to the tertiary sector, at the expense of primary education. Of the N14 billion projected for investment in education by the Federal Government under the National Rolling Plan for 1996-98, 71% was for higher education and only 1% for NPEC (UNICEF, 2001, p.165). Public Unit Cost by Level of Education Information on unit costs (i.e. costs per pupil) of education helps to ascertain the efficiency of resource use, the profitability of investing in education and the equity of
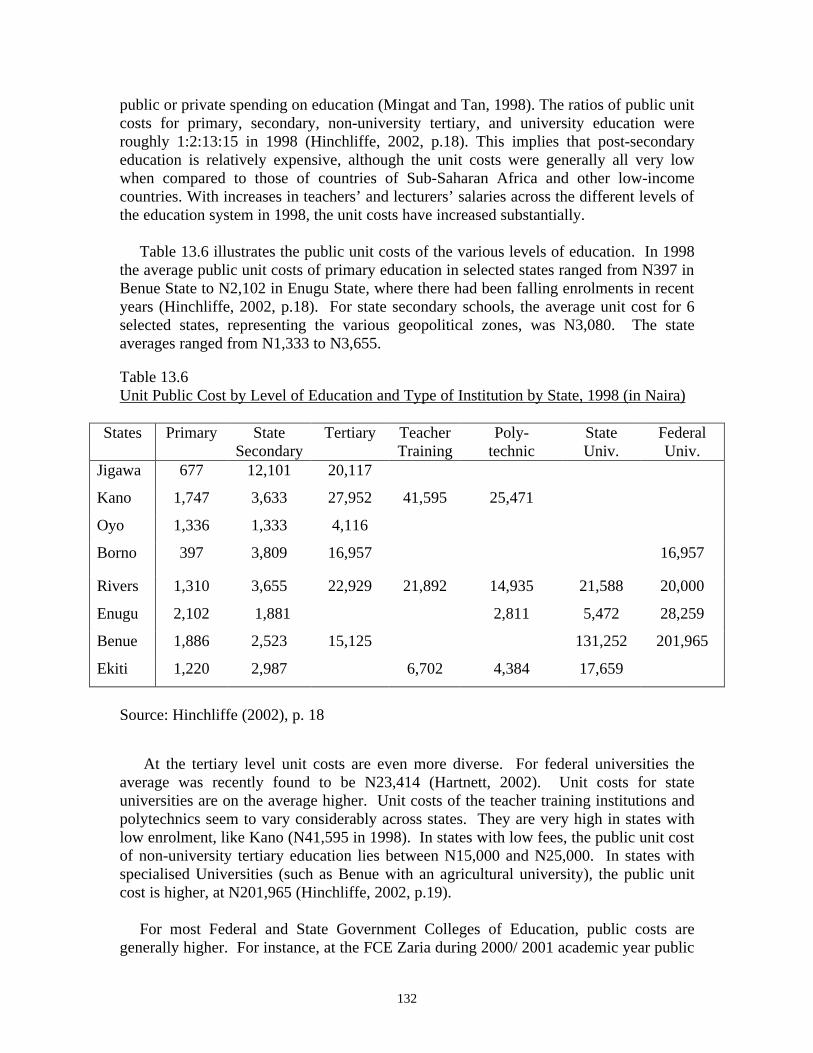
132
public or private spending on education (Mingat and Tan, 1998). The ratios of public unit costs for primary, secondary, non-university tertiary, and university education were roughly 1:2:13:15 in 1998 (Hinchliffe, 2002, p.18). This implies that post-secondary education is relatively expensive, although the unit costs were generally all very low when compared to those of countries of Sub-Saharan Africa and other low-income countries. With increases in teachers’ and lecturers’ salaries across the different levels of the education system in 1998, the unit costs have increased substantially. Table 13.6 illustrates the public unit costs of the various levels of education. In 1998 the average public unit costs of primary education in selected states ranged from N397 in Benue State to N2,102 in Enugu State, where there had been falling enrolments in recent years (Hinchliffe, 2002, p.18). For state secondary schools, the average unit cost for 6 selected states, representing the various geopolitical zones, was N3,080. The state averages ranged from N1,333 to N3,655. Table 13.6 Unit Public Cost by Level of Education and Type of Institution by State, 1998 (in Naira)
States Primary State Secondary
Tertiary Teacher Training
Poly- technic
State Univ.
Federal Univ.
Jigawa 677 12,101 20,117
Kano 1,747 3,633 27,952 41,595 25,471
Oyo 1,336 1,333 4,116
Borno 397 3,809 16,957 16,957
Rivers 1,310 3,655 22,929 21,892 14,935 21,588 20,000
Enugu 2,102 1,881 2,811 5,472 28,259
Benue 1,886 2,523 15,125 131,252 201,965
Ekiti 1,220 2,987 6,702 4,384 17,659
Source: Hinchliffe (2002), p. 18 At the tertiary level unit costs are even more diverse. For federal universities the average was recently found to be N23,414 (Hartnett, 2002). Unit costs for state universities are on the average higher. Unit costs of the teacher training institutions and polytechnics seem to vary considerably across states. They are very high in states with low enrolment, like Kano (N41,595 in 1998). In states with low fees, the public unit cost of non-university tertiary education lies between N15,000 and N25,000. In states with specialised Universities (such as Benue with an agricultural university), the public unit cost is higher, at N201,965 (Hinchliffe, 2002, p.19). For most Federal and State Government Colleges of Education, public costs are generally higher. For instance, at the FCE Zaria during 2000/ 2001 academic year public
133
cost was approximately N48,000, although for NTI Distance Learning System (DLS) programmes, the public costs were as low as N960. This could be due to the fact that the NTI uses skeletal services at the various DLS centres rather than establish grandiose bureaucratic arrangements. Moreover, overhead expenditure varies widely within and between states and institutions (UBEC, 2002, p.11). The total average unit cost per student per discipline in all Science-based disciplines (with a mean of N239,408) is higher than those of Arts-based discipline (with a mean N186.505) (Okebukola, 2002). He explained further that the average unit cost per student per discipline range from a minimum of N141,532 for Business Administration/ Management Science to maximum of N302,096 in Human Medicine. Each of the seven science-based disciplines, i.e. Medicine, Environmental Science, Veterinary Medicine, Pharmacy, Agriculture, Engineering and Natural Science, has a higher cost than the arts and social science-based disciplines, i.e. Law, Arts/Humanities, Education, Social Sciences, Management and Administration. Overall, Medical Sciences and Engineering together account for 39% of the total unit cost, and pure and applied sciences for 37%, while arts-based disciplines account for the least total cost (24%). Private Education and Household Expenditure on Education Private schooling is significant in every state of Nigeria. The private sector for primary and secondary education has been growing for the past two decades, but the federal authorities have failed to keep a proper record of this development. The size of the sector in 1999 may be illustrated by reference to certain states, however. In Ekiti State, private schools were 17% of all primary and 14% of all secondary schools. In Enugu State the proportions were 16% and 14%, and in Kano State they were 17% and 27%. The widespread loss of public confidence in public primary education has been noted by various studies (e.g. Francis et al., 1998; Urwick, 2002). For the secondary level Rivers State, where private secondary enrolment grew from 7% to 33% of the total in the period 1995-99, illustrates the same trend. School attendance requires household expenditure on learning materials, uniforms, meals and transport, as well as fees and other charges. The items other than fees normally form a large share of household expenditures in government schools. From small household surveys conducted in Plateau State in 1995, it was found that, on average, uniforms and shoes accounted for about half the direct cost to the household of government primary schooling. Learning materials accounted for about 36%, and fees and donations were only 10% of the cost in an urban area and 6% in a rural area. For private schools, fees were 29% of the cost in the urban area and 18% in the rural area. The main factor was transport as it accounted for one–third and half of the private cost of transport in private schools (Urwick, 2002). Direct private unit costs (i.e. annual household expenditures per pupil) have been constructed both by the study just cited, for Plateau State in 1995, and by another study for Lagos State in 1998 (Okebukola and Olaniyonu, 1998). Both studies present average unit costs for public and for private schools, in rural and in urban areas. For ease of
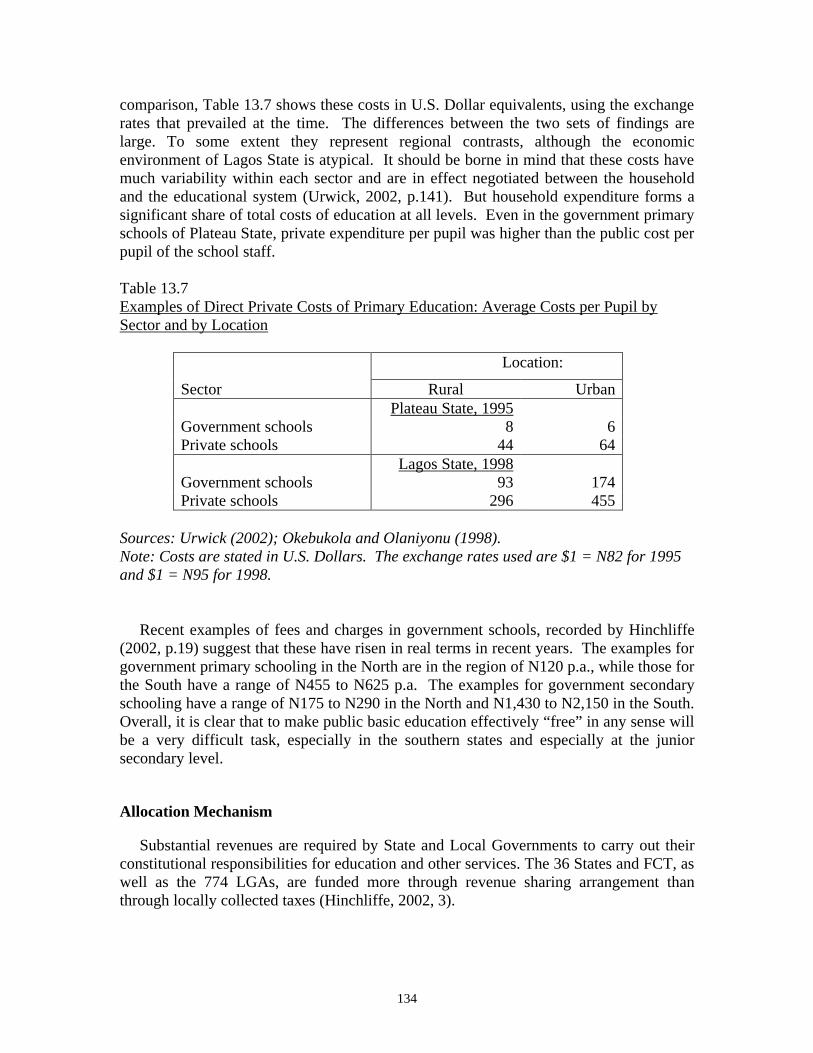
134
comparison, Table 13.7 shows these costs in U.S. Dollar equivalents, using the exchange rates that prevailed at the time. The differences between the two sets of findings are large. To some extent they represent regional contrasts, although the economic environment of Lagos State is atypical. It should be borne in mind that these costs have much variability within each sector and are in effect negotiated between the household and the educational system (Urwick, 2002, p.141). But household expenditure forms a significant share of total costs of education at all levels. Even in the government primary schools of Plateau State, private expenditure per pupil was higher than the public cost per pupil of the school staff. Table 13.7 Examples of Direct Private Costs of Primary Education: Average Costs per Pupil by Sector and by Location
Location:
Sector Rural Urban Plateau State, 1995 Government schools 8 6 Private schools 44 64 Lagos State, 1998 Government schools 93 174 Private schools 296 455
Sources: Urwick (2002); Okebukola and Olaniyonu (1998). Note: Costs are stated in U.S. Dollars. The exchange rates used are $1 = N82 for 1995 and $1 = N95 for 1998. Recent examples of fees and charges in government schools, recorded by Hinchliffe (2002, p.19) suggest that these have risen in real terms in recent years. The examples for government primary schooling in the North are in the region of N120 p.a., while those for the South have a range of N455 to N625 p.a. The examples for government secondary schooling have a range of N175 to N290 in the North and N1,430 to N2,150 in the South. Overall, it is clear that to make public basic education effectively “free” in any sense will be a very difficult task, especially in the southern states and especially at the junior secondary level.
Allocation Mechanism
Substantial revenues are required by State and Local Governments to carry out their constitutional responsibilities for education and other services. The 36 States and FCT, as well as the 774 LGAs, are funded more through revenue sharing arrangement than through locally collected taxes (Hinchliffe, 2002, 3).
135
Based on the constitution, all federal revenues are pulled together and placed in the Federation Account, from which they are distributed among the three tiers of government (Orbach 2003, p.32). There are two types of distribution of the centrally acquired revenues: between the Federal, State and Local Governments, and across State and Local Governments.
The allocation to the states for education is based on a formula decreed in 1993 by the Finance Fiscal Allocation Committee (FFAC), set up to develop and apply the formula by which the Government divides the funds. This has been revised several times, most recently as a result of the Supreme Court ruling of April 2002 on resource control. The ruling directed a split of 54.68%, 24.70% and 20.60% to Federal, State and Local Government respectively and prohibited the Federal government from transferring any revenue to special funds. The share of 7.5% formerly appropriated by Federal government would be added to the States’ allocations. The horizontal revenue sharing arrangements, the distribution across State and Local governments and among sectors, still remain the same. The mobilization of more funds for education is likely to imply less for some other sectors (Orbach 2003, p. 36).
The state and local government allocations are on the basis of equal shares and population as well as according to indicators like primary school enrolments and fiscal effort. The role of local government in the provision and maintenance of primary schools, spelt out in the 1979 constitution, coincided with a new revenue allocation formula, which increased the shares of revenue to States and Local Governments. The application of this allocation formula to the overall conditions prevailing in the states has not reduced the differences between them, as poor states cannot generate substantial internal revenues and are very dependent on the formula (Orbach, 2003, p. 36).
Unfortunately, with the decline of total revenue in the Federation Account in the 1980s, the financing of primary education, and payment of teacher salaries “increasingly faced crisis” (Hinchliffe, 2002, p.4). This led to the establishment of NPEC to coordinate and supervise primary education as well as contribute 65% to primary teachers’ salaries. The local government was to contribute 20%, while State governments provide the remaining 15%. Though states were happy with increased funding, they resented the power of NPEC. The way Federal funds were distributed across states was seen as discriminatory against those with large educational systems. Surprisingly, in 1991, full responsibility for primary education was transferred to Local Governments, and their share of revenue increased to 20% while that of states was reduced to 25%, as NPEC was abolished. After a period of crisis occasioned by this sudden change, the previous system was re-established by Decree 96 of 1993. NPEC was re-established and the cost of teachers’ salaries was again deducted at source from the Federation Account allocation to each Local Government. On this occasion, the formula for distribution of the National Primary Education Fund was clearly spelt out to take account of such factors as school enrolment, equality of States and special funds for the educationally disadvantaged states (Nwagwu, 1998, p. 16).
136
The Challenges of UBE
The Universal Basic Education Commission (UBEC) is working with states to develop plans and funding proposals for state UBE implementation. The issues of adequate teacher supply and teacher quality in most States, against the background of increasing enrolments in primary and junior secondary schools, is a cause of concern. Hence the support for teachers’ participation in NCE upgrading programmes. Central to these issues is the cost of training teachers to cope with the implementation of the UBE programme (UBE, 2002, p. 2).
The UBEC is attempting to ascertain what impact a new programme of teacher training would have on future recurrent cost of teachers whose qualifications would be enhanced by the new programme. It is considering the implications for the present and future planning process, and how to finance initial upgrading programmes of teacher training (UBEC, 2002, 4). The findings would inform decisions about state public expenditures for teacher training and contribute to consideration of alternative and cost-effective options for the provision of teacher education (UBEC, 2002, Appendix 10). Conclusions
The task of reducing educational inequality can only be accomplished through political commitment at the federal and state levels. Educational opportunities can be equalized by providing support from Federal Government funds to complement locally generated resources and providing greater assistance to impoverished communities. To reduce rural–urban disparities, there must be an increase in the proportion of resources allocated to rural LGAs. Also decisions about priorities and resource allocations must be based on a well-structured set of national policies and programmes.
The emphasis in financing of education must be placed on better utilisation of the available funds, the allocation of additional public funds to the sector, and diversification of the sources of funding in education. Decentralization of finance and management requires adequate management skills for state and LGA administrators as well as head teachers and principals. Thus training programmes should be designed to promote such skills.
There is the need to consider options for the funding of higher education. One of these is to introduce a graduate payroll tax, whereby employers of graduates (both public and private) are taxed to fund university education. This has a sort of regulatory influence on the labour market and would encourage employers to identify their need for employees with particular skills and qualifications. Other ways of generating revenue to finance tertiary education could be through consultancy services, community programmes (e.g. outreach programmes), increased fees, possibly combined with student loan schemes, and generation of income from non-teaching services such as use of university buildings for conferences and social events.
137
Nigeria is one of many developing countries re-examining the question of how to finance education as they face growing economic problems and increasing pressure on public funds. These pressures coincide with growing private demand for access to primary, secondary, and higher education, and for an improved quality of service. They are also attempting to find new solutions to the problem of using resources efficiently and sharing financial burdens both efficiently and equitably (Woodhall, 1996, p. 20).

138
139
CHAPTER FOURTEEN
EDUCATION AND EMPLOYMENT Education Policy and Manpower Supply In the present technological age, a fundamental function of formal education is to produce a knowledge-based work-force for national development. In this connection, the National Policy on Education (1998) prescribes two major goals: § To civilize and enlighten every individual to lead the good life in society as a
citizen of Nigeria while harmonizing with and sharing in the world’s cultural heritage.
§ To equip every individual with the skills and job competencies for gainful
employment. The National Policy on Education is definite that the defining character of an educated person is the competence to live and work successfully in society. Barring these competencies, there is no education. Individuals who lack life skills and job competencies are prone to suffer identity crises and social disorientation. The curriculum at each stage of formal education, from primary to tertiary, is therefore geared towards inculcating civilized and enlightened mode of living as well as competencies. At the primary education level, the elements of work in the curriculum include the study of mathematics, science, agriculture, home economics, cultural and creative arts (drawing, handicraft, music and cultural activities). Existing labour laws in Nigeria do not permit primary school graduates under 15 years to join the labour market directly. Child labour is prohibited but apprenticeship training is allowed and encouraged. Thus drop-outs/offs and completers of primary education who cannot immediately proceed for formal secondary education due to their life circumstances, find a means for job training as apprentices. In the labour market, opportunities for apprenticeship training include: distributive trade, traditional medical practice, house help, farming, local crafts, in-plant industrial training, roadside trade training and on-the-job training. Normal employment is available in the public service for persons with primary education above the age of 15 years. As at 1995, the projected population of children aged 6-11 years who should be in primary school was 16.1 million (see Annex 1), and in the same year, total enrolment in public primary schools including many over-aged pupils was about 15.6 million (EDB data) giving a GER of 97%. In the same year, only 44% of those leaving primary six entered junior secondary one. These statistics illustrated the point that the demand for apprenticeship for young out-of-school children is very large.
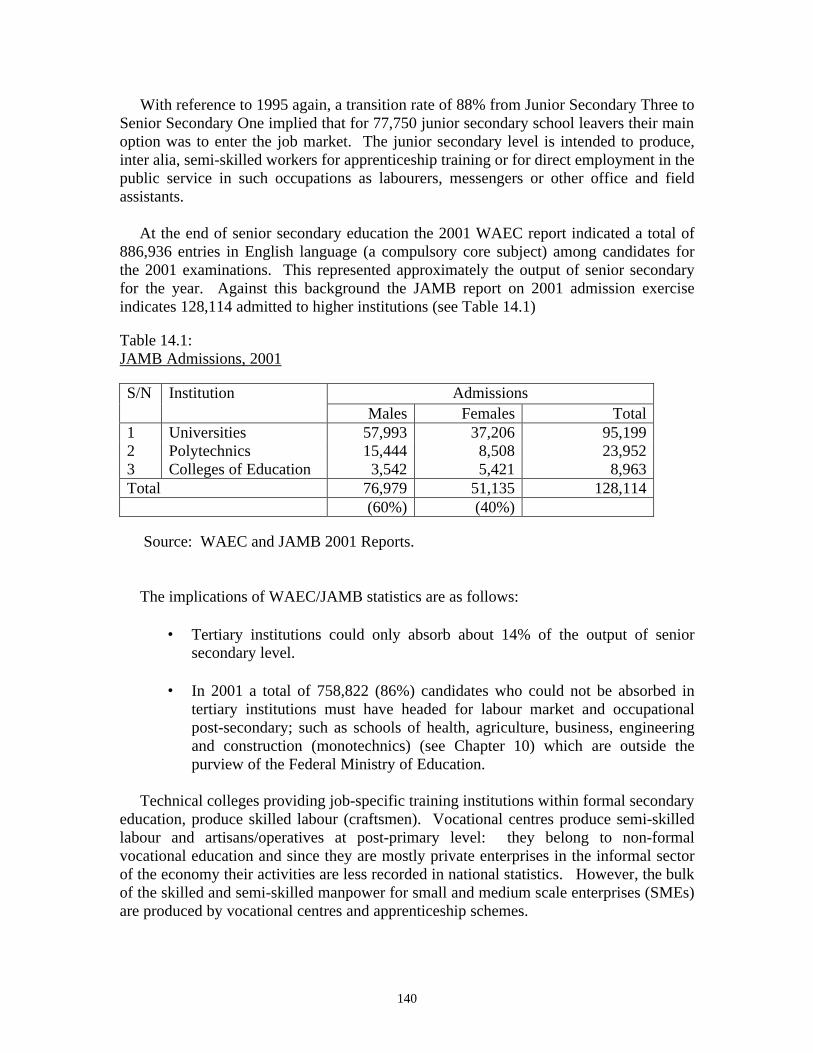
140
With reference to 1995 again, a transition rate of 88% from Junior Secondary Three to Senior Secondary One implied that for 77,750 junior secondary school leavers their main option was to enter the job market. The junior secondary level is intended to produce, inter alia, semi-skilled workers for apprenticeship training or for direct employment in the public service in such occupations as labourers, messengers or other office and field assistants.
At the end of senior secondary education the 2001 WAEC report indicated a total of 886,936 entries in English language (a compulsory core subject) among candidates for the 2001 examinations. This represented approximately the output of senior secondary for the year. Against this background the JAMB report on 2001 admission exercise indicates 128,114 admitted to higher institutions (see Table 14.1)
Table 14.1: JAMB Admissions, 2001
Admissions S/N Institution
Males Females Total 1 Universities 57,993 37,206 95,199 2 Polytechnics 15,444 8,508 23,952 3 Colleges of Education 3,542 5,421 8,963 Total 76,979 51,135 128,114 (60%) (40%)
Source: WAEC and JAMB 2001 Reports.
The implications of WAEC/JAMB statistics are as follows:
• Tertiary institutions could only absorb about 14% of the output of senior secondary level.
• In 2001 a total of 758,822 (86%) candidates who could not be absorbed in
tertiary institutions must have headed for labour market and occupational post-secondary; such as schools of health, agriculture, business, engineering and construction (monotechnics) (see Chapter 10) which are outside the purview of the Federal Ministry of Education.
Technical colleges providing job-specific training institutions within formal secondary education, produce skilled labour (craftsmen). Vocational centres produce semi-skilled labour and artisans/operatives at post-primary level: they belong to non-formal vocational education and since they are mostly private enterprises in the informal sector of the economy their activities are less recorded in national statistics. However, the bulk of the skilled and semi-skilled manpower for small and medium scale enterprises (SMEs) are produced by vocational centres and apprenticeship schemes.
141
Both the National Directorate of Employment (NDE) and National Poverty Eradication Programme (NAPEP) have established collaborative efforts in open apprenticeship training. The NDE teaches skills to the unemployed and inculcates enterprise spirit using: Vocational Acquisition Training, Entrepreneurial (Business) Training, Training for Rural Employment and Training for Labour-Based Work Programme. In 2000, about 129,146 unemployed persons were involved in the various programmes of NDE across the country. NAPEP’s Youth Employment Scheme involves capacity acquisition programme and mandatory attachment programme for the jobless. In 2002, a total of 180,000 were involved as beneficiaries of NAPEP’s programmes.
The output of technical colleges as indicated by NABTEB in its 2001 report to NCE was 41,500 out of which only 16,000 (36.6%) registered for technical trades certificate examinations, while the balance of 63.4% registered for business examinations. NABTEB reported a high failure rate in its examination due to poor expression, poor conceptual skills, poor drawing skills, and inadequate exposure to practical training. Technical college graduates enter the labour market as craftsmen with these defects. The causes of poor performance are considered to be lack of facilities and poor quality teaching.
Available statistics for 1998 indicate that the polytechnics enrolled 86,212 final year students, out of which females were 7,548 (8.8%). In the same year the output was 9,344 of which females accounted for 2,344 (25%). The universities enrolled in 1999 a total of 448,230 of which the females numbered 156,236 (34.9%). In the same year they produced 67,025 out of which the females were 18,435 (27.5%). The gender disparity is a cause for concern.
The ratio of polytechnics output to that of the university is about 1:7. This is an unhealthy relationship from the point of view of economic development. Similarly, the relationship between the output of the technical colleges and the polytechnics is about 4:1 which is not ideal for economic growth. The relationship prescribed by COREN, for engineering occupations, is 1 engineer to 6 technicians to 60 craftsmen (COREN, 1993). Nigeria apparently, has ratios of 4:1:7 far from this ideal of 60:6:1. A situation where high-level workers are more numerous than those at low-levels easily leads to underemployment or educational inflation. However, the manpower mix applicable to engineering and construction is not applicable to public service where the preponderance of staff are non degree holders on GL 01-07. In 1996, the numerical staff strength in the Federal Public Service was 347,068, made up of 263,387 on GL 01-07 and 83,681 on GL 08-17, that is, about 3 non-degree holders to one degree holder in the service (FMF, 2000, p. 240). Manpower Demand in Nigeria In the 2003-05 Rolling Plan, it is observed that “Nigeria is currently faced with high unemployment, underemployment, low productivity, rising skill flight, depreciating real household income, etc”. Over 70% of the unemployed in Nigeria are youths within 15-25 years (UNESCO, 1998). The stock of manpower is derived from the 15-65 age
142
bracket of the population, which is about 55 million with unemployment level of about 12% (NMB, 2003). Employment in Nigeria is public sector-driven. About 60% of those employed are in the public service. With the on-going privatisation and the inability of the public sector to employ, the rate of unemployment has been rising. The unemployment rate for university graduates may be around 25% and their prospects are worsening (Dabalen, Oni and Adekola, 2000). However, Nigeria faces a paradoxical situation where available qualified persons do not all find jobs and where available jobs in certain sectors do not have enough qualified persons to fill them. This affects in particular, the upstream petroleum industry where expatriates flood the country. The mix of manpower production as already shown is in favour of arts and humanities and social science and not in favour of hardcore technology and science. Educational and training institutions that produce skills tend to be supply-driven, and to some extent this is unavoidable. The reasons are as follows:
• Training institutions once set-up cannot open or close depending on the vagaries of demand. “Strictly applied, a demand-driven policy would be a recipe for disaster. The world of training is too complicated to be satisfied with this simple rule” (Castro, 1995, p. 6).
• Economic development cannot be left to determine manpower development since
the latter creates new possibilities for the economy. Indeed, experience during the 3rd National Development Plan Period, 1975-80, was that economic development stimulated by oil boom was stifled because of unavailability of manpower (FGN, 1975, p. 3).
• Implementation of the existing manpower development and employment policy
has been inadequate for the country. It is important to note that the NMB was set up in 1962 for the purpose and is active in providing manpower development direction to the nation in spite of its funding constraints. To improve policy implementation, NMB has set plans to establish strong links between stake- holders in manpower development and utilisation by means of a tripartite consultative forum.
The size of the public service in Nigeria is said to be bloated but efforts to trim it down in the past proved unsuccessful. In 1994, the public service was estimated at 1.3 million made up of about 400,000 in the Federal Service, 400,000 in the State Service, 200,000 in Local Government Service and 300,000 in public enterprises. The problem of the public service has perhaps been lack of quality rather than size per se. Therefore, the effort on the ground is towards capacity building. 20% of the budget is allocated to staff training (FMF, 2000. p. 36) but is never completely released or used for the purpose.
However, in 1996 the size of the Federal Service was 347,221 while that of the Statutory bodies and state owned companies were 154,573 (FMF, 2000, p. 240-241).
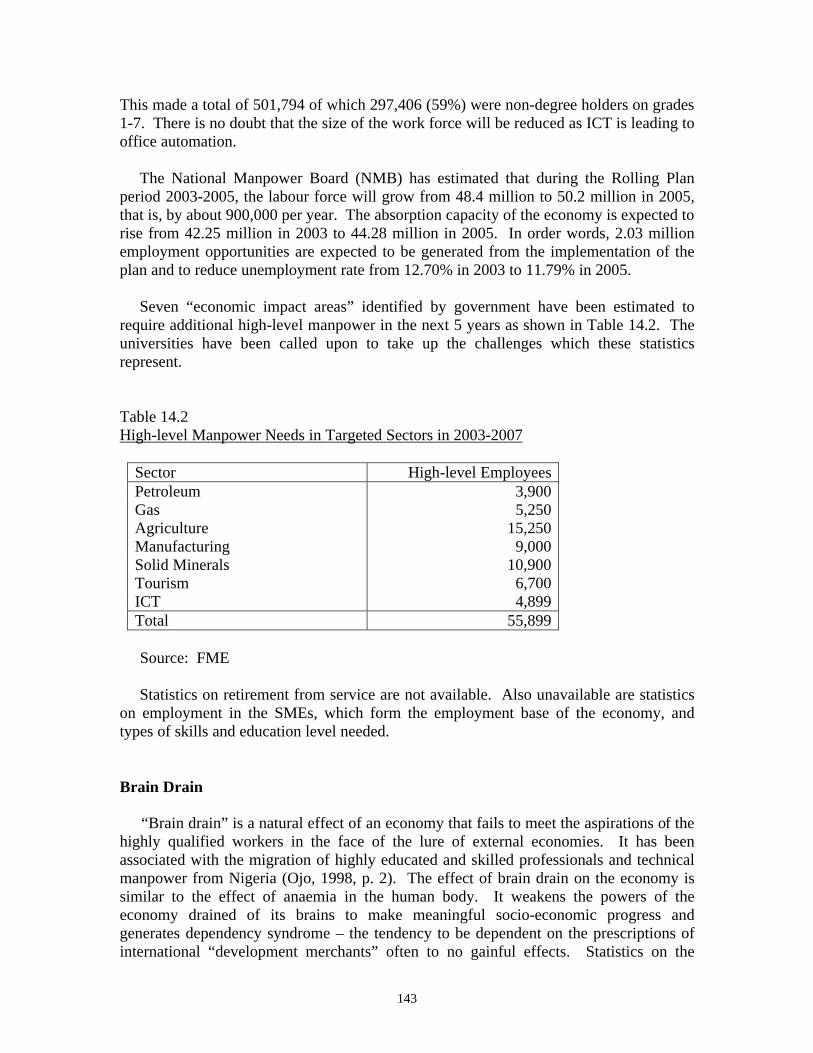
143
This made a total of 501,794 of which 297,406 (59%) were non-degree holders on grades 1-7. There is no doubt that the size of the work force will be reduced as ICT is leading to office automation. The National Manpower Board (NMB) has estimated that during the Rolling Plan period 2003-2005, the labour force will grow from 48.4 million to 50.2 million in 2005, that is, by about 900,000 per year. The absorption capacity of the economy is expected to rise from 42.25 million in 2003 to 44.28 million in 2005. In order words, 2.03 million employment opportunities are expected to be generated from the implementation of the plan and to reduce unemployment rate from 12.70% in 2003 to 11.79% in 2005. Seven “economic impact areas” identified by government have been estimated to require additional high-level manpower in the next 5 years as shown in Table 14.2. The universities have been called upon to take up the challenges which these statistics represent. Table 14.2 High-level Manpower Needs in Targeted Sectors in 2003-2007
Sector High-level Employees Petroleum 3,900 Gas 5,250 Agriculture 15,250 Manufacturing 9,000 Solid Minerals 10,900 Tourism 6,700 ICT 4,899 Total 55,899
Source: FME Statistics on retirement from service are not available. Also unavailable are statistics on employment in the SMEs, which form the employment base of the economy, and types of skills and education level needed.
Brain Drain “Brain drain” is a natural effect of an economy that fails to meet the aspirations of the highly qualified workers in the face of the lure of external economies. It has been associated with the migration of highly educated and skilled professionals and technical manpower from Nigeria (Ojo, 1998, p. 2). The effect of brain drain on the economy is similar to the effect of anaemia in the human body. It weakens the powers of the economy drained of its brains to make meaningful socio-economic progress and generates dependency syndrome – the tendency to be dependent on the prescriptions of international “development merchants” often to no gainful effects. Statistics on the
144
extent of the brain drain from Nigeria are not easily available. Nevertheless, the size could be gauged from the number of Nigerian intellectuals in foreign lands. A national plan of improved service conditions to lure these Nigerians back home is not in place. The nation stands at risk in terms of loss of executive capacity through brain drain. The Way Forward • Since there is a poor link between education and the labour market, enterprise
education should be instituted at all levels of education to reduce unemployment. The FME should also carry out tracer studies of leavers in order to improve the linkages of schooling with the labour market.
• The FME and NMB should establish collaborative relationship in manpower
development. They should seek to improve the manpower mix produced by the educational system.
• NMB should produce and keep under review a compendium of skills and
competencies required at each level of manpower production in the national education system.
• Trade guilds should be formed under their respective professional association for
improvement of the quality of trade practice. They should be consulted in the process of curriculum development.
145
CHAPTER FIFTEEN
ACHIEVEMENTS, CRITICAL ISSUES AND CHALLENGES Introduction
In this chapter of the status report, government achievements in the various sub-sectors are highlighted. It is significant that these achievements cut across the sub-sectors and are aimed at addressing fundamental issues that have plagued the education system severally. The chapter also highlights the challenges that must be addressed in each sub-sector of the education system in order to achieve progress in the education sector as a whole. At the federal level, the problems range from the funding imbalances, through development and strengthening of partnerships, to the daunting task of building capacity at all levels. There is the important need to re-examine the targets set for UBE, to reduce gender gaps in participation and, beyond basic education, to face up to the problem posed by HIV/AIDS. In each sub-sector from early childhood and primary, through to the secondary and tertiary levels, and in adult, non-formal, TSE and teacher education, there are issues to be adequately addressed. This chapter focuses first on the achievements of government in specific sub-sectors from 1999 to 2003 and then presents the critical challenges that remain.
Achievements Universal Basic Education The first public function undertaken by the present administration in September 1999 is the launching of the Universal Basic Education (UBE) scheme. This is a landmark achievement. Since the launching of this scheme, intensive mobilisation of communities and the general population to participate has led to increased primary school enrolment from 17.9 million in 1999 to 19.2 million in 2000 and 19.4 million in 2001. To meet the classroom demand necessitated by this increase, a total of 1,500 three-classroom blocks with head teachers’ offices, stores and VIP toilets have been constructed since 1999 These facilities are distributed evenly across the 774 local government areas in Nigeria. The two successive Basic Education Summits (held in 1999 and 2000) and the subsequent Higher Education Summits that followed are indicative of government commitment to revamping the education sector, which it inherited in a state of decay. The passing of the UBE Bill on 14th May 2003 is an additional achievement aimed at reinforcing the UBE programme. Nigeria took part in the Dakar conference in 2000, which adopted the 6 EFA goals including universal enrolment and completion of primary education NPEC has been converted into the “UBE Programme” and given a new mandate to coordinate the UBE policy. The establishment of an EFA Coordinating
146
Unit led by a representative of civil society is a laudable landmark. This has placed Nigeria among the community of nations, which together agreed to work towards Education For All by the year 2015. Nigeria’s appointment as the Regional Coordinator for the Africa Region under the Honourable Minister of Education is a recognition of the country’s potential to play a leadership role in the EFA delivery process. The EFA unit is currently engaged in producing a national plan on EFA and the states are being empowered to develop their own UBE/EFA plans. When successfully concluded, this will consolidate Nigeria’s potential to benefit from the EFA ‘fast track initiative’ being led by the World Bank. Secondary Education
In the secondary sub-sector, specifically in the period since 1999, there has been some movement towards gender parity in secondary education enrolments, and transition rates from junior to senior secondary education have improved considerably. The system of admission into federal unity schools has been revised to give more places to talented and deserving candidates. The government has also, in the past three years, made efforts to give school principals up-to-date knowledge of school management practices. Other recent developments include the establishment of Federal Science and Technology Colleges and the introduction of an Information and Communication Technology curriculum to equip pupils for the computer age. Technology and Science Education The technology and science sub-sector has received an even greater boost fundamental to resolving the problems that it has grappled with in the past. Government, in recognition of the potential for development that lies in technology and science education, took several steps to consolidate service delivery in that sub-sector. Government has assumed new initiatives to revitalise and expand the scope of technology and science education. In this regard, the present administration is credited among other achievements with the production of a national master plan for the development of TVE in the 21st century with a focus on expansion of training opportunities, integration of entrepreneurial education in training, development of technology teachers and modernisation of programme delivery.
The reversion of the length of training in crafts programmes in technical colleges from 3 years to 6 years as full secondary education, admitting successful completers of primary education as the conventional secondary schools has the intention of attracting students and expanding enrolment. This eliminates the age-long discrimination against technical college graduates in admission into tertiary institutions. Government has continued to establish more Federal Science and Technical Colleges and taken steps to eliminate all forms of disparities between the Polytechnics and Universities while considering action plans to transform polytechnics into degree awarding institutions.
147
University Education The present administration inherited a lot of woes as a result of the prolonged military rule, which contributed to the decline in the universities. Government therefore had to focus its attention within the years under review on universities as well. In 2002 therefore, the present administration conducted a National Summit on Higher Education to generate social consensus on these problems and their solutions. The root problems identified include lack of executive capacity for management and leadership by those in authority, poor funding and a long established attitude of dependence on government for direction and funding. Government is responding to these phenomena by seeking to restore financial and academic autonomy to the universities. The autonomy soon to be legally granted to federal universities by an Act of Parliament should help to make the universities more self-reliant. The closure in 2001 of satellite campuses which were run by various universities was an attempt by government to control quality and maintain minimum standards. To fill in the gap that this action would have on potential clientele for University education, the Federal Government resuscitated the Open University which had been closed down in 1983, one year after it was established by the Shagari administration. The National Open University of Nigeria (NOUN) aims to accommodate about 200,000 students in the year 2003. The Virtual Library Project, which was launched in 2000 by the National Universities Commission (NUC), promises to satisfy the textbook and research needs of students and lecturers. Government has also commenced the process of modernisation of university administration and academic management. Plans are being pursued to enable all new entrants into teaching and management in universities to be professionally trained for their jobs. Three National Higher Education Pedagogic Centres (NHEPC) are to be established to enhance teaching skills. Also from 1999, the present administration has considerably improved the conditions of service of university staff by instituting new salary scales and fringe benefits. Efforts have also been concentrated on campus rehabilitation and expansion, particularly with student accommodation and with recreational and academic facilities. Adult and Non-formal Education
In the adult and non-formal sub-sector, the enhanced social mobilisation efforts under the UBE scheme helped in part to create awareness for adult and non-formal education. The National Commission for Mass Literacy, Adult and Non-formal Education (NMEC) has extensively supplied reading and writing materials to adult learners across the 6 zones. Innovative strategies are being introduced in adult education programmes, often combining literacy with community development programmes and generally using more active methodology. A lot more needs to be done in this area to increase the literacy level of Nigerians especially women.
148
Teachers and Teacher Education In order to meet expanding teacher needs as a result of the UBE programme, government introduced the Pivotal Teacher Training Programme (PTTP) through the National Teachers’ Institute. Since the beginning of the programme, 30,000 NCE and 42,000 auxiliary teachers have been produced. Teachers’ salaries have also received upward reviews since 1999. Attempts are being made to improve the deployment and skills of teachers, notably the Teachers’ Corps programme and the establishment of pedagogic centres in universities. Data Needs The activities of the Education Data Bank are being strengthened with the development of an Education Management Information System (EMIS). A “baseline survey” has been completed for 1999 to 2002 to fill in the data gaps that built up over the years when annual school censuses were not taken. The decision to embark on a Sector Analysis project is itself an achievement. This led to the establishment of an ESA unit in FME to lead the process of diagnosing the education sector. The process is intended to provide an empirical basis for an informed sector reform and for instilling a sustainable data collection culture. The present administration has produced an Atlas, which documents significant information about Nigeria. The publication places in proper perspective demographic and environment detail on Nigeria. Quality Assurance The low learning achievement level being recorded among pupils is an issue that the present government has begun to tackle from the roots. Recognising the Federal Inspectorate Services (FIS) as the unit of the FME charged with the responsibility for quality assurance, the Honourable Minister of Education set up a committee, co-ordinated by the ESA unit and supported by DFID, to study the FIS and make recommendations for its repositioning. The committee has since submitted a report. HIV/AIDS Government has risen to the challenge of HIV/AIDS by instituting a typical education response to the disease through the setting up of the HIV/AIDS and Education Unit in FME. This unit collaborates with NACA in sensitisation of pupils and students concerning the scourge of HIV/AIDS. This unit has assembled desk officers from various departments in the Ministry and its parastatals to participate in working out the modalities for reaching school age children. The curriculum on Sexuality Education, developed to teach the young as much as possible about the disease transmission patterns, has been renamed Family Life Education. The Federal Government, in conjunction with UNESCO in 2002 held a conference on HIV/AIDS and education in Nigeria.
149
Critical Issues and Challenges
Early Childhood Education The present government responsibility for early childhood education is limited to setting standards and ensuring quality pre-primary education, as well as providing teacher training and learning materials. There is an important issue as to whether government should accept some financial and managerial responsibility for pre-primary education. There are arguments for and against this step. Proponents argue that these early years are too critical to overall human development to be left unattended by government and that mere specification of standards is not enough. Some believe that government ought to intervene more actively here in order to enhance access to everyone rather than accepting the present situation, in which the service is made available only to those who value and can afford it. Opponents argue that government cannot take on this extra responsibility as it is still grappling with higher priorities and would leave early childhood care and education to parents, communities and the private sector. There is merit in both arguments, but it seems clear that government must play a more active role than it is doing now in pre-primary education, empowering the departments or agencies of government responsible for this role to be more pro-active.
Other necessary measures include training programmes for producing pre-primary teachers, continuing to support community-based pre-primary and childcare centres; introducing appropriate legislation concerning early childhood education, government consideration of the practice of primary-pre-primary school linkage programmes for children aged 3-5. This model of pre-primary education is cost-effective as well as efficient and appears to work well at present in Oyo state. Government should also encourage the application at this level of more indigenous child stimulation methods, many of which cut across the major ethnic groups in Nigeria. Primary Education In this sub sector, the challenges that remain include non-payment of teachers’ salaries when due and the low morale of teachers. The primary education sub-sector receives between 35% and 40% of the allocation to public education. The issue of who pays teachers’ salaries, which take up the bulk of the allocation to that sub-sector, has until recently dominated public debate. Now that the Supreme Court ruling has settled the issue, more efficient allocation of resources within the primary education sub-sector may receive more attention. The right balance needs to be struck between expenditure on teachers and on other inputs into primary education. The contributions of parents as well as local communities to education should also be analysed to estimate what parents spend on their children’s education. For this analysis to be possible, an appraisal of the current funds allocation and disbursement patterns in schools is necessary in order to set aside funds for learning materials. For more efficient use of resources, the shift system could be suggested and teachers given greater incentives to support the system. These options and strategies must be thoroughly analysed in order to have a good picture of their expected efficiency. A sound judgement on these issues must be based on data and other evidence.
150
The problem of teacher demand and supply continues to pose problems at the primary
school level. Whereas some states have more teachers than they need, others seem to battle constantly with an inadequate supply of teachers. Enhancing teacher quality and productivity by increasing opportunities for in-service training at local levels should also receive government attention. Secondary Education The low transition rate from junior secondary education to senior secondary is still a challenge to the system. The NPE transition ratio of 60:20:10:10, from junior to senior secondary schools, technical schools, vocational centres and open apprenticeship, is not being adhered to: there is a serious mismatch between official targets and actual enrolment. The transition rate between primary and junior secondary education is also low, declining from 53% in 1992 to 38% in 1997. In contrast, transition from junior to senior secondary education is higher, close to 90%. The demand by almost every parent that their children move on to senior secondary, instead of Technical Colleges and Vocational schools, is excused on the grounds that vocational schools are not well equipped and the public has little regard for them. The recent government move to rename Federal Technical Colleges as Federal Science and Technical Colleges addresses only a part of the problem. This may raise the status of these schools among the general public, but only if the schools are equipped as real science and vocational schools that transmit the special body of knowledge. More than ever, greater financial commitment by government is necessary to bolster public acceptance and support for STVE. The shortage and inadequacy of science teachers in secondary schools is an issue that must be addressed seriously. Low learning achievement as currently being recorded in schools is also a big challenge. The fact that many children even after 9 years of basic education are still unable to acquire basic competencies is serious enough to be addressed urgently. Traditional quality assurance mechanisms should be strengthened to perform their roles more effectively. The Federal Inspectorate Service (FIS) is particularly relevant in this regard. Technology and Science Education
The challenge in this area is that of meeting the national scarcity of professional technology teachers. The dearth of books in technology and science education deserves serious consideration and so does the need to modernise technology and science education. These measures will help to reverse the negative image that science and technology education has at present. In effect, the systematic implementation of the national master plan on TVE is the crucial challenge. University Education
Certain problems still plague the university system. Incessant industrial disputes, cultism and examination malpractices are some of the problems that have turned the
151
universities into very unstable environments. The resolutions on autonomy and funding made at the Higher Education Summit, if implemented to the letter, will guarantee a measure of achievements. Government must seek a final solution to the threat of cultism, and examination malpractices in the university system. Incessant strike actions also constitute threats to the stability of the system in the productivity loss which each strike action entails.
Adult and Non-formal Education
Partnerships are advocated as the most viable strategy for reaching the target beneficiaries in adult and non-formal education. In Nigeria there is a plethora of NGOs and CBOs operating in many communities. These associations are viable avenues for disseminating literacy programmes in a cost-effective and relevant manner. They have special potentials in adult education delivery especially among women. The Government should endeavour to forge partnerships with non-governmental organisations.
A major problem in adult and non-formal education is the timing factor in relation to the regular occupations of potential learners. The face-to-face mode, though very effective, can only reach a limited audience, and often requires the learner to shelve livelihood activities to engage in education. At the moment the choice is often made in favour of non-education activities. Adult and non-formal education must therefore strive to tap the potential of education delivery through the distance mode. Print, electronic media or radio raise new possibilities of literacy education everywhere, anywhere and at any time for target beneficiaries to access at their own convenience. Teachers and Teacher Education The Government faces challenges from the teaching service and from teacher education, especially as the agitation for more salaries and improved welfare continue to dominate teachers’ demands. The problem of improving the welfare of teachers, however, appears to go beyond mere salary increases. Terms of service for teaching should not only attract but also retain the best brains. Teachers want not only better conditions and better fringe benefits, but also a better working environment with tools and materials for research and opportunities for self-development more easily available. Government must involve teachers themselves in working out effective ways of making the teaching profession viable for serving teachers and attractive to incoming ones. The teacher retraining opportunities that currently exist are mostly centralised training in which many teachers participate. This mode of training is believed to have limited impact and level of transfer to actual classroom practice on the part of teachers (NPEC, 1999). In-service training ought to be on-going, regular and woven into the fabric of the teachers’ daily activities while also addressing the expressed concern and needs of teachers. More science and vocational studies teachers are needed for any meaningful development in science and technology education. Government could consider greater financial incentives to attract more teachers to science. At the tertiary levels, the shortage
152
of teachers, as a result of brain drain resulting from the low status and the lack of attraction to the teaching profession, is considerable. Government must seriously address the issue. In the non-formal sector, the issue of instructors’ stipends remains intractable problem. Insufficient and irregular payment of instructor stipends (varying from N500 to N1,500 per month across the country) is a very serious inhibiting factor for non-formal education. Considering that, without instructors regularly available at the learning centres, all efforts at literacy education come to naught, it is time for government to make a categorical commitment to instructor payment in this sub-sector. This could involve working out a matching grant arrangement with providing agencies whatever their affiliation. Data Collection
Meanwhile, the need for timely, valid and reliable data is evident across all sub-sectors of education. The Baseline Survey exercise was a major effort to update the national data collection system. There is a need, however, to review the major sources of national data such as the MICS (1999), the population projections of the National Population Commission, and the baseline survey enrolment compilations. The challenge of collecting and authenticating data for all sub-sectors in education is urgent. For UBE and EFA, and also for states and local government areas, there is need for soundly based projections that are informed by accurate data. This applies to enrolment, teacher numbers, classroom spaces, number of schools needing renovations and infrastructures required. More reliable data would ensure that realistic targets are set for UBE, enabling Nigeria to reassess the prospects of attaining the 2015 EFA goals of eradicating illiteracy. The Education Sector Analysis (ESA) project is expected to generate, in the diagnosis process, data and research studies that would assist in charting the future course of education in Nigeria. This Education Sector Status Report has exposed gaps in the availability and accuracy of data. The authorities must build data collection and analysis into their daily operations and use the data more effectively. HIV/AIDS and Education The spread of HIV/AIDS poses direct threats to the education sector in relation to access, teaching and learning. Also information dissemination and education concerning the control of the epidemic is an area of concern to education. In a dialogue on teachers conducted by NCCE in 2002, the threat of HIV/AIDS to teachers was highlighted. It was noted at that discussion meeting that infected teachers need support. Mechanisms and structures for cushioning effects of AIDS must also be put in place for AIDS orphans. Above all, teachers need an enhanced capacity to deal with AIDS related issues affecting their pupils and themselves. Facts and figures are needed to aid the planning process. The education sector must respond more proactively to the challenge of HIV/AIDS.
153
Management and Funding of Education The place of education on the concurrent legislative list has proved to have advantages and disadvantages. This has been the subject of various policy reversals culminating in the 2002 constitutional injunction that the Federal Government should leave states and local government authorities (LGAs) to handle teachers’ salaries. This has highlighted the need for dialogue among all stakeholders concerning the roles of each level of government in education provision. With the acceptance of the Supreme Court ruling, LGAs need to be empowered to ensure that teachers’ salaries are paid regularly. Besides, while it is urgent to address the inadequate level of public funding of education, it is imperative too that the financial allocations to education at various levels be efficiently utilized. Amid claims of overlap and duplication of functions among the parastatals in education, it is necessary to streamline the roles and responsibilities of these parastatals in a cost-effective way. Over and above this is the need to streamline how the FME itself is structured in relation to its parastatals, and FME’s relationship with them. This is necessary to reduce conflicts and dissipation of energy. Partnerships An increasing number of children, youths and adults need and in many cases actively demand education. Government alone cannot meet these demands. The time has come for a greater community and civil society participation in providing, managing and funding education. This requires all levels of government to forge partnerships across the public and private sectors, and for parents and local communities to be involved in the management and financing of education in order to meet the challenge of EFA. Such partnership is relevant to all the different tiers of government and across every sub-sector. Funding and management options should be fully explored with these partners. The involvement of civil society and international development partners in education has increased considerably during this administration, but there is scope for further development of such partnerships. Government may consider various forms of partnership with publishers for supply of specialised books at secondary and tertiary levels, which may be sold at subsidised rates to students. Another possibility would be for government to encourage experts in various disciplines to write books for students effectively underwriting the expenditure of producing the books. Capacity Building for Management The challenge of building greater capacity for educational management at all levels of government, especially state governments, and at the school level is very real. Concerted efforts must be aimed at meeting the training needs of those managing human and material resources at state, LGA and school levels. There are particular concerns about the capacity of school and educational managers to manage the human resources under their authority. There are doubts that such managers are given any form of training
154
before or on appointment into such headship positions. The physical facilities of NIEPA have been rehabilitated and additional staff recruited in order to enhance NIEPA’s capacity to train planners and managers for the system. Disadvantaged Groups The challenge of reducing gender inequities in education is also a big issue. The Baseline data records a consistent percentage increase in female gross enrolment ratios from 25% in 2000, 26% in 2001 to 27% in 2002 for the 15-17 age groups. For the 12-14 age group, the figure rose from 25% in 2000 to 27% in 2002. Regional disparities persist – in boys’ drop out, street children, almajirai, special needs children and other under served groups. There is a need to target all children for UBE and the achievement of EFA. Issues or problems that are specific to individual states must be tackled to achieve this purpose. Increasing female participation in schools remains a challenge to which the education sector must respond as gender disparities still exist in favour of boys. This is especially the case in the North. The advantages of educating girls and adult women have been emphasised in various fora. Government must therefore take the lead in mobilising efforts to get more girls into school and adopt regionally specific strategies for achieving this objective. Education and the World of Work The policy on education assumes that children will remain in school until they are 15 years of age. At present, however, many children leave school long before this time. This situation underlines the need to prepare suitable non-formal alternatives for young school leavers. Entrepreneurial skills should be developed throughout the education levels from primary to tertiary to enable school leavers and graduates to acquire skills that can promote self-reliance and independence.
The apparent lack of coherence between the labour market and graduate output is not
desirable. Graduate production must be better aligned with the world of work in order to reduce the imbalance evident at present. This requires cooperation between educational institutions and employers in identifying the labour requirements to be met and assessing how graduates already on the job are performing. In this way, graduate production would be more closely geared to labour market needs with a good balance between demand and supply. An ESA study targets this linkage and proposes to work with employers in carrying out the study. Conclusion This final chapter has attempted to document major achievements and challenges in specific sub-sectors of education. An analysis of these achievements and critical challenges shows that most of the activities are long-term, the impact of which can only be felt in a few more years. Many policy reviews and enabling laws are necessary to lay a strong foundation for education in future. It is hoped that this Education Sector Status Report will contribute in this regard.
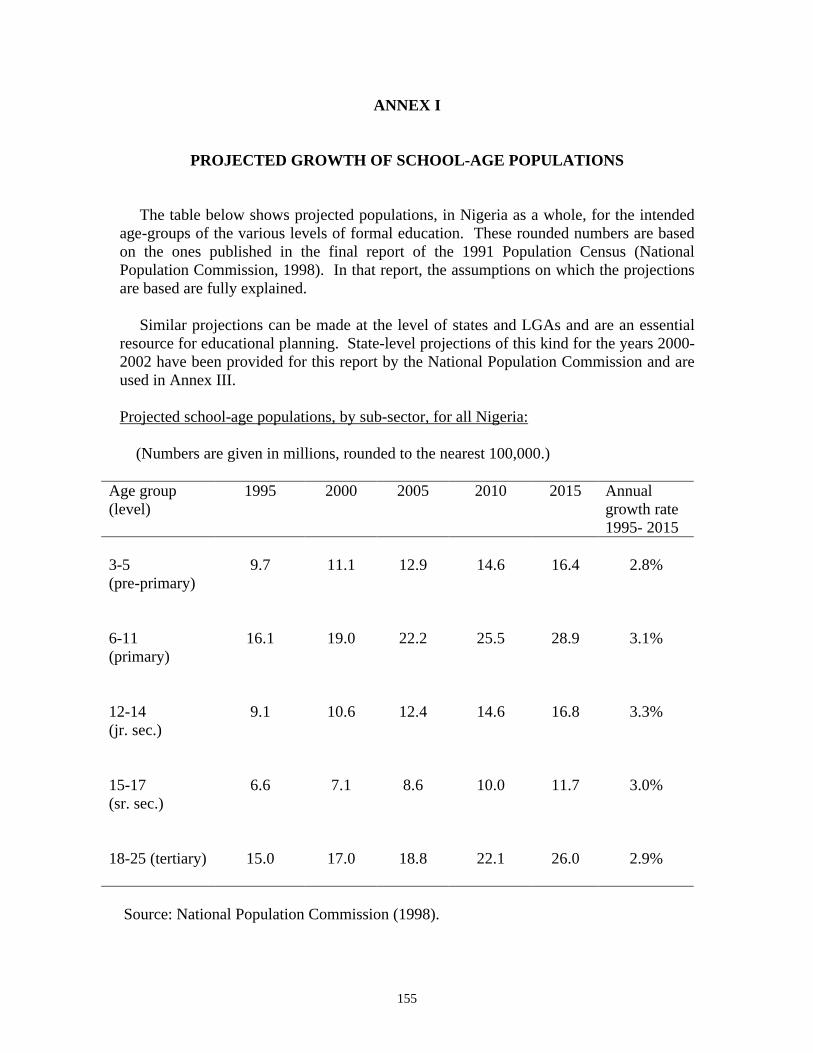
155
ANNEX I
PROJECTED GROWTH OF SCHOOL-AGE POPULATIONS The table below shows projected populations, in Nigeria as a whole, for the intended age-groups of the various levels of formal education. These rounded numbers are based on the ones published in the final report of the 1991 Population Census (National Population Commission, 1998). In that report, the assumptions on which the projections are based are fully explained. Similar projections can be made at the level of states and LGAs and are an essential resource for educational planning. State-level projections of this kind for the years 2000-2002 have been provided for this report by the National Population Commission and are used in Annex III. Projected school-age populations, by sub-sector, for all Nigeria: (Numbers are given in millions, rounded to the nearest 100,000.)
Age group (level)
1995 2000 2005 2010 2015 Annual growth rate 1995- 2015
3-5 (pre-primary)
9.7
11.1
12.9
14.6
16.4
2.8%
6-11 (primary)
16.1
19.0
22.2
25.5
28.9
3.1%
12-14 (jr. sec.)
9.1
10.6
12.4
14.6
16.8
3.3%
15-17 (sr. sec.)
6.6
7.1
8.6
10.0
11.7
3.0%
18-25 (tertiary)
15.0
17.0
18.8
22.1
26.0
2.9%
Source: National Population Commission (1998).
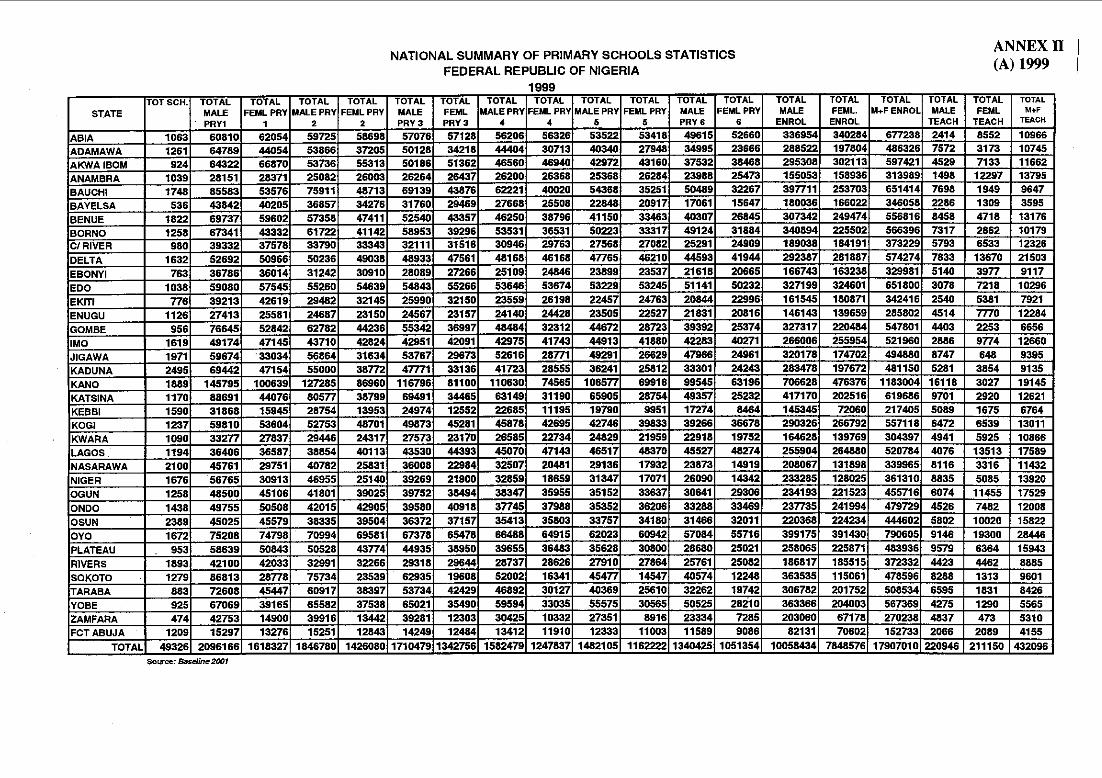
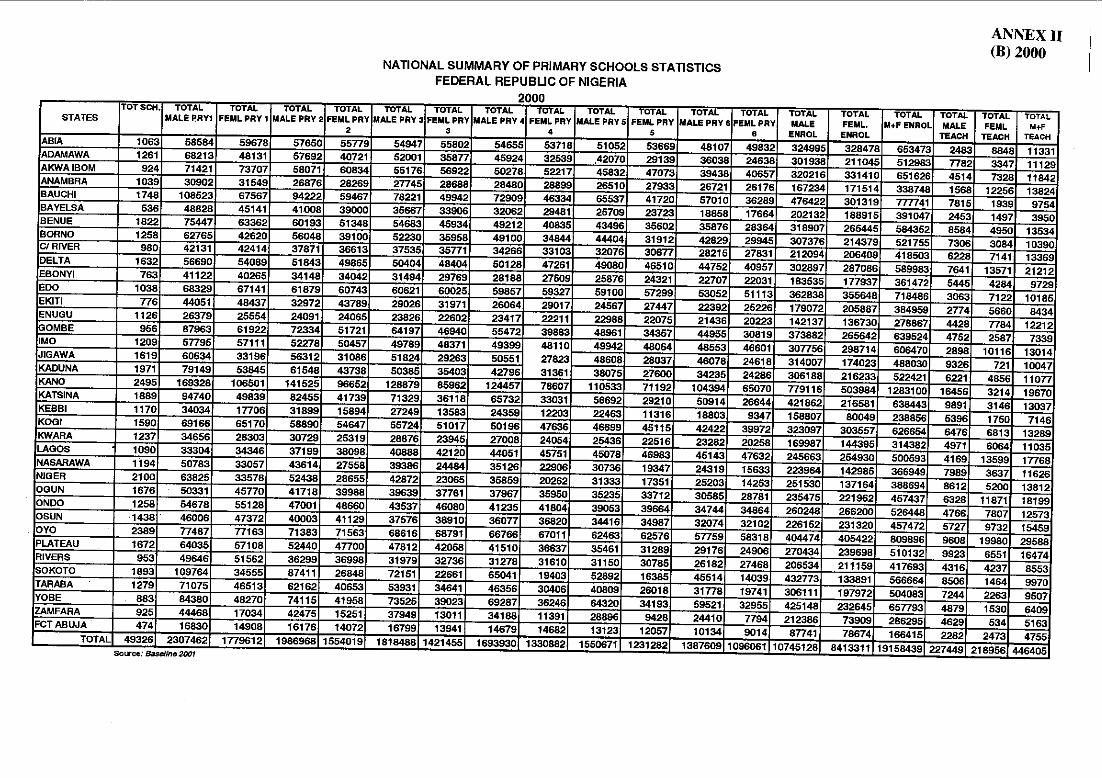
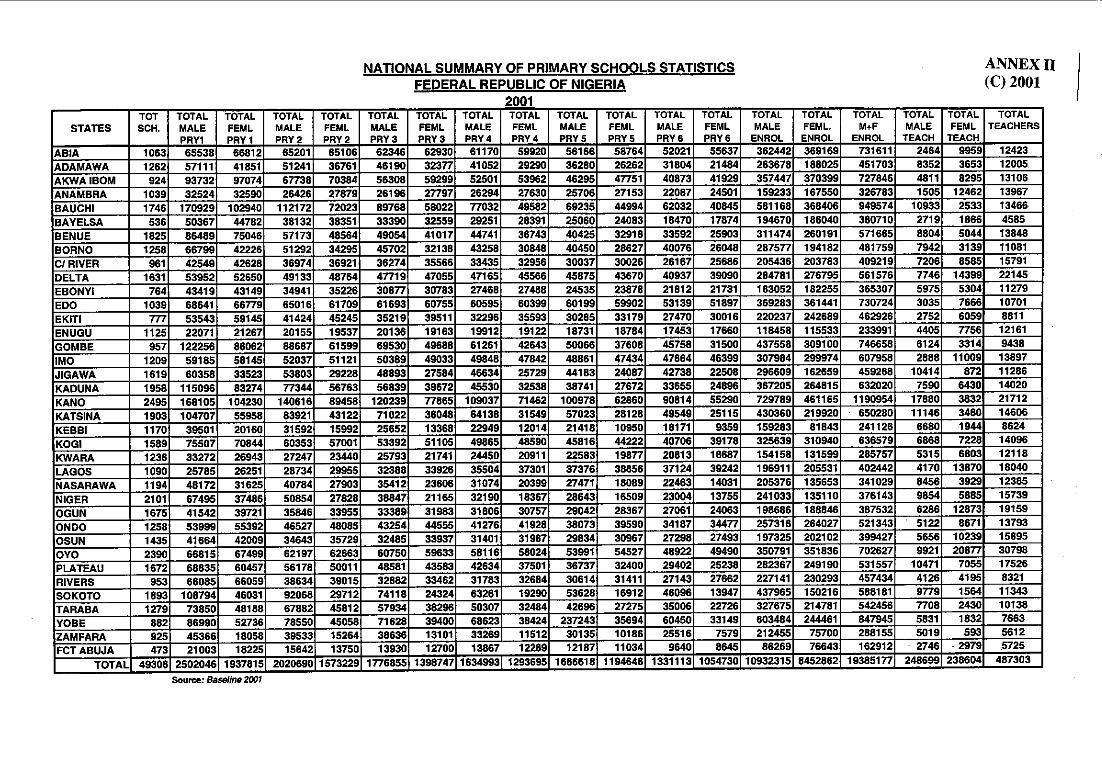
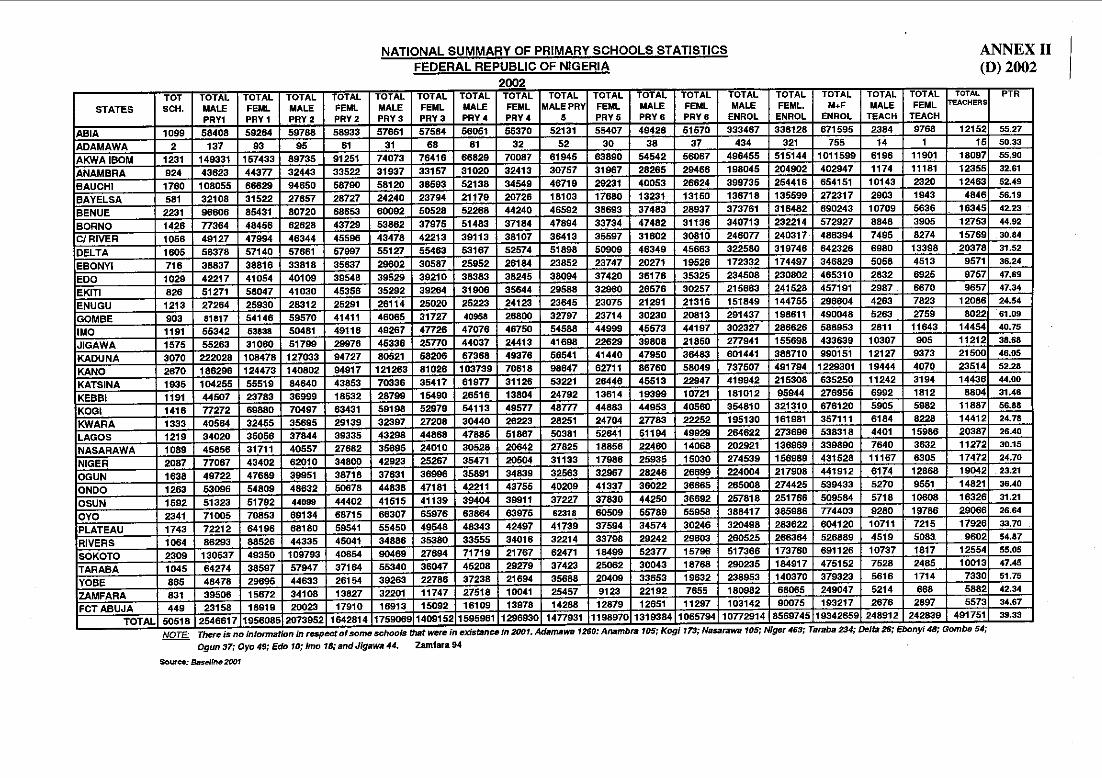
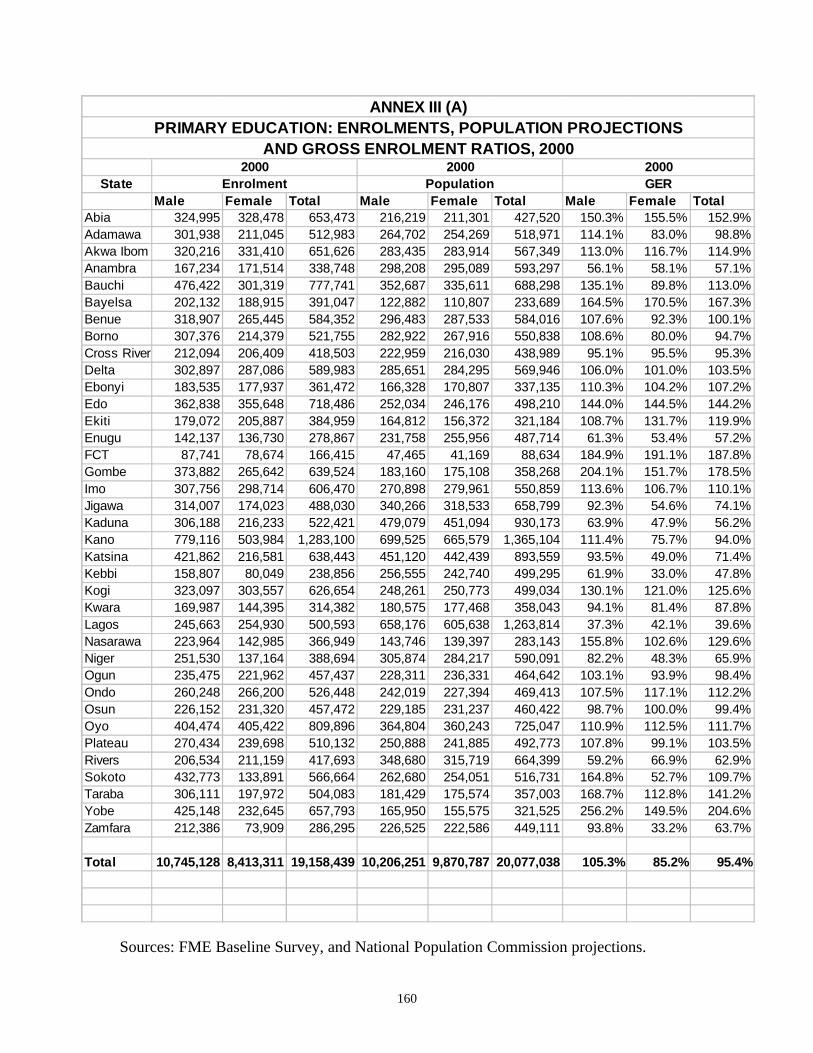
160
Sources: FME Baseline Survey, and National Population Commission projections.
StateMale Female Total Male Female Total Male Female Total
Abia 324,995 328,478 653,473 216,219 211,301 427,520 150.3% 155.5% 152.9%Adamawa 301,938 211,045 512,983 264,702 254,269 518,971 114.1% 83.0% 98.8%Akwa Ibom 320,216 331,410 651,626 283,435 283,914 567,349 113.0% 116.7% 114.9%Anambra 167,234 171,514 338,748 298,208 295,089 593,297 56.1% 58.1% 57.1%Bauchi 476,422 301,319 777,741 352,687 335,611 688,298 135.1% 89.8% 113.0%Bayelsa 202,132 188,915 391,047 122,882 110,807 233,689 164.5% 170.5% 167.3%Benue 318,907 265,445 584,352 296,483 287,533 584,016 107.6% 92.3% 100.1%Borno 307,376 214,379 521,755 282,922 267,916 550,838 108.6% 80.0% 94.7%Cross River 212,094 206,409 418,503 222,959 216,030 438,989 95.1% 95.5% 95.3%Delta 302,897 287,086 589,983 285,651 284,295 569,946 106.0% 101.0% 103.5%Ebonyi 183,535 177,937 361,472 166,328 170,807 337,135 110.3% 104.2% 107.2%Edo 362,838 355,648 718,486 252,034 246,176 498,210 144.0% 144.5% 144.2%Ekiti 179,072 205,887 384,959 164,812 156,372 321,184 108.7% 131.7% 119.9%Enugu 142,137 136,730 278,867 231,758 255,956 487,714 61.3% 53.4% 57.2%FCT 87,741 78,674 166,415 47,465 41,169 88,634 184.9% 191.1% 187.8%Gombe 373,882 265,642 639,524 183,160 175,108 358,268 204.1% 151.7% 178.5%Imo 307,756 298,714 606,470 270,898 279,961 550,859 113.6% 106.7% 110.1%Jigawa 314,007 174,023 488,030 340,266 318,533 658,799 92.3% 54.6% 74.1%Kaduna 306,188 216,233 522,421 479,079 451,094 930,173 63.9% 47.9% 56.2%Kano 779,116 503,984 1,283,100 699,525 665,579 1,365,104 111.4% 75.7% 94.0%Katsina 421,862 216,581 638,443 451,120 442,439 893,559 93.5% 49.0% 71.4%Kebbi 158,807 80,049 238,856 256,555 242,740 499,295 61.9% 33.0% 47.8%Kogi 323,097 303,557 626,654 248,261 250,773 499,034 130.1% 121.0% 125.6%Kwara 169,987 144,395 314,382 180,575 177,468 358,043 94.1% 81.4% 87.8%Lagos 245,663 254,930 500,593 658,176 605,638 1,263,814 37.3% 42.1% 39.6%Nasarawa 223,964 142,985 366,949 143,746 139,397 283,143 155.8% 102.6% 129.6%Niger 251,530 137,164 388,694 305,874 284,217 590,091 82.2% 48.3% 65.9%Ogun 235,475 221,962 457,437 228,311 236,331 464,642 103.1% 93.9% 98.4%Ondo 260,248 266,200 526,448 242,019 227,394 469,413 107.5% 117.1% 112.2%Osun 226,152 231,320 457,472 229,185 231,237 460,422 98.7% 100.0% 99.4%Oyo 404,474 405,422 809,896 364,804 360,243 725,047 110.9% 112.5% 111.7%Plateau 270,434 239,698 510,132 250,888 241,885 492,773 107.8% 99.1% 103.5%Rivers 206,534 211,159 417,693 348,680 315,719 664,399 59.2% 66.9% 62.9%Sokoto 432,773 133,891 566,664 262,680 254,051 516,731 164.8% 52.7% 109.7%Taraba 306,111 197,972 504,083 181,429 175,574 357,003 168.7% 112.8% 141.2%Yobe 425,148 232,645 657,793 165,950 155,575 321,525 256.2% 149.5% 204.6%Zamfara 212,386 73,909 286,295 226,525 222,586 449,111 93.8% 33.2% 63.7%
Total 10,745,128 8,413,311 19,158,439 10,206,251 9,870,787 20,077,038 105.3% 85.2% 95.4%
Enrolment Population GER
PRIMARY EDUCATION: ENROLMENTS, POPULATION PROJECTIONSANNEX III (A)
AND GROSS ENROLMENT RATIOS, 20002000 2000 2000
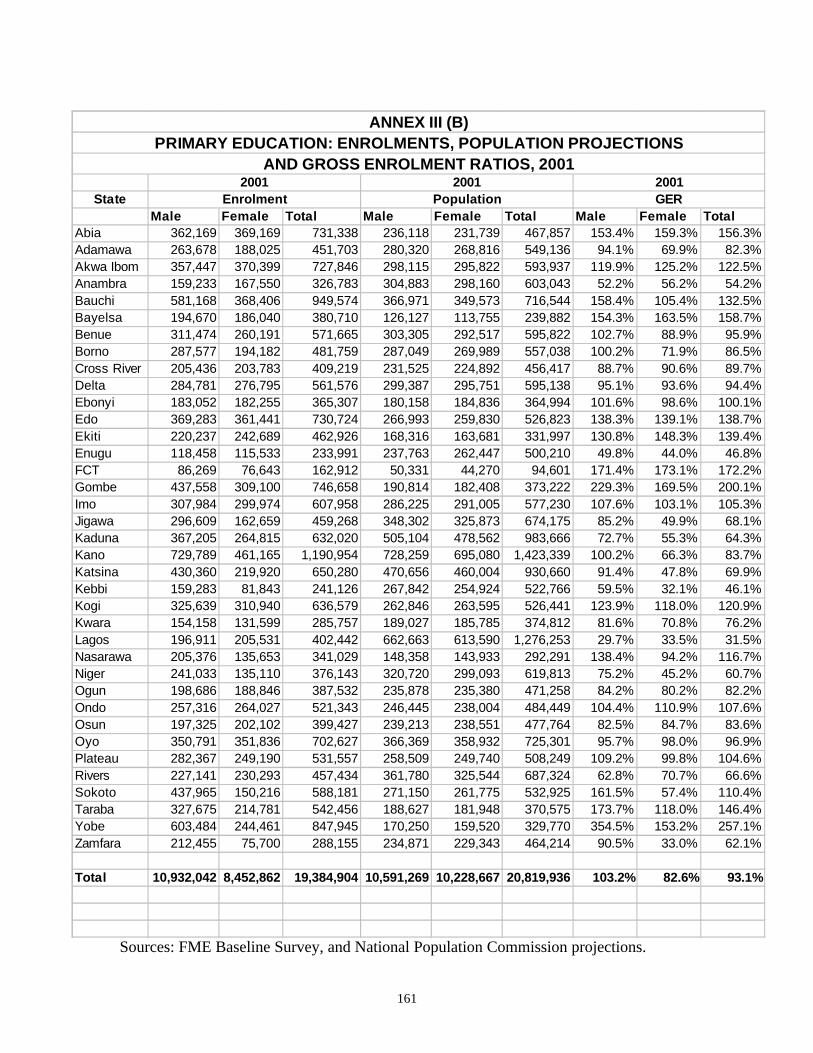
161
Sources: FME Baseline Survey, and National Population Commission projections.
StateMale Female Total Male Female Total Male Female Total
Abia 362,169 369,169 731,338 236,118 231,739 467,857 153.4% 159.3% 156.3%Adamawa 263,678 188,025 451,703 280,320 268,816 549,136 94.1% 69.9% 82.3%Akwa Ibom 357,447 370,399 727,846 298,115 295,822 593,937 119.9% 125.2% 122.5%Anambra 159,233 167,550 326,783 304,883 298,160 603,043 52.2% 56.2% 54.2%Bauchi 581,168 368,406 949,574 366,971 349,573 716,544 158.4% 105.4% 132.5%Bayelsa 194,670 186,040 380,710 126,127 113,755 239,882 154.3% 163.5% 158.7%Benue 311,474 260,191 571,665 303,305 292,517 595,822 102.7% 88.9% 95.9%Borno 287,577 194,182 481,759 287,049 269,989 557,038 100.2% 71.9% 86.5%Cross River 205,436 203,783 409,219 231,525 224,892 456,417 88.7% 90.6% 89.7%Delta 284,781 276,795 561,576 299,387 295,751 595,138 95.1% 93.6% 94.4%Ebonyi 183,052 182,255 365,307 180,158 184,836 364,994 101.6% 98.6% 100.1%Edo 369,283 361,441 730,724 266,993 259,830 526,823 138.3% 139.1% 138.7%Ekiti 220,237 242,689 462,926 168,316 163,681 331,997 130.8% 148.3% 139.4%Enugu 118,458 115,533 233,991 237,763 262,447 500,210 49.8% 44.0% 46.8%FCT 86,269 76,643 162,912 50,331 44,270 94,601 171.4% 173.1% 172.2%Gombe 437,558 309,100 746,658 190,814 182,408 373,222 229.3% 169.5% 200.1%Imo 307,984 299,974 607,958 286,225 291,005 577,230 107.6% 103.1% 105.3%Jigawa 296,609 162,659 459,268 348,302 325,873 674,175 85.2% 49.9% 68.1%Kaduna 367,205 264,815 632,020 505,104 478,562 983,666 72.7% 55.3% 64.3%Kano 729,789 461,165 1,190,954 728,259 695,080 1,423,339 100.2% 66.3% 83.7%Katsina 430,360 219,920 650,280 470,656 460,004 930,660 91.4% 47.8% 69.9%Kebbi 159,283 81,843 241,126 267,842 254,924 522,766 59.5% 32.1% 46.1%Kogi 325,639 310,940 636,579 262,846 263,595 526,441 123.9% 118.0% 120.9%Kwara 154,158 131,599 285,757 189,027 185,785 374,812 81.6% 70.8% 76.2%Lagos 196,911 205,531 402,442 662,663 613,590 1,276,253 29.7% 33.5% 31.5%Nasarawa 205,376 135,653 341,029 148,358 143,933 292,291 138.4% 94.2% 116.7%Niger 241,033 135,110 376,143 320,720 299,093 619,813 75.2% 45.2% 60.7%Ogun 198,686 188,846 387,532 235,878 235,380 471,258 84.2% 80.2% 82.2%Ondo 257,316 264,027 521,343 246,445 238,004 484,449 104.4% 110.9% 107.6%Osun 197,325 202,102 399,427 239,213 238,551 477,764 82.5% 84.7% 83.6%Oyo 350,791 351,836 702,627 366,369 358,932 725,301 95.7% 98.0% 96.9%Plateau 282,367 249,190 531,557 258,509 249,740 508,249 109.2% 99.8% 104.6%Rivers 227,141 230,293 457,434 361,780 325,544 687,324 62.8% 70.7% 66.6%Sokoto 437,965 150,216 588,181 271,150 261,775 532,925 161.5% 57.4% 110.4%Taraba 327,675 214,781 542,456 188,627 181,948 370,575 173.7% 118.0% 146.4%Yobe 603,484 244,461 847,945 170,250 159,520 329,770 354.5% 153.2% 257.1%Zamfara 212,455 75,700 288,155 234,871 229,343 464,214 90.5% 33.0% 62.1%
Total 10,932,042 8,452,862 19,384,904 10,591,269 10,228,667 20,819,936 103.2% 82.6% 93.1%
Enrolment Population GER
PRIMARY EDUCATION: ENROLMENTS, POPULATION PROJECTIONSANNEX III (B)
AND GROSS ENROLMENT RATIOS, 20012001 2001 2001
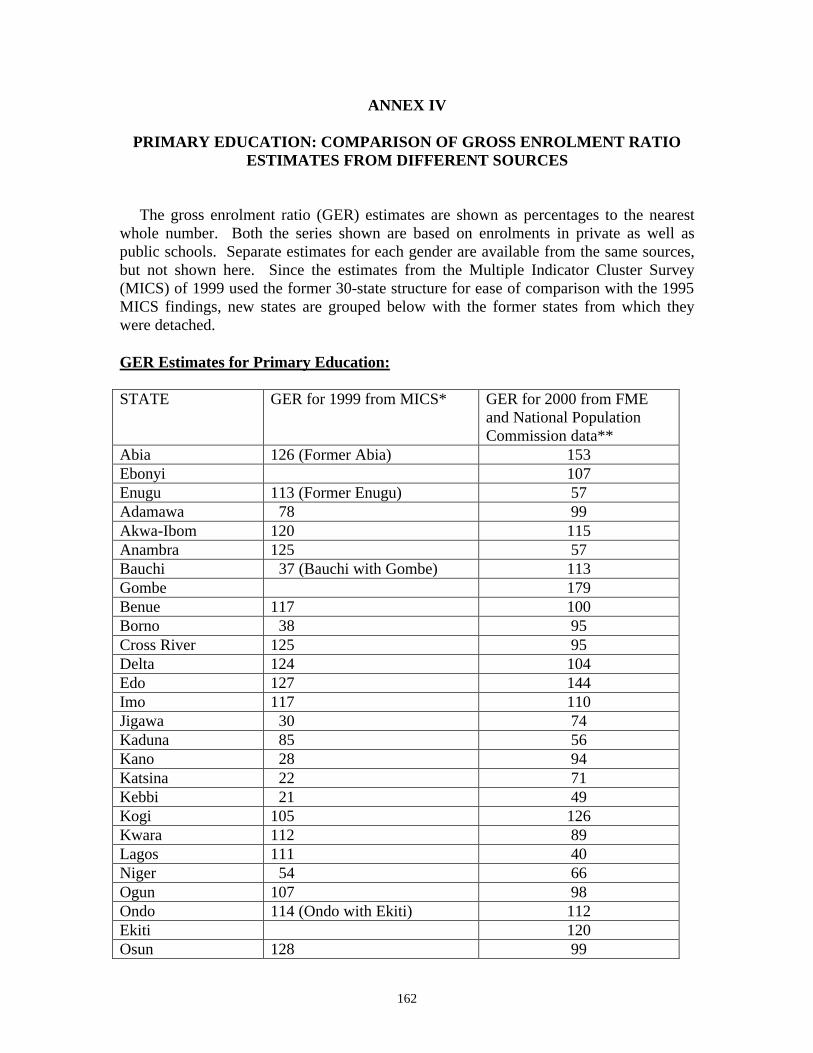
162
ANNEX IV
PRIMARY EDUCATION: COMPARISON OF GROSS ENROLMENT RATIO ESTIMATES FROM DIFFERENT SOURCES
The gross enrolment ratio (GER) estimates are shown as percentages to the nearest whole number. Both the series shown are based on enrolments in private as well as public schools. Separate estimates for each gender are available from the same sources, but not shown here. Since the estimates from the Multiple Indicator Cluster Survey (MICS) of 1999 used the former 30-state structure for ease of comparison with the 1995 MICS findings, new states are grouped below with the former states from which they were detached. GER Estimates for Primary Education: STATE GER for 1999 from MICS* GER for 2000 from FME
and National Population Commission data**
Abia 126 (Former Abia) 153 Ebonyi 107 Enugu 113 (Former Enugu) 57 Adamawa 78 99 Akwa-Ibom 120 115 Anambra 125 57 Bauchi 37 (Bauchi with Gombe) 113 Gombe 179 Benue 117 100 Borno 38 95 Cross River 125 95 Delta 124 104 Edo 127 144 Imo 117 110 Jigawa 30 74 Kaduna 85 56 Kano 28 94 Katsina 22 71 Kebbi 21 49 Kogi 105 126 Kwara 112 89 Lagos 111 40 Niger 54 66 Ogun 107 98 Ondo 114 (Ondo with Ekiti) 112 Ekiti 120 Osun 128 99
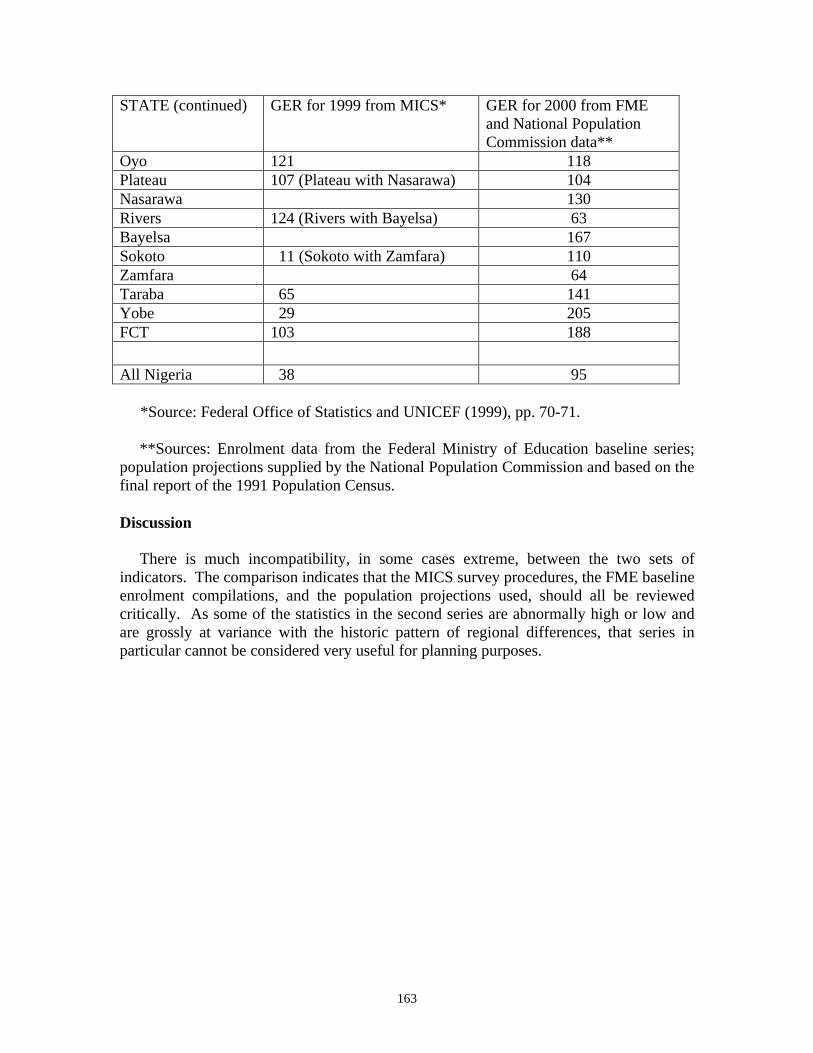
163
STATE (continued) GER for 1999 from MICS* GER for 2000 from FME and National Population Commission data**
Oyo 121 118 Plateau 107 (Plateau with Nasarawa) 104 Nasarawa 130 Rivers 124 (Rivers with Bayelsa) 63 Bayelsa 167 Sokoto 11 (Sokoto with Zamfara) 110 Zamfara 64 Taraba 65 141 Yobe 29 205 FCT 103 188 All Nigeria 38 95 *Source: Federal Office of Statistics and UNICEF (1999), pp. 70-71. **Sources: Enrolment data from the Federal Ministry of Education baseline series; population projections supplied by the National Population Commission and based on the final report of the 1991 Population Census. Discussion There is much incompatibility, in some cases extreme, between the two sets of indicators. The comparison indicates that the MICS survey procedures, the FME baseline enrolment compilations, and the population projections used, should all be reviewed critically. As some of the statistics in the second series are abnormally high or low and are grossly at variance with the historic pattern of regional differences, that series in particular cannot be considered very useful for planning purposes.
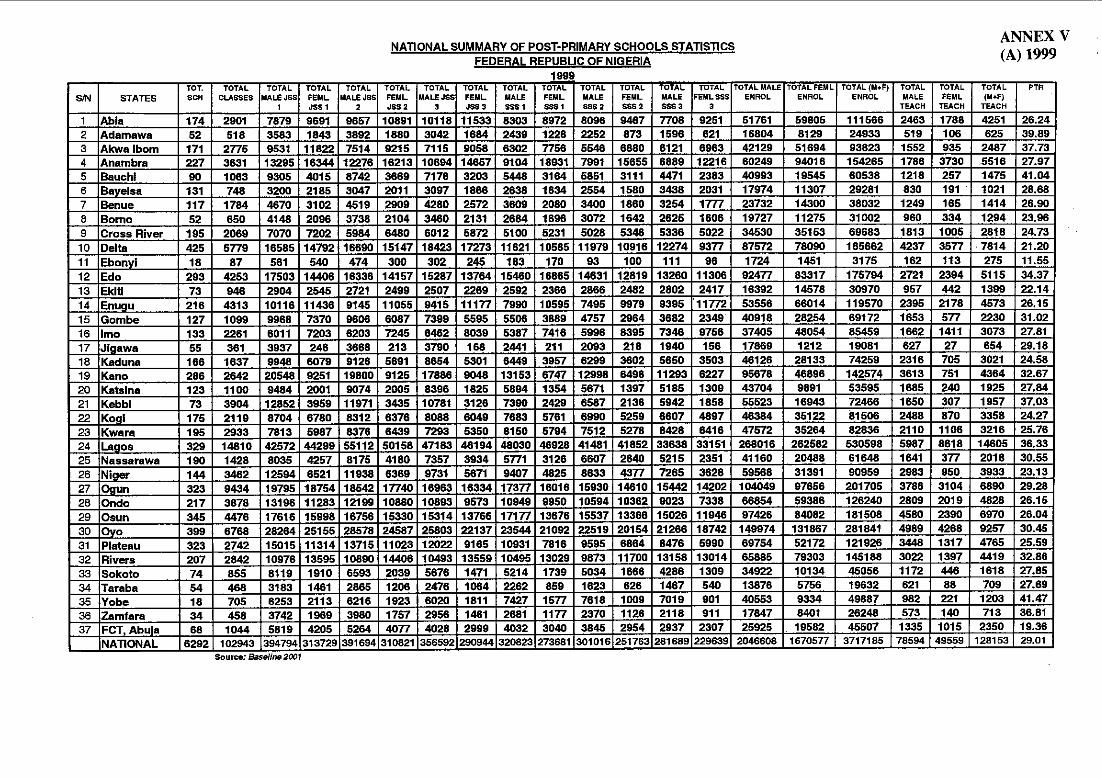
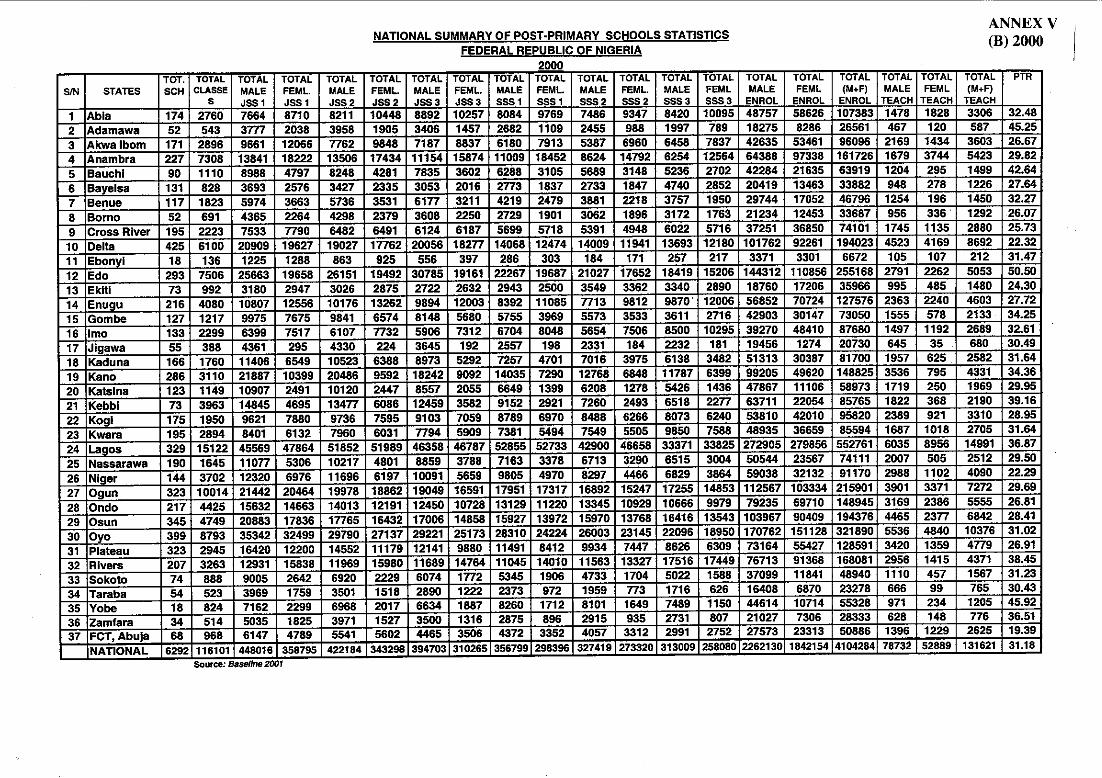
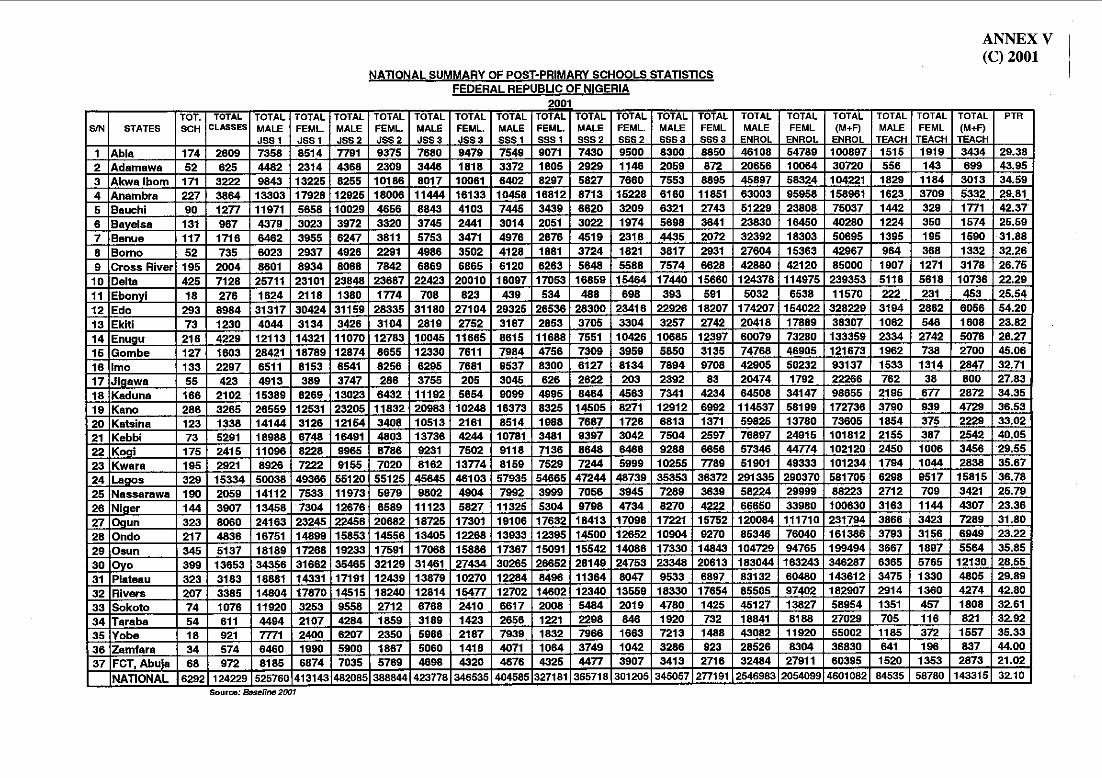
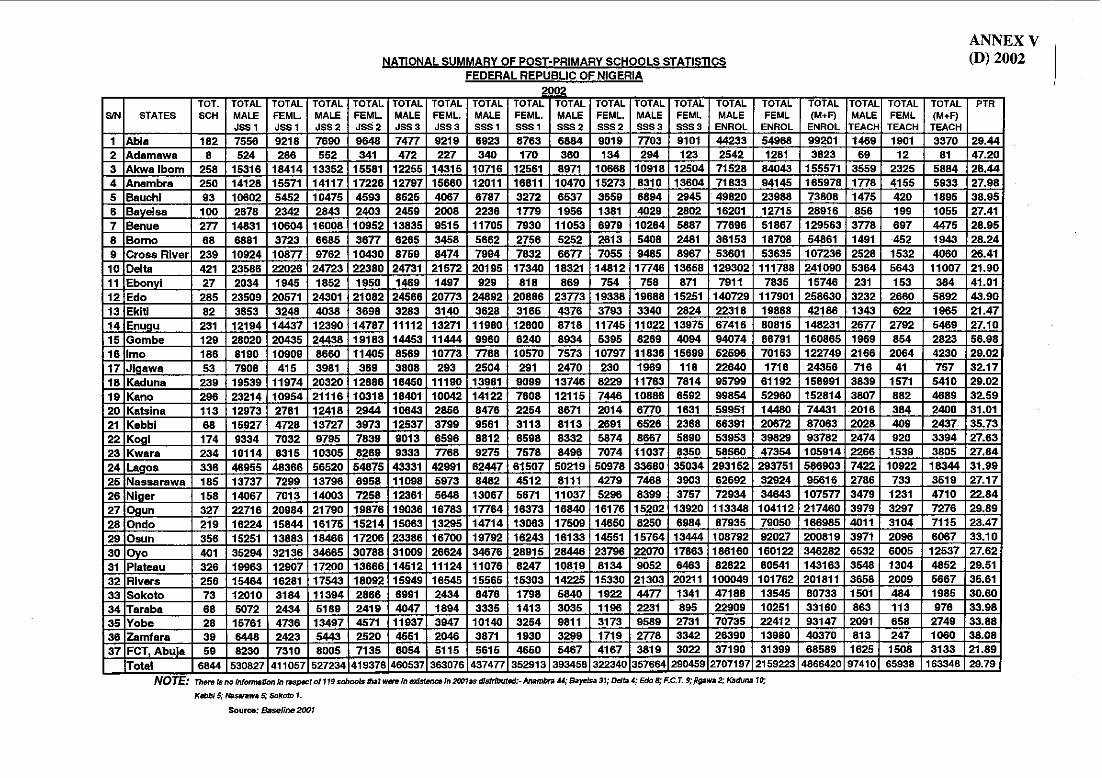
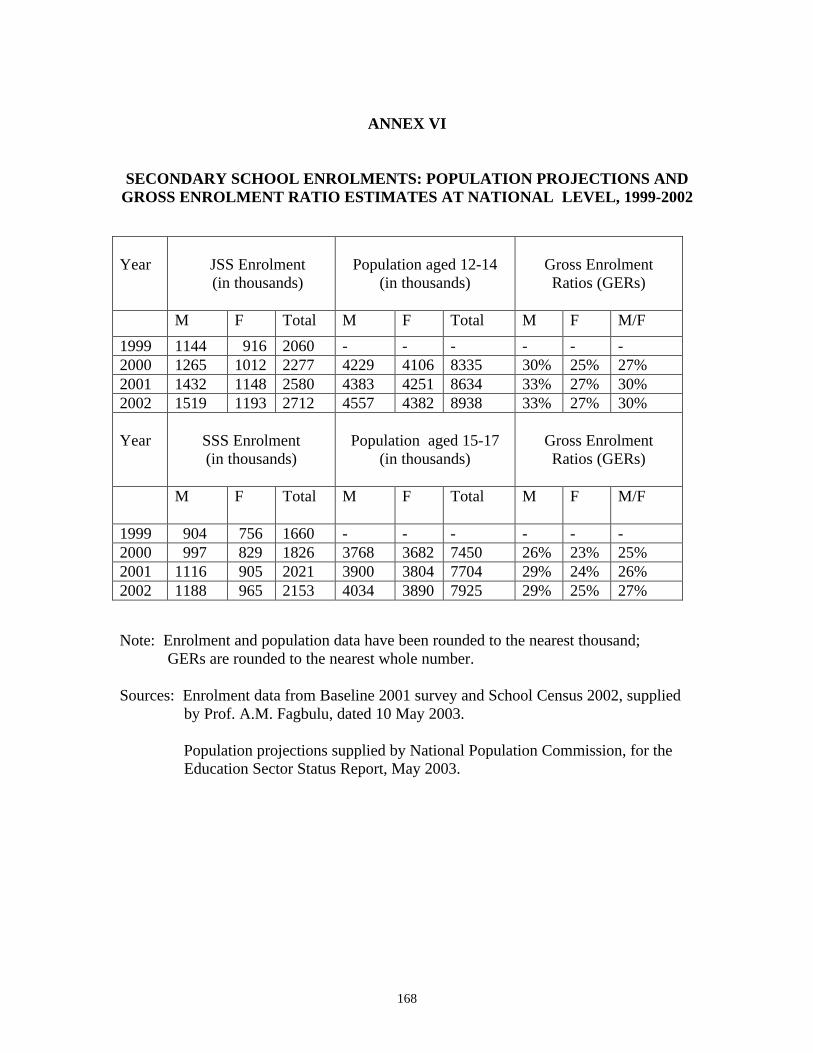
168
ANNEX VI
SECONDARY SCHOOL ENROLMENTS: POPULATION PROJECTIONS AND GROSS ENROLMENT RATIO ESTIMATES AT NATIONAL LEVEL, 1999-2002 Year
JSS Enrolment (in thousands)
Population aged 12-14
(in thousands)
Gross Enrolment Ratios (GERs)
M F Total M F Total M F M/F
1999 1144 916 2060 - - - - - - 2000 1265 1012 2277 4229 4106 8335 30% 25% 27% 2001 1432 1148 2580 4383 4251 8634 33% 27% 30% 2002 1519 1193 2712 4557 4382 8938 33% 27% 30% Year
SSS Enrolment (in thousands)
Population aged 15-17
(in thousands)
Gross Enrolment Ratios (GERs)
M F Total M F Total M F M/F
1999 904 756 1660 - - - - - - 2000 997 829 1826 3768 3682 7450 26% 23% 25% 2001 1116 905 2021 3900 3804 7704 29% 24% 26% 2002 1188 965 2153 4034 3890 7925 29% 25% 27% Note: Enrolment and population data have been rounded to the nearest thousand; GERs are rounded to the nearest whole number. Sources: Enrolment data from Baseline 2001 survey and School Census 2002, supplied
by Prof. A.M. Fagbulu, dated 10 May 2003. Population projections supplied by National Population Commission, for the Education Sector Status Report, May 2003.
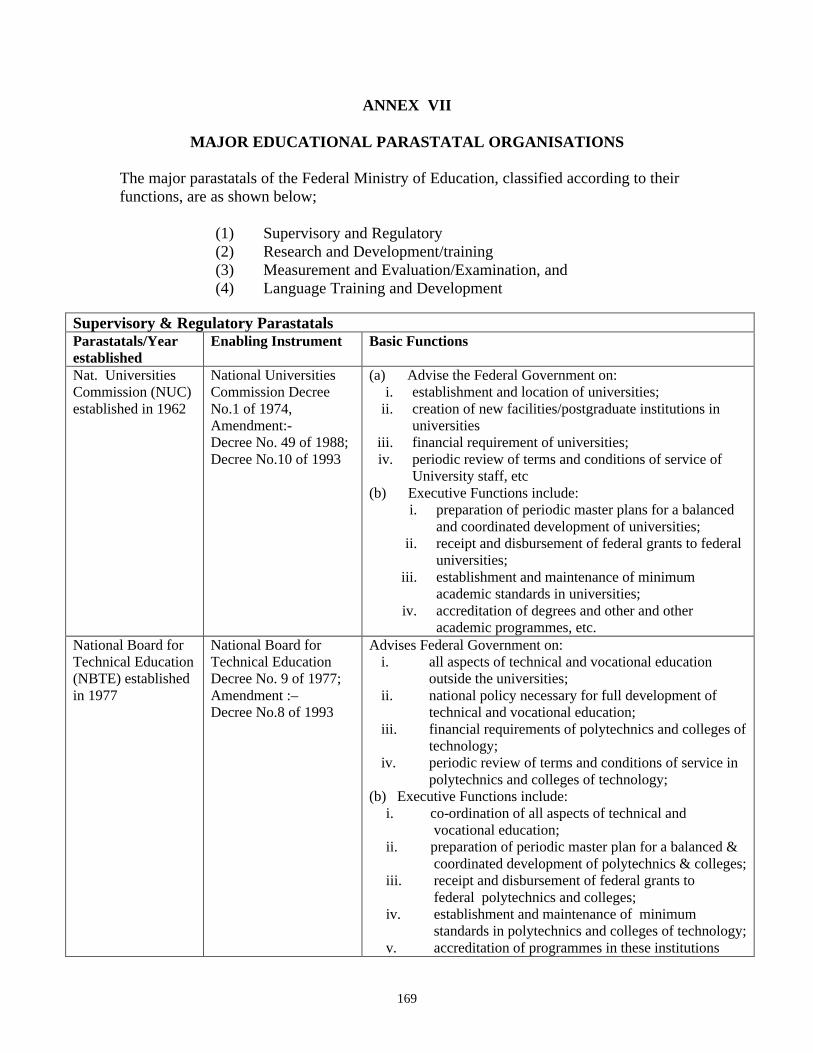
169
ANNEX VII
MAJOR EDUCATIONAL PARASTATAL ORGANISATIONS
The major parastatals of the Federal Ministry of Education, classified according to their functions, are as shown below;
(1) Supervisory and Regulatory (2) Research and Development/training (3) Measurement and Evaluation/Examination, and (4) Language Training and Development
Supervisory & Regulatory Parastatals Parastatals/Year established
Enabling Instrument Basic Functions
Nat. Universities Commission (NUC) established in 1962
National Universities Commission Decree No.1 of 1974, Amendment:- Decree No. 49 of 1988; Decree No.10 of 1993
(a) Advise the Federal Government on: i. establishment and location of universities;
ii. creation of new facilities/postgraduate institutions in universities
iii. financial requirement of universities; iv. periodic review of terms and conditions of service of
University staff, etc (b) Executive Functions include:
i. preparation of periodic master plans for a balanced and coordinated development of universities;
ii. receipt and disbursement of federal grants to federal universities;
iii. establishment and maintenance of minimum academic standards in universities;
iv. accreditation of degrees and other and other academic programmes, etc.
National Board for Technical Education (NBTE) established in 1977
National Board for Technical Education Decree No. 9 of 1977; Amendment :– Decree No.8 of 1993
Advises Federal Government on: i. all aspects of technical and vocational education
outside the universities; ii. national policy necessary for full development of
technical and vocational education; iii. financial requirements of polytechnics and colleges of
technology; iv. periodic review of terms and conditions of service in
polytechnics and colleges of technology; (b) Executive Functions include:
i. co-ordination of all aspects of technical and vocational education;
ii. preparation of periodic master plan for a balanced & coordinated development of polytechnics & colleges;
iii. receipt and disbursement of federal grants to federal polytechnics and colleges;
iv. establishment and maintenance of minimum standards in polytechnics and colleges of technology;
v. accreditation of programmes in these institutions
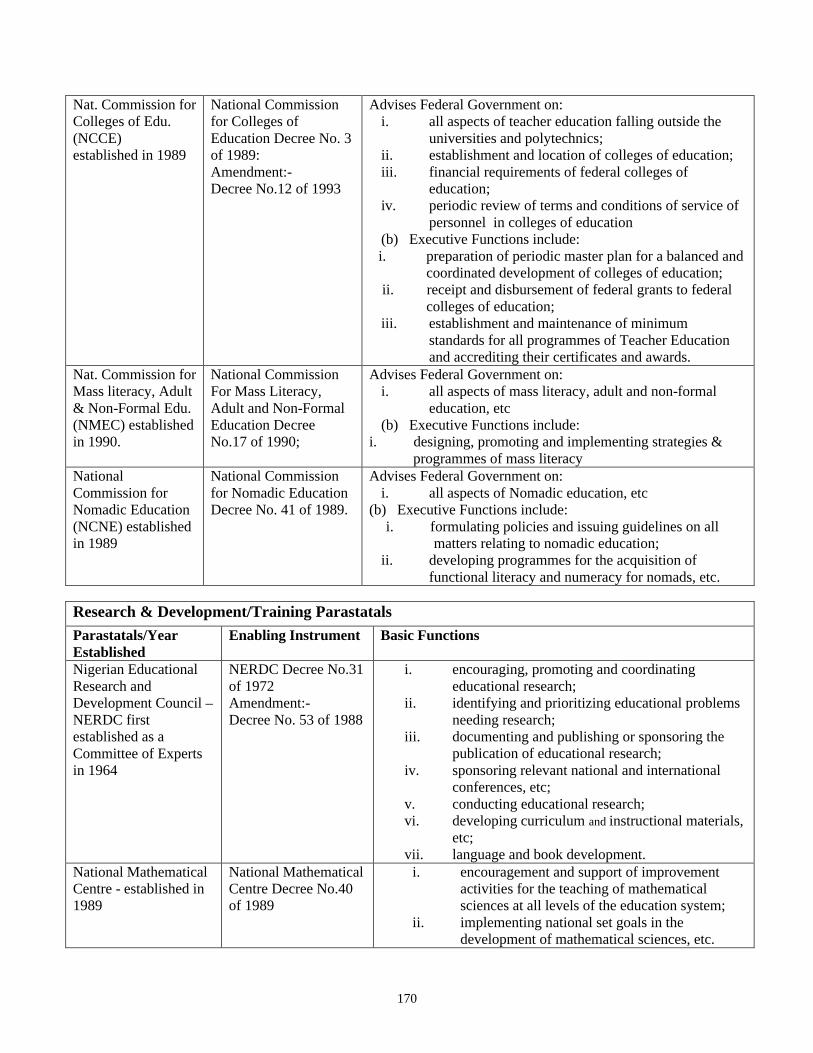
170
Nat. Commission for Colleges of Edu. (NCCE) established in 1989
National Commission for Colleges of Education Decree No. 3 of 1989: Amendment:- Decree No.12 of 1993
Advises Federal Government on: i. all aspects of teacher education falling outside the
universities and polytechnics; ii. establishment and location of colleges of education; iii. financial requirements of federal colleges of
education; iv. periodic review of terms and conditions of service of
personnel in colleges of education (b) Executive Functions include: i. preparation of periodic master plan for a balanced and
coordinated development of colleges of education; ii. receipt and disbursement of federal grants to federal
colleges of education; iii. establishment and maintenance of minimum
standards for all programmes of Teacher Education and accrediting their certificates and awards.
Nat. Commission for Mass literacy, Adult & Non-Formal Edu. (NMEC) established in 1990.
National Commission For Mass Literacy, Adult and Non-Formal Education Decree No.17 of 1990;
Advises Federal Government on: i. all aspects of mass literacy, adult and non-formal
education, etc (b) Executive Functions include:
i. designing, promoting and implementing strategies & programmes of mass literacy
National Commission for Nomadic Education (NCNE) established in 1989
National Commission for Nomadic Education Decree No. 41 of 1989.
Advises Federal Government on: i. all aspects of Nomadic education, etc
(b) Executive Functions include: i. formulating policies and issuing guidelines on all
matters relating to nomadic education; ii. developing programmes for the acquisition of
functional literacy and numeracy for nomads, etc.
Research & Development/Training Parastatals Parastatals/Year Established
Enabling Instrument Basic Functions
Nigerian Educational Research and Development Council – NERDC first established as a Committee of Experts in 1964
NERDC Decree No.31 of 1972 Amendment:- Decree No. 53 of 1988
i. encouraging, promoting and coordinating educational research;
ii. identifying and prioritizing educational problems needing research;
iii. documenting and publishing or sponsoring the publication of educational research;
iv. sponsoring relevant national and international conferences, etc;
v. conducting educational research; vi. developing curriculum and instructional materials,
etc; vii. language and book development.
National Mathematical Centre - established in 1989
National Mathematical Centre Decree No.40 of 1989
i. encouragement and support of improvement activities for the teaching of mathematical sciences at all levels of the education system;
ii. implementing national set goals in the development of mathematical sciences, etc.
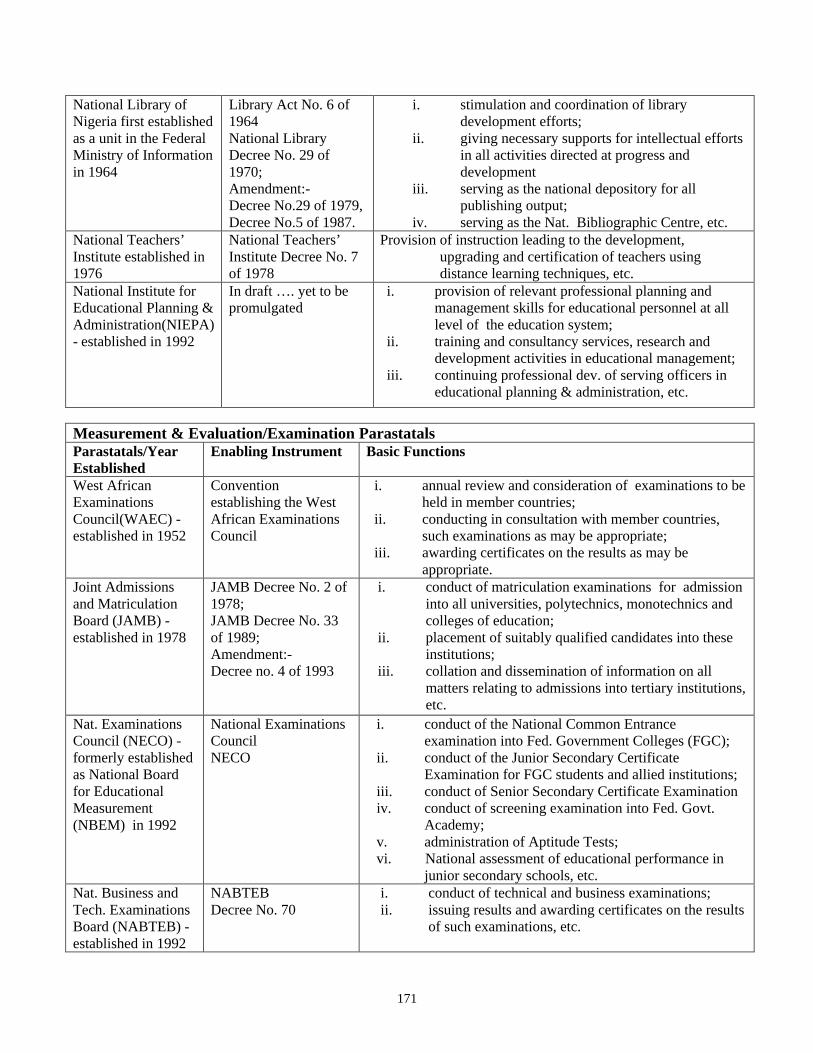
171
National Library of Nigeria first established as a unit in the Federal Ministry of Information in 1964
Library Act No. 6 of 1964 National Library Decree No. 29 of 1970; Amendment:- Decree No.29 of 1979, Decree No.5 of 1987.
i. stimulation and coordination of library development efforts;
ii. giving necessary supports for intellectual efforts in all activities directed at progress and development
iii. serving as the national depository for all publishing output;
iv. serving as the Nat. Bibliographic Centre, etc. National Teachers’ Institute established in 1976
National Teachers’ Institute Decree No. 7 of 1978
Provision of instruction leading to the development, upgrading and certification of teachers using distance learning techniques, etc.
National Institute for Educational Planning & Administration(NIEPA) - established in 1992
In draft …. yet to be promulgated
i. provision of relevant professional planning and management skills for educational personnel at all level of the education system;
ii. training and consultancy services, research and development activities in educational management;
iii. continuing professional dev. of serving officers in educational planning & administration, etc.
Measurement & Evaluation/Examination Parastatals Parastatals/Year Established
Enabling Instrument Basic Functions
West African Examinations Council(WAEC) - established in 1952
Convention establishing the West African Examinations Council
i. annual review and consideration of examinations to be held in member countries;
ii. conducting in consultation with member countries, such examinations as may be appropriate;
iii. awarding certificates on the results as may be appropriate.
Joint Admissions and Matriculation Board (JAMB) - established in 1978
JAMB Decree No. 2 of 1978; JAMB Decree No. 33 of 1989; Amendment:- Decree no. 4 of 1993
i. conduct of matriculation examinations for admission into all universities, polytechnics, monotechnics and colleges of education;
ii. placement of suitably qualified candidates into these institutions;
iii. collation and dissemination of information on all matters relating to admissions into tertiary institutions, etc.
Nat. Examinations Council (NECO) - formerly established as National Board for Educational Measurement (NBEM) in 1992
National Examinations Council NECO
i. conduct of the National Common Entrance examination into Fed. Government Colleges (FGC);
ii. conduct of the Junior Secondary Certificate Examination for FGC students and allied institutions;
iii. conduct of Senior Secondary Certificate Examination iv. conduct of screening examination into Fed. Govt.
Academy; v. administration of Aptitude Tests; vi. National assessment of educational performance in
junior secondary schools, etc. Nat. Business and Tech. Examinations Board (NABTEB) - established in 1992
NABTEB Decree No. 70
i. conduct of technical and business examinations; ii. issuing results and awarding certificates on the results
of such examinations, etc.
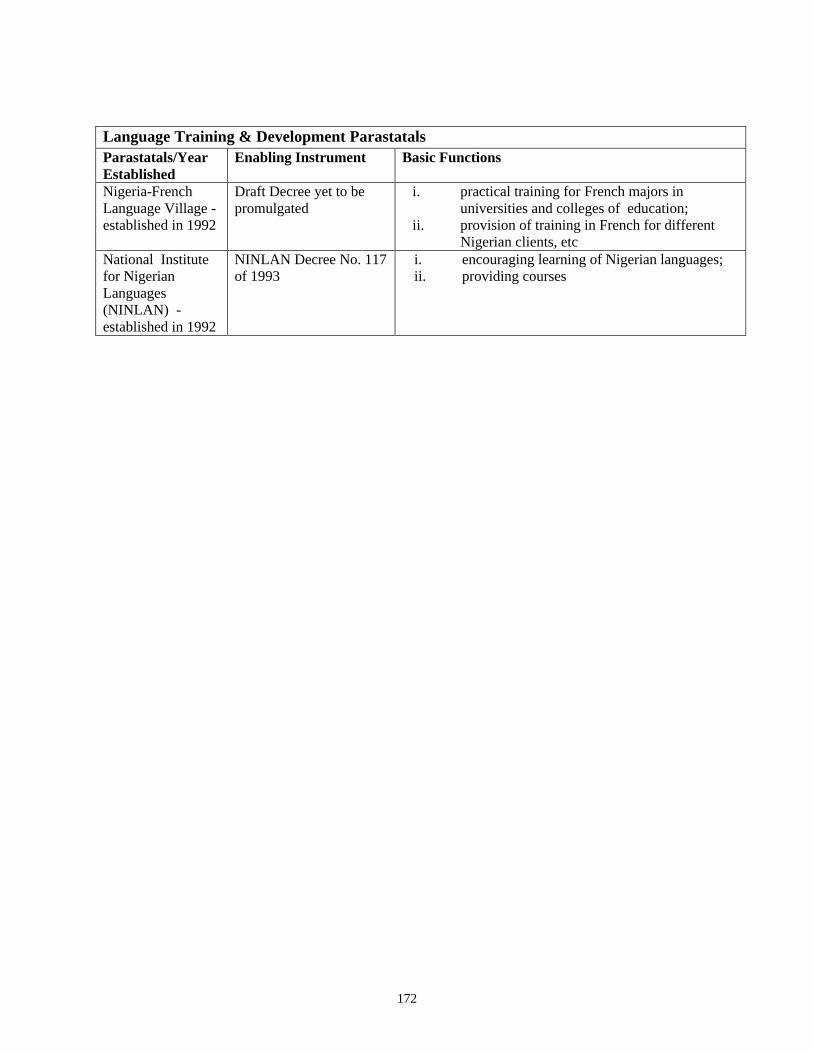
172
Language Training & Development Parastatals Parastatals/Year Established
Enabling Instrument Basic Functions
Nigeria-French Language Village - established in 1992
Draft Decree yet to be promulgated
i. practical training for French majors in universities and colleges of education;
ii. provision of training in French for different Nigerian clients, etc
National Institute for Nigerian Languages (NINLAN) -established in 1992
NINLAN Decree No. 117 of 1993
i. encouraging learning of Nigerian languages; ii. providing courses
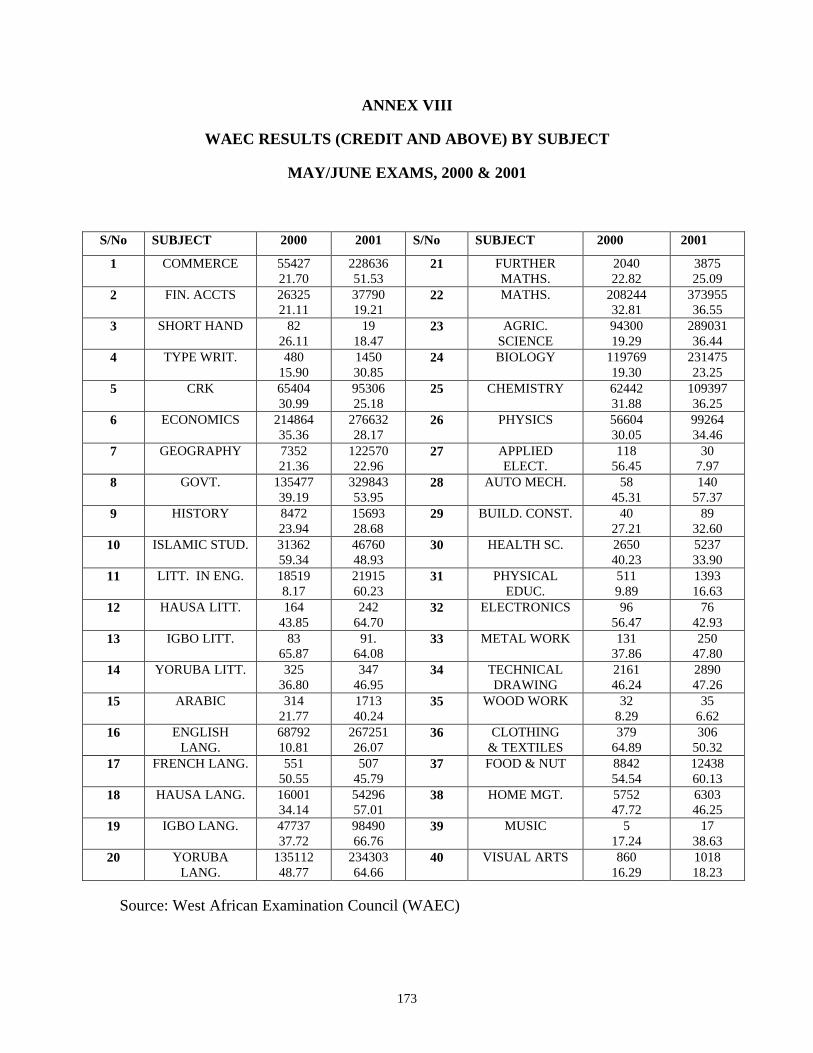
173
ANNEX VIII
WAEC RESULTS (CREDIT AND ABOVE) BY SUBJECT
MAY/JUNE EXAMS, 2000 & 2001
S/No SUBJECT 2000 2001 S/No SUBJECT 2000 2001
1 COMMERCE 55427 21.70
228636 51.53
21 FURTHER MATHS.
2040 22.82
3875 25.09
2 FIN. ACCTS 26325 21.11
37790 19.21
22 MATHS. 208244 32.81
373955 36.55
3 SHORT HAND 82 26.11
19 18.47
23 AGRIC. SCIENCE
94300 19.29
289031 36.44
4 TYPE WRIT. 480 15.90
1450 30.85
24 BIOLOGY 119769 19.30
231475 23.25
5 CRK 65404 30.99
95306 25.18
25 CHEMISTRY 62442 31.88
109397 36.25
6 ECONOMICS 214864 35.36
276632 28.17
26 PHYSICS 56604 30.05
99264 34.46
7 GEOGRAPHY 7352 21.36
122570 22.96
27 APPLIED ELECT.
118 56.45
30 7.97
8 GOVT. 135477 39.19
329843 53.95
28 AUTO MECH. 58 45.31
140 57.37
9 HISTORY 8472 23.94
15693 28.68
29 BUILD. CONST. 40 27.21
89 32.60
10 ISLAMIC STUD. 31362 59.34
46760 48.93
30 HEALTH SC. 2650 40.23
5237 33.90
11 LITT. IN ENG. 18519 8.17
21915 60.23
31 PHYSICAL EDUC.
511 9.89
1393 16.63
12 HAUSA LITT. 164 43.85
242 64.70
32 ELECTRONICS 96 56.47
76 42.93
13 IGBO LITT. 83 65.87
91. 64.08
33 METAL WORK 131 37.86
250 47.80
14 YORUBA LITT. 325 36.80
347 46.95
34 TECHNICAL DRAWING
2161 46.24
2890 47.26
15 ARABIC 314 21.77
1713 40.24
35 WOOD WORK 32 8.29
35 6.62
16 ENGLISH LANG.
68792 10.81
267251 26.07
36 CLOTHING & TEXTILES
379 64.89
306 50.32
17 FRENCH LANG. 551 50.55
507 45.79
37 FOOD & NUT 8842 54.54
12438 60.13
18 HAUSA LANG. 16001 34.14
54296 57.01
38 HOME MGT. 5752 47.72
6303 46.25
19 IGBO LANG. 47737 37.72
98490 66.76
39 MUSIC 5 17.24
17 38.63
20 YORUBA LANG.
135112 48.77
234303 64.66
40 VISUAL ARTS 860 16.29
1018 18.23
Source: West African Examination Council (WAEC)
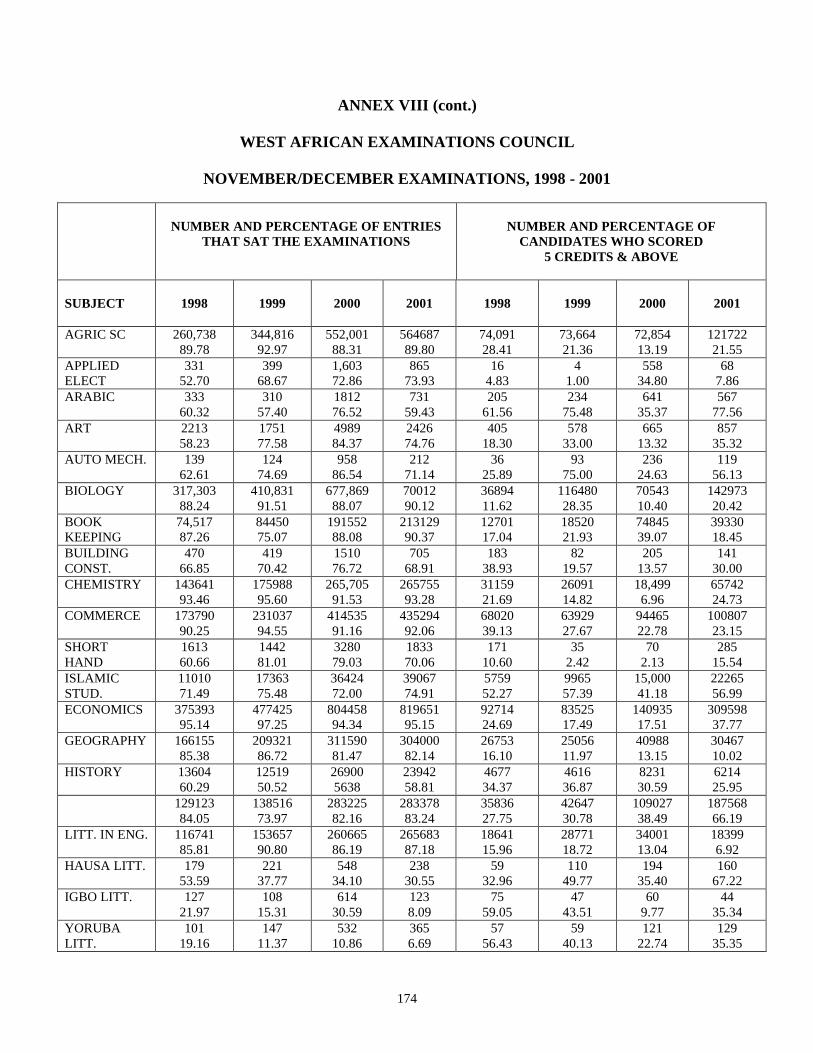
174
ANNEX VIII (cont.)
WEST AFRICAN EXAMINATIONS COUNCIL
NOVEMBER/DECEMBER EXAMINATIONS, 1998 - 2001
NUMBER AND PERCENTAGE OF ENTRIES
THAT SAT THE EXAMINATIONS
NUMBER AND PERCENTAGE OF
CANDIDATES WHO SCORED 5 CREDITS & ABOVE
SUBJECT
1998
1999
2000
2001
1998
1999
2000
2001
AGRIC SC 260,738
89.78 344,816
92.97 552,001 88.31
564687 89.80
74,091 28.41
73,664 21.36
72,854 13.19
121722 21.55
APPLIED ELECT
331 52.70
399 68.67
1,603 72.86
865 73.93
16 4.83
4 1.00
558 34.80
68 7.86
ARABIC 333 60.32
310 57.40
1812 76.52
731 59.43
205 61.56
234 75.48
641 35.37
567 77.56
ART 2213 58.23
1751 77.58
4989 84.37
2426 74.76
405 18.30
578 33.00
665 13.32
857 35.32
AUTO MECH. 139 62.61
124 74.69
958 86.54
212 71.14
36 25.89
93 75.00
236 24.63
119 56.13
BIOLOGY 317,303 88.24
410,831 91.51
677,869 88.07
70012 90.12
36894 11.62
116480 28.35
70543 10.40
142973 20.42
BOOK KEEPING
74,517 87.26
84450 75.07
191552 88.08
213129 90.37
12701 17.04
18520 21.93
74845 39.07
39330 18.45
BUILDING CONST.
470 66.85
419 70.42
1510 76.72
705 68.91
183 38.93
82 19.57
205 13.57
141 30.00
CHEMISTRY 143641 93.46
175988 95.60
265,705 91.53
265755 93.28
31159 21.69
26091 14.82
18,499 6.96
65742 24.73
COMMERCE 173790 90.25
231037 94.55
414535 91.16
435294 92.06
68020 39.13
63929 27.67
94465 22.78
100807 23.15
SHORT HAND
1613 60.66
1442 81.01
3280 79.03
1833 70.06
171 10.60
35 2.42
70 2.13
285 15.54
ISLAMIC STUD.
11010 71.49
17363 75.48
36424 72.00
39067 74.91
5759 52.27
9965 57.39
15,000 41.18
22265 56.99
ECONOMICS 375393 95.14
477425 97.25
804458 94.34
819651 95.15
92714 24.69
83525 17.49
140935 17.51
309598 37.77
GEOGRAPHY 166155 85.38
209321 86.72
311590 81.47
304000 82.14
26753 16.10
25056 11.97
40988 13.15
30467 10.02
HISTORY 13604 60.29
12519 50.52
26900 5638
23942 58.81
4677 34.37
4616 36.87
8231 30.59
6214 25.95
129123 84.05
138516 73.97
283225 82.16
283378 83.24
35836 27.75
42647 30.78
109027 38.49
187568 66.19
LITT. IN ENG. 116741 85.81
153657 90.80
260665 86.19
265683 87.18
18641 15.96
28771 18.72
34001 13.04
18399 6.92
HAUSA LITT. 179 53.59
221 37.77
548 34.10
238 30.55
59 32.96
110 49.77
194 35.40
160 67.22
IGBO LITT. 127 21.97
108 15.31
614 30.59
123 8.09
75 59.05
47 43.51
60 9.77
44 35.34
YORUBA LITT.
101 19.16
147 11.37
532 10.86
365 6.69
57 56.43
59 40.13
121 22.74
129 35.35
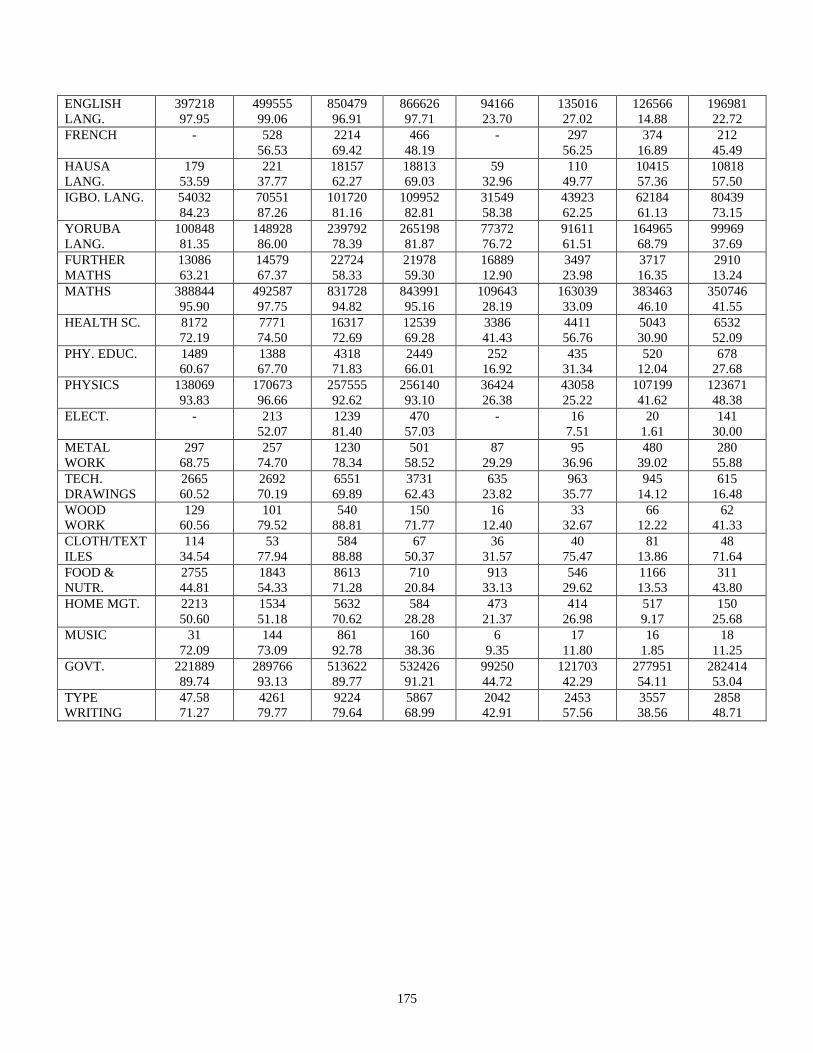
175
ENGLISH LANG.
397218 97.95
499555 99.06
850479 96.91
866626 97.71
94166 23.70
135016 27.02
126566 14.88
196981 22.72
FRENCH - 528 56.53
2214 69.42
466 48.19
- 297 56.25
374 16.89
212 45.49
HAUSA LANG.
179 53.59
221 37.77
18157 62.27
18813 69.03
59 32.96
110 49.77
10415 57.36
10818 57.50
IGBO. LANG. 54032 84.23
70551 87.26
101720 81.16
109952 82.81
31549 58.38
43923 62.25
62184 61.13
80439 73.15
YORUBA LANG.
100848 81.35
148928 86.00
239792 78.39
265198 81.87
77372 76.72
91611 61.51
164965 68.79
99969 37.69
FURTHER MATHS
13086 63.21
14579 67.37
22724 58.33
21978 59.30
16889 12.90
3497 23.98
3717 16.35
2910 13.24
MATHS 388844 95.90
492587 97.75
831728 94.82
843991 95.16
109643 28.19
163039 33.09
383463 46.10
350746 41.55
HEALTH SC. 8172 72.19
7771 74.50
16317 72.69
12539 69.28
3386 41.43
4411 56.76
5043 30.90
6532 52.09
PHY. EDUC. 1489 60.67
1388 67.70
4318 71.83
2449 66.01
252 16.92
435 31.34
520 12.04
678 27.68
PHYSICS 138069 93.83
170673 96.66
257555 92.62
256140 93.10
36424 26.38
43058 25.22
107199 41.62
123671 48.38
ELECT. - 213 52.07
1239 81.40
470 57.03
- 16 7.51
20 1.61
141 30.00
METAL WORK
297 68.75
257 74.70
1230 78.34
501 58.52
87 29.29
95 36.96
480 39.02
280 55.88
TECH. DRAWINGS
2665 60.52
2692 70.19
6551 69.89
3731 62.43
635 23.82
963 35.77
945 14.12
615 16.48
WOOD WORK
129 60.56
101 79.52
540 88.81
150 71.77
16 12.40
33 32.67
66 12.22
62 41.33
CLOTH/TEXTILES
114 34.54
53 77.94
584 88.88
67 50.37
36 31.57
40 75.47
81 13.86
48 71.64
FOOD & NUTR.
2755 44.81
1843 54.33
8613 71.28
710 20.84
913 33.13
546 29.62
1166 13.53
311 43.80
HOME MGT. 2213 50.60
1534 51.18
5632 70.62
584 28.28
473 21.37
414 26.98
517 9.17
150 25.68
MUSIC 31 72.09
144 73.09
861 92.78
160 38.36
6 9.35
17 11.80
16 1.85
18 11.25
GOVT. 221889 89.74
289766 93.13
513622 89.77
532426 91.21
99250 44.72
121703 42.29
277951 54.11
282414 53.04
TYPE WRITING
47.58 71.27
4261 79.77
9224 79.64
5867 68.99
2042 42.91
2453 57.56
3557 38.56
2858 48.71
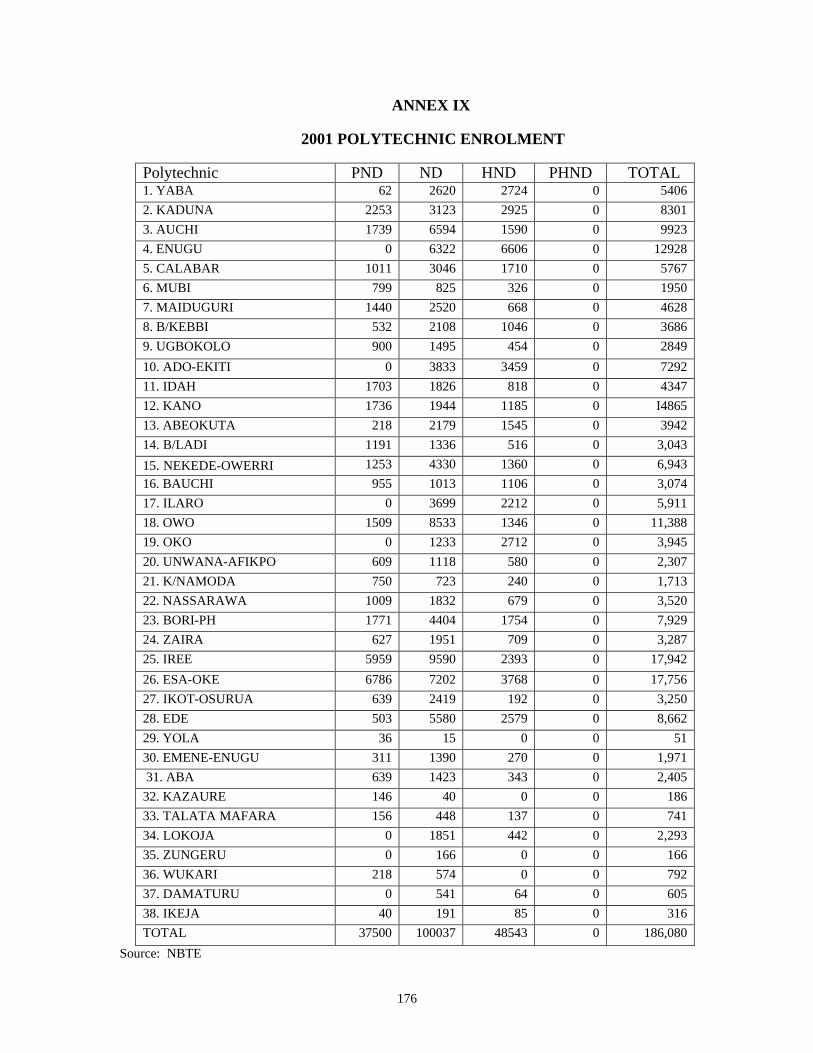
176
ANNEX IX
2001 POLYTECHNIC ENROLMENT
Polytechnic PND ND HND PHND TOTAL 1. YABA 62 2620 2724 0 5406 2. KADUNA 2253 3123 2925 0 8301 3. AUCHI 1739 6594 1590 0 9923 4. ENUGU 0 6322 6606 0 12928 5. CALABAR 1011 3046 1710 0 5767 6. MUBI 799 825 326 0 1950 7. MAIDUGURI 1440 2520 668 0 4628 8. B/KEBBI 532 2108 1046 0 3686 9. UGBOKOLO 900 1495 454 0 2849
10. ADO-EKITI 0 3833 3459 0 7292 11. IDAH 1703 1826 818 0 4347 12. KANO 1736 1944 1185 0 I4865 13. ABEOKUTA 218 2179 1545 0 3942 14. B/LADI 1191 1336 516 0 3,043
15. NEKEDE-OWERRI 1253 4330 1360 0 6,943 16. BAUCHI 955 1013 1106 0 3,074 17. ILARO 0 3699 2212 0 5,911 18. OWO 1509 8533 1346 0 11,388 19. OKO 0 1233 2712 0 3,945 20. UNWANA-AFIKPO 609 1118 580 0 2,307 21. K/NAMODA 750 723 240 0 1,713 22. NASSARAWA 1009 1832 679 0 3,520 23. BORI-PH 1771 4404 1754 0 7,929 24. ZAIRA 627 1951 709 0 3,287 25. IREE 5959 9590 2393 0 17,942
26. ESA-OKE 6786 7202 3768 0 17,756 27. IKOT-OSURUA 639 2419 192 0 3,250 28. EDE 503 5580 2579 0 8,662 29. YOLA 36 15 0 0 51 30. EMENE-ENUGU 311 1390 270 0 1,971 31. ABA 639 1423 343 0 2,405 32. KAZAURE 146 40 0 0 186 33. TALATA MAFARA 156 448 137 0 741 34. LOKOJA 0 1851 442 0 2,293 35. ZUNGERU 0 166 0 0 166 36. WUKARI 218 574 0 0 792 37. DAMATURU 0 541 64 0 605 38. IKEJA 40 191 85 0 316 TOTAL 37500 100037 48543 0 186,080
Source: NBTE
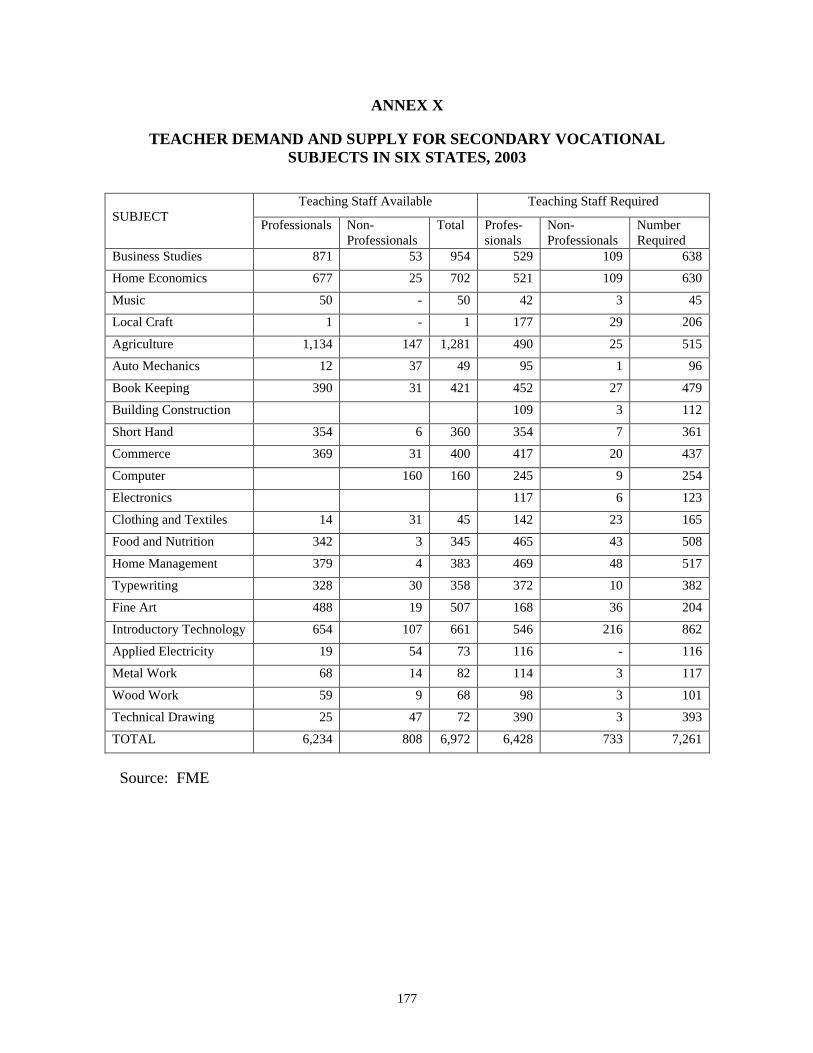
177
ANNEX X
TEACHER DEMAND AND SUPPLY FOR SECONDARY VOCATIONAL SUBJECTS IN SIX STATES, 2003
Source: FME
Teaching Staff Available Teaching Staff Required SUBJECT
Professionals Non- Professionals
Total Profes- sionals
Non- Professionals
Number Required
Business Studies 871 53 954 529 109 638
Home Economics 677 25 702 521 109 630
Music 50 - 50 42 3 45
Local Craft 1 - 1 177 29 206
Agriculture 1,134 147 1,281 490 25 515
Auto Mechanics 12 37 49 95 1 96
Book Keeping 390 31 421 452 27 479
Building Construction 109 3 112
Short Hand 354 6 360 354 7 361
Commerce 369 31 400 417 20 437
Computer 160 160 245 9 254
Electronics 117 6 123
Clothing and Textiles 14 31 45 142 23 165
Food and Nutrition 342 3 345 465 43 508
Home Management 379 4 383 469 48 517
Typewriting 328 30 358 372 10 382
Fine Art 488 19 507 168 36 204
Introductory Technology 654 107 661 546 216 862
Applied Electricity 19 54 73 116 - 116
Metal Work 68 14 82 114 3 117
Wood Work 59 9 68 98 3 101
Technical Drawing 25 47 72 390 3 393
TOTAL 6,234 808 6,972 6,428 733 7,261
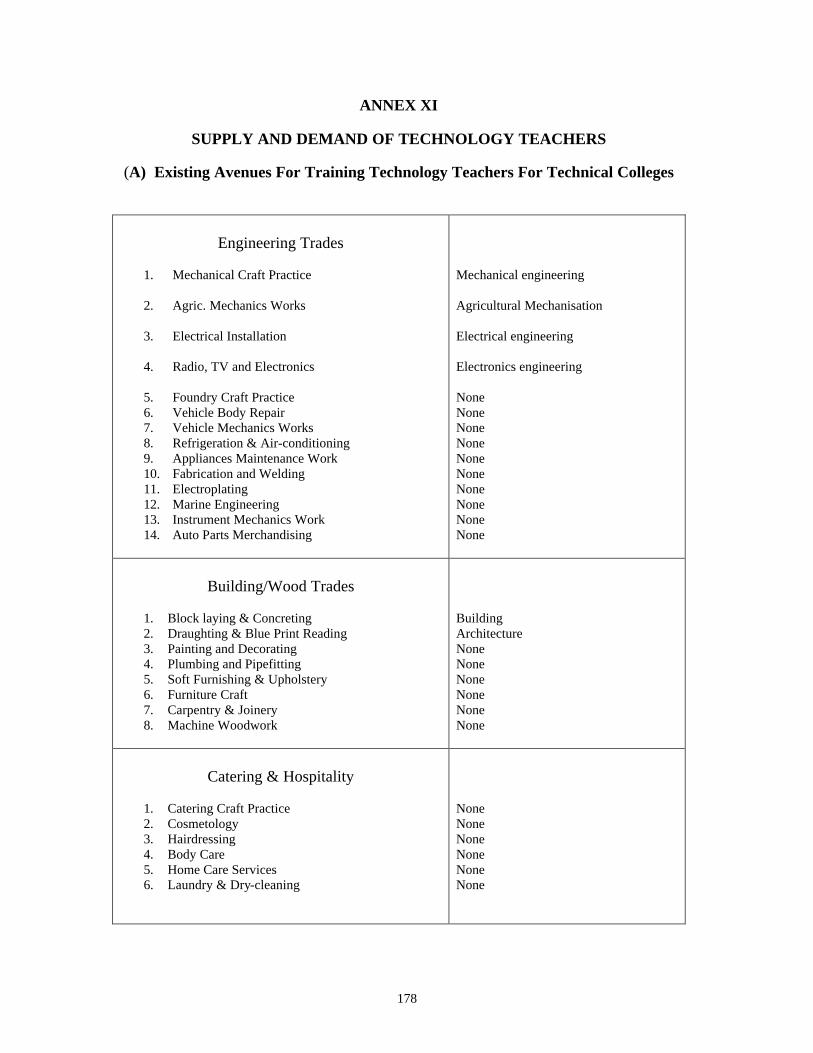
178
ANNEX XI
SUPPLY AND DEMAND OF TECHNOLOGY TEACHERS (A) Existing Avenues For Training Technology Teachers For Technical Colleges
Engineering Trades
1. Mechanical Craft Practice 2. Agric. Mechanics Works
3. Electrical Installation
4. Radio, TV and Electronics
5. Foundry Craft Practice 6. Vehicle Body Repair 7. Vehicle Mechanics Works 8. Refrigeration & Air-conditioning 9. Appliances Maintenance Work 10. Fabrication and Welding 11. Electroplating 12. Marine Engineering 13. Instrument Mechanics Work 14. Auto Parts Merchandising
Mechanical engineering Agricultural Mechanisation Electrical engineering Electronics engineering None None None None None None None None None None
Building/Wood Trades
1. Block laying & Concreting 2. Draughting & Blue Print Reading 3. Painting and Decorating 4. Plumbing and Pipefitting 5. Soft Furnishing & Upholstery 6. Furniture Craft 7. Carpentry & Joinery 8. Machine Woodwork
Building Architecture None None None None None None
Catering & Hospitality
1. Catering Craft Practice 2. Cosmetology 3. Hairdressing 4. Body Care 5. Home Care Services 6. Laundry & Dry-cleaning
None None None None None None
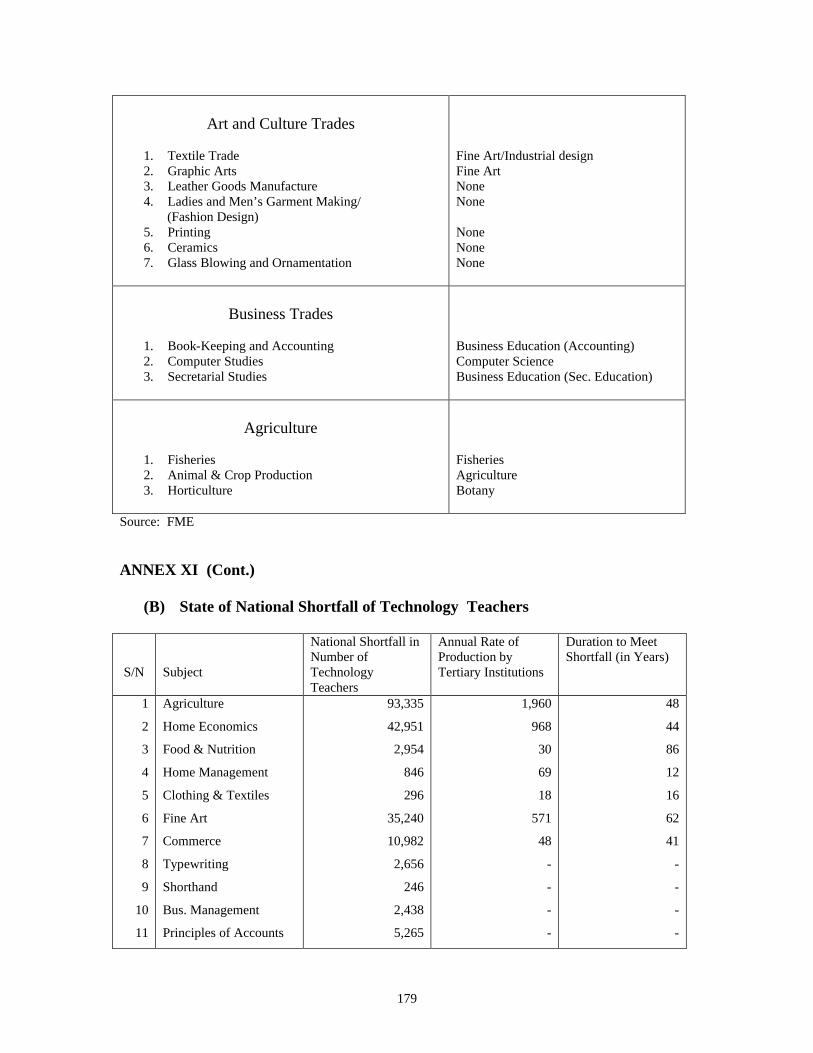
179
Art and Culture Trades
1. Textile Trade 2. Graphic Arts 3. Leather Goods Manufacture 4. Ladies and Men’s Garment Making/ (Fashion Design) 5. Printing 6. Ceramics 7. Glass Blowing and Ornamentation
Fine Art/Industrial design Fine Art None None None None None
Business Trades
1. Book-Keeping and Accounting 2. Computer Studies 3. Secretarial Studies
Business Education (Accounting) Computer Science Business Education (Sec. Education)
Agriculture
1. Fisheries 2. Animal & Crop Production 3. Horticulture
Fisheries Agriculture Botany
Source: FME ANNEX XI (Cont.)
(B) State of National Shortfall of Technology Teachers
S/N
Subject
National Shortfall in Number of Technology Teachers
Annual Rate of Production by Tertiary Institutions
Duration to Meet Shortfall (in Years)
1
2
3
4
5
6
7
8
9
10
11
Agriculture
Home Economics
Food & Nutrition
Home Management
Clothing & Textiles
Fine Art
Commerce
Typewriting
Shorthand
Bus. Management
Principles of Accounts
93,335
42,951
2,954
846
296
35,240
10,982
2,656
246
2,438
5,265
1,960
968
30
69
18
571
48
-
-
-
-
48
44
86
12
16
62
41
-
-
-
-
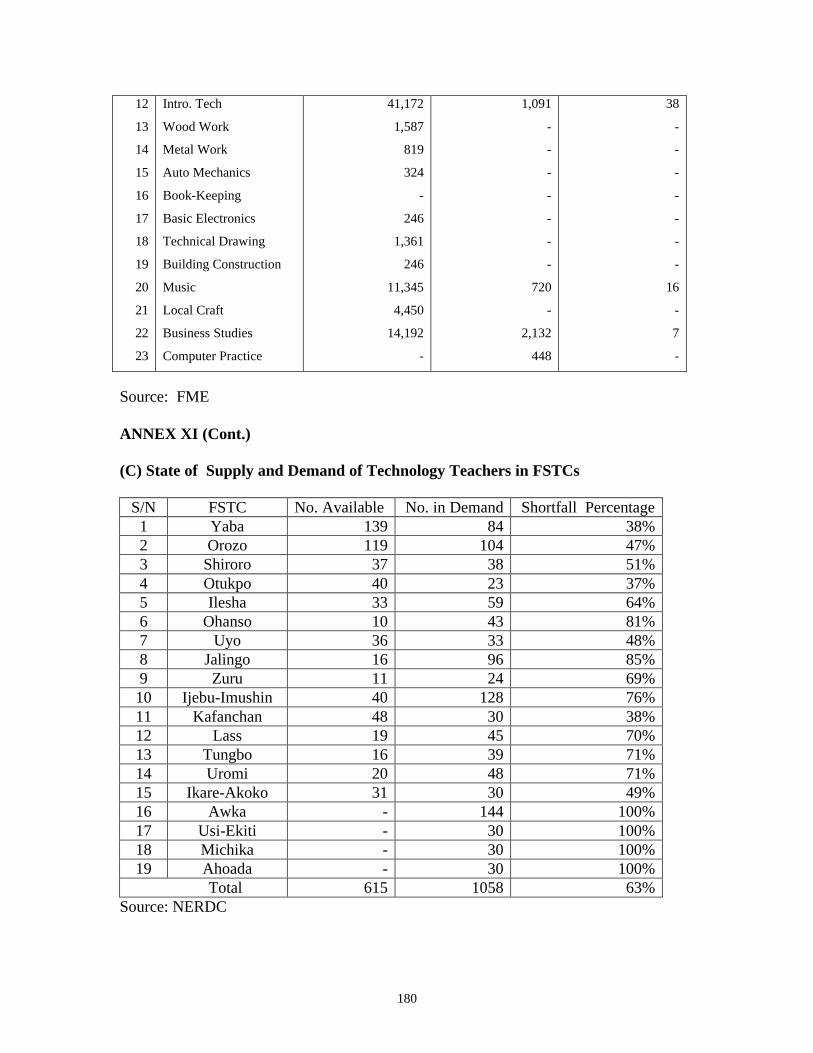
180
12
13
14
15
16
17
18
19
20
21
22
23
Intro. Tech
Wood Work
Metal Work
Auto Mechanics
Book-Keeping
Basic Electronics
Technical Drawing
Building Construction
Music
Local Craft
Business Studies
Computer Practice
41,172
1,587
819
324
-
246
1,361
246
11,345
4,450
14,192
-
1,091
-
-
-
-
-
-
-
720
-
2,132
448
38
-
-
-
-
-
-
-
16
-
7
-
Source: FME ANNEX XI (Cont.) (C) State of Supply and Demand of Technology Teachers in FSTCs
S/N FSTC No. Available No. in Demand Shortfall Percentage 1 Yaba 139 84 38% 2 Orozo 119 104 47% 3 Shiroro 37 38 51% 4 Otukpo 40 23 37% 5 Ilesha 33 59 64% 6 Ohanso 10 43 81% 7 Uyo 36 33 48% 8 Jalingo 16 96 85% 9 Zuru 11 24 69% 10 Ijebu-Imushin 40 128 76% 11 Kafanchan 48 30 38% 12 Lass 19 45 70% 13 Tungbo 16 39 71% 14 Uromi 20 48 71% 15 Ikare-Akoko 31 30 49% 16 Awka - 144 100% 17 Usi-Ekiti - 30 100% 18 Michika - 30 100% 19 Ahoada - 30 100%
Total 615 1058 63% Source: NERDC
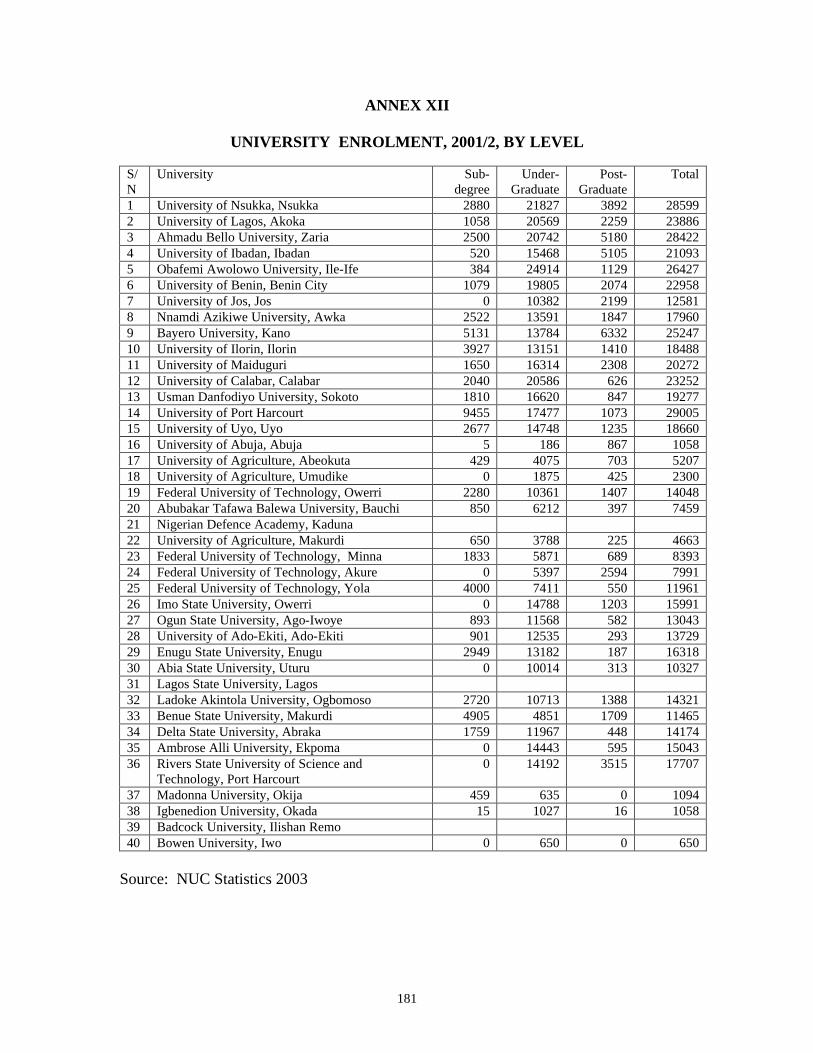
181
ANNEX XII
UNIVERSITY ENROLMENT, 2001/2, BY LEVEL
S/N
University Sub- degree
Under- Graduate
Post- Graduate
Total
1 University of Nsukka, Nsukka 2880 21827 3892 28599 2 University of Lagos, Akoka 1058 20569 2259 23886 3 Ahmadu Bello University, Zaria 2500 20742 5180 28422 4 University of Ibadan, Ibadan 520 15468 5105 21093 5 Obafemi Awolowo University, Ile-Ife 384 24914 1129 26427 6 University of Benin, Benin City 1079 19805 2074 22958 7 University of Jos, Jos 0 10382 2199 12581 8 Nnamdi Azikiwe University, Awka 2522 13591 1847 17960 9 Bayero University, Kano 5131 13784 6332 25247 10 University of Ilorin, Ilorin 3927 13151 1410 18488 11 University of Maiduguri 1650 16314 2308 20272 12 University of Calabar, Calabar 2040 20586 626 23252 13 Usman Danfodiyo University, Sokoto 1810 16620 847 19277 14 University of Port Harcourt 9455 17477 1073 29005 15 University of Uyo, Uyo 2677 14748 1235 18660 16 University of Abuja, Abuja 5 186 867 1058 17 University of Agriculture, Abeokuta 429 4075 703 5207 18 University of Agriculture, Umudike 0 1875 425 2300 19 Federal University of Technology, Owerri 2280 10361 1407 14048 20 Abubakar Tafawa Balewa University, Bauchi 850 6212 397 7459 21 Nigerian Defence Academy, Kaduna 22 University of Agriculture, Makurdi 650 3788 225 4663 23 Federal University of Technology, Minna 1833 5871 689 8393 24 Federal University of Technology, Akure 0 5397 2594 7991 25 Federal University of Technology, Yola 4000 7411 550 11961 26 Imo State University, Owerri 0 14788 1203 15991 27 Ogun State University, Ago-Iwoye 893 11568 582 13043 28 University of Ado-Ekiti, Ado-Ekiti 901 12535 293 13729 29 Enugu State University, Enugu 2949 13182 187 16318 30 Abia State University, Uturu 0 10014 313 10327 31 Lagos State University, Lagos 32 Ladoke Akintola University, Ogbomoso 2720 10713 1388 14321 33 Benue State University, Makurdi 4905 4851 1709 11465 34 Delta State University, Abraka 1759 11967 448 14174 35 Ambrose Alli University, Ekpoma 0 14443 595 15043 36 Rivers State University of Science and
Technology, Port Harcourt 0 14192 3515 17707
37 Madonna University, Okija 459 635 0 1094 38 Igbenedion University, Okada 15 1027 16 1058 39 Badcock University, Ilishan Remo 40 Bowen University, Iwo 0 650 0 650
Source: NUC Statistics 2003
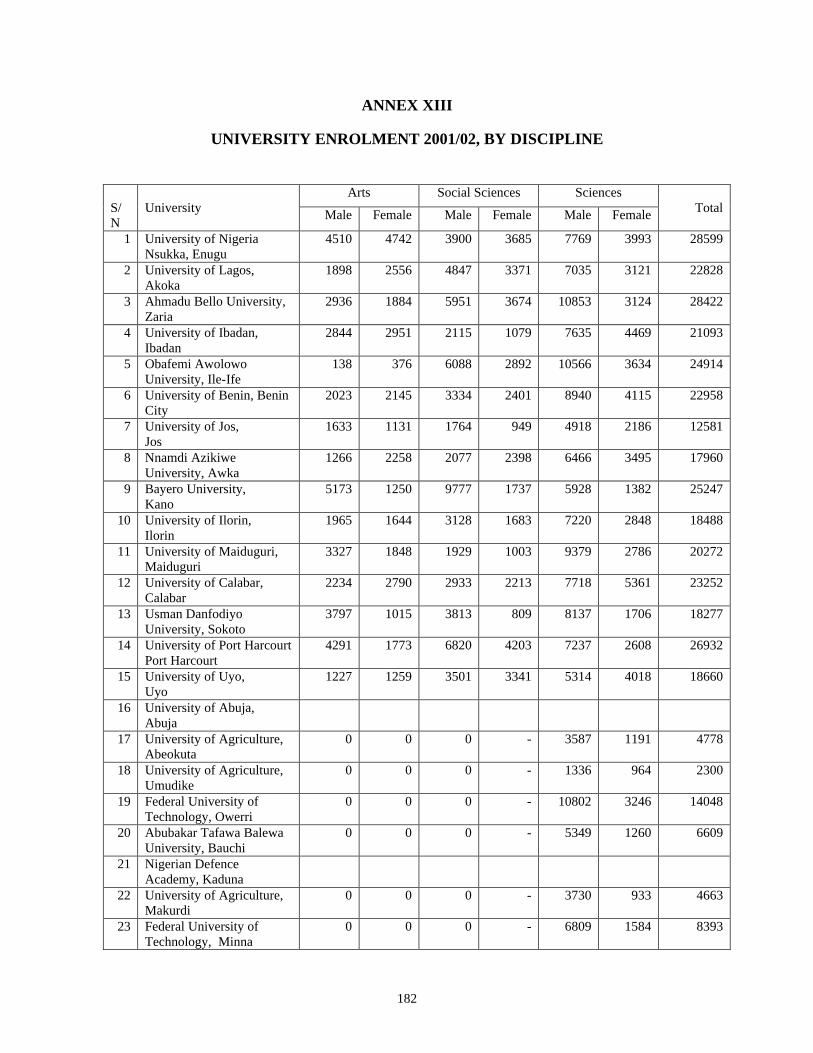
182
ANNEX XIII
UNIVERSITY ENROLMENT 2001/02, BY DISCIPLINE
Arts Social Sciences Sciences S/N
University Male Female Male Female Male Female
Total
1 University of Nigeria Nsukka, Enugu
4510 4742 3900 3685 7769 3993 28599
2 University of Lagos, Akoka
1898 2556 4847 3371 7035 3121 22828
3 Ahmadu Bello University, Zaria
2936 1884 5951 3674 10853 3124 28422
4 University of Ibadan, Ibadan
2844 2951 2115 1079 7635 4469 21093
5 Obafemi Awolowo University, Ile-Ife
138 376 6088 2892 10566 3634 24914
6 University of Benin, Benin City
2023 2145 3334 2401 8940 4115 22958
7 University of Jos, Jos
1633 1131 1764 949 4918 2186 12581
8 Nnamdi Azikiwe University, Awka
1266 2258 2077 2398 6466 3495 17960
9 Bayero University, Kano
5173 1250 9777 1737 5928 1382 25247
10 University of Ilorin, Ilorin
1965 1644 3128 1683 7220 2848 18488
11 University of Maiduguri, Maiduguri
3327 1848 1929 1003 9379 2786 20272
12 University of Calabar, Calabar
2234 2790 2933 2213 7718 5361 23252
13 Usman Danfodiyo University, Sokoto
3797 1015 3813 809 8137 1706 18277
14 University of Port Harcourt Port Harcourt
4291 1773 6820 4203 7237 2608 26932
15 University of Uyo, Uyo
1227 1259 3501 3341 5314 4018 18660
16 University of Abuja, Abuja
17 University of Agriculture, Abeokuta
0 0 0 - 3587 1191 4778
18 University of Agriculture, Umudike
0 0 0 - 1336 964 2300
19 Federal University of Technology, Owerri
0 0 0 - 10802 3246 14048
20 Abubakar Tafawa Balewa University, Bauchi
0 0 0 - 5349 1260 6609
21 Nigerian Defence Academy, Kaduna
22 University of Agriculture, Makurdi
0 0 0 - 3730 933 4663
23 Federal University of Technology, Minna
0 0 0 - 6809 1584 8393
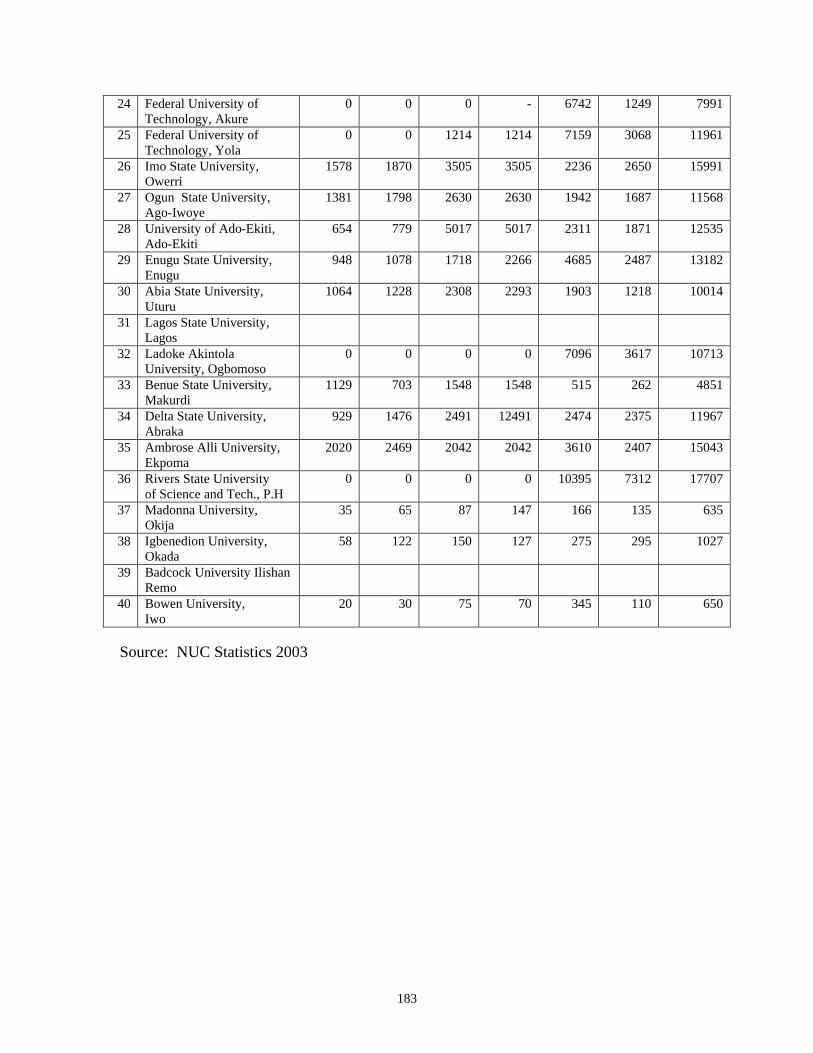
183
24 Federal University of Technology, Akure
0 0 0 - 6742 1249 7991
25 Federal University of Technology, Yola
0 0 1214 1214 7159 3068 11961
26 Imo State University, Owerri
1578 1870 3505 3505 2236 2650 15991
27 Ogun State University, Ago-Iwoye
1381 1798 2630 2630 1942 1687 11568
28 University of Ado-Ekiti, Ado-Ekiti
654 779 5017 5017 2311 1871 12535
29 Enugu State University, Enugu
948 1078 1718 2266 4685 2487 13182
30 Abia State University, Uturu
1064 1228 2308 2293 1903 1218 10014
31 Lagos State University, Lagos
32 Ladoke Akintola University, Ogbomoso
0 0 0 0 7096 3617 10713
33 Benue State University, Makurdi
1129 703 1548 1548 515 262 4851
34 Delta State University, Abraka
929 1476 2491 12491 2474 2375 11967
35 Ambrose Alli University, Ekpoma
2020 2469 2042 2042 3610 2407 15043
36 Rivers State University of Science and Tech., P.H
0 0 0 0 10395 7312 17707
37 Madonna University, Okija
35 65 87 147 166 135 635
38 Igbenedion University, Okada
58 122 150 127 275 295 1027
39 Badcock University Ilishan Remo
40 Bowen University, Iwo
20 30 75 70 345 110 650
Source: NUC Statistics 2003
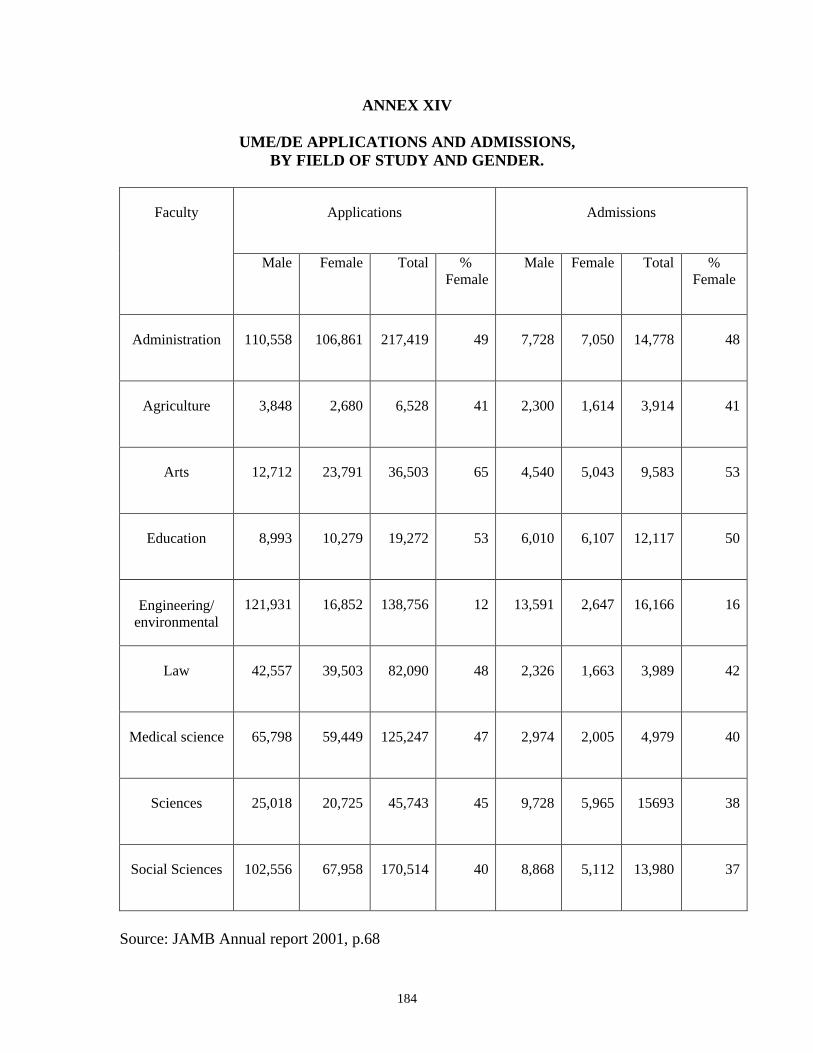
184
ANNEX XIV
UME/DE APPLICATIONS AND ADMISSIONS, BY FIELD OF STUDY AND GENDER.
Applications Admissions
Faculty
Male Female Total % Female
Male Female Total % Female
Administration 110,558 106,861 217,419 49 7,728 7,050 14,778 48
Agriculture 3,848 2,680 6,528 41 2,300 1,614 3,914 41
Arts 12,712 23,791 36,503 65 4,540 5,043 9,583 53
Education 8,993 10,279 19,272 53 6,010 6,107 12,117 50
Engineering/ environmental
121,931 16,852 138,756 12 13,591 2,647 16,166 16
Law 42,557 39,503 82,090 48 2,326 1,663 3,989 42
Medical science 65,798 59,449 125,247 47 2,974 2,005 4,979 40
Sciences 25,018 20,725 45,743 45 9,728 5,965 15693 38
Social Sciences 102,556 67,958 170,514 40 8,868 5,112 13,980 37
Source: JAMB Annual report 2001, p.68
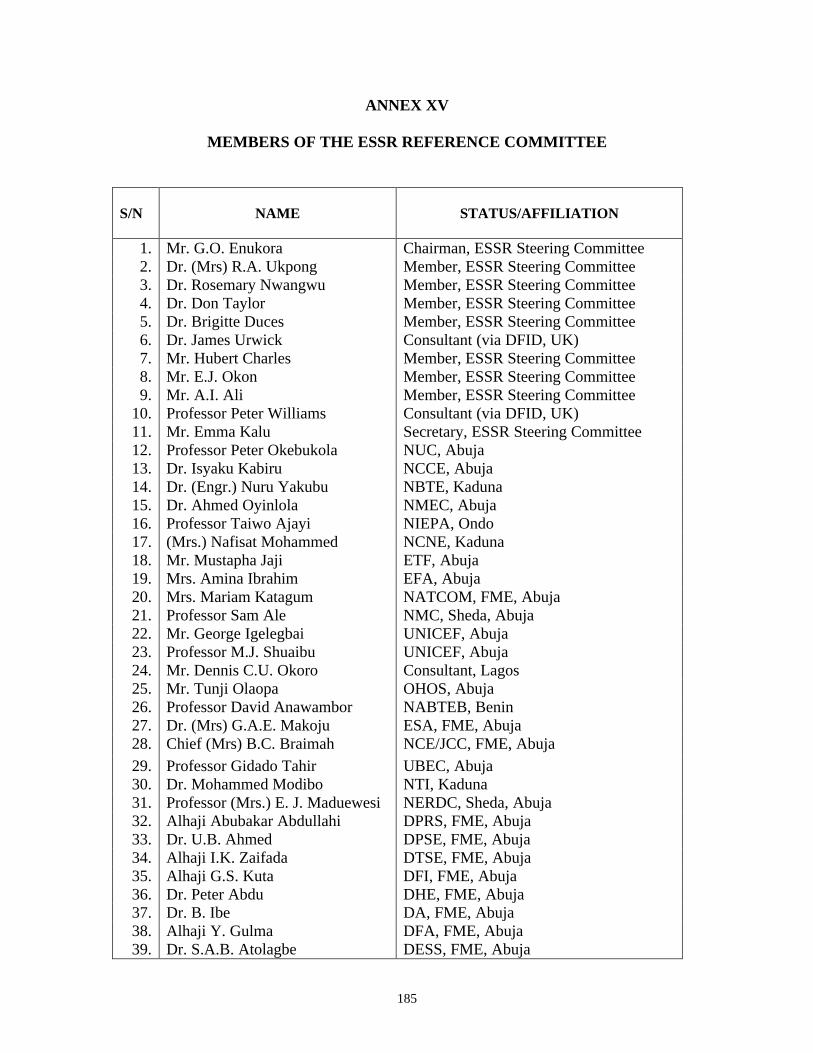
185
ANNEX XV
MEMBERS OF THE ESSR REFERENCE COMMITTEE
S/N NAME
STATUS/AFFILIATION
1. Mr. G.O. Enukora Chairman, ESSR Steering Committee 2. Dr. (Mrs) R.A. Ukpong Member, ESSR Steering Committee 3. Dr. Rosemary Nwangwu Member, ESSR Steering Committee 4. Dr. Don Taylor Member, ESSR Steering Committee 5. Dr. Brigitte Duces Member, ESSR Steering Committee 6. Dr. James Urwick Consultant (via DFID, UK) 7. Mr. Hubert Charles Member, ESSR Steering Committee 8. Mr. E.J. Okon Member, ESSR Steering Committee 9. Mr. A.I. Ali Member, ESSR Steering Committee
10. Professor Peter Williams Consultant (via DFID, UK) 11. Mr. Emma Kalu Secretary, ESSR Steering Committee 12. Professor Peter Okebukola NUC, Abuja 13. Dr. Isyaku Kabiru NCCE, Abuja 14. Dr. (Engr.) Nuru Yakubu NBTE, Kaduna 15. Dr. Ahmed Oyinlola NMEC, Abuja 16. Professor Taiwo Ajayi NIEPA, Ondo 17. (Mrs.) Nafisat Mohammed NCNE, Kaduna 18. Mr. Mustapha Jaji ETF, Abuja 19. Mrs. Amina Ibrahim EFA, Abuja 20. Mrs. Mariam Katagum NATCOM, FME, Abuja 21. Professor Sam Ale NMC, Sheda, Abuja 22. Mr. George Igelegbai UNICEF, Abuja 23. Professor M.J. Shuaibu UNICEF, Abuja 24. Mr. Dennis C.U. Okoro Consultant, Lagos 25. Mr. Tunji Olaopa OHOS, Abuja 26. Professor David Anawambor NABTEB, Benin 27. Dr. (Mrs) G.A.E. Makoju ESA, FME, Abuja 28. Chief (Mrs) B.C. Braimah NCE/JCC, FME, Abuja 29. Professor Gidado Tahir UBEC, Abuja 30. Dr. Mohammed Modibo NTI, Kaduna 31. Professor (Mrs.) E. J. Maduewesi NERDC, Sheda, Abuja 32. Alhaji Abubakar Abdullahi DPRS, FME, Abuja 33. Dr. U.B. Ahmed DPSE, FME, Abuja 34. Alhaji I.K. Zaifada DTSE, FME, Abuja 35. Alhaji G.S. Kuta DFI, FME, Abuja 36. Dr. Peter Abdu DHE, FME, Abuja 37. Dr. B. Ibe DA, FME, Abuja 38. Alhaji Y. Gulma DFA, FME, Abuja 39. Dr. S.A.B. Atolagbe DESS, FME, Abuja
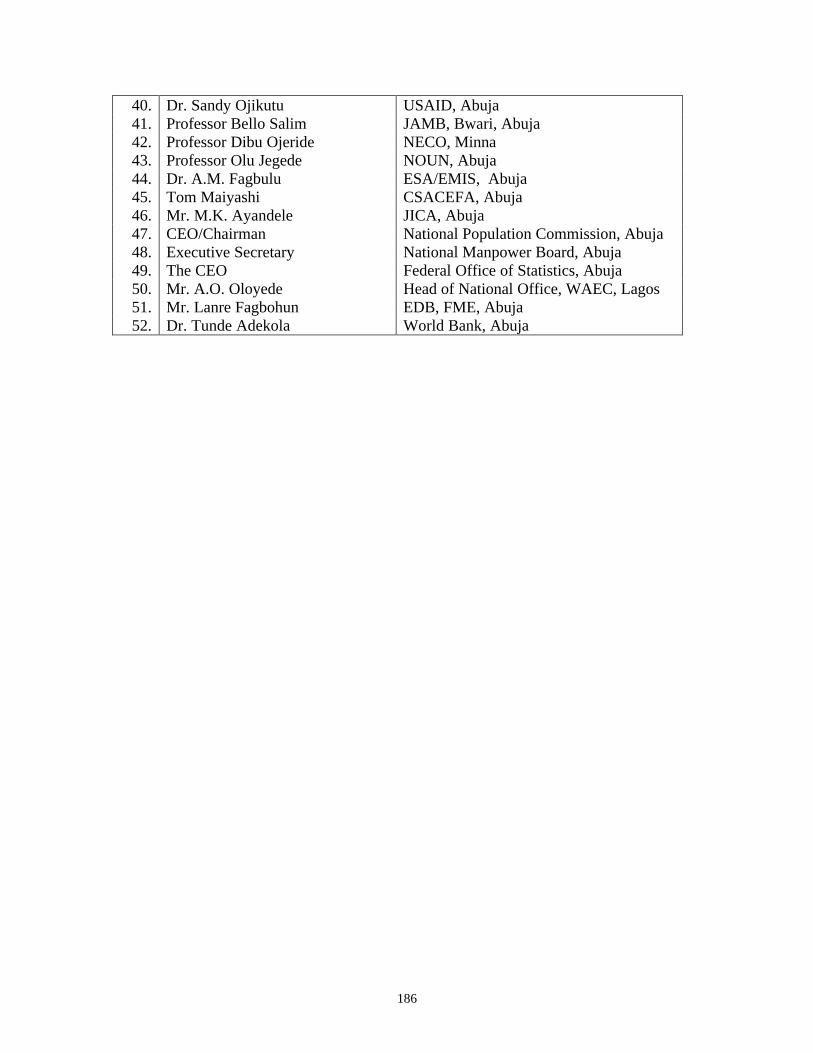
186
40. Dr. Sandy Ojikutu USAID, Abuja 41. Professor Bello Salim JAMB, Bwari, Abuja 42. Professor Dibu Ojeride NECO, Minna 43. Professor Olu Jegede NOUN, Abuja 44. Dr. A.M. Fagbulu ESA/EMIS, Abuja 45. Tom Maiyashi CSACEFA, Abuja 46. Mr. M.K. Ayandele JICA, Abuja 47. CEO/Chairman National Population Commission, Abuja 48. Executive Secretary National Manpower Board, Abuja 49. The CEO Federal Office of Statistics, Abuja 50. Mr. A.O. Oloyede Head of National Office, WAEC, Lagos 51. Mr. Lanre Fagbohun EDB, FME, Abuja 52. Dr. Tunde Adekola World Bank, Abuja
187
REFERENCES
Aarons, A. (2003). Nigeria – Universal Basic Education: Issues of teaching and learning (incomplete draft). Unpublished report, World Bank, Abuja.
Ade-Ajayi, J. (2003, March). Position paper from Professor J.F. Ade-Ajayi. Paper
presented at the University Stakeholders’ National Consultative Forum, Abuja. Adedeji, S. (2002, September). Cost and financing of education in Nigeria: The
historical perspective. Paper presented at the Forum on Cost and Finance of Education in Nigeria, Abuja.
Adereti, F., & Adeleye, E. (1998). Job satisfaction level among Agricultural Science
teachers in Ondo. Unpublished research report. Adesola, A. (2002). The state of education in Nigeria. In H. Charles & E.Iheme
(Eds.), Nigerian private sector and Education for All – A report on the private sector round table. Abuja: UNESCO.
Afigbo, A., & Uyo, O. (2000). The evolution of Nigeria, 1849-1960. In H. Ajaegbu,
B. St. Matthew-Daniel & O. Uyo (Eds.), Nigeria: A people united, a future assured, Vol. 1 (pp. 35-38). Abuja: Federal Ministry of Information. Akinyemi, A. (2003). An Overview of the Reflect Methodology, Nigerian Experience. Unpublished paper, ActionAid, Abuja.
Akpan, B. (1999). Perspectives on education and science teaching: From the eyes of
Uduogie Ivowi. Abuja: NERDC. Asangwe, C. (2000). Land, climate and vegetation. In H. Ajaegbu, B. St. Matthew-
Daniel & O. Uyo (Eds.), Nigeria: A people united, a future assured (pp. 3-20). Abuja: Federal Ministry of Information.
Ashby, E. (Ed.). (1960). Investment in education: The report of the Commission on
Post School Certificate and Higher Education in Nigeria. Lagos: FME. Babalola, J. (1992). Educational cost and financing analysis. Unpublished report,
University of Ibadan, External Studies Programme. Balami, D. (2002, September). Finance of education in Nigeria. Paper presented at
the Forum on Cost and Finance of Education in Nigeria, Abuja. Borishade, A. (2001, August 23). Education For All (EFA) in Nigeria. Address of
the Honourable Minister of Education of Nigeria, Professor A. B. Borishade, to the E-9 Ministerial Review Meeting, China.
188
British Council. (2002). Nigeria Community Education Project. Abuja: British Council/DFID. Brooks, H. (1981). Technology: evolution and purpose. In T. Kuehn and A. Porter (Eds.), Science, technology and national policy. Cornell University Press. Bruns, B., Mingat, A., & Rakotomalala, R. Achieving Universal Primary Education by 2015. Washington, World Bank. Brubacher, J. (1982). On the philosophy of higher education. London: Jossey-Bass. Castro, C. (1995). Training policies for the end of the century. Paris: UNESCO. CBN. (1999). Survey of Local Government Councils. Abuja: Author.
Dabalen, A., & Oni, B., with Adekola, O. (2000). Labour market prospects for university graduates in Nigeria. Unpublished report, World Bank, Abuja.
DFID. (2002). Assessment of nomadic education in Nigeria. Paper presented at the Nomadic Education Research Findings Workshop, DFID, Abuja.
Ekpo, A., & Umo, O. (2000). An overview of economic growth and development. In H. Ajaegbu, B. St. Matthew-Daniel & O. Uyop (Eds.), Nigeria: A people united, a future assured (pp. 125-131). Abuja: Federal Ministry of Information.
Fafunwa, A. (1974). History of education in Nigeria. Ibadan: NPS Educational Publishers. Fagbulu, M. (2002). Overview of existing management information systems in the Nigerian education sector. FME: Abuja. Falayalo, W., et al. (1997). Assessment of learning achievement of Primary Four pupils in Nigeria: National report. Abuja: FME/UNICEF/UNESCO. Faluyi, A. (1993, March). The engineering family: Relative roles and responsibilities. Proceedings of the First National Engineering Assembly, COREN, Lagos. (p. 22).
Faure, E., Herrara, F., Kaddaura, A., Lopes, H., Petrovsky, A., Rahnema, M., and Ward, F. (1972). Learning to be: The world of education today and tomorrow. Paris: UNESCO. Federal Ministry of Finance/World Bank. (2000). National capacity assessment report of the Federal Republic of Nigeria. Abuja: Federal Ministry of Finance.
FGN. (1975). Third National Development Plan. Lagos: Government Printer.
189
FGN/UNICEF. (1993). Situation and policy analysis of basic education in Nigeria. Lagos: Gabumo Press. FME. (1990). Government’s efforts at funding federal universities. Lagos: Author. FME. (2000). Comprehensive Education Analysis Project (Secondary Data Report). Abuja: FGN/UNICEF/UNESCO/UNDP. FME. (2000c). Honourable Minister of Education gives account of stewardship. FME Newsletter 2000, p. 2.
FME. (2001). The national master-plan for technical and vocational education (TVE) development in Nigeria in the 21st century, with blueprint for decade 2001-2010. Abuja: Author. FME. (2002a). Historical background on the development of education in Nigeria. Abuja: UNESCO/Japan Trust Fund. FME. (2002b). Repositioning the education sector. FME Newsletter, pp. 1-9.
FME. (2002c). Universal basic education. Education Today 2002. FME. (2003). Summary of a two-day annual national conference of Federal, Zonal and Coordinating Inspectors of Education. Abuja: Author.
FOS/UNICEF. (1999). Multiple indicator cluster survey (1999): Nigeria. Abuja: Authors.
Francis, P., et al. (1998). Hard lessons: Primary schools, community and social capital in Nigeria. Washington, D.C.: World Bank.
FRN. (1998). National policy on education (3rd ed.). Lagos: NERDC Press.
FRN. (1999). Constitution of the Federal Republic of Nigeria (Promulgation Decree No. 24). Lagos: Government Printer. FRN. (2001). Education For All (EFA) in Nigeria: Current status and national plan of action. Unpublished draft, FME, Abuja. FRN. (2003). Focus on education. Unpublished memorandum. Hartnett, T. (2000). Financing trends and expenditure patterns in Nigerian federal universities. Unpublished report, World Bank, Abuja. Hans, N. (1967). Comparative education: A study of educational factors and traditions. London: Routledge and Kegan Paul.
190
Hassan, Y. (2001). Work conditions and employee satisfaction in Jos North Local Government Council. Unpublished M.Ed. project report. Henderson, A., & Henderson, J. (1974). Higher education in America. London: Jossey-Bass. Hinchliffe, K. (1989). Federation and educational finance: Primary schooling in Nigeria. International Journal of Educational Development, 9, 233-242. Hinchliffe, K. (2002). Public expenditure on education in Nigeria: Issues, estimates and some implications. Abuja: World Bank. Igah, E.O. (Ed.). (2003). Atlas of Nigeria. Paris: Editions J.A. Kankwenda. M. (2002, December 17). Development policies and practices in Africa. The Nigerian Tribune, pp. 40, 26-27. Lassa, P. (1998). Teacher production: Focus on Nigeria. In R. Akpofure (Ed.), The state of education in Nigeria (pp. 70-83). Abuja: UNESCO. Longe, G. (Ed.). (1991). Higher education in the 90’s and beyond: Report of the Commission on the Review of Higher Education in Nigeria. Lagos: FME.
Makoju, G. (1998). Nigerian community education project: Baseline studies main report. Unpublished report, FME, Abuja. Mbanefo, N. (1997). Evaluation of constraints on the implementation of the terminal objective of the junior secondary school: A case study of Oyo State. Ibadan: NISER. Mingat, A., & Tan, J. (1988). Analytical tools for sector work in education. Baltimore: Johns Hopkins University Press. Mkpa, M. (2000). Overview of educational development: Pre-colonial to present day. In H. Ajaegbu, B. St. Matthew-Daniel, & O. Uyo (Eds.), Nigeria: A people united, a future assured (pp. 239-242). Abuja: Federal Ministry of Information. NAPEP. (2001). A blueprint for the schemes. Abuja.
National Population Commission. (1998). 1991 Population Census of the Federal Republic of Nigeria: Analytical Report at the National Level.. Abuja: Author.
National Population Commission. (2000). Nigeria demographic and health survey 1999. Abuja: Author.
NCCE. (1992). Feasibility of the NCE becoming the minimum qualification for teachers. Unpublished research report, NCCE, Abuja.
191
NCCE. (1997). In-service teachers’ perceptions of the difficulties encountered in studying under the NCE sandwich programme. Unpublished research report, NCCE, Abuja. NCCE. (2000). Dearth of applicants in Colleges of Education: Causes and effects. Unpublished research report, NCCE, Abuja. NCCE. (2002a). Highlights of NCE accreditation reports (2000-2001). Unpublished report, NCCE, Abuja. NCCE. (2002b). A summary of minimum standards for NCE teachers. Abuja: Author. NCCE. (2003). Statistical Digest on Colleges of Education, Vol. 6. Abuja: Author. NCNE. (2002). Reaching the unreached (information brochure). Abuja: Author. NDE. (2000). Annual Report, 2000. Abuja: Author.
NMEC. (2001). Statistics Digest. Abuja: Author. NPC/UNICEF. (2001). Children’s and women’s rights in Nigeria: A wake-up call (Situation and Assessment Analysis 2001). Lagos: Authors. NPEC. (1999). Nigeria: primary education in the 21st century. Kaduna: Author. NUC. (2002). Approved guidelines for course system and grade point average in all Nigerian universities. Abuja: Author. Nwagwu, N. (1998a). Historical sketches in the development of educational management in Nigeria. In A. Olagboye & J. Fadipe (Eds.), Management of Nigerian education: Law, structures and responsibilities. Ondo: NIEPA. Nwagwu, N. (1998b). Management, structure and financing of education. In R. Akpofure (Ed.), The state of education in Nigeria (pp. 10-21). Abuja: UNESCO.
Nwana, O. (1998). Aberrations in the Nigerian educational system. In R. Akpofure (Ed.), The state of education in Nigeria (pp. 152-160). Abuja: UNESCO.
Nwangwu, R. (1999). Teacher burnout: Implications and strategies for the 21st century. In U. Nwezi (Ed.), The teacher: A book of readings (pp. 406-411). Ibadan: Africana FEP Publishers. Nwangwu, R. (2000). Boys’ dropout. In FME, Universal Basic Education for Nigeria – Proceedings of the Education Summit (pp 90-93). Abuja: FME.
192
Nwangwu, R. (2001, May). Viable strategies for increasing the development of girl education: Increasing the population of female teachers option. Paper presented at a UNICEF Workshop on Promoting Increasing Employment of Female Teachers, Yola. Nwana, O. (1998). Aberrations in the Nigerian education system. In R. Akpofure (Ed.), The state of education in Nigeria (pp. 152-160). Abuja: UNESCO. Obasanjo, O. (2000). Presidential address on the occasion of the relaunching of the Universal Basic Education (UBE) Programme. Education Today, 8, 2-3. Ogbue, R. (1981). Experiments in integration: The Nigerian experience. In Educafrica Special. Paris: UNESCO. Ohiri-Aniche, C. (2000). Gender issues in education. In R. Akpofure (Ed.), The state of education in Nigeria (pp. 52-60). Abuja: UNESCO. Okebukola, P. (1998a). Options for funding of education in Lagos State (Technical Report 12). Lagos: Lagos State Government. Okebukola, P. (1998b). Trends in tertiary education in Nigeria. In R. Akpofure (Ed.), The state of education in Nigeria (pp. 84-102). Abuja: UNESCO. Okebukola, P. (2002, September). Issues in the funding of university education in Nigeria. Paper presented at the Forum on Cost and Finance of Education in Nigeria, Abuja. Okoro, D. (1998). Basic education: Emerging issues, challenges and constraints. In R. Akpofure (Ed.), The state of education in Nigeria (pp. 34-51). Abuja: UNESCO. Olagboye, A., & Fadipe, J. (Eds.). (1998). Management of Nigerian education: Law, structures and responsibilities. Ondo: NIEPA. Orbach, E. (2003). The capacity of the Nigerian government to deliver basic education services. Unpublished report, World Bank, Abuja. Oruma, A. (2000). Job satisfaction among education and non-education workers: A case study of Federal Capital Territory. Unpublished NCE project report. Ottong, J. (2000). The population of Nigeria. In H. Ajaegbu et al. (Eds.), Nigeria: A people united, a future assured (pp. 21-26). Perkin, H. (1977). The professionalization of society. Working paper, Yale University, Higher Education Research Group. Philips, D. (1990). The 1988 Nigerian civil service reforms and their post-1992 prospects (Occasional Paper No. 3). Ibadan: NISER.
193
Robinson, E. (1968). The new polytechnics. London: Penguin.
Saavedrea, J. (2003). Education financing in developing countries, level and sources of funds: On the road to quality education for all. Unpublished manuscript (details to be rechecked). Skapski, A. (1966). Report of the comparative technical education seminar abroad and recommendation for a national plan of vocational and technical education in the Republic of Nigeria. Lagos: FME. Sofolahan, J. (1998). National policy review issues. In R. Akpofure (Ed.), The state of education in Nigeria (pp. 3-9). Abuja: UNESCO. St. Matthew-Daniel, B. (2000). The industrial sector. In H. Ajaegbu, B St. Matthew-Daniel, & O. Uyo (Eds.), Nigeria: A people united, a future assured (pp. 153-161). Abuja: Federal Ministry of Information. Tawari, F. (2002). Improving education access to migrant fisherfolks. Paper presented at the Nomadic Education Research Findings Workshop, DFID, Abuja. Tahir, G. (1991). A perspective on the implementation of the mass literacy campaign in Nigeria. Dougirei Journal of Education, 1, 59-62.
Tahir, G. (2001). Federal Government intervention in universal basic education. UBE Forum: A Journal of Basic Education in Nigeria, ?, 1-11.
Taiwo, C. (1980). The Nigerian education system: Past, present and future. Ibadan: Nelson. UBE Programme. (2002a). Annual report, year 2001. Abuja: Author. UBE Programme. (2002b). Cost and financing of training NCE teachers in Nigeria. Unpublished report, UBEC, Abuja. UBE Programme. (2003). Report to JCCE Reference Committee on primary education. Abuja: Author. Udoji, J. (1974). Public Service Review Commission: Main report. Lagos: Federal Ministry of Information. UK, Colonial Office. (1945). Report of the Commission on Higher Education in the Colonies (Cmd. 6647). London: HMSO. Umo, J. (2000). Manpower development and employment. In H. Ajaegbu, D. St. Matthew, & O. Uyo (Eds.), Nigeria: A people united, a future assured . Abuja: Federal Ministry of Information.
194
UNESCO. (2000). EFA global monitoring report. Paris: Author. UNESCO. (2002). Education for all: Is the world on track? In EFA global monitoring report 2000 (pp. 133-140). Paris: UNESCO. Unescopresse. (2002). Education goals remain elusive in more than 70 countries. Press Release No. 2002-86, UNESCO, Paris. Urwick, J. (1987). Improving the qualifications of primary school teachers in Nigeria: Official goals and practical possibilities. Compare, 17, 137-155. Urwick, J. (2002). Determinants of the private costs of primary and early childhood education: Findings from Plateau State, Nigeria. International Journal of Educational Development, 22, 131-144. USAID. (2002). Nigeria FY 2002 congressional budget justification: Develop the foundation for education reform (No. 620-008). Unpublished report, USAID, Abuja. Utomi, P. (2002). The Nigerian experience with non-state delivery of educational services. In H. Charles & E. Iheme (Eds.), Nigerian private sector and education for all: A report on the Private Sector Round Table (pp. 56-63). Abuja: UNESCO. Varghese, M., & Tilak, J. (1991). The financing of education in India (IIEP Research Report No. 92). Paris: UNESCO, IIEP. Woodhall, J. (1996). Introductory paper: Summary of issues and international experiences. In J. Woodhall (Ed.), Financing education in Caribbean countries (Education Forum Series No. 6). Paris: UNESCO, IIEP. World Bank. (1998). Education in Sub-Saharan Africa: Policies for adjustment, revitalization and expansion. Washington, D.C.: Author. World Bank. (2002a). Project appraisal document on a proposed credit in the amount of US$100 million to the Federal Republic of Nigeria for the Universal Basic Education Project. Unpublished report, World Bank, Abuja. World Bank. (2002b). Secondary education in Africa: Contemporary challenges and future demands. Washington, D.C.: Author.