federal r&d: analyzing the shift from basic and applied ... · federal r&d: analyzing the...
TRANSCRIPT

Federal R&D: Analyzing the Shift From Basic and Applied Research Toward Development
May 2013
Sam Shapiro
Department of Economics Stanford University Stanford, CA 94305 [email protected]
Under the direction of Professor John Taylor
Abstract United States Federal Government research and development spending has shifted in recent years away from basic and applied research and toward development spending. Development is later in the product creation cycle and typically performed by private firms. A 2008 spike in development grants to private firms meant to combat the recession caused the increase, but the level going to private firms has only continued to rise after the recession ended and during the recovery. This paper examines potential explanations for this sudden and sustained increase. I present the economic theory regarding the positive externalities of research and development spending, and argue that basic research provides the largest spillover benefit externalities and is the most under selected in the private market equilibrium. Therefore, economic theory suggests that government focus a greater portion of its spending on basic research, and reverse the recent trend of increasing development grants to the private sector. Spillover benefits of development research have been largely internalized by patent policy that provides monopoly power to firms with innovative products, but intellectual property rights cannot internalize the larger and more powerful basic research externalities because basic research affects many markets. The private sector will never stop funding development research, so I argue that government should allocate more funds to the undervalued basic research fields to help correct the market failure. Acknowledgments: I am grateful to my advisor, Professor John Taylor, for his incredible openness and thought provoking guidance throughout this process. I am also grateful to Professor Marcelo Clerici-Arias, leader of the honors program and Dr. Geoffrey Rothwell for their helpful comments. I want to thank my parents, Sally and Jim Shapiro, and my whole family for always supporting me.

Shapiro
2
1. Introduction
The United States’ economic growth has always depended on its capacity to educate,
innovate and create. Research and development by companies, universities and government
agencies has long acted as the engine underlying this innovative growth. The country has always
been a global leader in R&D investment, and has achieved a preeminent position in science- and
engineering-based industries as a result. Through a combination of private and public sector
spending, the USA has consistently spent between one and three percent of GDP on R&D.
Over the past three decades, the economic benefits of R&D spending have become more
widely discussed and studied. Studies such as those conducted by Romer (1990), Agion and
Howitt (1992), Artz et al. (2010) and Ariglés et al. (2011) depict R&D as an engine of growth for
the economy. These papers also introduce the idea that the government should enact policy in
support of R&D. They establish R&D’s knowledge spillover benefits and argue that this positive
externality of research performance justifies government involvement in the market by
internalizing the externality through policy or providing subsidies to R&D spending. Jaffe (1996)
and Takalo et al. (2013) are among those who have published papers quantifying the sources and
impact of these benefits, formalizing the case for increased government involvement because the
private sector will underinvest in R&D.
As the benefits of R&D have become more widely understood, many countries have
significantly increased the favorability of their government policies toward business R&D,
including government subsidization of research. As a result, countries around the world have
increased R&D levels, making science- and engineering-based industries more competitive,
along with increasing global competition to attract R&D spending by multinational companies.

Shapiro
3
Figure 1 shows this increase in R&D spending, as all R&D expenditures are growing and the
“Asia 10” countries have equaled U.S. R&D expenditure.
Figure 1: Worldwide R&D expenditures
Source: National Science Board Science and Engineering Indicators Digest 2012
Because of R&D’s positive externalities, economic theory suggests that the private
market equilibrium amount of research will be less than the socially optimal amount. This fact,
combined with the increased global competition in R&D intensive industries, has brought about
increased support of R&D by the US Federal Government. There are many ways in which the
government can support R&D, including direct subsidies and grants, establishment of
government research agencies and the strengthening of patent laws and intellectual property
rights, among others. In 1981, the United States introduced a pioneering policy called the
Research and Experimentation Tax Credit. The credit aimed to reduce the user cost of R&D for
businesses by providing them a tax credit for each additional dollar they spent in R&D compared

Shapiro
4
to the previous year. The government has supported R&D through initiatives like these for
decades, varying the intensity of these different means of support.
As figure 2 shows, the share of R&D spending paid for by the government and private
industry have fluctuated over the last 60 years. Until the early 1980s, the Federal Government
paid for more than half of total R&D spending. Since then, industry has assumed a much larger
role in funding R&D, due primarily to more favorable policies toward business R&D like the tax
credit mentioned above. Industry’s share peaked at about 70% of R&D spending in the late
1990s, but since then has been coming down as the Federal Government once again has
increased its direct funding of research and development. As this data shows, the Federal
Government has a long track record of significant support of United States R&D spending,
justified by economic theory because of R&D’s positive externalities. Therefore, the question
facing policymakers is not whether to support R&D in this country, but how to go about it.
Figure 2: US R&D funding by source
Source: National Science Board Science and Engineering Indicators 2012
0%
10%
20%
30%
40%
50%
60%
70%
80%
1953
1956
1959
1962
1965
1968
1971
1974
1977
1980
1983
1986
1989
1992
1995
1998
2001
2004
2007
2010 Total US R&D Funding by Source (%)
Federal
U&C
Industry

Shapiro
5
R&D spending can be broken down into three main categories: basic research
(advancing knowledge and understanding), applied research (deciding which discoveries can
become products) and development research (developing these discovered technologies into
actual products). These three types of research receive different levels of federal support, and
also varying investments from the private sector. Because development of products and practices
is so closely tied to a company’s performance, this category receives consistent funding from the
private sector, while basic research spending historically has not. The Federal Government has
also historically provided the most support to development, and this trend has become more
pronounced in recent years in the wake of the recession in the U.S. However, because the three
different types of research create different magnitudes of externalities, with basic research
accounting for the largest externality, I believe that the federal spending breakdown between
these three categories is not given enough attention.
In this thesis, I document a recent trend in federal research support away from basic and
applied research toward development activities. Because basic research creates larger positive
externalities than development activities, basic principles of economics suggest that there should
be a smaller role for government subsidies in the case of development activities than basic
research. Basic research’s large externalities indicate that there should be an increase in the
federal focus on basic research, not a decrease. I provide several possible explanations or
theories that help to pinpoint the reason for the increase in federal subsidies toward industry
development activities and discuss the implications of these theories and the ramifications of this
trend.
Shapiro
6
2. Federal R&D Trend Analysis
The United States spends about 2.8% of GDP, or about $415 billion per year on research
and development (Science and Engineering Indicators 2012—2011 numbers, most recent data).
The Federal Government accounts for one third of this spending, about $130 billion per year, and
its share is steadily increasing. In this section, I will use data from the National Science Board’s
semi-annual publication “Science and Engineering Indicators” (SEI) to analyze the Federal
Government’s growth trend in its share of U.S. R&D funding. Specifically, I note an alarming
increase in federal support of development activities that is driving this increased federal share of
R&D spending, and hypothesize about the reasons for and ramifications of the spending growth
in this category. I will begin with an overview of the current U.S. R&D climate, using data from
the SEI report, which is collected from the federal budget and representative surveys of private
sector companies and universities.
U.S. R&D Spending Overview
U.S. R&D spending growth has outpaced overall GDP growth over the last 50 years, and
is therefore rising as an overall percentage of GDP. Of the three types of research—basic
research, applied research, and development activities—development commands the most
funding. Figure 3 illustrates gross U.S. expenditures on each type of research, and shows each
category’s growth, with development spending significantly above the other two. Figure 4 shows
the percentage breakdown for each category, revealing that development has consistently
received about 60% of U.S. R&D funds, while basic and applied research split the remaining
40% equally with 20% each.

Shapiro
7
Figure 3: United States R&D spending by type
Source: National Science Board Science and Engineering Indicators 2012
Figure 4: United States R&D spending by type (%)
Source: National Science Board Science and Engineering Indicators 2012
0
50,000
100,000
150,000
200,000
250,000
300,000 1971
1973
1975
1977
1979
1981
1983
1985
1987
1989
1991
1993
1995
1997
1999
2001
2003
2005
2007
2009
2011
U.S. R&D Spending by Type ($M)
Basic
Applied
Development
0.000
0.100
0.200
0.300
0.400
0.500
0.600
0.700
1971
1973
1975
1977
1979
1981
1983
1985
1987
1989
1991
1993
1995
1997
1999
2001
2003
2005
2007
2009
2011
U.S. R&D Spending by Type(%)
Basic %
Applied %
Development %

Shapiro
8
I noted in the introduction that the Federal Government’s share of R&D spending is
rising, while private industry’s share is falling. This is apparent in figure 2, as the federal share is
33% and its trend line is rising. To more deeply understand this rise in the Federal Government’s
share of R&D spending, I will now breakdown the funding sources of the three categories of
research.
R&D Funding by Category Basic Research consists of investigation and analysis to achieve a more comprehensive
understanding of a subject, law of nature, or phenomenon, instead of on a specific practical
application of research results. It can be described as advancing knowledge for knowledge’s
sake. Many important and commercially viable products are developed based on breakthroughs
made by basic research. The biomedical field provides a prototypical example. In the 1970s,
Julius Comroe and R.D. Dripps, asked 90 physicians to list the 10 most important developments
in cardiovascular-pulmonary medicine. Of these breakthroughs, the researchers found that 42%
came from conceptual breakthroughs in the work of biochemists, endocrinologists, physiologists,
and other basic scientists who were not working specifically on that disease area (National
Institute of General Medical Sciences, 2011). These scientists achieved increased understanding
of the heart, lungs, muscles and other parts of the body, as well as hormones and drug receptors.
The Human Genome project is another example of basic research, this time government
funded, that has had huge impacts on the private sector and society as a whole. Started in 1990,
the HGP set out to identify all of the approximately 25,000 genes in human DNA, determine the
sequences of base pairs that make up DNA, and store and distribute this information (U.S.
Department of Energy Office of Science, 2013). Today, the US biotechnology sector is a

Shapiro
9
multibillion-dollar industry, catalyzed by the advancements through the HGP, a basic research
project.
Because of the purely knowledge-seeking nature of basic research, the most immediate
effect of basic research breakthroughs is felt in the academic and research world. However, the
success of basic research often spawns entire new possibilities for industries, as was the case
with the biotechnology field and the Human Genome Project. Therefore, these knowledge
spillovers (the impact of one research breakthrough on other fields or disciplines) of basic
research are often magnified by much applied and development research that follows. Basic
research enables significant commercial opportunities because if facilitates entirely new product
areas rather than just incremental changes.
Basic research data
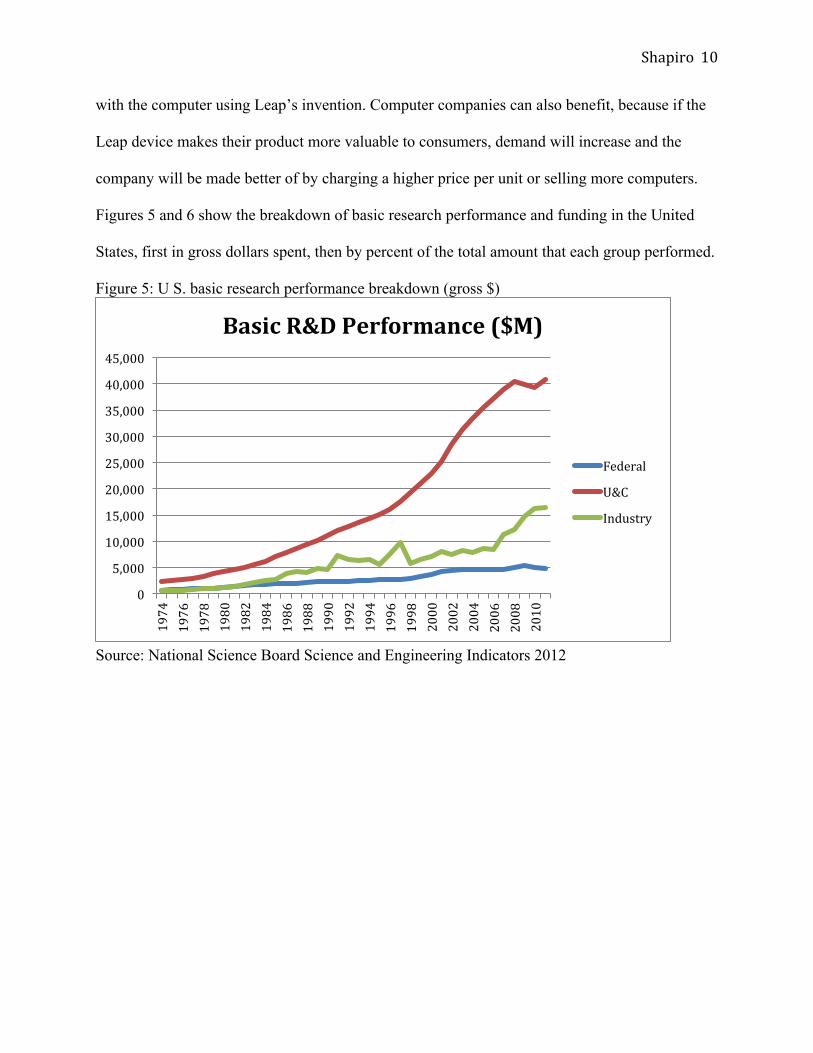
Universities and colleges (U&C) perform 65% of basic research, and this percentage has
steadily declined from 75% in 2005. Over that same span, industry has increased its share of
basic research performed from 18% to 28%. Some argue that this increase in industry spending
can be seen as an internalization of some of the knowledge spillovers cited in the paragraph
above about basic research. Industry’s increased basic research spending might represent an
acknowledgement from private companies of the potential impact of basic research
breakthroughs—they can create entire new products or market segments, instead of simple
marginal improvements. Leap Motion’s new computer interaction device is a current example of
a network spillover in basic research funded and performed by the private sector—in this case a
startup company with venture funding. Their device allows users to interact with their computer
screens as if the area in front of the screen were a three dimensional touch screens. The network
spillovers from this device will benefit application developers that create new ways to interact
Shapiro
10
with the computer using Leap’s invention. Computer companies can also benefit, because if the
Leap device makes their product more valuable to consumers, demand will increase and the
company will be made better of by charging a higher price per unit or selling more computers.
Figures 5 and 6 show the breakdown of basic research performance and funding in the United
States, first in gross dollars spent, then by percent of the total amount that each group performed.
Figure 5: U S. basic research performance breakdown (gross $)
Source: National Science Board Science and Engineering Indicators 2012
0
5,000
10,000
15,000
20,000
25,000
30,000
35,000
40,000
45,000
1974
1976
1978
1980
1982
1984
1986
1988
1990
1992
1994
1996
1998
2000
2002
2004
2006
2008
2010
Basic R&D Performance ($M)
Federal
U&C
Industry

Shapiro
11
Figure 6: U.S. basic research performance breakdown (percent)
Source: National Science Board Science and Engineering Indicators Digest 2012 Because basic research does not receive significant private sector funding compared with
the other two categories, and the main group that performs this type of research (universities and
colleges) does not have a budget large enough to fund a significant amount of it, the Federal
Government assumes a very important role in funding this category of research. Figure 7 shows
gross level of spending on basic research by funding group, and reveals significant growth in
both federal and industry spending over the last 10 years. However, despite the Federal
Government’s recent growth in overall R&D spending levels, the share of federal basic research
spending as a percentage of total basic research spending has decreased over the past 10 years, as
seen in figure 8. This trend is relevant in my analysis of overall federal R&D spending allocation
in section 5.
0.000
0.100
0.200
0.300
0.400
0.500
0.600
0.700
0.800 1974
1976
1978
1980
1982
1984
1986
1988
1990
1992
1994
1996
1998
2000
2002
2004
2006
2008
2010
U.S. Basic R&D Performance (%)
Federal %
U&C %
Industry %

Shapiro
12
Figure 7: U.S. basic research expenditure
Source: National Science Board Science and Engineering Indicators 2012 Figure 8: U.S. basic research expenditure breakdown
Source: National Science Board Science and Engineering Indicators Digest 2012
0
5,000
10,000
15,000
20,000
25,000
30,000
35,000
40,000
45,000 1974
1976
1978
1980
1982
1984
1986
1988
1990
1992
1994
1996
1998
2000
2002
2004
2006
2008
2010
Basic Research Expenditure ($M)
Federal
U&C
Industry
0.0%
10.0%
20.0%
30.0%
40.0%
50.0%
60.0%
70.0%
80.0%
1974
1976
1978
1980
1982
1984
1986
1988
1990
1992
1994
1996
1998
2000
2002
2004
2006
2008
2010
Basic Research Expenditure (%)
Federal %
U&C %
Industry %

Shapiro
13
Applied Research is the intermediary step between basic research and product development.
Once an advance has been made in basic research, companies will spend money trying to figure
out ways that the discovery might be made into a commercially viable product or technology.
Basic research breakthroughs will never have material impact on a country’s economy or its
citizens’ way of life without applied research spending to find out what types of products can be
made from the new technology or innovation. Applied research does not have to follow basic
research, however. The exploration of a specific problem or question with a product application
already in mind also qualifies as applied research.
Historically, the private sector has performed roughly 70% of this research, followed by
universities and colleges and the Federal Government, with a rough split of 15% each. Figure 9
shows levels of performance by group, while figure 10 illustrates the percentage share each
group has performed over the years. Figure 10 shows that even while the shares of funding shift
between industry and government, the role of performing applied research has stayed relatively
constant, with industry remaining above 60%. However, the red line representing university and
college performance of applied research has reach unprecedented heights, at 24% in 2011. This
indicates that the group doing the majority of the basic research is now beginning to keep more
of the next step of research in product development in-house. This is an interesting trend to
watch, but should not have a large effect on federal funding strategies for applied research. Note
the volatility of industry performance of applied research. These peaks and valleys of spending
appear to correspond with the economic climate, and will be addressed later in this section.

Shapiro
14
Figure 9: U.S. applied research performance ($)
Source: National Science Board Science and Engineering Indicators 2012 Figure 10: U.S. applied R&D performance breakdown
Source: National Science Board Science and Engineering Indicators 2012
0
10,000
20,000
30,000
40,000
50,000
60,000
70,000 1974
1976
1978
1980
1982
1984
1986
1988
1990
1992
1994
1996
1998
2000
2002
2004
2006
2008
2010
Applied Research performance($M)
Federal
U&C
Industry
0.0%
10.0%
20.0%
30.0%
40.0%
50.0%
60.0%
70.0%
80.0%
90.0%
1974
1976
1978
1980
1982
1984
1986
1988
1990
1992
1994
1996
1998
2000
2002
2004
2006
2008
2010 Applied R&D Performance (%)
Federal %
U&C %
Industry %

Shapiro
15
Figure 11 illustrates an interesting characteristic that is unique to applied research expenditure.
While federal expenditure on applied research grows with relative consistency, industry spending
in the area is dramatically tied to the country’s macroeconomic climate. The figure highlights
United States recessions in blue, and the data show massive declines in industry applied research
spending during the past two recessions, coupled with an almost immediate turnaround toward
growth in applied research spending during economic expansion. The Great Recession saw a
30.6% decrease in industry development spending, form $49.6 billion to $34.4 billion. The 2001
recession saw a 34.8% industry spending decrease, from $41.2 billion to $26.9 billion.
Meanwhile, the period of economic expansion between these two recessions brought industry
applied research spending growth of 84.4% while the period of economic expansion in the late
1990s brought industry spending growth of 106.2%. The dramatic fluctuation in industry applied
research spending is not reflected by Federal Government investment in applied research.

Shapiro
16
Figure 11: United States applied research expenditure, U.S. recessions highlighted in blue
Source: National Science Board Science and Engineering Indicators 2012
Despite performing roughly 65%, the private sector only funds only 55% of applied
research, with the Federal Government funding 40%. Figure 12 shows that the federal share of
applied research has been rising since the late 1990s, accompanied by a fall in the industry share
of applied research funding.

Shapiro
17
Figure 12: U.S. applied research expenditure by funding source
Source: National Science Board Science and Engineering Indicators 2012
Development Research is the systematic and purposeful use of scientific or technical
knowledge to meet specific requirements or create a commercial product (Science and
Engineering Indicators, 2012). In the product development process, basic and applied research
represent the first two thirds (coming up with an idea and figuring out how to make it into a
product), and development represents the final third (actually creating a product based on the
idea). Similar to applied research, development has typically been funded and performed by the
private sector because it is so closely tied to final goods and services, and therefore closely tied
to the performance of businesses. Companies have a much larger immediate incentive to invest
in product development because they will reap more immediate rewards. Figure 13 shows
0.0%
10.0%
20.0%
30.0%
40.0%
50.0%
60.0%
70.0%
80.0% 1971
1973
1975
1977
1979
1981
1983
1985
1987
1989
1991
1993
1995
1997
1999
2001
2003
2005
2007
2009
2011
Applied Research Expenditure (%)
Federal %
U&C %
Industry %

Shapiro
18
development activity levels by group, with industry performing most of it. Figure 14
corroborates this, revealing that 90% of development is performed by private businesses.
Figure 13: U.S. development performance ($M)
Source: National Science Board Science and Engineering Indicators 2012 Figure 14: U.S. development performance (%)
Source: National Science Board Science and Engineering Indicators 2012
0
50,000
100,000
150,000
200,000
250,000
1974
1976
1978
1980
1982
1984
1986
1988
1990
1992
1994
1996
1998
2000
2002
2004
2006
2008
2010
Development Performance ($M)
Federal
U&C
Industry
0.000
0.100
0.200
0.300
0.400
0.500
0.600
0.700
0.800
0.900
1.000
2000 2001 2002 2003 2004 2005 2006 2007 2008 2009 2010 2011
Development Performance (%)
Federal %
U&C %
Industry %

Shapiro
19
Private industry also spends that majority of development money. However, just as in applied
research, the Federal Government has been assuming a larger share of development expenditure
in recent years. Figure 15 shows that both the federal and industry amount of development
spending his risen, but figure 16 reveals that the federal share of spending has risen about 10%
over the last decade, with a corresponding 10% decrease in the industry share of spending.
Figure 15: U.S. development expenditure ($)
Source: National Science Board Science and Engineering Indicators 2012
0
50,000
100,000
150,000
200,000
250,000
Developmet Expenditure ($M)
Federal
U&C
Industry

Shapiro
20
Figure 16: U.S. development expenditure (%)
Source: National Science Board Science and Engineering Indicators 2012
3. Economic Theory: Positive R&D Externalities and Government Intervention Externalities cause deadweight loss in free markets because the private cost or utility of
the good is different from the public cost or utility of the good. Due to the positive externalities
associated with R&D knowledge spillovers, and the risky and difficult to predict nature of
researching new products or technologies, the market equilibrium for R&D spending is lower
than the socially optimal amount.
First, profit-maximizing firms cannot know the true benefit of R&D spending until after
taking on the cost. This is especially true for basic research, when specific product applications
are unpredictable. Because of the speculative nature of research and development, firms cannot
0%
10%
20%
30%
40%
50%
60%
70%
80%
90%
1972
1974
1976
1978
1980
1982
1984
1986
1988
1990
1992
1994
1996
1998
2000
2002
2004
2006
2008
2010
Development Expenditure (%)
Federal %
U&C %
Industry %

Shapiro
21
know how long or costly the process of developing a new product or technology will be, or if a
new product or technology will be developed at all. Further, firms cannot know with certainty
how valuable a product or technology will be if it is successfully developed, so they have little
data to base calculations of the optimal amount of R&D spending. They can base calculations off
of results produced by past R&D spending or from comparable firms’ R&D results, but these
calculations might not lead to the optimal amount of R&D spend for the firm. Therefore, these
firms may assign an inaccurately low expected benefit of R&D and engage in a lower-than-
optimal level of spending.
Even if each firm optimizes its own R&D spending by equating the marginal cost of
R&D with the marginal benefit of that R&D, the resulting equilibrium will be societally
inefficient due to the positive externality of R&D spillover effects. When one firm develops a
cheaper of better way to do something, that improvement will likely benefit many others, in the
form of reduced costs, increased utility or simplicity, or the possibility of new product offerings.
For example, if a phone company develops a technology that increases phone call clarity and
reduces the cost of long distance calls, the company will likely benefit by taking customers from
competitors and increasing revenue. However, many others companies will benefit from this
advancement as well. Families with members far away from each other, national or multinational
businesses, even the manufacturers of the telephones themselves will all benefit. Society as a
whole is made better of by one specific innovation. Therefore, the marginal societal benefit of
reducing the cost of long distance phone service is greater than the marginal private benefit of
doing so for the phone company, and the optimal social equilibrium for R&D spending should
reflect this if society wants to avoid experiencing deadweight loss. Figure 17 illustrates the
market equilibrium for R&D spending, and shows that it is below the quantity that maximizes

Shapiro
22
societal welfare because the positive externality of technology advancement is not taken into
account.
Figure 17: Externality of R&D
Source: Original figure
In this section I will review current economic theory of positive externalities resulting
from R&D, and the implications of these externalities on government policy relating to R&D
spending.
Research Spillovers
Alfred Marshall, one of the trailblazers of modern microeconomics, formalized the study
of the benefits of shared knowledge between firms in his book Principles of Economics.
Many of those economies in the use of specialized skill and machinery which are commonly regarded as within the reach of very large establishments, do not depend on the size of individual factories. Some depend on the aggregate volume of production of the kind in the neighborhood; while others again, especially those connected with the
Shapiro
23
growth of knowledge and the progress of the arts, depend chiefly on the aggregate volume of production in the whole civilized world. (Marshall 1920)
This insight indicates that many firms can benefit from the technological advancements of one
firm, particularly those firms that are located near or work closely with the firm that has made
the advancement. Even in the 1920s, he argues that "the secrecy of business is on the whole
diminishing, and the most important improvements in method seldom remain secret for long
after they have passed from the experimental stage” (Marshall, 1920). If this were true in the
1920s, it is greatly magnified today in the information age.
Modern theory outlines three ways that R&D generates positive externalities: market
spillovers, knowledge spillovers, and network spillovers. I will outline each of these three
effects, and then discuss the ways in which they can interact.
Market Spillovers
Market spillovers occur when benefits from a technology advancement flows from the
firm that achieved the advancement to other firms in the same market. If knowledge spillovers
(when certain groups benefit from the knowledge attained by another group) provide benefits
due to “knowledge leakage,” then market spillovers can be said to provide benefits through the
leakage of decreased prices or other benefits to multiple actors in the market. When a firm
creates a new product, or reduces the cost of producing an existing product, market forces will
generally spread these benefits out across the market in which the firm operates, and therefore
buyers benefit as well.
Let us consider the case of baseball bats. If Louisville Slugger develops technology to
create a higher quality, cheaper baseball bat, the company will experience greater success over
their competitors by selling a higher quality product or advertising a lower price point than
others in the market. However, any baseball team or little leaguer interested in purchasing a bat

Shapiro
24
is also better off, as they now have access to a higher quality product at a lower price than
before. In other words, the price of the new and innovative product cannot fully capture all of the
value created by the innovation, and therefore some of it will be passed along to other groups.
Figure 18 shows a pure market spillover.
Figure 18: Pure market spillover
Source: Jaffe (1996) Knowledge spillovers
Knowledge attained through research that can be used without cost by another firm, or
purchased by another firm for less than the value of the knowledge, will add value to the firm
receiving the knowledge, even though that firm was not involved in the research process. These
spillovers are particularly common in basic research, where academic papers spread knowledge
widely and quickly, and fields advance largely in unison. However, knowledge spillovers occur
in applied and development research as well, despite the innovative firm’s attempt at keeping the
innovation secret. This can happen through the reverse engineering of a product or process, the
leaking of information, or the sale of a new technology or intellectual property to another firm.
Figure 19 shows knowledge spillovers combined with market spillovers.

Shapiro
25
Figure 19: Knowledge and market spillovers
Source: Jaffe (1996) Network spillovers
Network spillovers occur when the economic value of a technology or product is tied
closely to the value of a related technology. A common example of network spillovers is the
relationship between a technology platform and application developers, such as the smartphone.
The phone has its own intrinsic value, but becomes more and more valuable as application
developers create new functionality for the phone. There is a symbiotic relationship between
these two groups, and therefore an innovation by one side of this platform will benefit the other
side.
Another benefit of network spillovers is the coordination effect. New technologies can
often facilitate easier or completely new interaction between actors in a marketplace. For
example, Facebook’s consolidation of online users interested in gaming made it possible for
companies such as Zynga to create a business solely around providing games to the site’s users.

Shapiro
26
Government Intervention
The market failure caused by the positive externality of these research spillovers justifies
government intervention to try and eliminate the deadweight loss created by the inefficient
allocation of R&D spending chosen by the market. The U.S. Federal Government has long been
active in supporting R&D spending across public and private sector institutions, as well as
universities. There are a number of ways that the Government can support research, each one
impacting the groups that perform this research differently.
Government-funded research: The simplest way the government can support research is to
fund it directly. National Defense missions like the Manhattan Project and NASA’s Apollo
mission during the space race in the 1960s are examples of these projects. Lasers, created by
Charles Townes with funding support from the National Science Foundation and the U.S. Navy,
the Internet, created by the U.S. Department of Defense’s Defense Advanced Research Projects
Agency (DARPA), GPS, The Human Genome Project and bone grafts for cancer treatment are
among the many innovations linked to government funded and performed research (Warner,
2013).
Government grants for private sector research: The government can also support R&D with
direct grants to private businesses. The American Recovery and Reinvestment act of 2009
featured many grants to private businesses for research expenditures. There have been some
well-publicized failures in this category, including the $500 million grant given to Solyndra, a
solar photovoltaic system manufacturer that went bankrupt soon after receiving the money.
R&D Tax Credit: One of the main policy considerations when analyzing a country’s treatment
of R&D is its tax treatment of R&D expenditure. An Ernst and Young survey of economic
research reveals a consensus that the United States’ R&D tax credit significantly raises levels of

Shapiro
27
private research spending. There is a substantial body of economic research that has examined
the linkage between the R&D tax credit and spending spanning the past three decades (Carroll,
Prante, Quek, 2011). Individual estimates of the strength of the credit’s impact on R&D spending
vary, but all research establishes a positive and significant correlation between the tax credit and
research spending. These papers also content that the effects might be even larger were the tax
credit made permanent, because businesses typically plan long term strategies for R&D
expenditure, and stable policy will engender more confidence that the lowered price of R&D will
be maintained.
Many studies over the past 20 years have examined the correlation between R&D credits
and research spending. This research consistently finds that R&D credits have had a profound
impact on research spending. These credits’ impacts are studied in the short and long run, with
the long run impact usually significantly higher than the short run impact. Most of the studies
relate changes in the after-tax user cost of research to control for a variety of other factors that
might also influence the level of research spending. Generally, the cost to a firm of conducting
one dollar of research can be found by subtracting the credit rate from one dollar. Many studies,
including Hall (1992), Hines (1993), Rao (2010) and Gupta, Hwang and Schmidt (2011), use
firm level data. This strategy allows the researchers access to a rich dataset from which they can
capture the impact of differences in the tax treatment of R&D over a series of time and across
many firms on R&D outlays. Other studies used aggregated industry data, such as Mamuneas
and Nadiri (1996), country data, such as Bloom, Griffith, and Van Reenen (2002), and state level
data, such as Wilson (2009).
Patent and Intellectual Property Protection: Patents give inventors of innovative products or
technology improvements monopoly power over their creation. This ownership helps the

Shapiro
28
inventor to derive the full economic benefit of the product. Formally, it internalizes or eliminates
the market spillover by allowing the innovator to reap all the benefits. Therefore, the full
potential benefit of research and development will be taken into account when firms are deciding
whether to pursue development activities, indicating that they would be more likely to select the
socially optimal amount. However, monopolies also create deadweight loss for society. Also, this
idyllic version of monopolies does not always play out: uncertainty of the likelihood of obtaining
proprietary rights can reduce the perceived value of a given research project, which may
discourage inventors from entering certain fields.
Further, patents can only truly internalize the externality of development spending,
because basic research breakthroughs are much more difficult to protect and can often apply to a
wide variety of industries. Essentially, these breakthroughs are often too removed from markets
for goods to provide their economic returns exclusively to the innovative party.
4. Trend analysis: large increase in federal development funding I noted in the previous section the trends in the relative shares of federal and industry
funding in the three different categories of R&D. In basic research, federal funding has been
decreasing while industry share is increasing. In appplied research and development, the federal
share has been increasing while the industry share has been declining (note: please see appendix
A for an analysis of the share of federal R&D spending that each federal agency receives).
Examing federal R&D funding more closely, figure 20 shows that the amount of money
devoted to development spending has shot up in the past 5 years, with a particularly large
increase in 2008. Figure 21 shows that federal development spending had historically been

Shapiro
29
significantly greater than federal basic and applied research spending, but became about equal to
basic research for the early 2000s. Then in 2008, development again shot up much more rapidly
than the other two, continuing its increase to the present.
Figure 20: U.S. federal R&D funding ($)
Source: National Science Board Science and Engineering Indicators 2012
0
10,000
20,000
30,000
40,000
50,000
60,000
70,000
1974
1976
1978
1980
1982
1984
1986
1988
1990
1992
1994
1996
1998
2000
2002
2004
2006
2008
2010
Federal R&D Funding ($M)
Basic
Applied
Development

Shapiro
30
Figure 21: U.S. federal R&D funding (%)
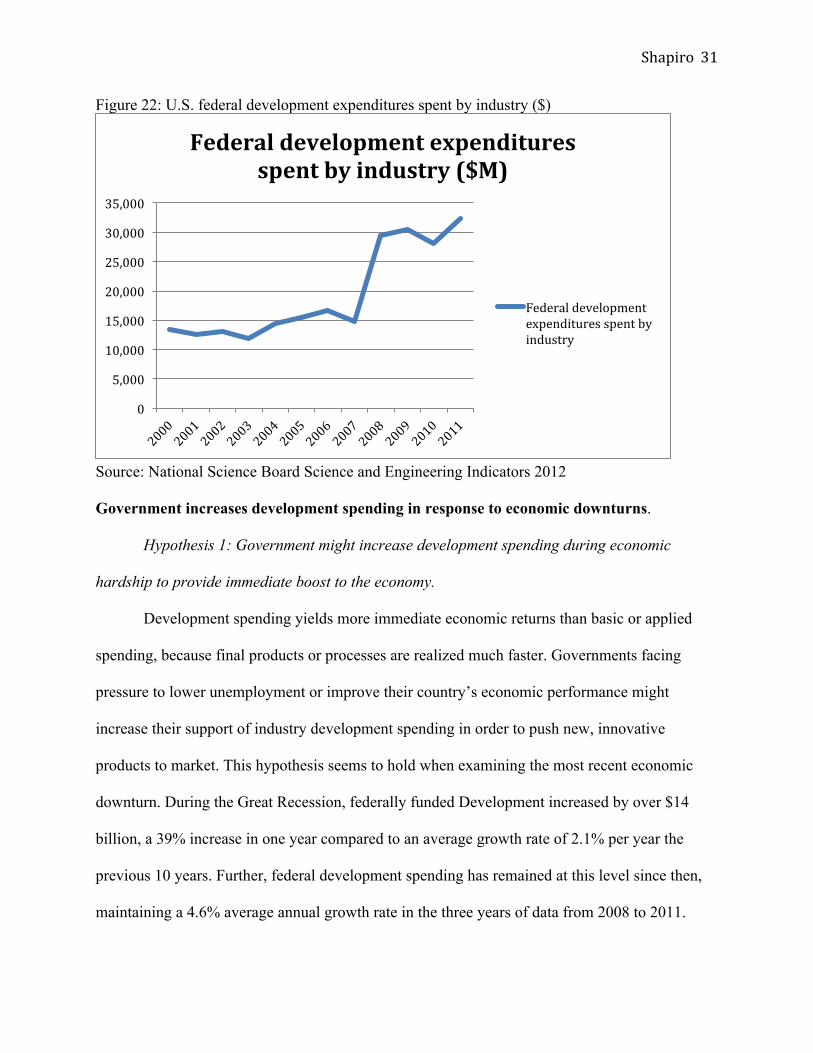
Source: National Science Board Science and Engineering Indicators 2012 Further examination shows that the large increase in development spending in 2008 was almost
exclusively due to an increase in federal funding of industry development spending. Figure 22
shows that industry spending of federal funds on development skyrocketed by nearly $15 billion
during 2008, which is the same dollar amount that federal development spending as a whole
increased. In this next section, I will explore why this might have happened, and discuss the
larger ramifications of these trends in federal R&D spending in the section that follows.
0%
10%
20%
30%
40%
50%
60%
70%
1974
1976
1978
1980
1982
1984
1986
1988
1990
1992
1994
1996
1998
2000
2002
2004
2006
2008
2010
Federal R&D Funding (%)
Basic %
Applied %
Development %
Shapiro
31
Figure 22: U.S. federal development expenditures spent by industry ($)
Source: National Science Board Science and Engineering Indicators 2012
Government increases development spending in response to economic downturns.
Hypothesis 1: Government might increase development spending during economic
hardship to provide immediate boost to the economy.
Development spending yields more immediate economic returns than basic or applied
spending, because final products or processes are realized much faster. Governments facing
pressure to lower unemployment or improve their country’s economic performance might
increase their support of industry development spending in order to push new, innovative
products to market. This hypothesis seems to hold when examining the most recent economic
downturn. During the Great Recession, federally funded Development increased by over $14
billion, a 39% increase in one year compared to an average growth rate of 2.1% per year the
previous 10 years. Further, federal development spending has remained at this level since then,
maintaining a 4.6% average annual growth rate in the three years of data from 2008 to 2011.
0
5,000
10,000
15,000
20,000
25,000
30,000
35,000
Federal development expenditures spent by industry ($M)
Federal development expenditures spent by industry

Shapiro
32
Figure 23 shows this increase, along with the years of U.S. economic recession highlighted in
blue. Almost all of this money went directly to businesses in the private sector, as industry
development spending of federal funds increased $14.6 billion while all other federal funding of
development spending remained level (as can be seen in Figure 22, above).
This evidence suggests an attempt to reverse the recession by injecting funds into
businesses for product innovation, but the data show that this is not a common practice for
United States governments historically during recessions or periods of very low growth. Figure
18 shows the percentage breakdown of federal R&D spending over time, highlighting each of the
United States recessions since 1974 in blue. The green line representing percent of federal R&D
funds going toward development spending increases sharply during the Great Recession of 2007-
2009. However, this spending fell in concert with a longer-term trend during recessions in 2001
and the early 1990s, and remained relatively flat, also in concert with a longer-term trend in the
three recessions prior to that. Figure 24 shows the same data but in percent share of federal R&D
spending instead of total dollars, and the same inconsistency of actions in recessions is present.
Therefore, we can rule out the increase in federal development spending as a systematic response
to a recession, though this does not mean that the 2008 jump in development spending was not at
least in part targeted at combatting the recession. The sustained high level of development
spending, even well into the recovery and including a 9.3% increase in 2011, suggests that the
spending increase is more permanent than a reactionary policy.

Shapiro
33
Figure 23: U.S. federal R&D funding by type ($), recessions highlighted
Source: National Science Board Science and Engineering Indicators 2012
Figure 24: U.S. federal R&D funding by type (%), recessions highlighted
Source: National Science Board Science and Engineering Indicators 2012

Shapiro
34
Hypothesis 2: Political party in the white house, political party control of congress determines
approach.
With such drastic ups and downs in both percentage and gross dollar breakdown of
federal development spending, one might reasonably conclude that the roller-coaster is caused by
dueling ideologies taking control in the white house or congress. Indeed, recent gridlock between
Democrats and Republicans in the nation’s capital, with debates centering around the proper role
of the government in regulating and supporting the private sector, have highlighted opposing
views about how much to support private sector R&D. This divide might be even more
pronounced when looking at development R&D spending, which is the type farthest from
“public good” research, performed to develop a product to be sold rather than undertaken to
create basic understanding of technology or medicine to effect many companies, industries or
people.
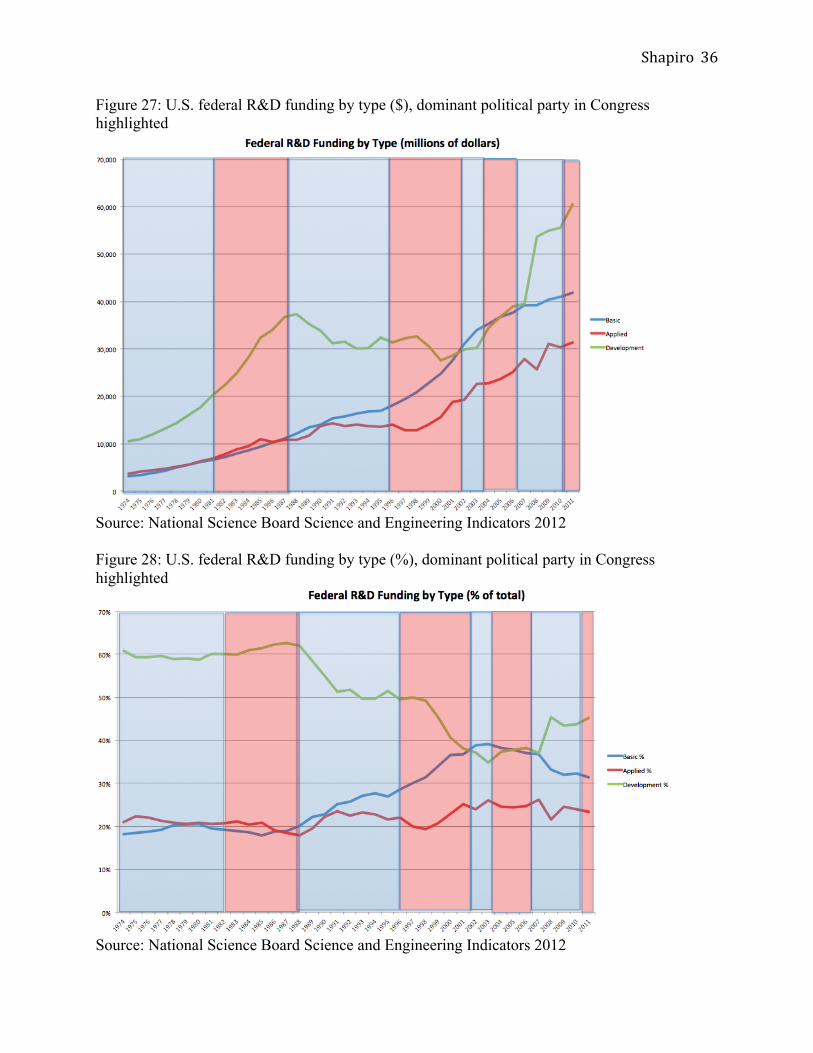
In fact, when looking at the total amount of federal spending on development, three clear
trend lines emerge: from 1974 to 1988 there is consistent, rapid growth in development spending.
Next, spending levels off, remaining relatively constant from 1988 to 2000 before rising rapidly
again from 2000 to 2011. However, as figures 25, 26, 27, and 28 show, these periods of
consistency do not correspond with presidents of a certain party presiding over the white house
or on political party controlling the congress. In figures 25 and 26, blue shading represents a
democrat in the Oval Office while red shading represents a republican. Similarly, the following
two figures, 27 and 28, represent a democratic congress with blue shading and a republican-
controlled congress in red shading.

Shapiro
35
Figure 25: U.S. federal R&D funding by type ($), political party in White House highlighted
Source: National Science Board Science and Engineering Indicators 2012
Figure 26: U.S. federal R&D funding by type (%), political party in white house highlighted
Source: National Science Board Science and Engineering Indicators 2012
Shapiro
36
Figure 27: U.S. federal R&D funding by type ($), dominant political party in Congress highlighted
Source: National Science Board Science and Engineering Indicators 2012 Figure 28: U.S. federal R&D funding by type (%), dominant political party in Congress highlighted
Source: National Science Board Science and Engineering Indicators 2012

Shapiro
37
Hypothesis 3: The American Recovery and Reinvestment Act of 2009 was directed at jump-
starting the economy. The increase in federal development funds went straight to industry—
might this mean that stimulus money fueled the sudden increase?
There are two factors that soundly put this theory to rest. First, ARRA money did not
start being spent until 2009, and the jump in federal development spending occurred in 2008 (the
hypothesis seems promising at first, so I checked to make sure that money was not attributed to
fiscal year 2008 for an accounting abnormality, but funds were in fact not spent until fiscal year
2009).
Further, the level of federal development spending retains the increase in funding of
2008, even continuing to grow in subsequent years. As was the case with all ARRA spending,
federal R&D funding from the ARRA was impermanent, and levels decreased back to pre-
ARRA levels in 2010 (as shown in figure 29). Therefore, there would need to be another cause
for the sustained increase.
One interesting note about the ARRA is that almost all R&D funding went to civilian
functions (see figure 30). This makes sense because non-defense spending is more likely to have
an immediate effect on the economy. However, in years since the stimulus, non-defense
spending has continued to rise while defense R&D has fallen. Wars are winding down and
ending, but civilian research expenditure is different from military operations expenditure. Many
of the United States’ great economic catalysts, such as the Internet, were originated by
Department of Defense projects.

Shapiro
38
Figure 29: U.S. federal R&D funding with ARRA ($)
Source: National Science Foundation; National Center For Engineering Statistics (2012)
Figure 30: U.S. federal R&D funding by function with ARRA ($)
Source: National Science Foundation; National Center For Engineering Statistics (2012)
0 20,000 40,000 60,000 80,000 100,000 120,000 140,000 160,000 180,000
2000
2001
2002
2003
2004
2005
2006
2007
2008
2009
2010
2011
2012 prelim
inary
2013 proposed
Federal R&D Funding with ARRA ($M)
R&D Funding with ARRA
R&D Funding
0 10,000 20,000 30,000 40,000 50,000 60,000 70,000 80,000 90,000 100,000
2000
2001
2002
2003
2004
2005
2006
2007
2008
2009
2010
2011
2012 prelim
inary
2013 proposed
Federal R&D Funding by function with ARRA ($Mil)
National defense w/ ARRA
National Defense
Civilian functions with ARRA
Civilian functions

Shapiro
39
Hypothesis 4: Data Discrepancy—Other sources, such as the Office of Science and Technology
Policy, do not have such a drastic increase in development spending as a share of R&D
Figure 31, below, shows Office of Science and Technology Policy (OSTP) data that does
not include a significant increase in federal R&D spending. I spoke with Matthew B. Wilson,
Science Policy Analyst at the National Science Board, who attributes this discrepancy to the
difficult-to-define boundary between development activities and applied research, suggesting
that the OSTP may have classified the development increase as applied research.
Figure 31: Trends in U.S. federal R&D
Source: U.S. Office of Science and Technology Policy; Federal R&D, Technology, and STEM Education in the 2010 Budget However, the OSTP data also shows a clear increase in development spending over the
past 10 years from 50% of spending in 2000 to 59% in 2010. The differences in classification of

Shapiro
40
research do not change the main trend analyzed here—the government is giving more money to
private industry for development activities.
These four hypotheses fail to describe the increase in federal R&D spending. In the next
section, I discuss the ramifications of this increase on the U.S. economy.
5. Discussion: ramifications of federal R&D spending
The Federal Government’s shift toward funding industry development activity and away
from funding basic research goes against basic economic principles of government intervention
in a market with externalities. The shift is dangerous for the economy due to the large
externalities basic research creates, the importance of basic research as the innovation engine of
the United States economy, and the lack of any other funding source for basic research.
I have shown that R&D creates positive externalities, and different categories of R&D
have different intensities of these externalities. Development activities create new products with
market spillovers. Basic research has proven to create breakthroughs in general knowledge that
positively influence other fields of research in addition to influencing the creation of entirely
new products and markets. Therefore, the basic research creates larger externalities than
development activity because the externality is comprised of many market spillovers from new
products along with the knowledge spillovers from the advancement of human knowledge.
Figure 32 illustrates how basic research creates larger positive externalities than development
spending, because it includes both knowledge and market spillovers.

Shapiro
41
Figure 32: Basic research and development activity externalities
Source: Original figure Basic research also makes applied and development research more productive. Without
significant advancements in basic knowledge or technology, applied researchers and product
developers are left to find marginal improvements to best optimize their products. However,
progress in basic research provides the building blocks for the other two phases of research to
produce truly innovative products that are different and significant improvements from the
previous version.
It is attractive to businesses to pour money into development to stay one small step ahead
of their competitors in improvements on existing products. They must do this to remain
competitive in their industries, and will therefore spend significant portions of their budgets on
development activities regardless of how much support they receive from the government. This
is why the private sector is the main funding source of development activities. Institutions that
perform basic research, on the other hand, do not have large enough budgets to fund the research

Shapiro
42
that they conduct. The Federal Government funds the majority of basic research, as we saw in
the previous section. Therefore, if the Federal Government begins spending relatively more on
industry development activities and less on basic research, no other entity will pick up the slack
in basic research funding, and projects will need to be cut. Society is better off when the
government injects capital into basic research—the innovation engine room of the economy—
because progress in these fields help create completely new and markedly superior products as
opposed to slightly improved ones.
Finally, the government already provides strong incentives for companies to fund
innovative product development projects with intellectual property rights. A patent gives the
inventing company monopoly power over their invention, and therefore the ability to reap large
economic benefits from their creation. This is the goal that drives most product development.
However, the product of basic research is much more difficult to quantify, particularly the
economic benefit of a discovery. Often, single discoveries will affect multiple, entirely different
sectors of the economy, so stifling the spread of this innovation is societally inefficient. Further,
many basic researchers seek the satisfaction, notoriety and high pay that comes with successfully
advancing the state of human knowledge, and are not motivated by intellectual property rights or
secrecy of their discoveries. There are few ways for the government to properly incentivize basic
research expenditure, while there are effective ways to do so for development activities.
Therefore, the government should focus its R&D spending on promoting basic research.
6. Conclusion
The Federal Government is the main funding source for this country’s basic research. The
trend since 2008 of rapidly growing federal support to private businesses for development

Shapiro
43
spending takes focus away from basic research, and is much less efficient than putting that
money toward basic research that forms the foundation of new industries and innovative
products.
Economic theory states that all types of research and development create positive
externalities and therefore merit some type of government intervention in their markets.
However, basic research has much larger externalities because of its capacity to create
knowledge spillovers that benefit other researchers and many market spillovers from any
companies that commercialize their research discoveries. There is no way to internalize these
externalities without providing the funding directly to the institutions performing basic research
because the commercial success of the basic advancement of human knowledge cannot and
should not be contained to one company. In comparison, development research provides only
market spillover benefits, so its externality is smaller, and can be at least partially internalized by
giving the firm that creates an innovative product the ability to reap the benefits through patent
policy.
Private companies may have needed development money to stay afloat and innovative
during the Great Recession, but the recovery has been going on since 2009 and the levels of
federal support for private development spending have not fallen. Government is the main source
for basic research funding, while representing just a small part of the much larger category of
development spending. Nationally, the United States spends about 60% of its money on
development, and just 20% on basic research. Federal funds have a higher potential impact when
put toward basic research, and a larger negative impact when they are taken away, because the
private sector will not fill the gap and provide researchers with money. Conversely, if the
government were to remove funds supporting private development, companies would be

Shapiro
44
incentivized to still select the optimal level of development spending (and this will be the
socially optimal level if proper patent laws are in place) because it directly affects their bottom
line.
Innovation can come in the form of small product optimizations, such as making a drug
slightly more effective, or large shifts that alter sectors or create entirely new ones, such as the
invention of a new way to treat a disease or a newfound cure. Development spending is
important to the economy to continue producing new product innovations, but the magnitude of
the effect of these innovations is determined by advances in the basic knowledge that underlie
them. Basic research represents the underlying engine of new products and services, and society
benefits from increased emphasis on this area. Because of the large spillover benefits, the private
sector will never choose to spend the socially optimal amount on basic research. It is therefore
imperative that the government focus more intently on correcting this market failure and ensure
that development money is spent on large product shifts from new knowledge, not incremental
improvements.

Shapiro
45
References Aghion, P. Howitt. A model of growth through creative destruction. Econometrica, 60 (2) (1992), pp. 323–351 Ariglés, Potters, Vivarelli. 2011. “R&D and productivity: testing sectoral peculiarities
using micro data,” Empirical Economics, December, Vol. 41, Issue 3, pp. 817-839.
Artz, Norman, Hatfield, Cardinal. 2010. “A Longitudinal Study of the Impact of R&D, Patents, and Product Innovation on Firm Performance,” The Journal of Product Innovation Management, July, Vol. 27, Issue 5: pp.725-740.
Bloom, Nick, Rachel Griffith and John Van Reenen. “Do R&D Tax Credits Work?
Evidence from a Panel of Countries, 1979-1997.” Journal of Public Economics Vol. 85. (2002). pp.1-31.
Carroll, Prante, Quek, 2011. The R&D Credit: An effective policy for promoting research
spending. Ernst and Young, September 2011. Gupta, Sanjay, Yuhchang Hwang and Andrew Schmidt, “An Analysis of the Availability
and Incentive Effects of the R&D Tax Credit After the Omnibus Budget Reconciliation Act of 1989,” mimeograph, W.P. Carey School of Business, Arizona State University, 2006.
G. Grossman, E. Helpman. Innovation and Growth in the Global Economy. MIT Press,
Cambridge, MA (1991) Hall, Bronwyn, “Investment and R&D at the firm level: Does the source of financing
matter? National Bureau of Economic Research, NBER Working Paper 4096, June 1992. Hall, Bronwyn H. and John Van Reenen. “How Effective Are Fiscal Incentives for R&D?
A Review of the Evidence.” Research Policy Vol. 29. (2000). pp. 449-469. Hines, James. “On the Sensitivity of R&D to Delicate Tax Changes: The Behavior of
U.S. Multinationals in the 1980s.” Studies in International Taxation A. Giovannini, R.G. Hubbard, J.Slemrod, eds., (Chicago: University of Chicago Press, 1993).
Jaffe, A. 1996. Economic analysis of research spillovers: implications for the advanced
technology program. National Institute of Standards and Technology. Jaffe, Adam B. "Trends and patterns in research and development expenditures in the
United States." Proceedings of the National Academy of Sciences of the United States of America 93. 23 (1996): 12658-12663.
Jaffe, Adam B. Economic Analysis of Research Spillovers: Implications for the

Shapiro
46
Advanced Technology Program. Economic Assessment Office, The Advanced Technology Program, National Institutes of Standards and Technology, U.S. Department of Commerce. 1996.
Jaffe, Adam B. and J. D. Adams. "Bounding the effects of R&D: An investigation using
matched establishment-firm data." Rand Journal of Economics 27. 4 (1996): 700-721. Jaffe, Adam B. with J.P. Kalt, S.T. Jones and F.A. Felder. "Regulatory Reform and the
Economics of Contract Confidentiality: The Example of Natural Gas Pipelines." Regulation (1996).
Klassen, Kenneth, Jeffrey Pittman, and Margaret Reed. “A Cross-national Comparison of
R&D Expenditure Decisions: Tax Incentives and Financial Constraints.” Contemporary Accounting Research. Vol. 21. (Fall 2004). pp. 639-80.
Mamuneas, Theofanis P., and M. Ishaq Nadiri. “Public R&D Policies and Cost Behavior
of the U.S. Manufacturing Industries.” Journal of Public Economics Vol. 63(1). (1996). pp.57-81.
Mansfield, Edwin, “The R&D Credit and Other Technology Policy Issues.” AEA Papers
and Proceedings Vol.76, (1986). pp. 190-194. Marshall, A. 1920. Principles of Economics. 8th Edition. London: Macmillan and Co.,
Ltd. National Science Board. 2012. “Science and Engineering Indicators Digest,”
Arlington, VA: National Science Foundation.
National Science Board. 2012 “Science and Engineering Indicators,” Arlington, VA: National Science Foundation.
National Institute of General Medical Sciences. 2011. Why Do Basic Research?
http://publications.nigms.nih.gov/basicresearch/ OECD (2013), Table 11. Industry-financed GERD (Gross domestic expenditure on R&D) as a
percentage of GDP, in Main Science and Technology Indicators, OECD Publishing. OECD (2013), Table 45. Higher education expenditure on R&D (HERD) at current prices and
PPPs, in Main Science and Technology Indicators, OECD Publishing. OECD. 2013. “OECD Technology and Industry Scoreboard, 2011.” Last Updated 2011.
http://www.oecd-ilibrary.org/sites/sti_scoreboard-2011-en/02/05/index.html?contentType=/ns/Chapter,/ns/StatisticalPublication&itemId=/content/chapter/sti_scoreboard-2011-16-en&containerItemId=/content/serial/20725345&accessItemIds=&mimeType=text/html , accessed January, 16, 2013.

Shapiro
47
Office of Science and Technology Policy. 2010. “Federal R&D, Technology, and STEM
Education in the 2010 Budget.” http://www.whitehouse.gov/files/documents/ostp/budget/FY2010RD.pdf
Romer. Endogenous technological change. Journal of Political Economy, 98 (1990), pp.
S71–S102 Takalo, T., Tanayama, T., Toivanen, O. 2013. “Estimating the Benefits of Targeted R&D
Subsidies,” The Review of Economics and Statistics, March, Vol. 95, No. 1, pp 255-272. Warner, Bernhard. 2013. “Why Private Companies Won’t Make Up for Cuts in
Government Science Funding.” March 05. Wilson, Daniel J. “Beggar Thy Neighbor? The In-State, Out-of-State, and Aggregate
Effects of R&D Tax Credits.” Review of Economics and Statistics Vol. 91, (2011). pp. 431-436.

Shapiro
48
Appendix A Note on Federal R&D Spending: Agencies
When discussing federal spending of any category, it is important to understand which
departments of the Federal Government are distributing or receiving the money. In the case of
federal R&D, the Department of Defense is the major fund recipient. As Figure A1 shows,
federal R&D spending is split about evenly between the Department of Defense (51%) and all
other departments (49%), with the Department of Health and Human Services receiving the next
largest amount (27%). Figure A2 reveals that the Department of Defense spends 81% of its R&D
money on projects classified as “advanced systems development,” while an additional 9% is
classified as “advanced technology development.” This spending alone means that about 45% of
overall federal R&D spending is going to development through the Department of Defense
alone. This has important policy implications, because it is more difficult to alter the composition
of defense R&D spending amongst the three types of research than non-defense spending. In
other words, when bombs or tanks need to be manufactured, it is difficult to safely postpone that
process.

Shapiro
49
Figure A1
Source: National Science Board; Science and Engineering Indicators 2012
Figure A2
Source: National Science Board; Science and Engineering Indicators 2012
DOD, 51%
HHS, 27%
DOE, 7%
NSF, 5%
NASA, 4% USDA, 2% DHS, 1%
DOC, 1% Other, 2% Federal R&D Spending by Department
DOD
HHS
DOE
NSF
NASA
USDA
DHS
DOC
Other
Basic, 3% Applied, 7%
Major Systems Development, 81%
Advanced Technology
Development, 9%
Dept. Of Defense R&D Spending Breakdown
Basic
Applied
Major Systems Development
Advanced Technology Development

Shapiro
50
Examining non-defense agencies’ R&D spending, we see in figure 24 that just 13% of
this spending goes to development, while 48% goes to basic research. Some might contest that
this diminishes the argument that federal development spending is too large. However, this
argument is based on the recent increase in industry development of federal funds, a trend that
has maintained growth for the past five years. This increase is detailed in figure 22.
As military spending is cut over the coming years, the overall percentage of federal R&D
funding going to development activities is likely to come down with it. However, I am interested
in the level of federal development funds going to industry, and the paper’s argument is focused
on this statistic.
Figure A3
Source: National Science Board; Science and Engineering Indicators 2012
Basic, 48%
Applied, 39%
Development, 13%
All Departments other than Defense R&D Spending Breakdown
Basic
Applied
Development