federal reserve bank of st. louis regional … economic development ... research division, federal...
TRANSCRIPT

REGIONAL ECONOMICDEVELOPMENT
Challenges to Public Education FinancingFacing Missouri and the Nation
Proceedings of a symposium co-hosted by the Federal Reserve Bank of St. Louis and the Murray Weidenbaum
Center on the Economy, Government, and Public Policy,Washington University in St. Louis, November 4, 2005
Alternative Education Finance StrategiesThomas J. Nechyba
K-12 Public School Finance in Missouri:An Overview
Michael Podgursky and Matthew G. Springer
School Accountability and Student PerformanceEric A. Hanushek and Margaret E. Raymond
Discussions and Commentaries byRoss RubensteinSteven G. Rivkin
Gerri OgleThe Honorable Brian L. Baker
The Honorable Yvonne WilsonTerry AdamsCraig Larson
Federal Reserve Bank of St. Louis
VOLUME 2, NUMBER 1 2006
Challenges to Public Education Financing
Facing Missouri and the Nation
1 Chairman’s RemarksWalter L. Metcalfe Jr.
4 Editor’s IntroductionThomas A. Garrett
7 Alternative Education FinanceStrategies
Thomas J. Nechyba
28 Discussion
Ross Rubenstein
31 K-12 Public School Finance in Missouri: An Overview
Michael Podgursky and Matthew G. Springer
51 School Accountability andStudent Performance
Eric A. Hanushek and Margaret E. Raymond
62 Discussion
Steven G. Rivkin
Commentaries
64 Gerri Ogle
66 The Honorable Brian L. Baker
68 The Honorable Yvonne Wilson
70 Terry Adams
75 Craig Larson
Director of Research
Robert H. Rasche
Deputy Director of Research
Cletus C. Coughlin
Editor
Thomas A. Garrett
Center for Regional Economics—8th District (CRE8)
Director
Howard J. Wall
Cletus C. CoughlinThomas A. Garrett
Rubén Hernández-MurilloAnthony N.M. Pennington-Cross
Christopher H. Wheeler
Managing Editor
George E. Fortier
Assistant Editor
Lydia H. Johnson
Graphic Designer
Donna M. Stiller
The views expressed are those of the individual authorsand do not necessarily reflect official positions of the
Federal Reserve Bank of St. Louis, the Federal ReserveSystem, or the Board of Governors.
REGIONAL ECONOMICDEVELOPMENT
FEDERAL RESERVE BANK OF ST. LOUIS REGIONAL ECONOMIC DEVELOPMENT VOLUME 2, NUMBER 1 2006 i

Regional Economic Development is published occasionally by the Research Division ofthe Federal Reserve Bank of St. Louis and may be accessed through our web site:research.stlouisfed.org/regecon/publications/. All nonproprietary and nonconfidentialdata and programs for the articles written by Federal Reserve Bank of St. Louis staff andpublished in Regional Economic Development also are available to our readers on thisweb site.
General data can be obtained through FRED (Federal Reserve Economic Data), a databaseproviding U.S. economic and financial data and regional data for the Eighth FederalReserve District. You may access FRED through our web site: research.stlouisfed.org/fred.
Articles may be reprinted, reproduced, published, distributed, displayed, and transmit-ted in their entirety if copyright notice, author name(s), and full citation are included.Please send a copy of any reprinted, published, or displayed materials to George Fortier,Research Division, Federal Reserve Bank of St. Louis, P.O. Box 442, St. Louis, MO 63166-0442; [email protected]. Please note: Abstracts, synopses, and other derivativeworks may be made only with prior written permission of the Federal Reserve Bank of St.Louis. Please contact the Research Division at the above address to request permission.
© 2006, Federal Reserve Bank of St. Louis.
ISSN 1930-1979
i i VOLUME 2, NUMBER 1 2006 FEDERAL RESERVE BANK OF ST. LOUIS REGIONAL ECONOMIC DEVELOPMENT

Contributing Authors
Terry AdamsRolla, Missouri, School [email protected]
The Honorable Brian L. BakerMissouri House of [email protected]
Thomas A. GarrettFederal Reserve Bank of St. [email protected]
Eric A. HanushekStanford [email protected]
Craig LarsonRockwood, Missouri, School [email protected]
Walter L. Metcalfe Jr.Board of Directors of the
Federal Reserve Bank of St. [email protected]
Thomas J. NechybaDuke [email protected]
Gerri OgleMissouri Department of Elementary and
Secondary [email protected]
Michael PodgurskyUniversity of Missouri–[email protected]
Margaret E. RaymondStanford [email protected]
Steven G. RivkinAmherst [email protected]
Ross RubensteinSyracuse [email protected]
Matthew G. SpringerVanderbilt [email protected]
The Honorable Yvonne WilsonMissouri [email protected]
FEDERAL RESERVE BANK OF ST. LOUIS REGIONAL ECONOMIC DEVELOPMENT VOLUME 2, NUMBER 1 2006 i i i

FEDERAL RESERVE BANK OF ST. LOUIS REGIONAL ECONOMIC DEVELOPMENT VOLUME 2, NUMBER 1 2006 1
Chairman’s Remarks
Walter L. Metcalfe Jr.
as a fundamental right, equal protection under thelaw, and the education articles of the constitutionof the individual state. Historically, this litigationhas focused its efforts on issues of equality andopportunity. Recently, more cases have addressedthe adequacy of finance distribution formulas interms of meeting state constitutional and statutoryguidelines. Because there are significant achieve-ment gaps between pupils in low-income areasand high-income areas in most states, a formulachange then becomes highly contentious becauseit again involves a redistribution of resources, thelevel of local control, and the effectiveness ofincreased spending.
Now statewide debates and litigation havewidened to include school choice options thatgenerate immense controversy, whether theyallow students to attend a public school outsidetheir neighborhood or a charter school or providevouchers for a private school or tax credits forscholarships allowing some choice.
Symposia such as this provide an opportunityfor the exchange of information outside adversariallitigation, the heat of the legislative process, andthe myopia of personal interests, thus freeing legis-lators, administrators, teachers, economists, andinformed observers to integrate experience andlearning over years of education outcome disparityin broader terms. Leaving aside the individual’sabsolute or relative right to education or opportu-nity, student achievement today is unacceptableon an aggregate level. From the beginning, ThomasJefferson and many others took the position that
T he Research Division of the FederalReserve Bank of St. Louis and theWeidenbaum Center at WashingtonUniversity in St. Louis provided a valu-
able public service by co-hosting the symposiumon K-12 public education finance. Unlike manyacademic or local conferences, participantsincluded both nationally recognized scholars inschool finance and Missouri legislators and schoolsuperintendents active in the design and imple-mentation of public policy. This is a useful modelto move the dialogue forward for the benefit ofK-12 students.
For every state, the cost of educating studentsenrolled in public K-12 schools is divided amonglocal, state, and federal resources. The debate islively and contentious at each level. States allocateeducation funding in various ways and the statelegislative debate usually involves only two sub-jects: (i) “more” money for K-12 education and (ii)“fair” distribution of money across the public schooldistricts. Thus, state legislators with specific con-stituencies—representing areas with small or largedistricts, rural or urban districts, wealthy or poordistricts, special need or traditional districts—typically argue for outcomes based on the charac-teristics of their school districts rather than onstandards-based student achievement. The debateusually emphasizes dividing the dollars to be spentby the state rather than accountability for the dollars.
The courts are a second forum for debate.Legal challenges to finance distribution formulastraditionally forward three arguments: education
Walter L. Metcalfe Jr. is the chairman of the Board of Directors of the Federal Reserve Bank of St. Louis and chairman of the law firm BryanCave LLP.
Federal Reserve Bank of St. Louis Regional Economic Development, 2006, 2(1), pp. 1-3.© 2006, The Federal Reserve Bank of St. Louis. Articles may be reprinted, reproduced, published, distributed, displayed, and transmitted intheir entirety if copyright notice, author name(s), and full citation are included. Abstracts, synopses, and other derivative works may be madeonly with prior written permission of the Federal Reserve Bank of St. Louis.

an enlightened citizenry is indispensable for theproper functioning of the republic. “Self-governmentis not possible unless the citizens are educatedsufficiently to enable them to exercise oversight.It is therefore imperative that the nation see to itthat a suitable education be provided for all itscitizens.” Leadership today continues to acceptthis ideal.
The state constitution of Missouri, Article IX,Section 1(a), provides such a commitment:
A general diffusion of knowledge and intelli-gence being essential to the preservation of therights and liberties of the people, the generalassembly shall establish and maintain free publicschools for the gratuitous instruction of all per-sons in this state within ages not in excess of21 years as prescribed by law.
Going beyond a responsible citizenry, EricHanushek and Margaret Raymond underscore thepowerful economic effects of quality schoolingby observing that the entire national cost of K-12public education could be paid for by a one-standard-deviation increase in student achieve-ment; such an improvement would translate intohigher annual earnings and productivity gains andthereby increase gross domestic product. That is,the growth dividend would make schooling free.Clearly, improving scholastic achievement is in ournational interest for civic and economic reasons.
So, then, how much does money matter? Thelitigation and the debate over linkages betweenmonetary input and educational outcome has beenaddressed often in research studies and academicconferences, and the level of linkage is consistentlybrought before the legislatures and the courts.Virtually everyone concedes that there is somelevel of spending required; however, additionalspending does not generally yield large marginalgains in student achievement. Researchers concludethat the evidence shows student performance doesnot necessarily correlate with expenditures perstudent, so state strategies aimed principally atequalizing financial inputs are limited in the degreeto which they can address disparity and inequity.
What next? In the 1960s it was concluded thatstudent achievement is more dependent on nonfi-nancial inputs than financial inputs. The nonfinan-cial inputs often cited publicly include a lack of
parental involvement, problems in a student’s homelife and upbringing, and a student’s lack of interestand motivation as the most important reasons forthe disparity between the achievement levels ofstudents in relatively wealthy areas and those inpoor areas. This argument holds that schools havelittle influence over these nonfinancial inputs.Others, such as those involved in the Teach ForAmerica corps, disagree, saying the key to closingthat gap is to train and employ better teachers andimprove the quality of the administrators. Theyargue that by rebuilding schools and school systemsat the leadership level, changing the means of pro-moting teachers, and ensuring that high expecta-tions and standards are set for all students, theachievement gap will be closed. This argumentholds that schools should control these nonfinan-cial inputs.
Others suggest different means of intervention.Vouchers and tax credits have been promoted.House Bill 1783, currently being debated in theMissouri legislature, would allow individuals andcorporations to contribute money to organizationsthat provide educational scholarships to eligiblestudents in the St. Louis, Kansas City, and Wellstonschool districts to attend the public or non-publicschool of their parent’s choice. The proposed leg-islation is being opposed vigorously by such organ-izations as the Missouri School Boards’ Associationand the Missouri Federation of Teachers, who, inpart, take the position that there is no “unbiased”empirical evidence that tuition scholarship taxcredit programs improve student achievement. Onthe other hand, two studies by Harvard researchers,one by Caroline Hoxby and another by RajashriChakrabarti, show that as a voucher programexpanded in Milwaukee, there was a markedimprovement in test scores at public schools mostthreatened by the program, that is, the ones withlarge numbers of low-income students eligible forthe vouchers. Is there a good setting to understandthese differences?
The current Missouri debate on House Bill 1783,the relative value of other interventions to reduceoutcomes disparity, and other issues relating to aK-12 funding should be aired more often in thistype of symposium where economists speak innontechnical terms and educators and legislators
Metcalfe
2 VOLUME 2, NUMBER 1 2006 FEDERAL RESERVE BANK OF ST. LOUIS REGIONAL ECONOMIC DEVELOPMENT
meet outside the adversarial context of legislativedebate or the courtroom. The discipline and struc-ture of sound economic thought helps set the tablefor useful legislative and legal debate in Missouri.And in all debate and dialogue on these issues, itmust be stipulated that the student is the client—not the teacher, not the parent, not the administra-tor, not the school system. Learning from suchdialogue can be shared in the larger context of thequantity and quality of schooling without beinglimited by the bias of the location or relative sizeor relative wealth or population or demographicsof a particular district.
Metcalfe
FEDERAL RESERVE BANK OF ST. LOUIS REGIONAL ECONOMIC DEVELOPMENT VOLUME 1, NUMBER 1 2006 3

Editor’s Introduction
Thomas A. Garrett
such as teacher salaries, expenditures for studentswith special needs, and meeting requirements setforth by the No Child Left Behind Act are still atthe forefront of the debate. Missouri is not alonein dealing with these issues, however—each stateacross the country shares in these challenges.
On November 4, 2005, the Federal ReserveBank of St. Louis cohosted, with the WeidenbaumCenter on the Economy, Government, and PublicPolicy at Washington University in St. Louis, aone-day symposium on public education finance:“Challenges to Public Education Financing FacingMissouri and the Nation.” The purpose of thesymposium was to provide attendees with a non-technical description of the major issues surround-ing school finance in Missouri and the nation.1
To provide diversity of views and experiences, thesymposium brought together nationally recognizedacademic scholars, state lawmakers, and publicschool officials. The symposium format consistedof presentations by academic scholars as well asseveral panel sessions involving school officials andstate lawmakers. This issue of Regional EconomicDevelopment contains the proceedings from thesymposium.
ALTERNATIVE EDUCATIONFINANCE STRATEGIES
In the first paper of the symposium, ThomasNechyba discusses two broad education finance
O n June 29, 2005, the governor ofMissouri signed into law Senate Bill287 (SB287), which dramaticallychanged the way elementary and
secondary public education is funded in the stateof Missouri. Prior to the new law, the educationfinance formula in Missouri was a tax rate–drivenformula: School districts that levied identicalproperty tax rates would receive the same level ofstate funding. Disparities in school district wealth(and thus property tax revenue) would be offsetwith additional state funding. Over time, however,soaring property values in higher-income districtsrelative to lower-income districts and weakeningstate fiscal conditions placed pressure on this taxrate–driven formula. In addition, several lawsuitswere filed that claimed the tax rate–driven formulawas unconstitutional because it did not provide anadequate level of funding for low-income, arguablyhigher-need, school districts. SB287 moved schoolfinance in Missouri from a system based on fairness(in terms of equal tax rates) to a system based onadequacy. Specifically, the new law provides aminimum level of spending to all districts ($6,117per student) and establishes that the state has theresponsibility to ensure that all districts meet thisminimum level of per-student expenditure,regardless of district tax effort.
Despite the new law, there is still much publicand political debate over education finance inMissouri. Because SB287 will require, accordingto some estimates, roughly $900 million in addi-tional state spending over the next several years,the question of affordability arises. Other issues
1 More information on the symposium can be found athttp://research.stlouisfed.org/conferences/challengesconf/index.html.
Thomas A. Garrett is a research officer at the Federal Reserve Bank of St. Louis.
Federal Reserve Bank of St. Louis Regional Economic Development, 2006, 2(1), pp. 4-6.© 2006, The Federal Reserve Bank of St. Louis. Articles may be reprinted, reproduced, published, distributed, displayed, and transmitted intheir entirety if copyright notice, author name(s), and full citation are included. Abstracts, synopses, and other derivative works may be madeonly with prior written permission of the Federal Reserve Bank of St. Louis.
4 VOLUME 2, NUMBER 1 2006 FEDERAL RESERVE BANK OF ST. LOUIS REGIONAL ECONOMIC DEVELOPMENT

strategies: (i) traditional strategies that providestate funds to local districts and (ii) strategies thatprovide funds directly to parents. Nechyba arguesthat because traditional school expenditures aretied to local property values, this “pricing” of publicschools often segregates students based on incomeand nonfinancial characteristics, such as studentquality and home life. Thus, Nechyba argues thatthis latter strategy, while often ignored in the policydebate, is crucial because traditional strategiesalone cannot correct for the unequal distributionof nonfinancial inputs across school districts.
Nechyba provides evidence that suggests thateven if state financing completely equalized per-student expenditures across districts, unequal edu-cational opportunities would still exist as a resultof nonrandom sorting of nonfinancial inputs. Themain point stressed by Nechyba is that the intro-duction of choice can eliminate some or all of theunequal distribution of nonfinancial inputs acrossschools. The predominant means of introducingchoice is through private school voucher programsor grants that give parents and students a choicein where students attend school. Nechyba arguesthat a careful design of public school voucherscould also increase public school quality throughgreater competition. However, Nechyba is correct inpointing out that vouchers or grants are not with-out potential problems, each of which must becarefully considered before formulating new policy.
In his discussion, Ross Rubenstein points outseveral critical issues raised by Nechyba. First,school finance has focused predominately on ensur-ing adequate or equal resources across all districts.However, evidence suggests that there exist largeinterdistrict differences in resources and studentand teacher quality. Thus, school finance policiesand formulas should also focus on addressing theseinterdistrict differences. Second, although thereexist numerous state and federal grant programs andtax credits that provide more choice to students inhigher education, such programs for K-12 educa-tion are often vilified. Rubenstein argues that K-12policy officials could learn important lessons fromthe design of higher education financing programs.Finally, Rubenstein discusses several problemsthat may arise from vouchers or grant programs.
Equal grants to all parents may dissuade schooldistricts from enrolling the students who are mostcostly to educate, thus leaving special needs stu-dents more isolated. Unequal grants raise thequestion of which families should receive morefunding and which should receive less. In addition,determining the appropriate level of grant fundingfor each family poses a difficult challenge.
K-12 PUBLIC SCHOOL FINANCEIN MISSOURI
Michael Podgursky and Matthew Springerprovide a historical perspective of public schoolfinance in Missouri. They first discuss previouseducation finance formulas and laws in Missouri.In particular, they discuss the details of the schoolfinance formula that existed prior to SB287. Theythen present statistics on student quality and dis-trict expenditures per student, for school districtsboth in Missouri and across the United States. Fromthis data analysis, Podgursky and Springer concludethat expenditures per student in Missouri are veryclose to the national average.
Podgursky and Springer also compare fundingunder SB287 with funding under past formulas.SB287 states that there is a minimal, or “adequate,”level of funding required to educate a student andit is the state’s responsibility to ensure that eachdistrict spends this minimal level for each student.Podgursky and Springer also discuss several otherchanges that occurred with SB287, such as cost-of-living adjustments and modifications based onstudent poverty thresholds. Their paper concludeswith a general concern for the new adequacy-basedsystem. Specifically, the new formula under SB287implies that student funding and performance arelinked. That is, because there is a direct link betweenexpenditures and performance, school officialscan thus chose a level of student achievement andmeasure the level of spending needed to reach thatlevel of achievement. As Podgursky and Springerpoint out, however, research has not established adefinitive relationship between spending and stu-dent performance, and their analysis of data fromMissouri school districts reveals no relationshipbetween spending and student performance.
Garrett
FEDERAL RESERVE BANK OF ST. LOUIS REGIONAL ECONOMIC DEVELOPMENT VOLUME 1, NUMBER 1 2006 5

SCHOOL ACCOUNTABILITY ANDSTUDENT PERFORMANCE
Eric Hanushek and Margaret Raymond presenta nontechnical overview of research on stateaccountability of public education performance.One objective of their paper is to predict the likelyeffects of the No Child Left Behind Act. They usestatistics to highlight the importance of accounta-bility and show a positive relationship betweenthe human capital (e.g., education and skills) ofan individual and his or her earnings. After estab-lishing that schooling does matter, they cite previousresearch and present statistics, both national andinternational, that reveal there is little relationshipbetween expenditures per student and studentquality. Given this lack of evidence between levelsof funding and quality, Hanushek and Raymondargue that student quality can improve only as aresult of increased accountability.
Hanushek and Raymond provide a generaldescription of accountability systems, includingtwo important components of such systems: (i) con-sistent performance measures and (ii) consequences(e.g., reduced funding) for unacceptable perform-ance that are similar across districts. Hanushek andRaymond argue that both components must exist.To support their argument, they present data thatsuggest that states with stronger consequencesfor poor student performance had much greaterimprovements in student quality. Hanushek andRaymond conclude with an overview of howaccountability systems should be designed.
In his discussion, Steven Rivkin raises severalimportant issues concerning the interpretation ofthe relationship between earnings and school qual-ity, such as measurement error and accounting forinherent student characteristics, including workeffort and talent. Rivkin argues that any accounta-bility system must measure quality or quality gainedrather than simply the skills students bring intothe classroom. He also suggests that the strongrelationship between accountability systems andachievement might not be reflective of the averagestudent because state achievement tests focus onless-advanced skills, thus making it more likelythat the tests predominately capture quality changesin students from lower-income districts.
COMMENTARYIn addition to the three academic papers, two
panel sessions were also held during the sympo-sium. Four superintendents from Missouri publicschools, two from rural districts and two from urbandistricts, participated in the first panel session.Several of the superintendents discussed howSB287 will affect their district; others offeredtheir opinions on how public education should befinanced in Missouri. Comments from two of thesuperintendents are printed in this volume.
The last session of the day consisted of a panelof Missouri state legislators and a representativefrom the governor’s office. Two Democratic legis-lators, two Republican legislators, and an officialfrom the Missouri Department of Elementary andSecondary Education (DESE) offered their viewson education finance in Missouri. The panel sessionprovided the audience an opportunity to under-stand the highly political nature of educationfinance in Missouri. Statements from two of thelegislators as well as the DESE official are providedin this volume.
ACKNOWLEDGMENTSI thank the authors, discussants, and panelists
who helped put this conference volume together,as well as the managing editor, George Fortier, andhis staff, Lydia Johnson and Donna Stiller, for theirfine work on this issue of the journal. I also thankthe Weidenbaum Center at Washington Universityin St. Louis for their professional partnership inorganizing this event. A special thanks to MelindaWarren at the Weidenbaum Center for her hardwork and careful attention to detail.
Garrett
6 VOLUME 2, NUMBER 1 2006 FEDERAL RESERVE BANK OF ST. LOUIS REGIONAL ECONOMIC DEVELOPMENT
FEDERAL RESERVE BANK OF ST. LOUIS REGIONAL ECONOMIC DEVELOPMENT VOLUME 2, NUMBER 1 2006 7
Alternative Education Finance Strategies
Thomas J. Nechyba
argue that, while unequal funding is part of thestory, a deeper underlying root cause for the currentinequities arises from the fact that public schools—just like private schools—are “priced.” For publicschools, such pricing emerges through housingmarkets that fundamentally limit choice dispro-portionately for disadvantaged families who, asa result, end up in the worst public schools. The“quasi-public” nature of public schools thatemerges from this pricing then implies unequaldistributions of nonfinancial inputs into publicschools—implying that equalization of financialresources cannot be expected to result in equal-ization of educational opportunities.
State finance strategies that are aimed mainlyat equalizing financial inputs into public schoolsare thus limited in the degree to which they canaddress the root causes of inequities in publicschool systems. Using a model developed over thepast decade and calibrated to real-world data, Iwill argue that such strategies do not fundamentally
E ducation finance policies affect theincentives of a variety of different indi-viduals, which implies that a thoroughanalysis of trade-offs faced by policy-
makers must be rooted in an understanding of howindividual responses to incentives shape policyoutcomes. In this paper, I will consider two broadcategories of state finance strategies: traditionalstrategies based on providing state aid to localpublic school districts and more recent strategiesbased on providing aid directly to parents. Under-standing the potential impacts of these differentstrategies must first and foremost be based on arealistic assessment of the economic forces thatshape our current mix of public and private schoolsystems. Although the large inequities within thepublic system in the United States are widelyrecognized, the underlying root causes are oftencaricatured as deriving primarily from unequallevels of financing of public schools due to exces-sive reliance on local sources of funding. I will
Differences in the formulas states use to fund education account for some of the equity issues ineducation finance. But the implicit pricing of public school access through housing markets playsa much larger role by rationing valuable nonfinancial inputs into schools that are disproportionatelyattended by children from higher-income households. This paper then considers two broad cate-gories of state finance policies: those that channel funds to traditional local public schools andthose that instead channel such funds to parents or school entrepreneurs. Both types of policiescan be targeted in various ways to address equity concerns related to financial school inputs, butthe latter allows for a greater severing of the link between school access and housing markets andthus opens a way for addressing inequities in nonfinancial input allocations. The paper concludesthat state policies should aim at a greater balance between the two types of state aid.
Federal Reserve Bank of St. Louis Regional Economic Development, 2006, 2(1), pp. 7-27.
Thomas J. Nechyba is the Fuchsberg-Levine Family Professor of Economics at Duke University and a research associate at the National Bureauof Economic Research.
© 2006, The Federal Reserve Bank of St. Louis. Articles may be reprinted, reproduced, published, distributed, displayed, and transmitted intheir entirety if copyright notice, author name(s), and full citation are included. Abstracts, synopses, and other derivative works may be madeonly with prior written permission of the Federal Reserve Bank of St. Louis.

alter the distribution of nonfinancial inputs, whichare rationed by housing markets that produce sys-tematically different levels of nonfinancial inputsin different public school districts and neighbor-hoods by “bundling” school and housing choices.State finance strategies that aim aid directly atparents have the potential to “unbundle” housingand schooling decisions—thus addressing theroot cause of inequities more directly through theintroduction of choice for disadvantaged families.Although such strategies unambiguously result ina reduction in residential segregation, the degreeto which they produce greater educational oppor-tunities depends on assumptions one makes regard-ing the nature of private school competition—andthe way in which such strategies are targeted anddesigned. The potential of such strategies to addressroot causes of current inequities more directly, how-ever, implies that future reforms of state financingof education will likely have to involve a greaterbalance between strategies that target aid to schoolsand strategies that target aid to parents. Such reformhas the potential to not only help increase educa-tional opportunities but also address some of thefiscal challenges of urban areas in some parts ofthe United States.
Section 1 begins with an overview of some ofthe central challenges faced by education financepolicymakers, suggesting that close attention tohow policy affects the distribution of householdsacross schools is central to sound education policy.Section 2 then provides a conceptual overview ofthe economic root causes of inequities in publiceducation, drawing in part on previous simulationwork to determine the magnitudes of competingeffects. In Section 3, I discuss the potential fortraditional school finance strategies to narrowinequities within the public system while main-taining incentives for efficient decisionmaking.Section 4 proposes a conceptually different wayof thinking about state education finance policy,focusing state aid more directly on parents ratherthan school districts. Finally, Section 5 concludeswith some thoughts on how education financepolicy might benefit both schools and cities if thealternative strategies discussed in the previoustwo sections were applied in a more balanced way.
THE COMPLEXITIES OF EDUCATION FINANCE POLICY
Education policy unfolds within a complexeconomic environment in which multiple actorsmake choices that shape the observable outcomesof policy. Some of these actors are directly or inten-tionally affected by the incentives contained inthe policy and others are only indirectly and oftenunintentionally affected. Predicting the outcomeof policy changes must therefore involve an analysisof how changing incentives aggregate, moving theeconomic environment from its pre-interventionequilibrium to a new equilibrium in which allactors do the best they can given their changedcircumstances. Much of what makes educationpolicy challenging, then, derives from the multiplechannels through which changes in behavior mayinfluence the ultimate outcomes we observe.
Whose Behavior Might Change?
It is natural to think first of those individualsin the economy who are directly affected by changesin education finance policies.
Local governments and school officials (includ-ing teachers), for instance, pay close attention tothe ways in which higher-level governments struc-ture aid, with increasing empirical evidence sug-gesting responses to even small changes in policy.1
Their motivation derives in part from local voterpreferences and in part from incentives within localbureaucracies that favor “gaming” the system tomaximize revenue.
Local voters may also internalize policychanges, extending greater or less support to localschools depending on incentives contained withinschool finance formulas. Some voters—in particular,those with children—might pay close attention tohow their voting choices affect local public schools,while others might be more concerned about theimpact of such changes on local property values.Among the latter, renters face different incentivesthan homeowners, with homeowners concerned
Nechyba
8 VOLUME 2, NUMBER 1 2006 FEDERAL RESERVE BANK OF ST. LOUIS REGIONAL ECONOMIC DEVELOPMENT
1 Various recent empirical papers suggest that school officials responddirectly to changing incentives in both financing and accountabilityrules. See, for instance, Cullen (2003), Cullen and Reback (2002),Figlio and Winicki (forthcoming), Figlio and Getzler (2002), Jacob(2005), and Jacob and Levitt (2003).

about protecting their wealth, which is typicallyconcentrated disproportionately in their housinginvestments.2
In addition, parents face choices within a localeconomy—ranging from whether to send childrento public or private schools, whether to live in“better” or “worse” school or neighborhood districtswithin the local economy, and how much effort toput into monitoring local schools and investing intheir children’s education at home.3 And childrenthemselves may change their behavior dependingon how school policy affects their peer environmentand their parents’ level of involvement.4
School entrepreneurs, both inside and outsidethe public system, determine how much effort toinvest in employing innovative new strategies andwhether or not to set up new private, charter, ormagnet schools.5 School policy might even impacthow land developers and landlords determinewhere to build new housing and whether to investin renovating older housing within a local econ-omy—all depending on how school policy affectsdemand for different types of housing in differentareas.
The Need for Non-Price Rationing inSchool Markets
In equilibrium, all of these actors seek to dothe best they can, given what others are doing andhow others’ behavior affects their own economiccircumstances. In the end, something determineswhich students end up in which school, whichteachers teach in which classrooms, what resourcesteachers and school officials have available to them,
and how this translates to the delivery of schoolservices to different households. This point is farfrom trivial. In a typical economic market—say, forinstance, the car market—the equilibrium rationingmechanism is straightforwardly governed by marketprices. Individuals who like expensive cars andhave the resources to buy them end up with expen-sive cars, whereas those who place less value oncar services and those whose resources are morelimited end up with lower-end car models. Asconditions affecting the car market change—forinstance, as gasoline prices increase or as govern-ments introduce different forms of environmentalregulations—prices adjust as both demand andsupply for different car models change. A newequilibrium then emerges with potentially differentallocations of cars to individuals—all rationed bythe price mechanism.
School policy is challenging in large partbecause the rationing mechanisms are more subtlethan they are in car markets. Public schools arenominally “free” in the sense that no tuition pricesgovern who has access to such schools. If this werethe end of the story, public school quality wouldhave to equalize across all public schools as noparent—regardless of how much or how little shevalues school quality—would ever choose an infe-rior school. Public school quality in the real worldis not, of course, equal across all schools, whichmust mean that there exist other non-tuition ration-ing mechanisms that cause some parents to end upsending their children to bad public schools whileothers send their children to good public schools.Similarly, teacher salaries are often controlled byrigid salary scales—implying that there must existnon-wage rationing mechanisms that determinewhere good teachers and bad teachers end upwithin the public system. In private school markets,more explicit price rationing is possible as privateschools set private school tuitions. But such schoolsmight supplement price rationing with other mech-anisms, using, for instance, admissions policies toscreen applicants.
Similar non-market factors play a role in deter-mining what level of financial resources differentschools have available to them. In car markets, thelevel of investment undertaken by car manufac-turers is determined by profit considerations, with
Nechyba
FEDERAL RESERVE BANK OF ST. LOUIS REGIONAL ECONOMIC DEVELOPMENT VOLUME 2, NUMBER 1 2006 9
2 Recent work on voting in California suggests the importance ofproperty value considerations for homeowners (Brunner, Thayer,and Sonstelie, 2001; Brunner and Sonstelie, 2003). Fischel (2001)provides a broad overview of the connection between home valuesand local government behavior.
3 The evidence on parental choices about schools is most rooted in along empirical literature (starting with Oates, 1969) documentingthe capitalization of school quality into property values.
4 Harris (1998) documents a substantial psychology literature suggest-ing such peer influences, and Cooley (2005) models such peer-relatedbehavioral changes in an empirical framework.
5 Private school markets have demonstrated an ability to respondrelatively quickly to changes in economic circumstances, as evidenced(for instance) by the quick emergence of new private schools inCalifornia in the late 1970s (Downes and Greenstein, 1996).
manufacturers considering whether additionalinvestments in improving cars will result in moreor less profit given what they know about consumerdemand. Funding for public schools, on the otherhand, is driven by political markets, with votersand interest groups ultimately determining howmuch is invested where—and with the set of votersdetermined by decisions made in housing markets.Private schools must operate more like car manu-facturers in that they can afford additional invest-ments in schools only to the extent to which parents(or charitable contributors) are willing to pay forsuch investments.
The Role of Equilibrium Non-PriceRationing
Ultimately, whether governed by market pricesor non-price mechanisms, an equilibrium is char-acterized by supply equaling demand in schoolmarkets and housing markets—and by voter prefer-ences being aggregated through some voting mech-anism. But the process by which supply becomesequal to demand is crucial for understanding howpolicy can affect equilibrium outcomes.
I will argue that, in most U.S. contexts, themost important rationing mechanism within thepublic system is generated by the close link ofhousing and school markets. Typically, the rightto access a particular public school is given to thosewho reside within politically drawn geographicboundaries that define attendance zones associatedwith each public school. If I want my child to accesspublic school A, the best way to ensure such accessis by purchasing or renting a residence within theattendance zone of that school. Over three decadesof empirical work has now conclusively establishedthat housing markets then “price” such access.6
Put differently, the “price” of attending a particularpublic school is incorporated into the cost of hous-ing. Good schools are associated with considerably“inflated” housing prices, while bad schools areassociated with “depressed” housing prices. In anygiven distribution of housing quality across schoolattendance zones, the housing market substitutes
for a public school tuition market by pricing or“rationing” access to most public schools.
In addition, it is important to recognize thathousing quality is not randomly distributed acrossschool attendance zones. Even if that were the case,housing price differences would ration access toschools. But, in addition, the distribution of housingwithin local economies arises not only from marketforces but also from a combination of political fac-tors that govern both the drawing of attendancezone boundaries and zoning regulations that setminimum housing quality in different neighbor-hoods. As a result, good public schools tend toreside within attendance zones in which there existdisproportionately high levels of high-qualityhousing; moreover, all housing prices in that zoneare higher than prices for equivalent-quality hous-ing in attendance zones with bad public schools.The combination of housing price differentials forequal quality housing and differences in housingquality distributions then rations who will attendwhich school within the public system.
This rationing mechanism is sometimes supple-mented by other forms of rationing. Charter andmagnet schools, for instance, are often not as explic-itly linked to geographic attendance zones—withsome form of lottery system or merit-based admis-sions resolving instances of excess demand. In some“open enrollment” districts, attendance zones grantimmediate rights of access to particular schools butparents may apply to attend schools outside theirattendance zone conditional on available spacewithin the school of interest. In such instances,commuting costs to schools as well as lottery sys-tems that ration limited space in desirable schoolsmight ration who transfers out of their local atten-dance zone. And private schools, as already noted,may combine explicit price rationing throughtuition policies with other forms of screeningmechanisms of applicants.
The labor markets for teachers and other schoolofficials are subject to similar rationing considera-tions. To the extent to which wage differencesacross schools are constrained by government orunion policies, again something else determineswhere teachers are assigned. Within a large publicschool district, for instance, good teachers may becompensated not by disproportionately high wages
Nechyba
10 VOLUME 2, NUMBER 1 2006 FEDERAL RESERVE BANK OF ST. LOUIS REGIONAL ECONOMIC DEVELOPMENT
6 This work began with Oates (1969) and is summarized in Epple andNechyba (2004).

but rather by “better” assignments to schools andclasses with fewer challenges.7 Even within schools,quality differences between teachers or tracksrequire some rationing mechanism that allocatesstudents to classrooms.
Implications of Rationing for “PeerQuality” Inputs to School Quality
The reason why the “rationing” mechanism ofstudents into schools and teachers into classroomsis so important is that it has direct implicationsfor the nonfinancial set of inputs into school pro-duction that I will broadly call “peer inputs.” Bypeer inputs, I mean any nonfinancial input that hassome correlation to characteristics of households.Peers themselves may affect each other’s educa-tional experience—implying that nonrandomassignment of peers into schools will result in dif-ferent school qualities even if all financial inputsare identical. Similarly, the nonrandom selectionof parents into schools is likely to have an impacton school quality, with some parents providinggreater human capital at home and paying system-atically more attention to monitoring what happensin schools and disciplining how school resourcesare used. And teacher assignments are likely tofavor children whose parents monitor schools moreclosely and whose children are viewed as “easier”to educate. The characteristics of households thatattend a particular school may therefore shapeschool quality through multiple channels, and therationing mechanism used to allocate householdsto schools determines the quality of nonfinancialinputs.
QUASI-PUBLIC AND PRIVATESCHOOLS WITHIN A LOCALECONOMY
Public schools are often held up as an idealthat delivers equal opportunity to quality educa-tion for all children while internalizing importantsocietal goals that would be absent in a privateschool system. Since access to private schools ispriced, it is natural to assume that purely private
school markets would exhibit segregation by eco-nomic class (and potentially by race to the extentto which class correlates with race and the extentto which parents have preferences biased againstparticular racial or ethnic groups). The publicschool ideal holds out the hope that this can beavoided through publicly funded “free” schoolsthat admit all. Furthermore, schools may performimportant functions, such as building respect fordiversity that forms the foundation for a more har-moniously functioning political climate whenchildren become voters. However, even parentswho care about living in a well-functioning societymay discount this role of schools for their particularchildren in favor of emphasizing the building ofmarketable human capital that can more directlybenefit their children. Private schools, it is argued,therefore do not have sufficient incentive to inter-nalize these larger societal goals, whereas the publicschool ideal holds out hope that it can, throughthe political process, accomplish such goals moreeffectively.
Although it is difficult to quarrel with thepublic school ideal of equal opportunity for all andan appropriate internalization of societal aims, it iscrucial to recognize that the structure of the publicsystem in the United States is in many ways set upmuch more like a private system; thus, the publicsystem is far from being optimally positioned toimplement the public school ideal. It is thereforeworthwhile to consider briefly how the publicsystem in the United States might more aptly becharacterized as a quasi-public system that containsthe element of taxpayer financing shared with apublic system but also the pricing or rationingmechanism of a private system that does notexplicitly aim for the public school ideal.
Quasi-Pricing of Public Schools andInequities in Public Education
It is no secret that public school quality variesgreatly within local economies, with public schoolquality directly related to the income of parents—and with most states having experienced legalchallenges to public school financing systems as aresult. Because legal challenges have been basedlargely on observed per-pupil spending differences,the policy discussion emerging from these court
Nechyba
FEDERAL RESERVE BANK OF ST. LOUIS REGIONAL ECONOMIC DEVELOPMENT VOLUME 2, NUMBER 1 2006 11
7 See, for instance, Loeb and Page (2000).

cases has focused primarily on the role of localfinancing of public schools.
It is certainly true that, to the extent to whichmarginal funding for schools comes from local taxbases, spending inequities across public schoolscan be linked directly to local funding. It does notfollow, however, that local funding of schools isthe only—or even the primary—reason for differ-ences in school quality. In fact, a long literature onthe role of financial resources in public educationhas cast doubt on the extent to which such fundingdifferences play a large role in undermining thepublic school ideal of equal opportunity for all.8
A fuller appreciation of the root causes ofinequities in public education emerges from a fullerappreciation of the role of quasi-public pricing ofschools. Suppose, for instance, schools were in factequally funded but inputs such as teacher and peer(and parental input) quality play a large role inshaping schools. Teacher-rationing mechanismsare likely to place good teachers in schools withstudents who have higher socioeconomic status(SES) (i.e., those viewed as “easier” to teach), andparents who have the resources to invest in theirchildren outside school and thus create positivepeer characteristics are likely to live in higher-income neighborhoods. Thus, multiple channelsexist through which public school quality differ-ences can emerge, even in the absence of fundingdifferences; and these quality differences will bepriced in housing markets as discussed in the pre-vious section. Differences in household income willthen lead to higher-income households enrollingtheir children in better public schools through thequasi-pricing in housing markets.
Inequities in public education may thereforearise in part from a history of local financing ofpublic schools, but increasing evidence suggeststhat it is primarily due to larger economic forceswithin urban and suburban economies that aretightly linked to differential access to schools andthe resulting nonrandom assignments of parents,students, and teachers, which in turn results inunequal levels of nonfinancial inputs. The quasi-pricing of public schools through housing marketsimplies that the very type of school segregation
feared under a private system is, at least to somedegree, present in the quasi-public system.
Private Schools in a Quasi-Public System
We can then think about the role played byprivate schools in local economies characterizedby quasi-public school systems. Recall that suchsystems lead to substantial distortions of prices inhousing markets—with a premium added to hous-ing prices in good school districts beyond housing(and neighborhood) characteristics, and an analo-gous reduction in housing prices in poor schooldistricts. For private schools, this opens a potentialcompetitive advantage over quasi-public schoolssince private schools do not ration access by draw-ing geographical attendance zones. In essence, thedistortions of housing prices arising from the quasi-public nature of public schools create incentivesfor private school entrepreneurs to open schools inareas with depressed housing prices (i.e., in poorerareas) because this will then permit parents to“unbundle” their housing choice from their schoolquality choice and take advantage of “bargains” inthe housing market.
Of course this unbundling is not the onlycompetitive advantage enjoyed by private schools.Private schools may be more “efficient” in the senseof producing more quality per dollar; they may beable to horizontally differentiate themselves byoffering different pedagogical approaches aimed atparticular types of students; and they may be ableto “cream skim” good peers from public schools andthus create “high peer quality” schools by rationingentry into the school by means other than tuitionpolicies (Nechyba, 2005). Regardless of which othercompetitive advantages such schools exploit, how-ever, the quasi-public nature of public schoolslinked to housing markets creates an incentive forprivate schools to emerge in lower-income areas—or at least areas where average income is below theaverage income of private school attendees.
Quasi-Public Schools, Private Schools,and Residential Segregation
While the quasi-pricing of public schoolsthrough housing markets therefore introduces asegregating force into local economies, the ability
Nechyba
12 VOLUME 2, NUMBER 1 2006 FEDERAL RESERVE BANK OF ST. LOUIS REGIONAL ECONOMIC DEVELOPMENT
8 See, for instance, Hanushek (1999).
of private schools to de-couple housing from school-ing choices introduces a desegregating force. Thisis not to say that such schools will necessarily be,in themselves, more integrated than public schools;rather, even if private schools appeal to a homoge-neous clientele and thus segregate certain types ofstudents coming from the quasi-public school sys-tem, this nevertheless reduces residential segrega-tion and with it the housing price dispersion createdby the link of housing to quasi-public schools.
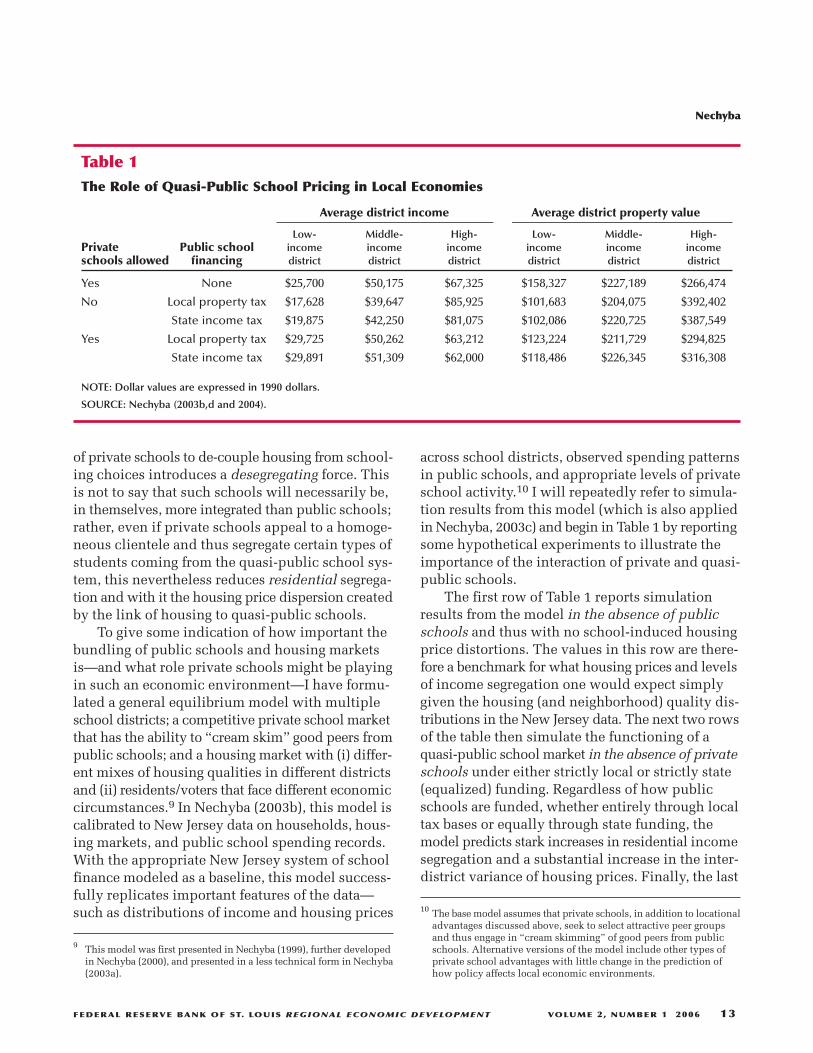
To give some indication of how important thebundling of public schools and housing marketsis—and what role private schools might be playingin such an economic environment—I have formu-lated a general equilibrium model with multipleschool districts; a competitive private school marketthat has the ability to “cream skim” good peers frompublic schools; and a housing market with (i) differ-ent mixes of housing qualities in different districtsand (ii) residents/voters that face different economiccircumstances.9 In Nechyba (2003b), this model iscalibrated to New Jersey data on households, hous-ing markets, and public school spending records.With the appropriate New Jersey system of schoolfinance modeled as a baseline, this model success-fully replicates important features of the data—such as distributions of income and housing prices
across school districts, observed spending patternsin public schools, and appropriate levels of privateschool activity.10 I will repeatedly refer to simula-tion results from this model (which is also appliedin Nechyba, 2003c) and begin in Table 1 by reportingsome hypothetical experiments to illustrate theimportance of the interaction of private and quasi-public schools.
The first row of Table 1 reports simulationresults from the model in the absence of publicschools and thus with no school-induced housingprice distortions. The values in this row are there-fore a benchmark for what housing prices and levelsof income segregation one would expect simplygiven the housing (and neighborhood) quality dis-tributions in the New Jersey data. The next two rowsof the table then simulate the functioning of aquasi-public school market in the absence of privateschools under either strictly local or strictly state(equalized) funding. Regardless of how publicschools are funded, whether entirely through localtax bases or equally through state funding, themodel predicts stark increases in residential incomesegregation and a substantial increase in the inter-district variance of housing prices. Finally, the last
Nechyba
FEDERAL RESERVE BANK OF ST. LOUIS REGIONAL ECONOMIC DEVELOPMENT VOLUME 2, NUMBER 1 2006 13
Table 1The Role of Quasi-Public School Pricing in Local Economies
Average district income Average district property value
Low- Middle- High- Low- Middle- High-Private Public school income income income income income income schools allowed financing district district district district district district
Yes None $25,700 $50,175 $67,325 $158,327 $227,189 $266,474
No Local property tax $17,628 $39,647 $85,925 $101,683 $204,075 $392,402
State income tax $19,875 $42,250 $81,075 $102,086 $220,725 $387,549
Yes Local property tax $29,725 $50,262 $63,212 $123,224 $211,729 $294,825
State income tax $29,891 $51,309 $62,000 $118,486 $226,345 $316,308
NOTE: Dollar values are expressed in 1990 dollars.
SOURCE: Nechyba (2003b,d and 2004).
9 This model was first presented in Nechyba (1999), further developedin Nechyba (2000), and presented in a less technical form in Nechyba(2003a).
10 The base model assumes that private schools, in addition to locationaladvantages discussed above, seek to select attractive peer groupsand thus engage in “cream skimming” of good peers from publicschools. Alternative versions of the model include other types ofprivate school advantages with little change in the prediction ofhow policy affects local economic environments.

two rows of the table introduce private schoolmarkets into the quasi-public school environment.Although housing prices across districts still capi-talize local public school quality, housing valuesin poor districts rise as private schools allow resi-dents there to de-couple their housing and schoolingchoices. More remarkable, however, is the substan-tial narrowing of residential income segregationresulting from the introduction of a private schoolmarket, with less segregation than would exist werethere no school-induced price distortions at all (asin row 1). This effect is due to the fact that, giventhe negative capitalization of poor public schoolsinto housing values, households with childrenenrolled in private schools (whose income tendsto be larger than the average income of the poordistricts) have an added incentive to reside inhigher-quality housing within the poor district.
After providing this background of how quasi-public and private school markets interact, I amnow ready to discuss two conceptually differenttypes of school finance policies. The first, labeled“Strategy 1” in the next section, is aimed at achiev-ing greater funding equity within the quasi-publicsystem through differential aid based on localcharacteristics. The second, labeled “Strategy 2”in Section 4, instead aims aid directly at parentsto increase “choice,” particularly for those house-holds whose choices are limited given the quasi-public school rationing mechanism that is in place.
STRATEGY I: EQUALIZING PUBLICSCHOOL RESOURCES
The first broad category of school finance strate-gies is focused on finding ways of achieving greaterequity in terms of per-pupil resources within thequasi-public school sector. Most state policy debatesover the past few decades essentially are debatesabout the effectiveness of different ways of accom-plishing such equalization, with attempts to balancelocal discretion with state equity goals. The distin-guishing characteristic of this class of strategies isthat it tacitly assumes funding differences lie atthe base of observed inequities—and consequentlyfocuses on providing additional financial resourcesto financially disadvantaged schools.
Within this class of school finance strategies,one can distinguish between a variety of differentconceptual approaches. First, state aid may comein the form of block grants based on the underlyingcharacteristics of a school district, or it may comein the form of matching grants that depend onlocal tax effort, with the match rate determined bythe underlying characteristics of a school district.Second, state finance policies may or may not placelimits on the degree to which local districts cansupplement state aid through local revenues beyondsome predetermined amount. Put differently, akey feature of any combination of state financingstrategies is the extent to which marginal schoolfunding comes from state versus local sources.Finally, state aid to districts can vary in the degreeto which it is targeted to particular characteristicsof districts (such as low income).11
I begin with two extreme cases: pure local andpure state funding. Under local financing, eachdollar (including the marginal dollar) of spendingis derived from local tax bases, whereas under statefinancing each dollar (including the marginal dollar)comes from a statewide tax. Given that higher-income districts pay more in state taxes, state fund-ing implicitly transfers money from rich to poordistricts.
The Limits of Equalization: Pure Localversus Pure State Funding
If per-pupil spending were the only input thatmattered in education production, equalization ofspending through state funding would eliminateinequities. In the presence of other “peer” inputsinto education production, however, equalizationof per-pupil spending eliminates inequities onlyto the extent to which current inequities arise fromlocal and unequal financing. The challenge forpredicting the impact of state equalization is thento merge theory and data in a way that permits usto quantify the different channels through whichinequities are currently maintained within thepublic or quasi-public system.
The model first developed in Nechyba (1999)and extended in Nechyba (2000) and Ferreyra
Nechyba
14 VOLUME 2, NUMBER 1 2006 FEDERAL RESERVE BANK OF ST. LOUIS REGIONAL ECONOMIC DEVELOPMENT
11 See, for instance, Hoxby (2001) for empirical evidence on theimportance of these distinctions.
(2005) takes up this challenge by modeling schoolquality as a function of per-pupil financial resourcesand other factors broadly labeled as “peer effects.”As already noted earlier, by “peer effects” I meannot only the exogenous and endogenous effectspeers have on one another in a school or a class-room,12 but also other nonpriced inputs that arecorrelated with characteristics of peers. For instance,a student may be considered of “higher peer qual-ity” if she has parents that invest in the publicschool by monitoring school performance or if sheis the type of student who attracts good teachersin a system in which high-quality teachers areassigned to “better” classroom environments.
Within such a model, the structure of the modelthen has implications for how well private schoolscan compete with quasi-public schools and howhousing prices within a local economy evolve. Fornow, let us assume that the primary competitiveadvantage of private schools (aside from permittingan unbundling of school and housing choices)derives from their ability to “select” peer groups.If the school production technology assumed inthe model places “too much” weight on per-pupilfinancial resources, private schools then do not havea sufficient advantage to compete with quasi-publicschools and housing markets do not incorporateempirically plausible levels of school capitalization.If, on the other hand, the model places “too much”weight on peer effects, quasi-public schools cannotcompete with private schools—leading to an equi-librium dominated by empirically implausiblelevels of private school attendance.13 Thus, thestructure of a general theoretical model of quasi-public and private school markets—when matchedto important characteristics of the data—can placeappropriate weights on the role of per-pupil finan-cial resources and “peer effects.” Such weights maythen be interpreted as actual weights in the schoolproduction function or as the weights valued byparents as they evaluate school quality.
The empirically relevant versions of a theoreti-cal model of quasi-public and private schools thenplace substantial weight on both per-pupil resourcesand peer effects; and, because of the weight on peereffects, equalization of per-pupil resources is limitedto the extent that it can produce a substantial nar-rowing of public school inequities. Table 2 belowreports results from such a model that compares thebaseline result from the hybrid state/local systemin New Jersey to results from the radically differentchoices of pure local public school financing andequalized state financing, again within a versionof the model calibrated to be consistent with datafrom New Jersey.
The first row of the table illustrates the impactof the school financing formula used in the threesets of simulations: It shows that the per-pupil fund-ing under a purely local system is over twice ashigh in the wealthy district as in the poor district,with per-pupil funding under the state-financedsystem fully equalized and the New Jersey hybridsystem falling in between the extremes. The secondrow of the table, however, illustrates much lessdramatic effects of school financing on nonfinancialinputs (i.e., peer composition) within quasi-publicschools, resulting in a smaller narrowing of overallpublic school quality achieved through centraliza-tion of financing than one would expect from sim-ply per-pupil spending effects. In addition, averageper-pupil spending in the system falls under cen-tralized financing for political economy reasonsdescribed in the literature predating this work.14
This implies that, although centralization is pre-dicted to result in a narrowing of inequities withinthe public system, average school quality will sufferunder full equalization as fewer financial resourcesflow into the system.
Private school attendance changes in somewhatsubtle ways across the three systems, with themodel predicting an overall decline in privateschool attendance under centralized financing.15
Nechyba
FEDERAL RESERVE BANK OF ST. LOUIS REGIONAL ECONOMIC DEVELOPMENT VOLUME 2, NUMBER 1 2006 15
12 See Manski (1993) for the distinction between different types ofpeer effects and an exposition of the econometric difficulties ofidentifying them independently.
13 This result is due to the fact that the model assumes either that privateschools can select peers or that such schools have other competitiveadvantages discussed in more detail in Nechyba (2005).
14 Sontelie and Silva (1995) illustrate that average spending levels(under majority rule voting) depend approximately on mean stateincome under local financing and on median state income understate financing. Given the skewed nature of state income distributions(also reflected in the calibrated model on which Table 2 is based),this implies greater average spending under local financing.
15 This is discussed in detail in Nechyba (2003c).

Although the subtleties of how private schoolattendance changes across districts are not centralto the purpose of this paper, it is important to notethat the prediction that centralization results in adecline in private school attendance is somewhatat odds with the experience in California (which hascome closest to fully equalizing per-pupil spending),where private school attendance increased aftercentralization of public school financing. This sug-gests that, in the real world (but not in the model),centralization results in additional declines inpublic school quality that are not captured by thestructure of the model used here.
The main point of Table 2, however, is simplythat, because school quality is determined only inpart by per-pupil financial resources, there are limitsto what school finance equalization can achieveand trade-offs emerge between average quality andthe degree of inequity within the public system.The underlying economic forces that cause persist-ence of inequities even under full equalization canthen be found in the combination of (i) the impor-tance of nonfinancial inputs into education and(ii) the sorting of peers, parents, and teachers thatis implied by the quasi-public nature of publicschool markets linked to local housing markets.
Block Grants with and without LocalFunding
Most state finance systems contain elementsof local financing supplemented by elements ofstate financing provided through some form ofgrant system in which block or “lump sum” grantsmay play a role. Equalized state financing is anextreme version of a block grant system in whichlocal districts are not permitted to supplement statefunds from local revenue sources. Less extremeversions might be differentially targeted to poorerdistricts and might permit local jurisdictions tosupplement state funding through local tax sources.
The theory of block grants suggests that suchgrants—so long as they permit but do not requireadditional local financing—have little effect on per-pupil spending unless the block grants are suffi-ciently large to cause local districts to choose noadditional spending. This is because districts can“undo” block grants by reducing their local fundinglevels. A sufficiently large universal block grantsystem that provides the same amount per pupilto all districts will then have a differentially largeimpact in poor districts, whose spending levelswould be below the block grant level in the absence
Nechyba
16 VOLUME 2, NUMBER 1 2006 FEDERAL RESERVE BANK OF ST. LOUIS REGIONAL ECONOMIC DEVELOPMENT
Table 2The Limits of Equalization
Decentralized system Decentralized Centralized plus N.J. state formula local property tax state income tax
Low- Middle- High- Low- Middle- High- Low- Middle- High-income income income income income income income income income district district district district district district district district district
Per-pupil spending $6,652 $7,910 $8,621 $5,000 $7,326 $10,215 $7,195 $7,195 $7,195
Peer inputs 0.2684 0.4701 0.6521 0.2613 0.5142 0.6404 0.2826 0.5469 0.6470
School quality 0.4322 0.6178 0.7803 0.3674 0.6192 0.8183 0.4616 0.6316 0.6841
Average spending $7,753 $7,731 $7,195
Average quality 0.6152 0.6204 0.5960
District income $31,120 $46,216 $65,863 $29,725 $50,262 $63,212 $29,891 $51,309 $62,000
Property values $117,412 $205,629 $292,484 $123,224 $211,729 $294,825 $118,486 $226,345 $316,308
% Private 20% 22.5% 12.5% 30% 20% 10% 22.5% 17.5% 15%
NOTE: Dollar values are expressed in 1990 dollars.
SOURCE: Nechyba (2004).

of state financing.16 The empirical literature onblock grants, however, suggests that local politicalinstitutions tend to function in such a way that theydo not fully “undo” block grants by reducing localtax effort, implying that, although block grantshave the greatest marginal impact in districts thatwould spend below the block grant level in theabsence of intervention, such grants will have asignificant positive impact on local spending evenin districts where this is not the case.17
So long as block grants can be supplementedthrough local funds, it is unlikely that block grantsystems can result in a greater narrowing of publicschool quality than could be achieved by full stateequalization (which is equivalent to an equalizedblock grant system without allowing localities tosupplement state funding). Consider, for instance,the equalized state system in Table 2, a system inwhich the state provides a $7,195 per-pupil blockgrant to all quasi-public schools but prohibits addi-tional marginal funding from local sources. Thensuppose that that state maintains the block grantprogram but permits additional local funding. Ifthe state can indeed maintain the same per-pupilblock grant level, residents in the wealthiest districtwould choose to raise per-pupil funding by over$2,000 but no district would lower its funding.Given relatively little change in peer quality underthe two systems, this implies that school qualityrises in the wealthier districts but does not fall inpoorer districts when local funding is permittedto supplement state funding. Therefore, overallpublic school quality rises without quality fallingin any districts. To the extent to which the state’sgoal is to guarantee “adequacy” rather than “equity”of funding, this would suggest that permitting localjurisdictions to supplement state financing maybe attractive.
However, the conclusion that it is desirable toallow local jurisdictions to supplement state fund-ing may fail to hold if political forces can influencethe level of the per-pupil block grant. If local taxsources cannot be used to finance local schools,then parents in high-income districts have an incen-
tive to vote for large block grants even though onlya portion of their own tax payments will remainin their district. However, parents in wealthierdistricts would prefer to supplement the state blockgrants their district receives with local taxes, whichwould remain entirely within their local schools;the less attractive option for them would be to votefor high block grants funded by statewide taxes thatare paid disproportionately by the wealthy. Thus,the political equilibrium changes when local juris-dictions are permitted to supplement state funds—with less support for block grants from those whohave the high demand for public school spending.Consequently, public school spending in poorschools may erode when a policy of permittinglocal districts to supplement state funding is intro-duced into the state-equalized model shown inTable 2.
I am unaware of any serious modeling of thistrade-off and can therefore offer only a conjectureabout the degree to which political forces mightundermine a block grant system when local juris-dictions are able to supplement state funding. Instates with sufficiently strong judicial mandatesfor adequacy, such mandates impose a constrainton the degree to which higher-income householdscan vote to reduce block grants to rely more on localsources of revenues. When such mandates are suf-ficiently strong, one would expect that block grantsystems would be maintained even as local supple-ments to state funding are permitted. To the extentthat such mandates are not sufficiently strong,however, one might be concerned about allowinglocal jurisdictions to supplement state aid.
Matching Grants and District PowerEqualization
Many state finance formulas have features thatcan be modeled as matching grants—grants thatmatch local tax efforts in some relation to localeconomic conditions. Unlike block grants, matchinggrants affect per-pupil spending by reducing thetax price faced by local voters, giving rise to whateconomists refer to as powerful substitution effectsthat induce voters to make fundamentally differenttrade-offs—substituting away from other (privateand public) spending and toward school spending.District power equalization represents a system of
Nechyba
FEDERAL RESERVE BANK OF ST. LOUIS REGIONAL ECONOMIC DEVELOPMENT VOLUME 2, NUMBER 1 2006 17
16 Detailed simulation results are reported in Nechyba (2003c, 2004).
17 For an introduction to the literature on the “flypaper” effect, seeHines and Thaler (1995).

matching grants that sets matching rates in inverseproportion to local tax bases, giving larger tax pricesubsidies to poorer districts.
If matching grants are unrestricted, in thesense that there is no ceiling at which the matchdisappears, local jurisdictions will raise spendinguntil the marginal value of an additional dollar ofspending is equal to the amount that needs to beraised locally in order to generate a dollar of spend-ing. Put differently, the marginal value of spendingon schools will necessarily fall below the marginalcost. This raises clear efficiency concerns in lightof the fact that efficient spending requires that themarginal cost and benefit of spending are equal toone another. As a result, unrestricted matchinggrants result in inefficiently high levels of spendingunless there are externalities from spending onschools that are not taken into account by localvoters and governments.18 In the absence of suchexternalities, this suggests that matching ratesought to be zero on the margin.
This is not, however, an argument againstmatching grants—only against unrestricted match-ing grants. Programs like district power equalizationare motivated primarily by equity concerns thatarise from the fact that local tax bases in quasi-public school systems differ dramatically and thatequity or adequacy considerations can be addressedby essentially supplementing local tax efforts inpoorer districts with state matches. Put differently,equity concerns may trump efficiency concerns inthe design of matching aid.
A second consideration arises from the impactthe grants themselves have on property values.An extreme version of district power equalization,for instance, might impose positive match rates inpoorer districts and negative match rates in richerdistricts. In essence, such a system taxes local taxeffort in districts with high tax bases and subsidizeslocal tax effort in districts with low tax bases. Thiswill, however, necessarily imply that propertyvalues (and thus tax bases) in poor districts risewhile property values (and thus tax bases) in richerdistricts fall. As a result, the potential exists forsuch extreme forms of district power equalization
to result in a convergence of property values thatwill in part unravel the intent of subsidizing spend-ing in poor districts and taxing it in rich districts.The local public finance literature has not settled ona consistent view on how important this “unravel-ing” effect is; models such as the one used to gener-ate simulations in our previous tables suggestmodest effects, and some empirical evidence fromactual district power equalization programs suggestmuch larger effects.19
The price effects from matching grants (com-bined with effects on property values) also haveunderappreciated implications for how much dis-trict power equalization is necessary to equalizespending across districts. It might seem initiallyintuitive, for instance, that a district power equal-ization program aimed at equalizing per-pupilspending should set matching rates in such a wayas to allow every district to achieve the same levelof spending with the same local tax rate. Such aprogram could in principle involve positive match-ing rates for poor districts and negative matchingrates for rich districts, or it could involve positivematching rates for all districts, with disproportion-ately higher matches for poorer districts. In theformer case, the district power equalization programcan be revenue neutral by simply transferring fromrich to poor districts, whereas in the latter casethe program would have to be supplemented fromgeneral state revenue sources.
The intuition that such a system might lead toequality of per-pupil spending is, however, funda-mentally flawed. Although the same local tax ratewould result in the same level of spending, voterswith similar tastes will implement very differenttax rates in different districts because of the taxprice incentives of the system. Empirically basedsimulations suggest that full district power equal-ization would in fact result in an inverse relation-ship of spending and community income, withthe potential of large defections to private schoolsin rich districts.20 Thus, state finance policies using
19 This was suggested in simulations by Inman and Rubinfeld (1979),and Hoxby and Kuziemko (2004) provide evidence related to Texasdistrict power equalization. Nechyba (1996, 2004) suggests that,when housing markets are sufficiently settled, the effect might besmall in magnitude.
20 See, for instance, Feldstein (1975) and Nechyba (1996).
Nechyba
18 VOLUME 2, NUMBER 1 2006 FEDERAL RESERVE BANK OF ST. LOUIS REGIONAL ECONOMIC DEVELOPMENT
18 Such “externalities” would have to be of the type that creates spilloverbenefits across jurisdictions. These are treated in more detail inEpple and Nechyba (2004).

matching grants to try to achieve equality of spend-ing across districts require substantially less dra-matic district power equalization than our initialintuition might suggest.
Desirable Features of State FinancePolicies Aimed at Greater InterdistrictAdequacy or Equity
Our discussion of state finance approachesbegan by distinguishing three key features of suchapproaches: (i) the mix of block versus matchinggrant features of the approach, (ii) the degree towhich marginal spending derives from localsources, and (iii) the degree to which block ormatching features of the system are targeted tounderlying characteristics of local districts (suchas local tax bases). Pure (equalized) state financingcan be viewed as an extreme form of an equalizedblock grant that sets the local tax price for additionalspending at infinity. Foundation aid systems basedon block grants are less extreme in that they providedifferential per-pupil block grants while (usually)permitting local jurisdictions to supplement fund-ing from local tax sources, thus setting the marginaltax price to 1. District power equalization systems,on the other hand, rely on matching grants that, ifunrestricted, set marginal local tax prices above orbelow 1 depending on whether matching rates forparticular districts are positive or negative.
Efficiency considerations imply that marginallocal tax prices (in the absence of certain types ofexternalities) should be set to 1. Put differently, inthe absence of externalities, funding for schoolsshould come from local sources at the margin toprovide the right incentives for local voters andgovernments to ensure that the marginal valuefrom additional spending is equal to its marginalcost. This implies that equalized state financingas well as unrestricted matching aid formulas areinherently inefficient in the absence of externalitiesthat cross district boundaries.
Equity or adequacy considerations, however,imply that some form of state aid is necessary toensure less variance in per-pupil spending. Blockgrant programs can achieve this by setting a mini-mum (“adequate”) level of per-pupil spending thatis funded from state sources while permitting localjurisdictions to spend more from local sources at a
local tax price of 1. Matching grant programs canalso accomplish this so long as match rates are zeroat the margin. The price incentives of matchinggrants furthermore imply that, for any level ofstate expenditures, matching grant programs willinduce greater levels of spending than block grantprograms. Although the extent to which state aidprograms affect local property values in ways thatundermine the goals of adequacy or equity is stillin question, it is important that capitalization ofsuch policies into local property values become partof the general discussion of state aid programs ineducation. Finally, as suggested by our discussionof Table 2, it appears unlikely that state aid in anyform will have substantial impacts on nonfinancialinputs into schools—causing little change in the“peer quality” input that is associated with non-random sorting of households into districts.
STRATEGY 2: “UNBUNDLING”THROUGH CHOICE
As discussed in the previous section, the typicalstate strategy for addressing adequacy or equityconcerns in education is one that focuses on differ-ent ways of providing state aid to quasi-publicschool districts. Such strategies can be effective,as I have argued, at managing per-pupil spendingin local districts in ways that can help substantiallyreduce the variance of per-pupil spending acrossdistricts. Table 2, however, suggests that such poli-cies, even when fully equalizing per-pupil spending,encounter insurmountable difficulties in equaliz-ing educational opportunities because of nonran-dom sorting of nonfinancial inputs. And, as arguedin Section 2, these difficulties are rooted in thequasi-public nature of schools combined with theimportance of nonfinancial inputs into education(which I have broadly labeled “peer effects”). Putdifferently, the underlying economic forces withinlocal economies and housing markets combinedwith the nature of education production necessarilyresult in unequal quasi-public schools that limitopportunities for children from poorer households.
One possible response to this is to move statefinance systems beyond the goal of equalization ofper-pupil spending and to explicitly recognize in
Nechyba
FEDERAL RESERVE BANK OF ST. LOUIS REGIONAL ECONOMIC DEVELOPMENT VOLUME 2, NUMBER 1 2006 19
state aid programs that equality of opportunity inthe public school system necessitates per-pupilspending levels that are inversely related to localincome.21 Although such an approach might indeedresult in a narrowing of school quality beyondwhat is predicted from equalization, it is doubtfulthat such a system would ever be politically feasibleand stable or that higher-income parents wouldnot defect in large numbers to private schools undersuch a system.
A second response to the limits of equalizationis to fundamentally re-conceptualize the nature ofstate aid from a model that targets aid to districtsto one that targets aid to parents. The logic behindsuch a re-conceptualization arises directly fromthe quasi-public nature of public schools and theeconomic forces that inherently limit access toeducational opportunities along income lines. Asargued in Section 2, access to public schools is not“free” but is priced through housing markets andshaped by historically and politically driven atten-dance zones across housing markets. Higher-incomeparents have their “choice” of public schools dueto their ability to afford housing in all attendancezones, whereas lower-income parents have a sub-stantially narrower choice set. Similarly, higher-income parents have access to private schoolmarkets that is much more limited for lower-income parents, especially those judged as “lowpeer quality” by private schools. At a fundamentallevel, state aid to districts does not address therestriction of choice imposed on poorer parents—and thus does not address the root economic causeof inequities in quasi-public systems.
This section will therefore explore the impactof introducing choice, particularly for lower-income parents, into a system that has fundamen-tally restricted such choice. In principle, aid canbe channeled to parents in ways analogous to howit can be channeled to districts—in “block grants”through vouchers or tax credits, in “matching aid”through vouchers that require parental contribu-tions (in terms of time or money), or through taxdeductibility of private school tuition—in ways
that permit parents to supplement spending onthe margin or ways that prohibit such supplementalspending and restrict schools to accept the voucheras payment for tuition. The fundamental differencein this section is that I consider state aid to parentsrather than to school districts.
The “Unbundling” Effect of Aid toParents: Targeting to Households versusTargeting to Communities under PrivateSchool Cream Skimming
Our discussion of Table 1 has already suggestedthe potentially powerful (residentially) desegregat-ing forces introduced by the existence of privateschool markets in quasi-public school economies.The quasi-pricing of public schools, whichdepresses housing values in poor districts whileinflating them in rich districts, provides dramaticincentives for households at the margin that enrolltheir children in private schools to locate in rela-tively poorer school districts. The introduction ofaid to parents in the form of private school vouchers(or other types of choice programs that unbundleresidential and school decisions) then simplyenlarges the already desegregating impact of privateschools.
Employing the same computational model(calibrated to New Jersey) as in the previous tables,Table 3 then illustrates the predicted impact ofthree different types of vouchers. In each case, letus assume that parents are permitted to add to thevoucher amount as they pay private school tuition,and the voucher is given as a “block grant” to par-ents who use it to send their children to privateschools. The first third of the table assumes thateveryone is eligible for the voucher; the secondassumes that the voucher is restricted to thoseresiding in the poor district; and the third part ofthe table assumes the voucher is restricted to poorhouseholds (earning less than $25,000 per year).22
First, note that in the top portion of the table,vouchers are used primarily in the poor districtfor modest voucher amounts. Approximately one-third of the predicted effect arises from parentswho resided in the poor district prior to the intro-
22 For greater detail on the assumptions behind results in Table 3, seeNechyba (2003c, 2004).
Nechyba
20 VOLUME 2, NUMBER 1 2006 FEDERAL RESERVE BANK OF ST. LOUIS REGIONAL ECONOMIC DEVELOPMENT
21 The fact that equalization addresses primarily issues of fiscalcapacity but not those of fiscal need (which arises from the lowerlevel of nonfinancial inputs in disadvantaged communities) hasbeen understood for some time; see, for instance, Ladd (1976).
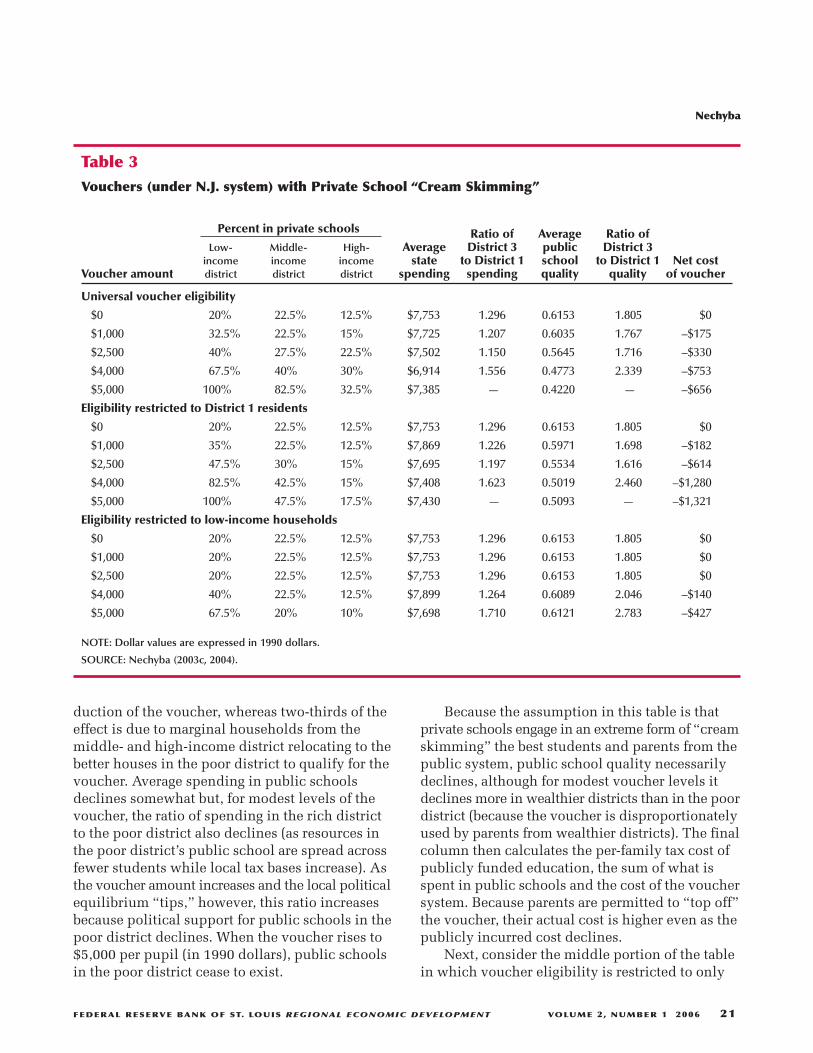
duction of the voucher, whereas two-thirds of theeffect is due to marginal households from themiddle- and high-income district relocating to thebetter houses in the poor district to qualify for thevoucher. Average spending in public schoolsdeclines somewhat but, for modest levels of thevoucher, the ratio of spending in the rich districtto the poor district also declines (as resources inthe poor district’s public school are spread acrossfewer students while local tax bases increase). Asthe voucher amount increases and the local politicalequilibrium “tips,” however, this ratio increasesbecause political support for public schools in thepoor district declines. When the voucher rises to$5,000 per pupil (in 1990 dollars), public schoolsin the poor district cease to exist.
Because the assumption in this table is thatprivate schools engage in an extreme form of “creamskimming” the best students and parents from thepublic system, public school quality necessarilydeclines, although for modest voucher levels itdeclines more in wealthier districts than in the poordistrict (because the voucher is disproportionatelyused by parents from wealthier districts). The finalcolumn then calculates the per-family tax cost ofpublicly funded education, the sum of what isspent in public schools and the cost of the vouchersystem. Because parents are permitted to “top off”the voucher, their actual cost is higher even as thepublicly incurred cost declines.
Next, consider the middle portion of the tablein which voucher eligibility is restricted to only
Nechyba
FEDERAL RESERVE BANK OF ST. LOUIS REGIONAL ECONOMIC DEVELOPMENT VOLUME 2, NUMBER 1 2006 21
Table 3Vouchers (under N.J. system) with Private School “Cream Skimming”
Percent in private schools Ratio of Average Ratio ofLow- Middle- High- Average District 3 public District 3
income income income state to District 1 school to District 1 Net cost Voucher amount district district district spending spending quality quality of voucher
Universal voucher eligibility
$0 20% 22.5% 12.5% $7,753 1.296 0.6153 1.805 $0
$1,000 32.5% 22.5% 15% $7,725 1.207 0.6035 1.767 –$175
$2,500 40% 27.5% 22.5% $7,502 1.150 0.5645 1.716 –$330
$4,000 67.5% 40% 30% $6,914 1.556 0.4773 2.339 –$753
$5,000 100% 82.5% 32.5% $7,385 — 0.4220 — –$656
Eligibility restricted to District 1 residents
$0 20% 22.5% 12.5% $7,753 1.296 0.6153 1.805 $0
$1,000 35% 22.5% 12.5% $7,869 1.226 0.5971 1.698 –$182
$2,500 47.5% 30% 15% $7,695 1.197 0.5534 1.616 –$614
$4,000 82.5% 42.5% 15% $7,408 1.623 0.5019 2.460 –$1,280
$5,000 100% 47.5% 17.5% $7,430 — 0.5093 — –$1,321
Eligibility restricted to low-income households
$0 20% 22.5% 12.5% $7,753 1.296 0.6153 1.805 $0
$1,000 20% 22.5% 12.5% $7,753 1.296 0.6153 1.805 $0
$2,500 20% 22.5% 12.5% $7,753 1.296 0.6153 1.805 $0
$4,000 40% 22.5% 12.5% $7,899 1.264 0.6089 2.046 –$140
$5,000 67.5% 20% 10% $7,698 1.710 0.6121 2.783 –$427
NOTE: Dollar values are expressed in 1990 dollars.
SOURCE: Nechyba (2003c, 2004).
those households that reside in the poorest district.Migration into the poor district by middle-incomehouseholds now increases, causing “take-up” ratesin the poor district to rise faster than in the top por-tion of the table. Because private schools attractclients mainly from this pool of new residents in thepoor district, public schools in the other districts areaffected primarily by the exit of high-quality peers,with overall spending in public schools changingless. Still, it is striking how similar the predictedeffects from a universally available voucher (in thetop portion of the table) are to those from a vouchertargeted solely at the poor district (in the middleportion of the table). The reason for this is that, evenwhen vouchers are universally available, those whotake up the voucher have a strong incentive to moveto housing in the poor district.
Finally, the lowest portion of the table considerstargeting to low-income families as opposed to tar-geting to low-income districts. The predicted impactof such targeting differs dramatically because itdoes not give rise to the residential mobility effectsthat arise in the first two portions of the table.Targeting to low-income parents thus requiresconsiderably higher voucher amounts for thevoucher to affect the system in a significant way.
The Importance of Assumptions aboutPrivate Schools
So far, we have assumed that the primary com-petitive advantage of private schools derives fromtheir ability to select students and thus isolate peergroups. This necessarily implies that public schoolquality must decline as private school markets arefostered through voucher policies, thus giving usthe bleakest picture regarding the potential impactof such policies on public schools. The evidenceon the extent to which private schools rely on this“cream skimming” advantage as their sole tool forattracting parents is, however, relatively weak. Itherefore consider two alternative assumptions aboutprivate schools to highlight the potential for morepositive impacts of competition on public schools.
Table 4 reports the impact of different levels ofprivate school vouchers on public school qualityin each of our three districts, with quality indexedby 100 for the middle-income district in the absenceof vouchers. The top portion of the table continues
with the assumption of “cream skimming” as theprimary tool used by private schools to competeagainst public schools (as in Table 3), illustratingonce again the drop in public school quality in alldistricts as universally available vouchers areintroduced. Note again that public school qualitydeclines in all districts even as private schoolsappear primarily in the poor district—becauseprivate schools are “skimming the cream” from allpublic schools, not just those in the poor district.
The second and third parts of Table 4 thenintroduce two alternative assumptions about privateschools. In the middle portion of the table, I assumethat children with different “abilities” can be servedbetter if pedagogical approaches can be tailored totheir needs to the extent to which they are in class-rooms with similar peers. Although private schoolsare still assumed to engage in some cream skim-ming, they also aim to fill market niches by offeringdifferent types of pedagogical approaches mostsuited to the needs of particular types of children.23
Children that remain in the public schools thenexhibit less variance in their characteristics, permit-ting public schools to also target their approachesmore directly to student needs. The main conclu-sion from this exercise is that, as less deleteriousmotives for private schools are introduced togetherwith an ability by public schools to become moreeffective under competition, the introduction ofvouchers can lead to increases in public schoolquality in all districts.
The final portion of the table illustrates a simi-lar conclusion from introducing yet a third privateschool advantage supported by some empiricalevidence. Again, let us continue to assume thatsome of the private school advantage derives fromcream skimming; however, private schools are alsoassumed to be more efficient at translating finan-cial resources into school quality, whereas publicschools become more efficient only when exposedto competition.24 And, as in the middle portion of
23 The simulations assume that approximately half of the privateschool advantage still derives from “cream skimming” and halfderives from pedagogical targeting.
24 The pedagogical targeting in the middle portion of the table can infact be viewed as a special case of resource efficiency—with privateschools being able to produce more quality with a given set of finan-cial resources because they can target their curriculum to a narrowerrange of student types.
Nechyba
22 VOLUME 2, NUMBER 1 2006 FEDERAL RESERVE BANK OF ST. LOUIS REGIONAL ECONOMIC DEVELOPMENT

the table, the simulations suggest that it is possiblefor public schools to improve in all districts underassumptions about private schools that are morefavorable for such effects emerging.25
The Robustness of Unbundling toDifferent Assumptions about PrivateSchools
Although the predicted impact of private schoolcompetition on public school quality thereforedepends on the nature of private school competition(as illustrated in Table 4), the residential desegre-gation predicted by the model under greater privateschool activity is independent of what form privateschool competition takes. Put differently, undereach of the scenarios considered in Table 4, theinterdistrict variance of community income andhousing prices narrows as private school–attendingparents disproportionately choose to reside in
poorer districts as they take up vouchers andunbundle their school choice from their residentiallocation choice.
Implications for Voucher Design
As suggested at the beginning of this section,state aid targeted to parents can, in principle, takedifferent forms analogous to the forms state aid cantake when targeted to districts. Thus, vouchers canin principle have “block grant” features (as in thetables reported above) or “matching grant” features(which would attract greater private resources intoeducation due to the additional “price effect” dis-cussed in Section 3). Vouchers, like aid to districts,can be designed to limit additional parent contri-bution by requiring that private schools acceptvouchers as full payment for tuition, or they can(as in the tables above) permit households to “topoff” vouchers. And vouchers can be targeted tohouseholds based on where they live (analogousto targeting state aid differentially to districts) andto household characteristics (analogous to making
25 See Nechyba (2005) for more discussion of the assumptions thatlead to better or worse public school performance.
Nechyba
FEDERAL RESERVE BANK OF ST. LOUIS REGIONAL ECONOMIC DEVELOPMENT VOLUME 2, NUMBER 1 2006 23
Table 4Impact of (Universal Vouchers) Under Alternative Private School Assumptions
Voucher amount
$0 $1,000 $2,500 $4,000 $5,000
Public school quality*
Cream skimming only
Poor district 69.97 68.05 65.82 39.83 †
Middle district 100.00 98.80 89.43 78.93 44.59
Wealthy district 126.31 120.22 112.96 93.19 80.27
Cream skimming + pedagogical targeting
Poor district 70.36 76.46 80.55 81.61 76.85
Middle district 100.00 101.52 104.96 105.99 101.55
Wealthy district 131.05 130.11 129.67 131.74 127.02
Cream skimming + competitive resource efficiency
Poor district 65.72 67.42 69.81 71.08 71.74
Middle district 100.00 101.83 104.90 107.68 109.75
Wealthy district 124.64 126.96 128.23 131.24 132.59
NOTE: Dollar values are expressed in 1990 dollars. *Indexed to be equal to 100 in middle-income districts in the absence of vouchers.†Public school ceased to exist.
SOURCE: Nechyba (2005).
state aid to districts dependent on the mix of house-hold types in each district).
The main difference between state aid to dis-tricts and state aid to parents, however, is the inter-district and interschool mobility of aid under thelatter system but not the former. When state aid todistricts is dependent on the characteristics ofhouseholds in each district (as when students withlow SES or learning disabilities imply greater aidto the district), a household has an incentive to takeinto account the impact its residential locationchoice has on local schools because the money thataccompanies the household is spread across allstudents in the public schools of the district. Whensuch aid is provided directly to parents, however,the household is in control of the aid and can useit at whatever school it chooses, thus introducingthe unbundling effect emphasized here.
Although this unbundling addresses the centrallimitations imposed on poorer households in quasi-public school economies, it also gives rise to anumber of possible concerns. For instance, if diver-sity of student populations has important long-run social effects, for instance, will policies thatfoster greater segregation of student types into dif-ferent schools create future social problems (evenif such policies simultaneously foster greater resi-dential desegregation)? Or, given that some parentsare less likely to be engaged in their children’seducational progress, will fostering greater choicelead some public schools to be composed almostentirely of students from relatively dysfunctionalfamilies? Would segregation of student types intomore specialized schools improve quality througheducational innovations targeted at the particularneeds of different types of children, or will the seg-regation result in low-peer-quality students havingeven less educational opportunity than they dounder the current quasi-public system?
Our discussion of the potential for unbundlingof school and residential choices as a means to offerchoice to those most disenfranchised in a quasi-public school system is not meant to minimizethese concerns. Instead, our discussion of thequasi-public nature of public schools that bundleresidential and school choices suggests that suchconcerns about the potential adverse effects ofincreasing choice should raise similar concerns
about public schools as they are presentlydesigned—because their quasi-public characteralready implies a lack of diversity and a dispro-portionate concentration of children from moredysfunctional family backgrounds. The potentialof private school choice to lessen residential seg-regation offers the possibility of greater integrationwithin communities even as it suggests the possibil-ity of greater segregation in schools. As illustratedin Table 4, greater segregation of student types canhave positive or negative effects depending on thenature of private school competition and publicschool responses. Vouchers can, however, in prin-ciple be designed to address concerns about diver-sity by requiring such diversity in private schoolsthat accept vouchers and by varying voucheramounts based on household and child character-istics.26 And the introduction of greater privateschool choice for poorer parents must certainly beaccompanied by a concerted effort to improve pub-lic schooling for those—particularly those in poordistricts—whose parents do not exercise choice.
CONCLUSION: THINKING ABOUTCITIES AND SCHOOLS TOGETHER
It is well recognized that educational opportu-nities for children are currently quite dependenton the economic circumstances of parents. Thispaper argues that the economic root cause for thisfact lies in the quasi-public nature of public edu-cation in most of the United States. Public schoolsare “public” in the sense that they are fundedthrough taxpayer contributions; they are “quasi-public” in the sense that, while nominally “free,”access is implicitly priced through housing markets,thus limiting educational opportunities for poorerhouseholds whose choice of public school is typi-cally limited to the worst schools in the publicsystem. As a result, the public system whose idealis equal opportunity for all children is one thatdisproportionately concentrates poorer house-holds in worse schools. Furthermore, goals suchas exposing children to diversity within publicschools are, to the extent that they are realized, far
26 Nechyba (2005) discusses implications for voucher design in moredetail.
Nechyba
24 VOLUME 2, NUMBER 1 2006 FEDERAL RESERVE BANK OF ST. LOUIS REGIONAL ECONOMIC DEVELOPMENT

from the ideal often envisioned by public schoolproponents.
The inequities inherent in public education inthe United States have been well recognized fordecades, with increasing state efforts (often moti-vated by court challenges) to use state aid programsto reduce these inequities. The discussion in thispaper suggests that, although state equalizationprograms can indeed ameliorate inequities to someextent, the quasi-public nature of schools combinedwith the importance of nonfinancial inputs intoschool production implies severe limits to howfar such policies can go in achieving their aim ofproviding equal or even adequate educationalopportunities for all. Although it is possible todistinguish between different types of traditionalstate aid programs in terms of their effectiveness atachieving greater equity, some important economiccauses of existing inequities—rooted in residentialsegregation by income—remain intact.
Over the past decade, an alternative set of fiscalapproaches has therefore emerged.27 These can bebroadly characterized as “choice-based” approachesthat include both the introduction of greater choicewithin the public system and the introduction ofgreater incentives for private school formationthrough voucher policies. These approaches areaimed more directly at the economic root cause ofinequities in public education, recognizing moreexplicitly the relative lack of school choice fordisadvantaged families. The rise of charter schools,which permit parents to form publicly fundedschools aside from traditional residence-basedschools, is one such approach, whereas the emer-gence of publicly funded (private school) voucherprograms is another. There is much we do not cur-rently know about the potential systemic effectsof such programs, as illustrated by our discussionof the very different predictions regarding theimpact of such programs on traditional publicschool quality, depending on assumptions aboutthe nature of school competition (Table 4). At thesame time, economic models suggest that theunbundling of school and housing choices permit-ted under these approaches is likely to have pro-
found impacts on residential segregation.Our discussion of the differences between
district-based and parent-based education financestrategies highlights the importance of more explic-itly recognizing the connection between how citiesevolve and the educational opportunities they offer.In a public system in which access to public schoolsis residence-based, it is not possible to divorce theanalysis of school finance policies from an under-standing of how city and suburban neighborhoodsare shaped. As was demonstrated in Section 3,achieving equality in school spending is far fromachieving equality in educational opportunitieswhen households are not randomly assigned toresidential neighborhoods. Although state aid totraditional public schools, particularly those servingdisadvantaged families, is surely an important aspectfor any state effort to ensure greater educationalopportunity for all, the fundamental economicforces that maintain inequities within traditionalpublic schools require state fiscal policies to payincreasing attention to those economic forces. Thus,combining traditional state aid programs withparent-focused aid that increases choice for thedisadvantaged can become an increasingly impor-tant component of state aid strategies, with theaim of increasing educational opportunities whileaddressing at the same time some of the economicchallenges faced by cities (and suburbs) whosepopulations are too segregated along income lines.
REFERENCESBrunner, Eric and Sonstelie, Jon. “Homeowners,
Property Values, and the Political Economy ofSchool Vouchers.” Journal of Urban Economics,September 2003, 54(2), pp. 239-57.
Brunner, Eric; Thayer, Mark and Sonstelie, Jon.“Capitalization and the Voucher: An Analysis ofPrecinct Returns from California’s Proposition 174.”Journal of Urban Economics, November 2001, 50(3),pp. 517-36.
Cooley, Jane. “Desegregation and the AchievementGap: Do Diverse Peers Help?” Working paper, DukeUniversity, 2005.
27 In addition to “fiscal” approaches, there has also been an increasedemphasis on accountability systems that lie beyond the scope ofthis paper.
Nechyba
FEDERAL RESERVE BANK OF ST. LOUIS REGIONAL ECONOMIC DEVELOPMENT VOLUME 2, NUMBER 1 2006 25
Cullen, Julie. “The Impact of Fiscal Incentives onStudent Disability Rates.” Journal of PublicEconomics, August 2003, 87(7-8), pp. 1557-89.
Cullen, Julie and Reback, Randall. “Tinkering TowardAccolades: School Gaming under a PerformanceAccountability System.” Working paper, Universityof Michigan, 2002.
Downes, Thomas and Greenstein, Shane. “Under-standing the Supply Decision of Non-Profits:Modeling the Location of Private Schools.” RandJournal of Economics, Summer 1996, 27(2), pp. 365-90.
Epple, Dennis and Nechyba, Thomas. “FiscalDecentralization,” in V. Henderson and JacquesThisse, eds., Handbook of Regional Economics,Volume 4. Amsterdam: North Holland, 2004.
Feldstein, Martin. “Wealth Neutrality and LocalChoice in Public Education.” American EconomicReview, March 1975, 65(1), pp. 75-89.
Ferreyra, Marya. “Estimating Effects of Private SchoolVouchers in Multi-District Economies.” Workingpaper, Carnegie Mellon University, 2005.
Figlio, David and Getzler, Larry. “Accountability,Ability and Disability: Gaming the System.” NBERWorking Paper No. 9307, National Bureau ofEconomic Research, 2002.
Figlio, David and Winicki, Joshua. “Food for Thought:The Effects of School Accountability Plans on SchoolNutrition.” Journal of Public Economics, February2005, 89(2-3), pp. 381-94.
Fischel, William. The Homevoter Hypothesis: HowHome Values Influence Local Government Taxation,School Finance, and Land-Use Policies. Cambridge,MA: Harvard University Press, 2001.
Hanushek, Eric. “Some Findings from an IndependentInvestigation of the Tennessee STAR Experimentand from Other Investigations of Class Size Effects,”Susan Mayer and Paul Peterson, eds., Earnings andLearning: How Schools Matter. Washington, DC:Brookings Institution, 1999.
Harris, Judith. The Nurture Assumption. New York:The Free Press, 1998.
Hines, James and Thaler, Richard. “The FlypaperEffect.” Journal of Economic Perspectives, Autumn1995, 9(4), pp. 217-26.
Hoxby, Caroline. “All School Finance Equalizationsare not Created Equal.” Quarterly Journal ofEconomics, November 2001, 116(4), pp. 1189-231.
Hoxby, Caroline and Kuziemko, Ilyanna. “Robin Hoodand His Not-So-Merry Plan.” NBER Working PaperNo. 10722, National Bureau of Economic Research,2004.
Inman, Robert and Rubinfeld, Daniel. “The JudicialPursuit of Local Fiscal Equity.” Harvard Law Review,June 1979, 92(8), pp. 1662-750.
Jacob, Brian. “Accountability, Incentives and Behavior:Evidence from School Reform in Chicago.” Journalof Public Economics, June 2005, 89(5-6), pp. 761-96.
Jacob, Brian and Levitt, Steven. “Rotten Apples: AnInvestigation of the Prevalence and Predictors ofTeacher Cheating.” Quarterly Journal of Economics,August 2003, 118(3), pp. 843-77.
Ladd, Helen. “State-Wide Taxation of Commercial andIndustrial Property for Education.” National TaxJournal, March 1976, 29(2) pp. 143-53.
Loeb, Susanna and Page, Marianne. “Examining theLink between Teacher Wages and Student Outcomes:The Importance of Alternative Labor MarketOpportunities and Non-Pecuniary Variation.”Review of Economics and Statistics, August 2000,82(3), pp. 393-408.
Manski, Charles. “Identification of Endogenous SocialEffects: The Reflection Problem.” Review ofEconomic Studies, July 1993, 60(3), pp. 531-42.
Nechyba, Thomas. “A Computable General EquilibriumModel of Intergovernmental Aid.” Journal of PublicEconomics, November 1996, 62(3), pp. 363-97.
Nechyba, Thomas. “School Finance Induced MigrationPatterns: The Impact of Private School Vouchers.”Journal of Public Economic Theory, January 1999,1(1), pp. 5-50.
Nechyba
26 VOLUME 2, NUMBER 1 2006 FEDERAL RESERVE BANK OF ST. LOUIS REGIONAL ECONOMIC DEVELOPMENT

Nechyba, Thomas. “Mobility, Targeting and PrivateSchool Vouchers.” American Economic Review,March 2000, 90(1), pp. 130-46.
Nechyba, Thomas. “Introducing School Choice intoMulti-District Public School Systems,” in CarolineHoxby, ed., The Economics of School Choice.Chicago: University of Chicago Press, 2003a.
Nechyba, Thomas. “School Finance, Spatial IncomeSegregation and the Nature of Communities.”Journal of Urban Economics, July 2003b, 54(1), pp.61-88.
Nechyba, Thomas. “Centralization, Fiscal Federalismand Private School Attendance.” InternationalEconomic Review, February 2003c, 44(1), pp. 179-204.
Nechyba, Thomas. “Public School Finance and UrbanSchool Policy: General vs. Partial EquilibriumAnalysis.” Brookings-Wharton Papers on UrbanAffairs 2003, 2003d, pp. 139-70.
Nechyba, Thomas. “Prospects for Achieving Equityand Adequacy in Education: The Limits of State Aidin General Equilibrium,” in John Yinger, ed.,Helping Children Left Behind. Cambridge, MA: MITPress, 2004.
Nechyba, Thomas. “Mobilizing the Private Sector: ATheoretical Overview.” Working paper, DukeUniversity, 2005.
Oates, Wallace. “The Effects of Property Taxation andLocal Public Spending on Property Values: AnEmpirical Study of Tax Capitalization and the TieboutHypothesis.” Journal of Political Economy,November-December 1969, 77(6), pp. 957-71.
Sonstelie, Jon and Silva, Fabio. “Did Serrano Cause aDecline in School Spending?” National Tax Journal,June 1995, 48(2), pp. 199-215.
Nechyba
FEDERAL RESERVE BANK OF ST. LOUIS REGIONAL ECONOMIC DEVELOPMENT VOLUME 2, NUMBER 1 2006 27
Discussion
Ross Rubenstein
WITHIN-DISTRICT DISPARITIES Much of the attention in policy and litigation
surrounding school finance has focused on schooldistricts—specifically, to ensure adequate educa-tional resources in all districts or equitable resourcesacross districts. The implicit assumption in district-based averages is that all schools within the districtreceive the district’s average level of resources.Evidence accumulated in recent years, though, hasshown that wide disparities in student character-istics, teacher characteristics, and resources existat the school level, and these disparities may be aslarge as or even larger than those across districts.(See, for example, Stiefel, Rubenstein, and Schwartz,2004, and Roza and Hill, 2004.) Moving from thecurrent “quasi-public” system to one in whichparents have more complete choice of schoolscould, in fact, reduce these disparities, but theeffects are not entirely clear (and the simulationsare not designed to model them). As the simulationsshow, a market-based system in which parentsreceive vouchers reduces disparities across wealth-ier and poorer districts as higher-income familiesmove into poorer areas. An important supplementto this analysis would be to examine disparities inschool quality within, as well as across, districts.
Although the sorting across districts may belargely related to the sorting of families and taxbases, sorting within districts may be more complex.An important assumption in such an analysis is howto model teacher sorting. Under a purely privatesystem it may be safe to assume that teachers aresubject to the same market forces as other profes-
T he paper “Alternative Education FinanceStrategies” by Thomas Nechyba (2006)examines issues often ignored in shapingand analyzing school finance policy—
namely, the effects of behavioral responses to inter-governmental grants. To the extent that attentionis paid to these behavioral responses, it is oftenlimited to school district responses—that is, theways in which school districts might alter taxingand spending policies in response to changes inincome or prices brought about by changes in statefunding formulas. The analyses in this paper,though, do not assume that policies operate in avacuum or that district characteristics are static.Instead, the paper incorporates simulations of theresulting behavioral responses by families andthe potential effects of these responses on schoolquality, segregation, and spending.
This paper makes a strong theoretical case foradopting a family-based funding system, and Ibelieve that recent policy initiatives may inevitablymove us in that direction in the future. For example,around the country we have seen bitter disputesover the amount of funding charter schools shouldreceive for each student enrolled (see Vanourek,2005, and Loh, 2005) because the systems currentlyin place are simply not designed to fund individualstudents. With direct aid to parents, of course,these funding mechanisms would be quite simple.The simulations in the paper also raise a numberof important policy issues and questions that wouldneed to be addressed to develop an effective family-based funding system.
Ross Rubenstein is an associate professor of public administration at the Maxwell School, Syracuse University.
Federal Reserve Bank of St. Louis Regional Economic Development, 2006, 2(1), pp. 28-30.© 2006, The Federal Reserve Bank of St. Louis. Articles may be reprinted, reproduced, published, distributed, displayed, and transmitted intheir entirety if copyright notice, author name(s), and full citation are included. Abstracts, synopses, and other derivative works may be madeonly with prior written permission of the Federal Reserve Bank of St. Louis.
28 VOLUME 2, NUMBER 1 2006 FEDERAL RESERVE BANK OF ST. LOUIS REGIONAL ECONOMIC DEVELOPMENT

sions, with schools bidding for the services ofteachers who would best match the school, withinthe school’s budget constraint. If we assume moreequalized spending across schools, this wouldrequire schools to make trade-offs between teacherquality and other school inputs, such as class size(assuming that higher-quality teachers receivehigher salaries, on average). As Nechyba points outin the paper, public school teacher assignment isvery different from the scenario just described.Instead, we typically find the most experiencedand educated teachers sorting not only into thedistricts with the most advantaged students, butalso into the schools with the most advantagedstudents within those districts. Seniority transferrights and single salary schedules provide no incen-tives for teachers to teach in schools with greaterneeds. It is not clear whether school finance reformthat doesn’t address these intradistrict resourceallocation mechanisms can truly equalize educa-tional opportunities within school districts. Thismay not be a concern in small districts, but inlarge urban areas with many schools, for exampleSt. Louis and its almost 100 schools, some levelof equalization could occur between St. Louis andits suburbs but have relatively little effect on thepoorest schools within St. Louis.
LESSONS FROM HIGHEREDUCATION
It is not uncommon for ideas that might beconsidered radical and politically untenable in K-12education to be standard operating procedure inhigher education. The idea of vouchers for elemen-tary and secondary school students, with muchmore fluid competition among public and privateproviders, is an example of such as idea. Thoughnot referred to as “vouchers,” the federal and stategovernments provide an array of grants, scholar-ships, tax credits, and subsidized loans that followstudents to any institution of higher learning, publicor private, at which he or she chooses to enroll.While there are critical differences between highereducation and elementary/secondary education,there may also be lessons to learn in the design ofa K-12 state aid system targeted to parents.
First, depending on the structure of the system,we may not see the demise of public schools oreven a dramatic reduction in their share of themarket. Under our current system, approximately10 percent of elementary and secondary schoolstudents are enrolled in private schools, whereasin higher education approximately 23 percent areenrolled in private institutions (National Center forEducation Statistics, 2005). The effects of family-based aid, though, would likely depend on whetherpublic schools continue to receive direct state orlocal subsidies that allow them to charge pricesbelow the actual cost of providing educationalservices. Second, higher education is extremelystratified: An average of only 3 percent of studentsat the nation’s most selective institutions come fromthe bottom income quartile; 74 percent of studentsat the most selective institutions come from thehighest quartile (Carnevale and Rose, 2004). Thisstratification is evident even at many elite publicinstitutions, despite their relatively low net prices.The causes of this inequality are complex, of course,but an important contributing factor is admissionpolicies at elite schools that heavily weight stan-dardized test scores (such as the SAT) along withother nonacademic factors, such as legacies andathletic ability (Bowen, Kurzweil, and Tobin, 2005).This suggests that if we hope to reduce segregationand stratification in elementary and secondaryschools, a purely free market system that allowsschools to choose the students they enroll, “creamskimming,” as the paper describes, may do littleto achieve this goal. At the same time, if a family-based funding system were successful at reducinginequalities in elementary and secondary educa-tion, it could also be a powerful force for reducingstratification in higher education as well.
THE DEVIL IS IN THE DETAILSAlthough this statement is true to some extent
for any public policy, the devil may be in the detailswhen attempting to design a family-based aidsystem that maximizes benefits without creatingunintended negative consequences. As the paperrecognizes, determining which students or familiesshould be targeted and how much funding such
Rubenstein
FEDERAL RESERVE BANK OF ST. LOUIS REGIONAL ECONOMIC DEVELOPMENT VOLUME 2, NUMBER 1 2006 29

students should receive presents some of the mostcritical challenges in the design of such a system.
A simple “lump sum” grant of equal amountto all families is likely to exacerbate stratificationbecause schools would face a strong disincentiveto enroll the most costly-to-educate students. Grantsof sufficient size for students with special needscould, though, lead to greater opportunities forsuch students as school entrepreneurs compete tooffer high-quality specialized programs for suchstudents. This raises two potential problems. First,such a system might inevitably lead to more isola-tion of students with special needs, a situationmany advocates would consider unacceptableregardless of the quality of the programs. Second,how do we determine the appropriate grant level?Though a number of methods have been proposed,no broadly accepted methodology exists to deter-mine the cost of educating various types of students(see Duncombe and Yinger, 2005, for a discussionof these methods). Moreover, we typically focus onthe average costs of such students, but have littleunderstanding of the marginal costs of educatingthe first student with a learning disability, for exam-ple, as compared with the twentieth. To unleash arobust and competitive market, the grants wouldneed to be sufficiently high to bring entrepreneursinto the market willing to serve all students. At thesame time, we can ill-afford to offer excessivelyhigh grants simply to guarantee that supply ofschools.
In closing, I want to stress that these commentsare not meant to suggest flaws in the logic or carefulanalysis presented in the paper, but simply to pointout some of the other critical issues that theseanalyses raise. Ultimately, I am afraid I end withthe stereotypical academic’s plea: the call for moreresearch to help us better understand the importantramifications that these policy decisions have onchildren’s opportunities.
REFERENCESCarnevale, Anthony P. and Rose, Stephen J.
“Socioeconomic Status, Race/Ethnicity, and SelectiveCollege Admissions,” in Richard D. Kahlenberg, ed.,
America’s Untapped Resource: Low-Income Studentsin Higher Education. New York: Century FoundationPress, 2004.
Bowen, William G.; Kurzweil, Martin and Tobin, Eugene.Equity and Excellence in American Higher Education.Charlottesville: University of Virginia Press, 2005.
Duncombe, William and Yinger, John. “How Much MoreDoes a Disadvantaged Student Cost?” Economics ofEducation Review, October 2005, 24(5), pp. 513-32.
Loh, Laura. “City Schools To Challenge State Decisionon Charters; Equal Spending for All Students PlacesSystem Finances at Risk, Officials Say; Relief To BeSought from Courts, Federal Agency.” Baltimore Sun,May 11, 2005, p. 1B.
National Center for Education Statistics. Digest ofEducation Statistics, 2004. Washington, DC: Institutefor Education Sciences, U.S. Department of Education,2005; Tables 36, 52, 178.
Nechyba, Thomas J. “Alternative Education FinanceStrategies.” Federal Reserve Bank of St. LouisRegional Economic Development, 2006, 2(1), pp. 7-27.
Roza, Marguerite and Hill, Paul T. “How Within-DistrictSpending Inequities Help Some Schools Fail,” inDiane Ravitch, ed., Brookings Papers on EducationPolicy, 2004 Washington, DC: Brookings Institution,2004, pp. 201-27.
Stiefel, Leanna; Rubenstein, Ross and Schwartz, AmyEllen. “From Districts to Schools: The Distributionof Resources Across Schools in Big City SchoolDistricts,” in David H. Monk and James Wyckoff,eds., Proceedings from the Symposium on EducationFinance and Organizational Structure in NYS Schools.Albany, NY: Education Finance Research Consortium,2004.
Vanourek, Greg. State of the Charter Movement 2005.Washington, DC: Charter School Leadership Council,2005.
Rubenstein
30 VOLUME 2, NUMBER 1 2006 FEDERAL RESERVE BANK OF ST. LOUIS REGIONAL ECONOMIC DEVELOPMENT

FEDERAL RESERVE BANK OF ST. LOUIS REGIONAL ECONOMIC DEVELOPMENT VOLUME 2, NUMBER 1 2006 31
K-12 Public School Finance in Missouri:An Overview
Michael Podgursky and Matthew G. Springer
with the 1971 Serrano v. Priest decision inCalifornia, school finance systems based primarilyon local property taxes have been found to violatestate constitutions. Interdistrict per-student spend-ing disparities in many states were substantial. InTexas, for example, given identical property taxrates, high-wealth districts were capable of spendingover 20 times more per student than low-wealthdistricts (Edgewood Independent School District v.Kirby, 1989). These legal challenges, termed “equity”cases, have been successfully argued in 12 states.Research suggests that they have had the effect ofnarrowing spending inequality (Murray, Evans, andSchwab, 1998).
Missouri’s school finance system was chal-lenged on equity grounds and found unconstitu-tional in 1993. The legislature responded by writinginto law the School Improvement Act of 1993,which called for an extensive overhaul of the schoolfunding mechanism by means of an increase inelementary and secondary education spendingand decoupling of local tax collections from local
T he level and structure of public elemen-tary and secondary education fundingis a contentious public policy matterin Missouri and many other states.
Although state revenues and spending grew brisklyduring the latter 1990s, the 2001 recession pro-duced large deficits and sharp declines in taxrevenues in most states. Fiscal recovery has beenslow, and growing spending demands in the areasof public safety, social services, and educationcoupled with rapid growth in Medicaid expenseshave resulted in considerable fiscal stress for states(Kane, Orszag, and Gunter, 2003). Voters also havebeen reluctant to raise tax rates. In Missouri, voterdiscontent led to the passage of a constitutionalamendment in 1980 known as the HancockAmendment, which limits the growth of staterevenues to the growth rate of state per capitapersonal income (Hembree, 2004).
Two generations of school finance litigationhave further complicated fiscal matters. Beginning
The level and distribution of spending for public K-12 education remains a contentious matter ofpolicy in many states because of increasing expectations for school performance and widespreadschool finance litigation. In this paper, the authors examine the policies that have generated schoolfunding in Missouri and the outcomes of these policies in terms of the overall level of schoolspending and interdistrict spending gaps. Interdistrict inequality in average spending is higher inMissouri than in surrounding states, but the spending gaps are equalizing in the sense that poorchildren tend to be concentrated in districts with above-average spending. A new school fundingformula is grounded on a purported link between spending and student achievement. Since thatassociation is tenuous statistically, challenges are likely to arise as this new scheme is fullyimplemented.
Federal Reserve Bank of St. Louis Regional Economic Development, 2006, 2(1), pp. 31-50.
Michael Podgursky is a professor of economics at the University of Missouri–Columbia, and Matthew G. Springer is assistant director for policyresearch at the Peabody Center for Education Policy, Vanderbilt University. The authors thank Mark Ehlert and Gerri Ogle for assistance with thestate finance and assessment data, Art Peng for research assistance, and Michael Wolkoff for helpful comments.
© 2006, The Federal Reserve Bank of St. Louis. Articles may be reprinted, reproduced, published, distributed, displayed, and transmitted intheir entirety if copyright notice, author name(s), and full citation are included. Abstracts, synopses, and other derivative works may be madeonly with prior written permission of the Federal Reserve Bank of St. Louis.
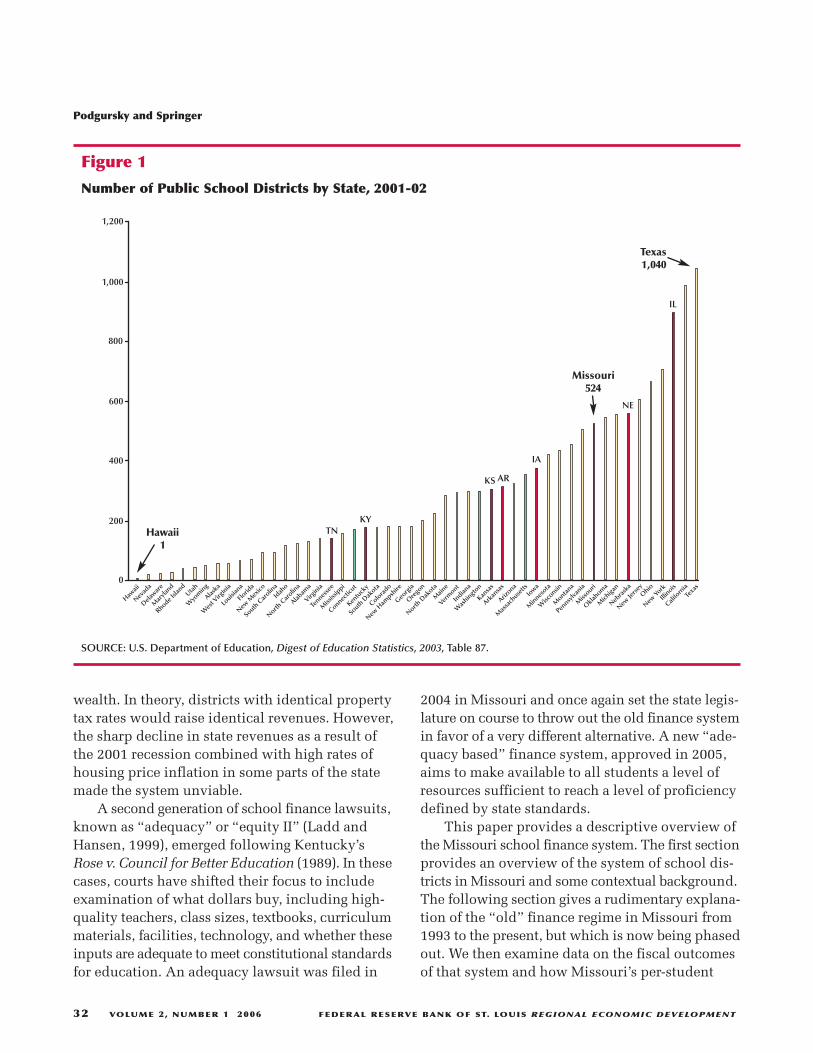
wealth. In theory, districts with identical propertytax rates would raise identical revenues. However,the sharp decline in state revenues as a result ofthe 2001 recession combined with high rates ofhousing price inflation in some parts of the statemade the system unviable.
A second generation of school finance lawsuits,known as “adequacy” or “equity II” (Ladd andHansen, 1999), emerged following Kentucky’sRose v. Council for Better Education (1989). In thesecases, courts have shifted their focus to includeexamination of what dollars buy, including high-quality teachers, class sizes, textbooks, curriculummaterials, facilities, technology, and whether theseinputs are adequate to meet constitutional standardsfor education. An adequacy lawsuit was filed in
2004 in Missouri and once again set the state legis-lature on course to throw out the old finance systemin favor of a very different alternative. A new “ade-quacy based” finance system, approved in 2005,aims to make available to all students a level ofresources sufficient to reach a level of proficiencydefined by state standards.
This paper provides a descriptive overview ofthe Missouri school finance system. The first sectionprovides an overview of the system of school dis-tricts in Missouri and some contextual background.The following section gives a rudimentary explana-tion of the “old” finance regime in Missouri from1993 to the present, but which is now being phasedout. We then examine data on the fiscal outcomesof that system and how Missouri’s per-student
Podgursky and Springer
32 VOLUME 2, NUMBER 1 2006 FEDERAL RESERVE BANK OF ST. LOUIS REGIONAL ECONOMIC DEVELOPMENT
Nevad
a
Delawar
e
Mar
yland
Rhode Isla
nd
Utah
Wyo
ming
Alaska
Wes
t Virg
inia
Louisi
ana
Florid
a
New M
exico
Idah
o
Alabam
a
Virginia
Tennes
see
Miss
issip
pi
Connectic
ut
Kentu
cky
South
Dak
ota
Colora
do
New H
ampsh
ire
Georg
ia
Ore
gon
North D
akota
Main
e
Verm
ont
Indian
a
Was
hington
Kansa
s
Arkan
sas
Arizona
Mas
sach
usetts
Iowa
Minnes
ota
Wisc
onsin
Monta
na
Pennsy
lvania
Miss
ouri
Okla
homa
Mich
igan
Nebra
ska
New Je
rsey
Ohio
New Yo
rk
Illinois
Califo
rnia
Texa
s
1,200
1,000
800
600
400
200
0
Hawaii
South
Car
olina
North C
arolin
a
Hawaii1
Missouri524
Texas1,040
TNKY
KS AR
IA
NE
IL
Figure 1
Number of Public School Districts by State, 2001-02
SOURCE: U.S. Department of Education, Digest of Education Statistics, 2003, Table 87.
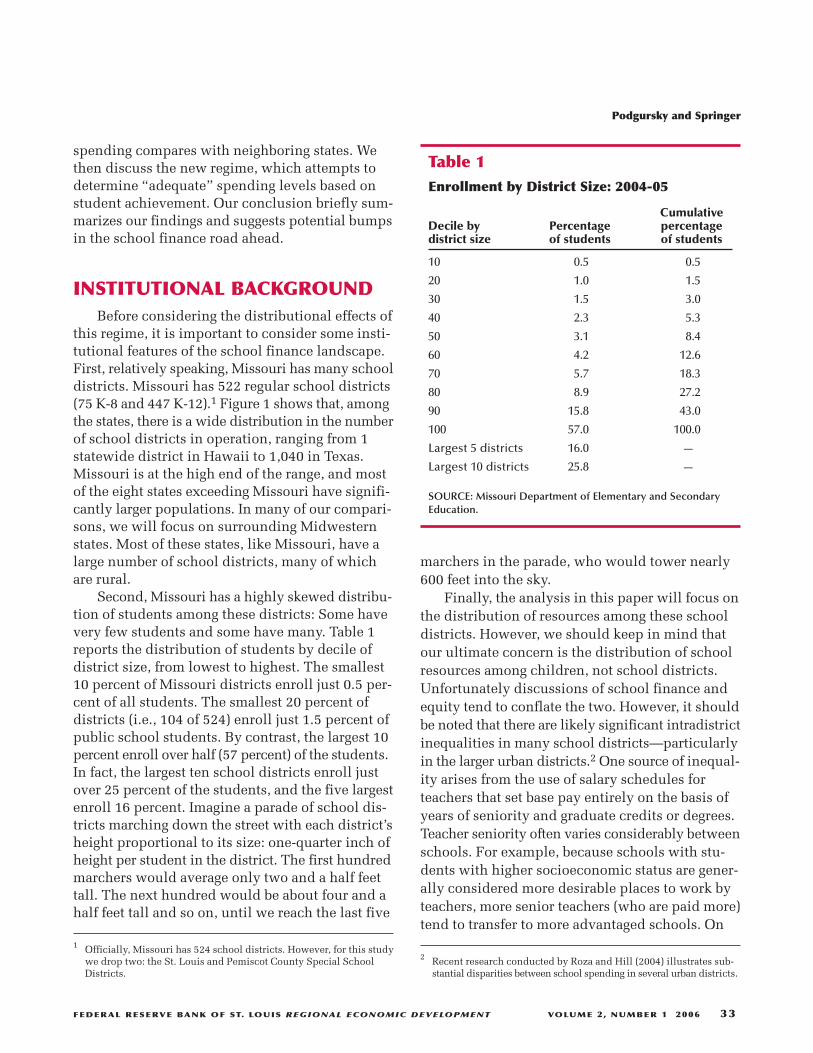
spending compares with neighboring states. Wethen discuss the new regime, which attempts todetermine “adequate” spending levels based onstudent achievement. Our conclusion briefly sum-marizes our findings and suggests potential bumpsin the school finance road ahead.
INSTITUTIONAL BACKGROUNDBefore considering the distributional effects of
this regime, it is important to consider some insti-tutional features of the school finance landscape.First, relatively speaking, Missouri has many schooldistricts. Missouri has 522 regular school districts(75 K-8 and 447 K-12).1 Figure 1 shows that, amongthe states, there is a wide distribution in the numberof school districts in operation, ranging from 1statewide district in Hawaii to 1,040 in Texas.Missouri is at the high end of the range, and mostof the eight states exceeding Missouri have signifi-cantly larger populations. In many of our compari-sons, we will focus on surrounding Midwesternstates. Most of these states, like Missouri, have alarge number of school districts, many of whichare rural.
Second, Missouri has a highly skewed distribu-tion of students among these districts: Some havevery few students and some have many. Table 1reports the distribution of students by decile ofdistrict size, from lowest to highest. The smallest10 percent of Missouri districts enroll just 0.5 per-cent of all students. The smallest 20 percent ofdistricts (i.e., 104 of 524) enroll just 1.5 percent ofpublic school students. By contrast, the largest 10percent enroll over half (57 percent) of the students.In fact, the largest ten school districts enroll justover 25 percent of the students, and the five largestenroll 16 percent. Imagine a parade of school dis-tricts marching down the street with each district’sheight proportional to its size: one-quarter inch ofheight per student in the district. The first hundredmarchers would average only two and a half feettall. The next hundred would be about four and ahalf feet tall and so on, until we reach the last five
marchers in the parade, who would tower nearly600 feet into the sky.
Finally, the analysis in this paper will focus onthe distribution of resources among these schooldistricts. However, we should keep in mind thatour ultimate concern is the distribution of schoolresources among children, not school districts.Unfortunately discussions of school finance andequity tend to conflate the two. However, it shouldbe noted that there are likely significant intradistrictinequalities in many school districts—particularlyin the larger urban districts.2 One source of inequal-ity arises from the use of salary schedules forteachers that set base pay entirely on the basis ofyears of seniority and graduate credits or degrees.Teacher seniority often varies considerably betweenschools. For example, because schools with stu-dents with higher socioeconomic status are gener-ally considered more desirable places to work byteachers, more senior teachers (who are paid more)tend to transfer to more advantaged schools. On
Podgursky and Springer
FEDERAL RESERVE BANK OF ST. LOUIS REGIONAL ECONOMIC DEVELOPMENT VOLUME 2, NUMBER 1 2006 33
Table 1Enrollment by District Size: 2004-05
Cumulative Decile by Percentage percentage district size of students of students
10 0.5 0.5
20 1.0 1.5
30 1.5 3.0
40 2.3 5.3
50 3.1 8.4
60 4.2 12.6
70 5.7 18.3
80 8.9 27.2
90 15.8 43.0
100 57.0 100.0
Largest 5 districts 16.0 —
Largest 10 districts 25.8 —
SOURCE: Missouri Department of Elementary and SecondaryEducation.
1 Officially, Missouri has 524 school districts. However, for this studywe drop two: the St. Louis and Pemiscot County Special SchoolDistricts.
2 Recent research conducted by Roza and Hill (2004) illustrates sub-stantial disparities between school spending in several urban districts.
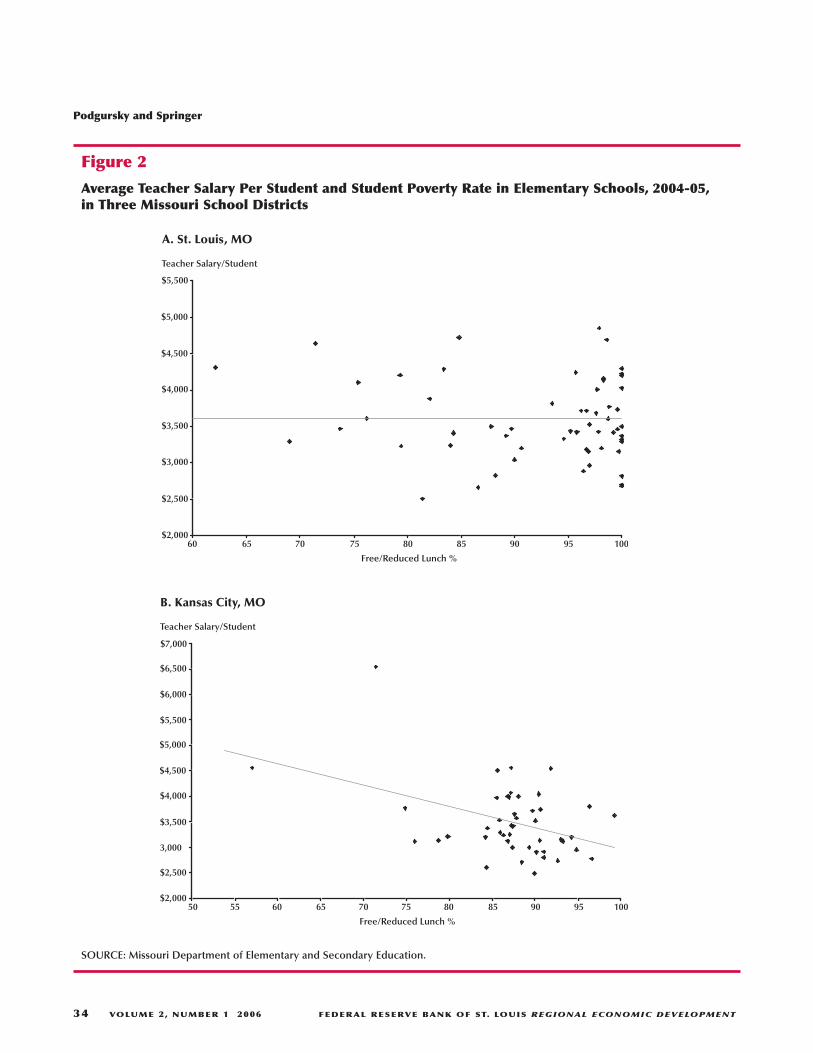
Podgursky and Springer
34 VOLUME 2, NUMBER 1 2006 FEDERAL RESERVE BANK OF ST. LOUIS REGIONAL ECONOMIC DEVELOPMENT
Teacher Salary/Student
$5,500
$5,000
$4,500
$4,000
$3,500
$3,000
$2,500
$2,00060 65 70 75 80 85 90 95 100
Free/Reduced Lunch %
A. St. Louis, MO
Figure 2
Average Teacher Salary Per Student and Student Poverty Rate in Elementary Schools, 2004-05,in Three Missouri School Districts
SOURCE: Missouri Department of Elementary and Secondary Education.
Teacher Salary/Student
$5,500
$5,000
$4,500
$4,000
$3,500
3,000
$2,500
$2,00060 65 70 75 80 85 90 95 100
Free/Reduced Lunch %
B. Kansas City, MO
$7,000
$6,500
$6,000
5550

the other hand, schools with high levels of povertymay receive additional compensatory resourcesfrom the district.
Figure 2 presents some illustrative data on thispoint for three urban districts in the state (St. Louis,Kansas City, and Columbia). We cannot computetotal spending per student in the state; however,we can examine the allocation of teacher payrollby school. In Figure 2 we present average teacherpayroll per student in regular elementary schoolswithin the three school districts. Variation acrossschools in this measure would arise from twosources—variation in average pay per teacher andvariation in students per teacher. First we note thatthere is considerable variation between schools inall three districts with nearly all schools roughlyfalling in a $2000 band. The three school districtsdiffer significantly in the relationship betweenspending and school poverty. In the Columbia
public schools the relationship is strongly com-pensatory. In the Kansas City elementary schoolsthe dispersion is somewhat disequalizing, and inSt. Louis it is neutral.3
Unfortunately, aside from teacher and somestaff pay, data are lacking on intradistrict patterns ofschool spending. Thus we will focus on per-studentspending at the district level, although it is impor-tant to keep these intradistrict issues in mind.
THE OLD REGIME: 1995-2005From 1995 until the 2005 legislative session,
Missouri operated under a formula based on theprinciple that identical tax effort should yieldroughly similar tax revenues. These types of for-
Podgursky and Springer
FEDERAL RESERVE BANK OF ST. LOUIS REGIONAL ECONOMIC DEVELOPMENT VOLUME 2, NUMBER 1 2006 35
Teacher Salary/Student
$4,500
$4,000
$3,500
$3,000
$2,500
$2,0000 10 20 30 40 50 60 70 80
Free/Reduced Lunch %
C. Columbia, MO
90
Figure 2, cont’d
Average Teacher Salary Per Student and Student Poverty Rate in Elementary Schools, 2004-05,in Three Missouri School Districts
SOURCE: Missouri Department of Elementary and Secondary Education.
3 The St. Louis and Kansas City data exclude charter elementaryschools.

mulas are sometimes referred to as “power equal-ization” (Hoxby, 2004). This operational structureemerged after Missouri courts in Committee forEducational Equality v. State of Missouri (1993)found the prior system unconstitutional and pro-vided districts with a guaranteed tax base. In prin-ciple, districts exerting identical taxing effort intheir respective property tax rates would be guaran-teed equal resources, with state revenues acting tooffset disparities in district wealth. School districtswere provided foundation aid roughly as follows:
Foundation aid = (EP × T × GTB) – local tax revenues,
where EP is the number of eligible students, T is thelocal school tax rate levy, and GTB is the guaranteedtax base. Senate Bill 180, passed in 1995 in responseto school finance litigation, set the guaranteed taxbase by the district-assessed valuation of the schooldistrict at the 95th percentile of school districtwealth. In other words, the formula intended todecouple tax effort from district wealth. A poorschool district would be guaranteed as much taxrevenue as a rich school district with the same taxrate.4
Such a formula maintained local control of thesetting of property tax rates; however, it also encour-aged school districts with below-average levels ofdistrict wealth to raise their local tax rates.5 A dis-trict with half the local wealth per student of the95th percentile would get one dollar in state aidfor every dollar raised locally. A poor district withone-fifth the property wealth would get four dollarsfor every local dollar. Districts above the 95th per-centile of wealth per student would receive no statefoundation aid, but none of their local tax revenueswould be confiscated either. Unlike some otherstates, Missouri has no “Robin Hood” provisionsfor redistribution of local tax revenues (Hoxby andKuzienko, 2004).
No school finance system ever proves thissimple, however. We have omitted a variety ofdetails. The most important omission for our pur-poses was Senate Bill 180’s “hold harmless” pro-vision. To secure sufficient political support forpassage of Senate Bill 180, school districts thatwere going to lose state aid had their aid frozen at1992-93 levels. These districts, termed “hold harm-less,” were primarily wealthier school districts.Thus, the bill’s equalizing effect was somewhatmuted because of the existence, in any year, of 55or so “hold harmless” districts.
The foundation formula was not the only wayin which state aid was allocated to school districts.The state of Missouri also provided “categoricalaid”—aid that can be used only for specified pur-poses—to school districts. The largest categoricalaid programs in Missouri included the following:
• transportation
• special education and remedial reading
• career ladder program (i.e., bonus pay forteachers)
• vocational education
Table 2 shows a breakdown of state aid for fiscal
Podgursky and Springer
36 VOLUME 2, NUMBER 1 2006 FEDERAL RESERVE BANK OF ST. LOUIS REGIONAL ECONOMIC DEVELOPMENT
Table 2Missouri Aid for School Districts, Fiscal Year2005
$Millions %
Basic formula 1,808 68.2
At-risk 374 14.1
Transportation 162 6.1
Special education/remedial reading 161 6.1
Vocational education 53 2.0
Career ladder 39 1.5
Early childhood 30 1.1
Gifted 25 0.9
Total 2,652 100.0
SOURCE: Missouri Department of Elementary and SecondaryEducation.
4 There was also a supplemental payment to school districts (“at risk”)that provided revenues to school districts based on the number ofstudents eligible for free or reduced price lunches; this programassigns a weight of 1.2 or 1.3 for these students.
5 This formula applied to school districts that set their tax rates at$2.75 per $100 of assessed valuation. This was intended to be a flooron the local rates. The small number of districts that set their ratesbelow this rate were not cut off from state aid but were given aidthrough a less-generous formula. Foundation matching aid wascapped at a tax rate of $3.85. Finally, by statute, residential propertyis assessed at 19 percent, commercial at 32 percent, and farmland at12 percent of market value.
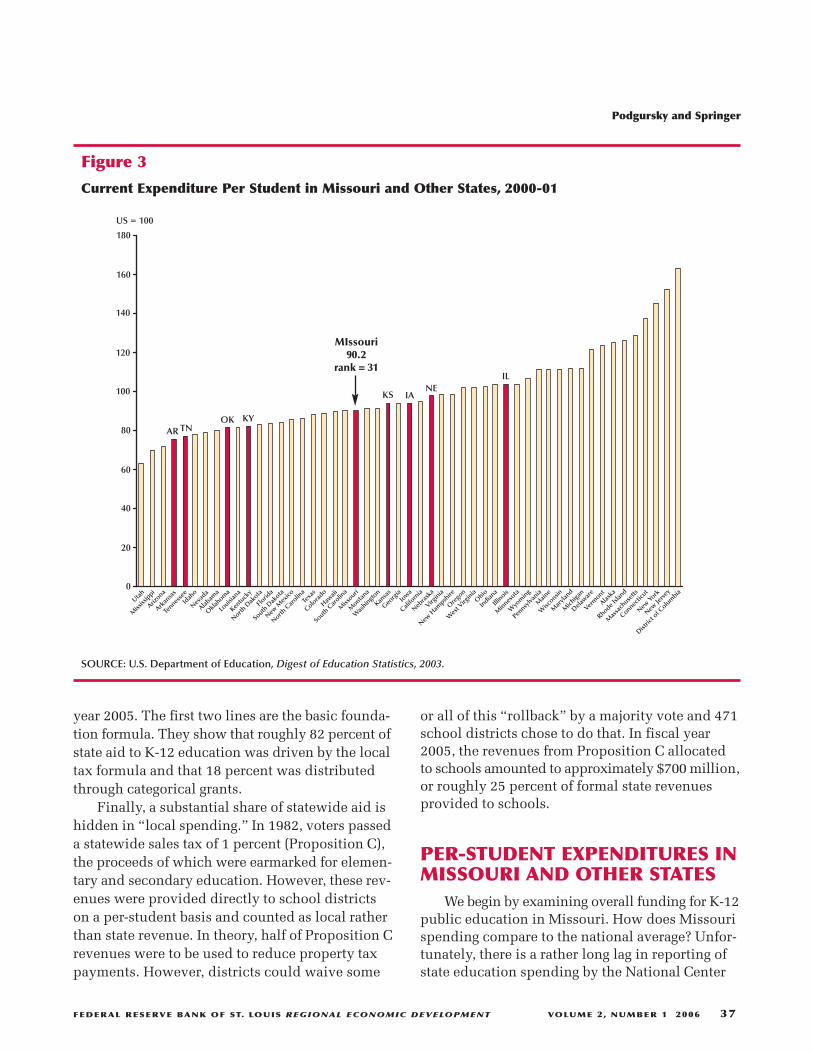
year 2005. The first two lines are the basic founda-tion formula. They show that roughly 82 percent ofstate aid to K-12 education was driven by the localtax formula and that 18 percent was distributedthrough categorical grants.
Finally, a substantial share of statewide aid ishidden in “local spending.” In 1982, voters passeda statewide sales tax of 1 percent (Proposition C),the proceeds of which were earmarked for elemen-tary and secondary education. However, these rev-enues were provided directly to school districtson a per-student basis and counted as local ratherthan state revenue. In theory, half of Proposition Crevenues were to be used to reduce property taxpayments. However, districts could waive some
or all of this “rollback” by a majority vote and 471school districts chose to do that. In fiscal year2005, the revenues from Proposition C allocatedto schools amounted to approximately $700 million,or roughly 25 percent of formal state revenuesprovided to schools.
PER-STUDENT EXPENDITURES INMISSOURI AND OTHER STATES
We begin by examining overall funding for K-12public education in Missouri. How does Missourispending compare to the national average? Unfor-tunately, there is a rather long lag in reporting ofstate education spending by the National Center
Podgursky and Springer
FEDERAL RESERVE BANK OF ST. LOUIS REGIONAL ECONOMIC DEVELOPMENT VOLUME 2, NUMBER 1 2006 37
Nevad
a
Delawar
e
Mar
yland
Rhode Isla
nd
Utah
Wyo
ming
Alaska
Wes
t Virg
inia
Louisi
ana
Florid
a
New M
exico
Idah
o
Alabam
a
Virginia
Tennes
see
Miss
issip
pi
Connectic
ut
Kentu
cky
South
Dak
ota
Colora
do
New H
ampsh
ire
Georg
ia
Ore
gon
North D
akota
Main
e
Verm
ont
Indian
a
Was
hington
Kansa
s
Arkan
sas
Arizona
Mas
sach
usetts
Iowa
Minnes
ota
Wisc
onsin
Monta
na
Pennsy
lvania
Miss
ouri
Okla
homa
Mich
igan
Nebra
ska
New Je
rsey
Ohio
New Yo
rk
Illinois
Califo
rnia
Texa
s
180
160
140
120
80
0
Hawaii
South
Car
olina
North C
arolin
a
60
40
20
Distric
t of C
olumbia
MIssouri90.2
rank = 31
KYAR TN
OK
KS IANE
IL
100
US = 100
Figure 3
Current Expenditure Per Student in Missouri and Other States, 2000-01
SOURCE: U.S. Department of Education, Digest of Education Statistics, 2003.

for Education Statistics, the data-gathering arm ofthe U.S. Department of Education. The most recentdata available are for the 2000-01 school year(National Center for Education Statistics, 2002).In that year, Missouri ranked 30th of 50 statesplus the District of Columbia. Missouri spendingper student was 90.2 percent of the U.S. average(Figure 3). That percentage has been fairly stableover time. Figure 4 reports state spending as a per-centage of the U.S. average by state for two schoolyears: 1979-80 and 2000-01. We have included a45-degree line in the chart. States above the linehave moved up relative to the U.S. average overthat period, and states below the line have moveddown. Missouri is slightly above the line; however,Missouri’s spending in both years was close to 90percent of the national average.
At first glance, these figures suggest thatMissouri underfunds elementary and secondaryeducation, at least compared with the nationalaverage. However, it is well-known that living costsvary from state to state. Although it is true that
spending per student is lower in Missouri than,say, California, so too are many other costs, suchas housing and gasoline. Unfortunately, federalstatistical agencies do not compute a cross-sectioncost of living index because the practical and con-ceptual problems with constructing such an indexare daunting. The national cost of living index(consumer price index, CPI) is designed to measurechanges in prices over time (i.e., inflation). Eachmonth, the Bureau of Labor Statistics prices outthe change in the cost of purchasing a fixed bun-dle of goods and services on a typical urban wageby a clerical worker’s family. If the CPI rises by 0.2percent, we conclude that it would take 0.2 percentmore money to buy the same bundle of goods.Thus, to compensate a typical family for inflationwould require 0.2 percent more income. As longas a family’s consumption spending patterns donot differ too radically from this average bundle,then this index would provide a rough approxi-mation of a pay increase necessary to offset thisprice increase.
Podgursky and Springer
38 VOLUME 2, NUMBER 1 2006 FEDERAL RESERVE BANK OF ST. LOUIS REGIONAL ECONOMIC DEVELOPMENT
170
100
60
60 100 170
MO
Relative Spending/Student 2000-01
Relative Spending/Student 1979-80
Figure 4
State Relative Spending Per Student, 1979-80 and 2000-01 (U.S. = 100.0)
SOURCE: U.S. Department of Education, Digest of Education Statistics, 2003. Alaska is not plotted.

A cross-section index is another matter alto-gether. It is meant to measure, for example, thedifferences in costs for a family in Worchester,Massachusetts, to maintain the same standard ofliving in St. Louis, Missouri. Simply stating theintent illustrates the conceptual problems of meas-urement. First of all, the bundles of good consumedby an average family may be very different in dif-ferent locales. Where housing is very expensive,people may live in smaller houses and spend theirmoney on a boat. Winter is much colder on averagein Worchester than in St. Louis; hence, a typicalWorchester household likely spends more on heat-ing oil. Of course, people who like the ocean and
snow are much more likely to live in Worchester.There is no easy way to account for these individualpreferences in a cross-section index.
Figures 5 and 6 provide two illustrative waysto deflate school spending. Figure 5 deflates schoolspending by a measure of housing values fromCensus 2000. With this deflator, Missouri’s relativespending and rank rise sharply. Compared with theaverage price of a house, Missouri school spendingis 20 percent above the national average, and thestate ranks 16th in the nation. However, such anindex almost certainly overadjusts Missouri’sspending for two reasons. First, the index accountsfor less than half of consumer spending, and there
Podgursky and Springer
FEDERAL RESERVE BANK OF ST. LOUIS REGIONAL ECONOMIC DEVELOPMENT VOLUME 2, NUMBER 1 2006 39
Nevad
a
Delawar
e
Mar
yland
Rhode Isla
nd
Utah
Wyo
ming
Alaska
Wes
t Virg
inia
Louisi
ana
Florid
a
New M
exico
Idah
o
Alabam
a
Virginia
Tennes
see
Miss
issip
pi
Connectic
ut
Kentu
cky
South
Dak
ota
Colora
do
New H
ampsh
ire
Georg
ia
Ore
gon
North D
akota
Main
e
Verm
ont
Indian
a
Was
hington
Kansa
s
Arkan
sas
Arizona
Mas
sach
usetts
Iowa
Minnes
ota
Wisc
onsin
Monta
na
Pennsy
lvania
Miss
ouri
Okla
homa
Mich
igan
Nebra
ska
New Je
rsey
Ohio
New Yo
rk
Illinois
Califo
rnia
Texa
s
180
160
140
120
80
0
Hawaii
South
Car
olina
North C
arolin
a
60
40
20
Distric
t of C
olumbia
Missouri120.1
rank = 16
IL100 TN
KY
AR
NE KS IA OK
US = 100
Figure 5
Current Expenditure Per Student Relative to Average Housing Prices in Missouri and Other States,2000-01
SOURCE: U.S. Department of Education, Digest of Education Statistics, 2003.

is no reason to believe that the prices of other con-sumer goods and services follow those of housing.Second, housing prices reflect the value of amenitiessuch as sunshine, scenic views, etc. Houses costmore in California than in Iowa because most peo-ple prefer California weather and amenities (e.g.,beaches and mountains). If a scientific studyshowed that living next to cornfields doubled lifeexpectancy, then you could be sure that housingprices would skyrocket in Iowa and much ofMissouri.
Figure 6 takes a different approach. Here wedeflate school spending by an index of the earningsof young people (aged 25 to 35) who have a college
degree or higher. Young people are very mobilegeographically. Thus, if real earnings, taking intoaccount living costs and amenities, are higher inCalifornia than Idaho, we would expect young peo-ple to migrate from the latter to the former. Thismigration would tend to raise the earnings in Idahoand reduce them in California. The relative payadjustment would continue until net migrationhalted, at which point any remaining pay gap wouldreflect the “value” of living in California relativeto Idaho. It is interesting to note that there is onlya modest effect on Missouri’s position when wedeflate Missouri education spending by collegegraduate earnings. Indeed, instructional spending
Podgursky and Springer
40 VOLUME 2, NUMBER 1 2006 FEDERAL RESERVE BANK OF ST. LOUIS REGIONAL ECONOMIC DEVELOPMENT
Nevad
a
Delawar
e
Mar
yland
Rhode Isla
nd
Utah
Wyo
ming
Alaska
Wes
t Virg
inia
Louisi
ana
Florid
a
New M
exico
Idah
o
Alabam
a
Virginia
Tennes
see
Miss
issip
pi
Connectic
ut
Kentu
cky
South
Dak
ota
Colora
do
New H
ampsh
ire
Georg
ia
Ore
gon
North D
akota
Main
e
Verm
ont
Indian
a
Was
hington
Kansa
s
Arkan
sas
Arizona
Mas
sach
usetts
Iowa
Minnes
ota
Wisc
onsin
Monta
na
Pennsy
lvania
Miss
ouri
Okla
homa
Mich
igan
Nebra
ska
New Je
rsey
Ohio
New Yo
rk
Illinois
Califo
rnia
Texa
s
180
160
140
120
80
0
Hawaii
South
Car
olina
North C
arolin
a
60
40
20
Distric
t of C
olumbia
Missouri93.5
rank = 30
IL
100
TN
KYAR
INKS
IA
OK
US = 100
Figure 6
Current Expenditure Per Student Relative to Young College Graduates’ Earnings in Missouri andOther States, 2000-01
SOURCE: Spending per student: U.S. Department of Education, Digest of Education Statistics, 2003; doctor and dentist annual incomes,2000 Census of Households, 5 percent public use microdata sample (PUMS) computed by author.

is 93 percent of the U.S. average, and Missouri’srank rises just one position, from 31st to 30th.
We conclude from this exercise that Missouri’s“real” spending for K-12 education may be some-what closer to the national average than Figure 2suggests, but it is probably not above the nationalrate.
VARIATION IN SCHOOL SPENDINGBETWEEN DISTRICTS
One concern in school finance is equity or“fairness.” However, there are different notions ofwhat constitutes fairness in school spending. Manyresearchers in the field distinguish “horizontal”and “vertical” equity (e.g., Berne and Stiefel, 1983).If real spending per student were identical for allstudents in the state, regardless of family back-
ground, location, or need, that would constituteperfect horizontal equity. Vertical equity, on theother hand, takes account of need and seeks toequalize educational opportunity or outcomesgiven gaps in family incomes. If more spendingper student is required to equalize educationalopportunity for children from poor families, thenthe ideal distribution of spending from this pointof view would not be equal but compensating.
Horizontal equity is the easiest to measure.The measure we will use is the ratio of the naturallogarithm of spending per student at the 95th and5th percentiles, a measure commonly used instudies of horizontal equity (e.g., Murray, Evans,and Schwab, 1998; Hussar and Sonnenberg, 2000).This measure has two desirable properties. First,with so many small districts in Missouri, theimpact of extreme outliers is attenuated. Second,the approach allows us to decompose trends in
Podgursky and Springer
FEDERAL RESERVE BANK OF ST. LOUIS REGIONAL ECONOMIC DEVELOPMENT VOLUME 2, NUMBER 1 2006 41
AR (312)
IL (893)
IA (371)
KS (304)
MO (522)
NB (555)
OK (543)
TN (138)
KY (176)
0.9
0.8
0.7
0.6
0.5
0.4
0.3
0.2
0.1
01972 1977 1982 1987 1992 1997 2002
ln(95/05)
Figure 7
Measured Inequality in Current Spending Per Student in Missouri and Surrounding States,1972-2002
NOTE: Inequality measure: (ln(95th//5th percentiles)). Number of regular school districts (2002) are in parentheses in the legend.
SOURCE: U.S. Census Bureau, Elementary and Secondary School System Finance Data Files (F-33).

inequality above and below the median of the dis-tribution of spending.6
Figures 7 shows inequality trends in resourcedistribution from 1972-2002 for Missouri and sur-rounding states. During the 1972-92 period, Missouriclearly diverged from the trend in these states.While there was a general upward drift in inequalityin the surrounding states, the increase was muchmore pronounced in Missouri. The leveling effectof the 1995 School Improvement Act is also visible.Nonetheless, by the end of the period, spendinginequality was still significantly higher in Missouri.
Figure 8 presents data on “vertical equity” inschool spending in Missouri and its neighbors.Here we plot the correlation between average spend-ing per student and student poverty (i.e., the percentof students eligible for free or reduced-price
lunches) between 1990 and 2000. (2000 is themost recent year for which free or reduced lunchdata are available by district for all these states.)Here the story changes considerably. In all of thesestates there is a positive correlation between spend-ing and student poverty. In Missouri the averagecorrelation between student poverty and schoolspending hovers around 0.4. In other words, whendistricts are weighted by enrollments, on averagedistricts with more students in poverty have higherspending per student. While there was some con-vergence at the end of the period, over the periodas a whole, spending was more equal in Missourithat most of its neighbors as measured by this ver-tical equity measure.
Figure 9 examines another dimension of verti-cal equity: racial spending disparities. The largegap between black and white test scores is well-documented. For example, the gap in the Missouristate assessment scores between black and white
Podgursky and Springer
42 VOLUME 2, NUMBER 1 2006 FEDERAL RESERVE BANK OF ST. LOUIS REGIONAL ECONOMIC DEVELOPMENT
AR (312)IL (893)IA (371)KS (304)MO (522)NB (555)OK (543)TN (138)KY (176)
0.8
0.7
0.6
0.5
0.4
0.3
0.2
0.1
01990 1991 1992 1993 1994 1995 1996
–0.1
1997 1998 1999 2000
Figure 8
Correlation Between Current Spending Per Student and Student Poverty in Missouri andSurrounding States, 1990-2000
NOTE: Inequality measure: (ln(95th//5th percentiles)). Number of regular school districts (2002) are in parentheses in the legend.
SOURCE: National Center for Education Statistics, Longitudinal School District Fiscal-Nonfiscal Data File.
6 All of our measures of inequality are weighted by student enrollmentin the district.

students is nearly 1 standard deviation—a verylarge gap. Thus, one might view as favorable spend-ing inequality that arises from high compensatoryspending in districts with more minority students.Figure 9 shows the correlation between the percent-age of minority students and school spending inMissouri and adjacent states. There is a strong pos-itive correlation in Missouri—much larger than anyof the surrounding states.
Thus, by horizontal equity measures, Missouriinterdistrict inequality seems relatively high, atleast compared with neighboring states. However,from a vertical equity perspective, Missouri com-pares favorably, with much of the spending inequal-ity having a compensatory character.
“ADEQUACY” AND THE NEW SYSTEM
The school finance system put in place afterthe 1993 lawsuit proved difficult to sustain. Fully
funding the formula would tie school spending notto tax revenues or personal income, but to housingprice inflation, in particular, housing price inflationin the wealthiest school districts in the state. Itturns out that the guaranteed tax base rose some-what faster than personal income per capita, andconsiderably faster than the CPI between 1996 and2004 (Figure 10). Faced with a second-generationadequacy-based legal challenge, the Missouri legis-lature revamped the school finance system duringthe 2005 legislative session. The first wave of schoolfinance cases focused on the fact that, because ofdifferent levels of property wealth per student, localschool districts with identical tax rates could endup with very different levels of educational rev-enues. However, plaintiffs in the new round ofschool finance lawsuits claim a different constitu-tional standard, namely that the overall level ofspending in high-poverty school districts is simplynot adequate to meet state educational goals. Underthe No Child Left Behind Act (NCLB), in theory
Podgursky and Springer
FEDERAL RESERVE BANK OF ST. LOUIS REGIONAL ECONOMIC DEVELOPMENT VOLUME 2, NUMBER 1 2006 43
AR (312)IL (893)IA (371)KS (304)MO (522)NB (555)OK (543)TN (138)KY (176)
0.8
0.7
0.6
0.5
0.4
0.3
0.2
0.1
01990 1991 1992 1993 1994 1995 1996
–0.1
1997 1998 1999 2000
0.9
–0.2
Figure 9
Correlation Between Current Spending, Per-Student Spending and Percent Minority in Missouriand Surrounding States, 1990-2000

school districts are expected to have all studentsproficient or better on state assessments by 2014.States, in general, set somewhat less ambitiouseducational goals, but nonetheless expect schooldistricts with low levels of performance on stateassessments to raise proficiency overall and closeachievement gaps.
In principle, one might estimate a level ofspending that would be the minimum necessaryto achieve these educational goals. In Missouri, astudy commissioned by the Missouri School Boards’Association by two educational consultants,Augenblick and Myers (2003), attempted to do justthat. These authors took two approaches. The first,a “professional judgment” approach, convened apanel of Missouri public school teachers andadministrators. These panels were charged withthe task of determining a bundle of resources thatwould enable schools to meet state targets for stu-dent achievement. They were also charged withpricing this bundle of inputs. Specifically, the
spending target, based on 2001-02 costs, was theamount of money required for all students to attaina “nearing proficient or higher” score on the MAPtests in communications and math. Like all stateassessments, the MAP is criterion-referenced withfive performance levels: level 1 (unnamed), advanc-ing, nearing proficient, proficient, and advanced.NCLB requires that all children be “proficient” or“advanced” on their state assessment by 2014 andmake adequate yearly progress toward that goal inthe interim. Augenblick and Myers (2003) set alower target of “nearing proficient or higher” fortheir expert panels. These panels arrived at an esti-mate of $7,832 per student to achieve this target.7
Augenblick and Myers then took a second,“successful schools” approach to determining
7 “Professional judgment” estimates have become very popular.According to Education Week, by the end of 2004 professional judg-ment studies had been undertaken for 15 states (Education Week,2005, pp. 38-39). For a critical assessment of these methods, seeHanushek (2005).
Podgursky and Springer
44 VOLUME 2, NUMBER 1 2006 FEDERAL RESERVE BANK OF ST. LOUIS REGIONAL ECONOMIC DEVELOPMENT
145
140
135
130
125
120
115
110
105
100 GTB MO Per Capita PI CPI
138.14
135.75
120.34
1996 = 100
Figure 10
Inflation in Guaranteed Tax Base (GTB), Missouri Per Capita Personal Income (PI), and ConsumerPrice Index (CPI), 1996-2004
NOTE: GTB values from 1996-97 to 2004-05, PI for calendar years, CPI September values.
SOURCE: Missouri Department of Elementary and Secondary Education, U.S. Commerce Department, Bureau of Labor Statistics.

adequacy. Each year the Missouri Department ofElementary and Secondary Education scores everyschool district in the state on the basis of MAP per-formance and related academic variables such as thepercentage of students taking the ACT. Augenblickand Myers computed the average spending of 102school districts that had perfect or nearly perfectscores on this report card ($5,664). This was theirsecond measure of adequacy.8 Obviously, these arevery different numbers. Augenblick and Myers triedto reconcile the disparity by arguing that, becauseonly 61 percent of students in the successful schoolsmet the “nearing proficient and above” standardand the expert panel target was based on 100 per-cent proficiency, 61 percent of $7,832 is close to$5,664.9
Although the state legislature did not adoptAugenblick and Myers’s estimates wholesale, theydid adopt the principle of an “adequacy” targetbased on a “successful schools” perspective. Recallthat under the old finance regime what becameequalized was revenue for identical tax effort. Thisformula embodied a concept of fairness that said,in effect, if district X set the same property tax rateas district Y, then both should collect the same taxrevenues. By tying state aid to local fiscal effort,poorer school districts leveraged local tax dollarswith matching state aid. The “adequacy” conceptemploys a very different approach, claiming thereis a minimum adequate level of spending and thatit is the responsibility of the state government tomake certain the level of spending per student meetsthat target regardless of local tax effort. Low-incomedistricts that tax themselves at a high rate willretain those dollars and will not lose equivalent
amounts of state aid. However, those local dollarswill no longer be leveraged.
In 2005, the legislature determined that theminimum adequate level of spending was $6,117dollars per student. The legislature arrived at thisfigure by calculating the average operating spendingper student for the 113 districts with perfect ornearly perfect scores on the annual performancereport (APR) conducted by the Department ofElementary and Secondary Education; these scoresare heavily weighted toward performance on theMAP assessment. This figure will be recomputedevery two years. In theory, the figure could go down;however Senate Bill 287 specifies that the old levelwill stay in effect should that occur.
Simplified greatly, the new formula worksroughly as follows:
Foundation aid = (weighted ADA × $6,117) – ($3.43 × Local Tax Base).
There are no penalties in this formula for local taxeffort. Districts keep every dollar of tax revenueraised locally. However, there will no longer be aleverage effect for low-wealth districts. Each districtwill get a dollar of educational spending for everydollar raised locally. In other words, the “tax price”of additional local spending will be 100 percent(Hoxby, 2001).
Several other changes were made as well.Because the new system was predicated on the con-cept of an adequate level of resources, a questionof cost-of-living arose. As of 2004, nine states usedintrastate cost-of-living adjustments in their stateaid formula (Education Week, 2005). Until now,Missouri had not. Clearly, cost-of-living adjustmentswill tend to reduce payments to rural districts,while raising payments to urban and suburbandistricts. The new system phases in a cost-of-livingadjustment based on average earnings in the countyor the metropolitan area. The new system alsoadjusts student counts for poverty and limitedEnglish proficiency populations if they exceedcertain thresholds. Some categorical aid is also nowfolded into the basic aid. Finally, the new fundingmechanism will be phased in over seven years. Inthe first year, only 15 percent of district aid is deter-mined by the new formula. This figure rises in astepwise fashion to 100 percent by the 2012-13school year.
8 By construction, many of the “successful schools” will have spendingthat is less than adequate. In fact, 69 of 102 successful school districtsspent less than $5,664 per student. Note that Augenblick and Myersestimate costs to educate a regular student (i.e., one who is not poorand does not have limited proficiency in English). Poor studentsand English-language learners are assumed to cost more.
9 This argument assumes that there is a proportionate relationshipbetween spending and student achievement, i.e. that if district Aspends twice as much as district B, then twice as many students willbe nearing proficient or above. They present no evidence in supportof this assumption. In fact, actual test data in spring 2002, the testdata used by the consultants, cast some doubt on the “professionaljudgment” estimate. In spring 2002 only 12 K-12 school districts had100 percent of their students “nearing proficient” or above on themath and communications arts assessments at all grade levels andall 12 of these districts spent less than $7,832 per student.
Podgursky and Springer
FEDERAL RESERVE BANK OF ST. LOUIS REGIONAL ECONOMIC DEVELOPMENT VOLUME 2, NUMBER 1 2006 45
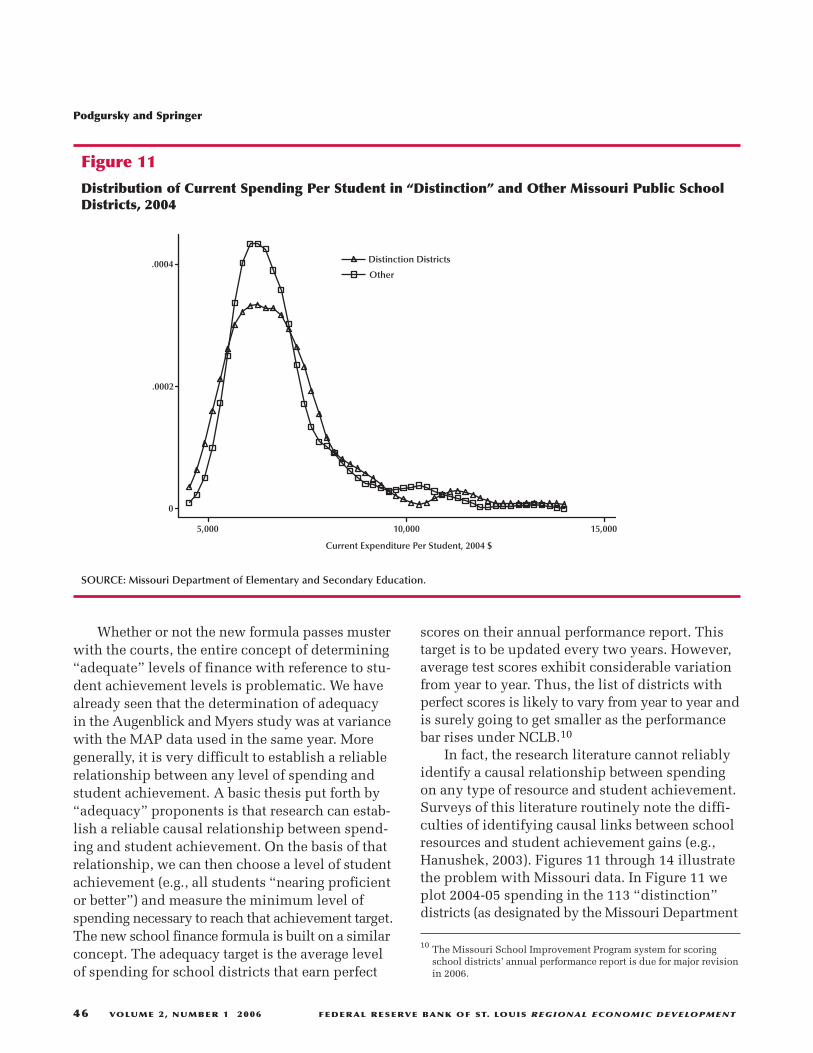
Whether or not the new formula passes musterwith the courts, the entire concept of determining“adequate” levels of finance with reference to stu-dent achievement levels is problematic. We havealready seen that the determination of adequacyin the Augenblick and Myers study was at variancewith the MAP data used in the same year. Moregenerally, it is very difficult to establish a reliablerelationship between any level of spending andstudent achievement. A basic thesis put forth by“adequacy” proponents is that research can estab-lish a reliable causal relationship between spend-ing and student achievement. On the basis of thatrelationship, we can then choose a level of studentachievement (e.g., all students “nearing proficientor better”) and measure the minimum level ofspending necessary to reach that achievement target.The new school finance formula is built on a similarconcept. The adequacy target is the average levelof spending for school districts that earn perfect
scores on their annual performance report. Thistarget is to be updated every two years. However,average test scores exhibit considerable variationfrom year to year. Thus, the list of districts withperfect scores is likely to vary from year to year andis surely going to get smaller as the performancebar rises under NCLB.10
In fact, the research literature cannot reliablyidentify a causal relationship between spendingon any type of resource and student achievement.Surveys of this literature routinely note the diffi-culties of identifying causal links between schoolresources and student achievement gains (e.g.,Hanushek, 2003). Figures 11 through 14 illustratethe problem with Missouri data. In Figure 11 weplot 2004-05 spending in the 113 “distinction”districts (as designated by the Missouri Department
10 The Missouri School Improvement Program system for scoringschool districts’ annual performance report is due for major revisionin 2006.
Podgursky and Springer
46 VOLUME 2, NUMBER 1 2006 FEDERAL RESERVE BANK OF ST. LOUIS REGIONAL ECONOMIC DEVELOPMENT
.0004
.0002
0
5,000 10,000 15,000
Distinction Districts
Other
Current Expenditure Per Student, 2004 $
Figure 11
Distribution of Current Spending Per Student in “Distinction” and Other Missouri Public SchoolDistricts, 2004
SOURCE: Missouri Department of Elementary and Secondary Education.

Podgursky and Springer
FEDERAL RESERVE BANK OF ST. LOUIS REGIONAL ECONOMIC DEVELOPMENT VOLUME 2, NUMBER 1 2006 47
50
0
–50
50
0
–50
100
–2,000 2,000 4,000 6,000 2,000 4,000 6,0000 0
Communication Arts, Grade 3 Math, Grade 4
Change in Spending 1999-2004 ($) Change in Spending 1998-2004 ($)
Figure 12
Changes in Elementary School MAP Scores and Spending Per Student: First Mandatory MAP Year to 2004
NOTE: All reported District MAP scores with at least 25 valid test scores in beginning and ending year.
SOURCE: Missouri Department of Elementary and Secondary Education.
–100
–50
0
50
100
–50
0
50
100
150
–2,000 2,000 4,000 6,000 2,000 4,000 6,0000 0
Communication Arts, Grade 7 Math, Grade 8
Change in Spending 1999-2004 ($) Change in Spending 1998-2004 ($)
Figure 13
Changes in Middle School MAP Scores and Spending Per Student: First Mandatory MAP Year to 2004
NOTE: All reported District MAP scores with at least 25 valid test scores in beginning and ending year.
SOURCE: Missouri Department of Elementary and Secondary Education.

of Elementary and Secondary Education). Averagespending in these districts forms the basis of the“adequate” spending estimate in the new law. Wealso plot spending per student in the 409 remaining“non-distinction” districts.
If spending per student were an importantdeterminant of school performance, we wouldexpect to see two things. First, the level of spendingfor distinction districts would be noticeably higher.Second, we would expect a tight distribution ofspending around the higher distinguished mean.After all, districts that are more homogeneous intheir performance ought to be more homogeneousin their spending, if spending is an important deter-minate of performance. In fact, we observe neither.Although the mean of the distinction districts isslightly higher, the two distributions overlap almostentirely. In addition, spending among the distinc-tion districts is noticeably more dispersed thanamong the non-distinction districts.
Figures 12 through 14 give us some indicationof how reliably we can predict achievement gains
given changes in expenditure per student. In thesecharts we plot changes in student achievement onMAP from the first mandatory testing year, 1998for math and 1999 for communication arts, tospring 2004. We plot these student achievementchanges against changes in spending per student.To reduce the statistical “noise” in the changes intest scores, we include only districts with at least25 students taking the test in both the beginningand ending years. For the most part, the relationbetween changes in spending and changes in testscores is very erratic and nearly random. Only inthird grade communication arts do we find a sta-tistically significant positive relationship. Thesecharts further undermine the proposition that levelsor changes in spending can reliably predict schoolperformance.
CONCLUSIONThe level and distribution of spending for
public K-12 education remains a contentious matter
Podgursky and Springer
48 VOLUME 2, NUMBER 1 2006 FEDERAL RESERVE BANK OF ST. LOUIS REGIONAL ECONOMIC DEVELOPMENT
–40
–20
0
20
40
–50
0
50
10060
–2,000 2,000 4,000 6,000 2,000 4,000 6,0000 0
Communication Arts, Grade 11 Math, Grade 10
Change in Spending 1999-2004 ($) Change in Spending 1998-2004 ($)
Figure 14
Changes in High School MAP Scores and Spending Per Student: First Mandatory MAP Year to 2004
NOTE: All reported District MAP scores with at least 25 valid test scores in beginning and ending year.
SOURCE: Missouri Department of Elementary and Secondary Education.

of policy in many states because of increasingexpectations for school performance and wide-spread litigation. Missouri is no exception. In thispaper, we have examined the level and trend ofschool funding in Missouri over the past decadeand a half. The old system was put in place inresponse to litigation challenging inequality inspending. It aimed to provide a guaranteed tax basefor nearly all school districts and thereby equalizerevenues for districts exerting the same tax effort.Rapid increases in housing values in high-wealthdistricts in the state as well as sharp declines instate revenues made that system unworkable. A newsystem is now being phased in as a response toclaims about educational “adequacy” and purportedlinks between spending and student achievement.While the notion of a minimum adequate level ofspending for all students may be attractive philo-sophically, attempts to establish adequacy basedon levels of student performance are problematic.There is little basis in education research generallyor in Missouri’s experience with the MAP for estab-lishing a level of district spending that can reliablyproduce a given level of student achievement.
REFERENCESAugenblick, John and Myers, John. “Calculation of the
Cost of an Adequate Education in Missouri Usingthe Professional Judgment and the Successful SchoolDistrict Approaches.” Missouri Coalition for Adequacy,2003; www.msbanet.org/pdf/adequacy.pdf.
Berne, Robert and Stiefel, Leanna. The Measurement ofEquity in School Finance: Conceptual, Methodological,and Empirical Dimensions. Baltimore, MD: JohnsHopkins University Press, 1983.
Committee for Educational Equality v. State of Missouri(MO), No. CV190-1371CC, slip op. (1993).
Edgewood School District v. Kirby (TX), 777 S.W.2d391 (1989).
Education Week. “Quality Counts.” 2005, 24(7), pp.38-39.
Hanushek, Eric A. “The Failure of Input-Based
Schooling Policies.” The Economic Journal, February2003, 113(485), pp. F64-98.
Hanushek, Eric A. “Pseudo-Science and Sound BasicEducation: Voodoo Statistics in New York.” EducationNext, Fall 2005, 5(4), pp. 67-73.
Hembree, Russ. “The Hancock Amendment: Missouri’sTax Limitation Measure.” Report 49-2004, Universityof Missouri, Truman School of Public Affairs, MissouriLegislative Academy, 2004;http://truman.missouri.edu/uploads/Publications/MLA%2049-2004.pdf.
Hoxby, Caroline M. “All School Finance Equalizationsare Not Created Equal.” Quarterly Journal ofEconomics, 2001, 116(4), pp. 1189-231.
Hoxby, Caroline M. and Kuzienko, Ilyana. “Robin Hoodand His Not So Merry Plan: Capitalization and theSelf-Destruction of Texas’ School Finance EqualizationPlan.” NBER Working Paper 10722, National Bureauof Economic Research, August, 2004.
Hussar, William and Sonnenberg, William. Trends inDisparities in School District Level ExpendituresPer-Pupil. Washington, DC: National Center forEducation Statistics, 2000.
Kane, Thomas J.; Orszag, Peter R. and Gunter, David L.State Fiscal Constraints and Higher EducationSpending: The Role of Medicaid and the BusinessCycle. Washington, DC: Brookings Institution, 2003.
Ladd, Helen F. and Hansen, Janet S. Making MoneyMatter: Financing America’s Schools. Washington, DC:National Academy Press, 1999.
Murray, Sheila E.; Evans, William N. and Schwab,Robert M. “Education-Finance Reform and theDistribution of Education Resources.” AmericanEconomic Review, September 1998, 88(4), pp. 789-812.
National Center for Education Statistics. Digest ofEducation Statistics, 2002. Washington, DC: UnitedStates Department of Education, 2002.
Roza, Marguerite and Hill, Paul T. “How Within-DistrictSpending Inequities Help Some Schools Fail,” inDiane Ravitch, ed., Brookings Papers on Education
Podgursky and Springer
FEDERAL RESERVE BANK OF ST. LOUIS REGIONAL ECONOMIC DEVELOPMENT VOLUME 2, NUMBER 1 2006 49

Policy, 2004. Washington, DC: Brookings Institution,2004, pp. 201-28.
Rose v. Council for Better Education (KY), 790 S.W.2d186, 60 Ed. Law Rep. 1289 (1989).
Serrano v. Priest (CA), 5 Cal. 3d. 584, 96 Cal Rptr. 601,487 P. 2d. 1241 (1971).
Podgursky and Springer
50 VOLUME 2, NUMBER 1 2006 FEDERAL RESERVE BANK OF ST. LOUIS REGIONAL ECONOMIC DEVELOPMENT

FEDERAL RESERVE BANK OF ST. LOUIS REGIONAL ECONOMIC DEVELOPMENT VOLUME 2, NUMBER 1 2006 51
School Accountability and Student Performance
Eric A. Hanushek and Margaret E. Raymond
• despite positive effects overall, recent workshows that these policy instruments are noteffective in repairing existing disparities inperformance by race.
THE IMPORTANCE OF SCHOOLQUALITY
Much research on how schooling affects indi-vidual earnings has focused merely on attainment,or the quantity of schooling, but more-recentresearch has turned to issues of quality. This alter-native focus is consistent with the current attentionpolicymakers are paying to student testing andaccountability in the United States, UnitedKingdom, and elsewhere.1
Recent research in the United States shows thatthe quality of schooling relates to real differencesin earnings and attainment. Three recent studiesprovide direct and quite consistent estimates of the
S ince the passage of the No Child LeftBehind Act (NCLB), a common questionhas been: Is it working? Of course, analyz-ing the overall impacts of NCLB is diffi-
cult if not impossible. The policies are very recent.But, more than that, there is no obvious compari-son group because all states fall under the purviewof NCLB. Nonetheless, because many states hadpreviously introduced their own accountabilitysystems—systems that became the heart of moststates’ responses to NCLB—it is possible to exam-ine these states’ experiences and infer many of theoverall effects of the federal legislation.
This paper presents a nontechnical overviewof the findings of analyses of state accountability.It summarizes three central results:
• Performance on typical “state accountability”standardized tests is tied directly to economiceffects;
• accountability policies in general lead tohigher levels of achievement, though themagnitudes of the effects are influenced bythe design of the policy; and,
The introduction of student accountability systems across the United States has been controversialboth because of its focus on standardized achievement tests and because of questions about itseffectiveness. Past evidence, however, shows that performance on standardized tests of the typecentral to state accountability systems has powerful economic effects. Additionally, analysis ofperformance across states indicates that accountability policies in general lead to higher levels ofachievement, though the magnitudes of the effects are influenced by the design of the policy. Finally,however, despite positive effects overall, recent work shows that these policy instruments are noteffective at closing the black-white achievement gap.
Federal Reserve Bank of St. Louis Regional Economic Development, 2006, 2(1), pp. 51-61.
1 A more complete discussion of the issues in this section can befound in Hanushek (2004): www.hanushek.net.
Eric A. Hanushek is the Paul and Jean Hanna Senior Fellow, and Margaret E. Raymond is the director of CREDO (Center for Research on EducationOutcomes) at the Hoover Institution, Stanford University.
© 2006, The Federal Reserve Bank of St. Louis. Articles may be reprinted, reproduced, published, distributed, displayed, and transmitted intheir entirety if copyright notice, author name(s), and full citation are included. Abstracts, synopses, and other derivative works may be madeonly with prior written permission of the Federal Reserve Bank of St. Louis.

impact of test performance on earnings (Mulligan,1999; Murnane et al., 2000; and Lazear, 2003). Thesestudies use different nationally representative datasets that follow students after they leave school andenter the labor force. When scores are standardized,they suggest that a 1-standard-deviation increasein mathematics performance at the end of highschool translates into 12 percent higher annualearnings.2
Figure 1 graphically portrays the impact ofhigher quality of schooling: Comparing the medianearnings in 2001 of a typical individual in theUnited States with the amount they would earn ifthe quality of their schooling had been 1 standarddeviation higher (i.e., if their measured achievement
changed from the 50th percentile to the 84th) showsthat expected earnings shifts upward by some 12percent each year throughout their working career.Although the research is less extensive, similar orlarger magnitudes of earnings improvement havebeen found in other countries.
Moreover, although not shown in this figure,there are additional gains that would accrue becauseindividuals with greater skills tend to continuefarther in schooling—that is, to have higher schoolattainment. Murnane et al. (2000) separate the directreturns to measured skill from the indirect returnsto more schooling and suggest that perhaps one-third to one-half of the full return to higher achieve-ment comes from further schooling. (Figure 1 showsjust the direct effects of skills, not including theindirect effects from added schooling.) Note alsothat the other side of increases in school attainmentfrom quality improvements is a decrease in schooldrop-out rates. Specifically, higher student achieve-ment keeps students in school longer, which willlead to, among other things, higher graduationrates at all levels of schooling.
Another place to look for the economic impactof school quality is the effect on the growth in
Hanushek and Raymond
52 VOLUME 2, NUMBER 1 2006 FEDERAL RESERVE BANK OF ST. LOUIS REGIONAL ECONOMIC DEVELOPMENT
45,000
40,000
35,000
30,000
25,000
20,00025-34 35-44 45-54 55-64
Dollars
Age
1.0 SD Reform
Median Earnings: 2001
Figure 1
Median U.S. Individual Earnings with 1.0 SD Reform
NOTE: SD is standard deviation.
2 Murnane et al. (2000) provide evidence from the “High School andBeyond” survey and the national longitudinal survey of the highschool class of 1972. Their estimates suggest some variation: malestudents obtain a 15 percent increase and female students a 10 percentincrease in earnings per standard deviation of test performance.Lazear (2003), relying on a somewhat younger sample from thenational education longitudinal study of 1988, provides a singleestimate of 12 percent. These estimates are also very close to thosein Mulligan (1999), who finds 11 percent for the normalized ArmedForces Qualification Test in the national longitudinal survey of youthdata. By way of comparison, estimates of the value of an additionalyear of school attainment are typically 7 to 10 percent.

national income. Economists have demonstratedthat productivity gains that are directly related tohuman capital fuel increases in the gross domesticproduct (GDP) of a nation. GDP growth, in turn, iswhat improves the standard of living for its citizens.Furthermore, the benefits of productivity growthcompound over time, to dramatic effect. With U.S.economic levels as shown in Figure 2, if the econ-
omy grew by 1 percent per year starting in 2000,GDP per capita would increase by 65 percent by2050. Were the economy of the United States togrow at 2 percent per year, the GDP per capita wouldgo from roughly $35,000 to over $94,000.
Research on how school quality affects growthshows that a 1-standard-deviation increase in stu-dent achievement (moving from the 50th to the 84th
Hanushek and Raymond
FEDERAL RESERVE BANK OF ST. LOUIS REGIONAL ECONOMIC DEVELOPMENT VOLUME 2, NUMBER 1 2006 53
0
20,000
40,000
60,000
80,000
100,000
2000 2010 2020 2030 2040 2050
GDP per Capita (2000 $)
2% Annual Growth
1% Annual Growth
No Growth
$94,071
$57,480
Figure 2
Effect of Economic Growth on U.S. Income
0.0
2.0
4.0
6.0
8.0
2005 2010 2015 2020 2025 2030 2035 2040
Percent Additions to GDP
10-year Reform
20-year Reform
30-year Reform
Figure 3
Improved GDP with Moderately Strong Knowledge Improvement
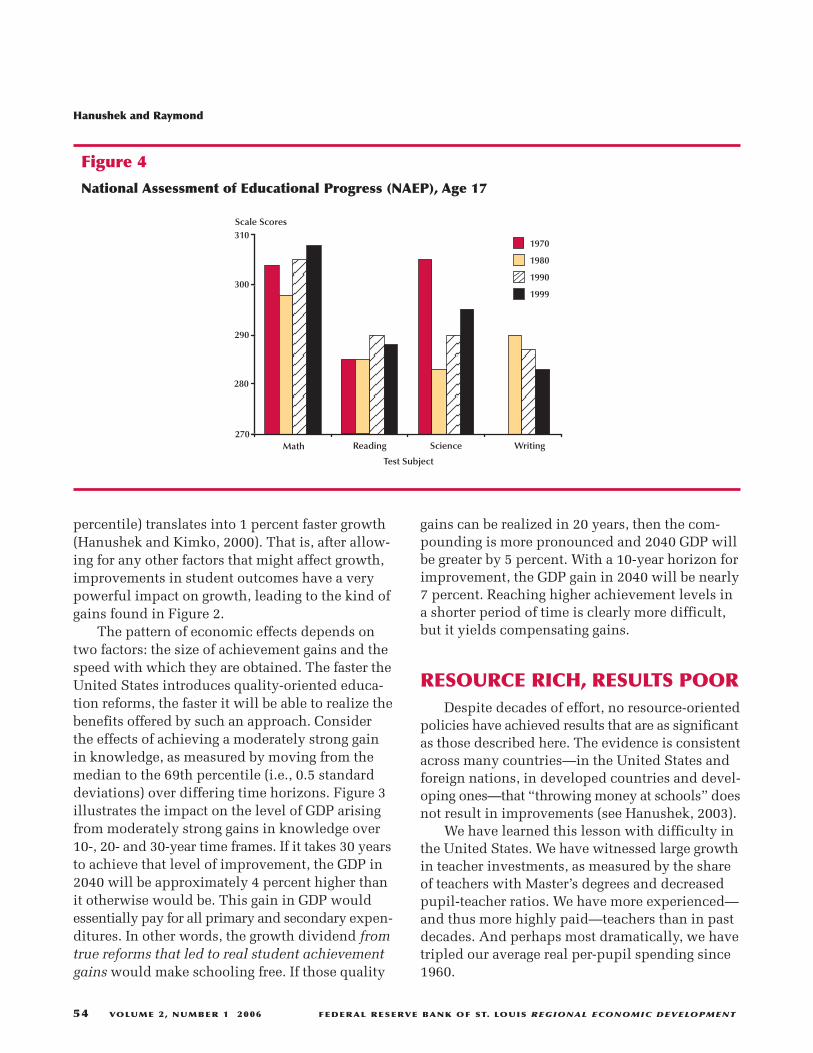
percentile) translates into 1 percent faster growth(Hanushek and Kimko, 2000). That is, after allow-ing for any other factors that might affect growth,improvements in student outcomes have a verypowerful impact on growth, leading to the kind ofgains found in Figure 2.
The pattern of economic effects depends ontwo factors: the size of achievement gains and thespeed with which they are obtained. The faster theUnited States introduces quality-oriented educa-tion reforms, the faster it will be able to realize thebenefits offered by such an approach. Considerthe effects of achieving a moderately strong gainin knowledge, as measured by moving from themedian to the 69th percentile (i.e., 0.5 standarddeviations) over differing time horizons. Figure 3illustrates the impact on the level of GDP arisingfrom moderately strong gains in knowledge over10-, 20- and 30-year time frames. If it takes 30 yearsto achieve that level of improvement, the GDP in2040 will be approximately 4 percent higher thanit otherwise would be. This gain in GDP wouldessentially pay for all primary and secondary expen-ditures. In other words, the growth dividend fromtrue reforms that led to real student achievementgains would make schooling free. If those quality
gains can be realized in 20 years, then the com-pounding is more pronounced and 2040 GDP willbe greater by 5 percent. With a 10-year horizon forimprovement, the GDP gain in 2040 will be nearly7 percent. Reaching higher achievement levels ina shorter period of time is clearly more difficult,but it yields compensating gains.
RESOURCE RICH, RESULTS POORDespite decades of effort, no resource-oriented
policies have achieved results that are as significantas those described here. The evidence is consistentacross many countries—in the United States andforeign nations, in developed countries and devel-oping ones—that “throwing money at schools” doesnot result in improvements (see Hanushek, 2003).
We have learned this lesson with difficulty inthe United States. We have witnessed large growthin teacher investments, as measured by the shareof teachers with Master’s degrees and decreasedpupil-teacher ratios. We have more experienced—and thus more highly paid—teachers than in pastdecades. And perhaps most dramatically, we havetripled our average real per-pupil spending since1960.
Hanushek and Raymond
54 VOLUME 2, NUMBER 1 2006 FEDERAL RESERVE BANK OF ST. LOUIS REGIONAL ECONOMIC DEVELOPMENT
Scale Scores
Test Subject
Math Reading Science Writing
310
300
290
280
270
1970
1980
1990
1999
Figure 4
National Assessment of Educational Progress (NAEP), Age 17

But the rewards are slim to none. As shown inFigure 4, U.S. performance on the National Assess-ment of Educational Progress (NAEP) has gainedonly slightly in reading and math and has actuallydeclined in science and writing. This is hardly asterling endorsement for increasing spending further.
The international picture is similarly unsup-portive. If resources were significantly and posi-tively related to performance, one would expectto see that countries who scored the highest in theTrends in International Math and Science Study(TIMSS) would spend the most and that lower-performing countries would spend less. However,as laid out in Figure 5, which ranks countries byTIMSS performance, no such pattern exists. Of note,the United States is among the countries with thehighest expenditures but ranks near the middle interms of performance.
FOCUS ON ACCOUNTABILITYOver the past decade, a sea change has occurred
in the design of education policies in many coun-
tries around the globe.3 Policies have shifted fromattending to inputs and processes to a focus on theoutcomes realized by students. The change hasemerged through the widening practice of testingstudents against a common set of expectations aboutlearning objectives for each grade. Thus, standards,testing, and accountability go hand in hand.
Where countries have a single education admin-istration, as in Taiwan or the United Kingdom,students often face national exams. Countries withfederal systems of government in which educationis a federal responsibility operate in similar ways.In the United States, the responsibility for educa-tion resides in the 50 individual states. Over thepast 10 years, states have adopted their own poli-cies at different times, which created a diversityof accountability policies and testing programs aswell as different adoption dates. States differedalso in the use of rewards and sanctions. Figure 6
3 The explicit modeling of accountability is fully developed inHanushek and Raymond (2005). This section relies on the results inthat study.
Hanushek and Raymond
FEDERAL RESERVE BANK OF ST. LOUIS REGIONAL ECONOMIC DEVELOPMENT VOLUME 2, NUMBER 1 2006 55
Korea
Japan
Belgium
Nether
lands
Austria
Australi
a
Swed
en
Czech
Rep
ublic
Irelan
d
Switz
erlan
d
Hungary
United St
ates
United K
ingdom
Germ
any
Norway
Fran
ce
Thailan
d
Denm
ark
Spain
Greec
eIta
ly
Portu
gal
Israe
l
Spending/Student (US $)
7,000
8,000
6,000
5,000
4,000
3,000
2,000
1,000
0
Figure 5
TIMSS Performance and Spending (Countries Ranked by TIMSS Aggregates)
shows the pattern of the adoption of accountabilitysystems by states. It also shows the division between“report card” states (those simply reporting resultsto the population) and “consequential” states (thoseattaching varying rewards and sanctions to schoolperformance).
Not surprisingly, the adoption of accountabilitypolicies has produced a range of education outcomesas well.
The closest thing to a national examination inthe United States is the NAEP. The program isdesigned to test a representative sample of studentsin 4th, 8th, and 12th grades in reading, mathematics,science, and other subjects regularly. Starting in1992, the methods used to select student sampleswere intended to provide representative results atthe state level. Participation, until recently, wasvoluntary for individual states, so states could testin only one subject or restrict the grades that weretested. Still, it is the only available common meas-ure of performance across states.
In recognition of the heterogeneity of studentresults, the U.S. Congress in 2001 passed sweepingeducation reform legislation, the No Child LeftBehind Act. Although not completely standardized,NCLB pushes toward a common practice onaccountability throughout the United States.Although the law respects the states’ rights to designboth education policies and standards/testing poli-cies, it requires each system to test students annu-ally, requires all states to report on a limited set ofperformance metrics, and introduces a commonset of consequences for schools that fail to showacceptable results. The policy also requires statesto establish their own standards of proficiency usingtheir state standardized test, though the actualthresholds of “below proficient” and “proficient”may differ across states.
We are able to capitalize on the staggered adop-tion and diversity of accountability programs tostudy in a general way the effect of this importantchange on student performance. (Clearly, the NCLBhas equalized the program characteristics and, thus,has ended the national accountability experimentof state-level differences.) Combined with theperiodic scores reported on NAEP tests, which weregiven every four years throughout our evaluationperiod, three research questions can be addressed:
• Does accountability work?
• Are the impacts common for all subgroups?
• Are there policy attributes that affect results?
It is important to note that the analysis is limitedin several respects. Some states did not adopt anaccountability system at all until required by NCLB,thus limiting the observations of accountabilityeffects. Second, state participation in NAEP is vol-untary; so, even among those states with account-ability policies, data were lacking for some gradesin some years. States also differed in their decisionsto exclude students on the basis of disability, lan-guage proficiency, or time since entry into a schoolfrom taking the test; accordingly, there is some mix-ing of students across states and over time withinstates. Finally, accountability was not the onlyreform initiative that states implemented over thestudy period, but the impacts of these other initia-tives are difficult to isolate.
How Well Do Accountability SystemsWork?
Accountability policies have two general char-acteristics: They provide performance informationabout a school in a consistent way, and they requireall schools to face similar treatment based on theirresults. States create an aggregate score for eachschool based on individual student test scores.Because states differ in the way they measure schoolperformance, they may send different signals toschools and, ultimately, promote different policyresults. Our basic assessment of existing account-ability systems does not distinguish among designfeatures of different states, although later we suggestthat the designs are very different and are likely toaffect performance more or less strongly. The schoolscore is then used to determine the performanceof schools against some pre-set criteria. These eval-uative ratings are intended to provide feedback andoffer objective motivation to spur improvement.Second, what happens to schools once they obtaintheir scores differs by state. As noted previously,some states merely make the information public(known as report card states), whereas others intro-duce consequences in the form of rewards and/orsanctions. The current analysis looks at the impactof having consequences to test whether the design
Hanushek and Raymond
56 VOLUME 2, NUMBER 1 2006 FEDERAL RESERVE BANK OF ST. LOUIS REGIONAL ECONOMIC DEVELOPMENT

characteristics of state accountability systemsmatter. We return later to issues of overall design.
Conditional Consequences. Accountabilityprograms differ in how they use accountabilityscores, and such differences may influence theeffectiveness of the program. Earlier research iden-tified two general approaches. The first uses publicdisclosure to motivate interested parents, schoolboards, the media, and civic leaders to demandbetter performance from low-scoring schools.This approach relies on release of scores over theInternet and publication and comment in localpapers. The second and more direct approachincorporates into the accountability program’sdesign a set of consequences—typically monetaryawards, Blue Ribbon designations, or punitiveactions such as probationary status or threat ofreconstitution—to prompt schools to improve.
As shown in Figure 6, between 1993 and 2002,43 states adopted accountability programs. Of these,29 programs included consequences and 14 useda report card approach. The markedly differentmechanisms of influence provide the chance tostudy whether this design feature is influential inthe educational improvement of states. Considera-
tion of the type of accountability system was incor-porated into the overall test of the effectiveness ofaccountability to which our discussion now turns.
Modeling the Effectiveness of Accountability.The availability of NAEP test results on repeatedadministrations of the test provides a unique oppor-tunity to examine the staggered adoption of account-ability policies across the states and to test theirimpact on the rate of improvement in student aca-demic achievement. Conveniently, NAEP testsstudents in the 4th and 8th grades in reading andmath every four years; so, for states that test studentsin both grades, over time the same cohort is cap-tured as it moves through school.
For both reading and math, we can test theprogress of two cohorts of students in states partici-pating in the NAEP. As noted in Figure 6, we canuse 8th grade math scores in 1996 and 2000 andreading scores in 1998 and 2002 (combined with4th grade scores four years prior). As long as wecan control for cohort differences in family back-ground (e.g., parental education, race/ethnicity,poverty), average state education spending, andtesting exclusions over the period, the growth inachievement across cohorts can be compared for
Hanushek and Raymond
FEDERAL RESERVE BANK OF ST. LOUIS REGIONAL ECONOMIC DEVELOPMENT VOLUME 2, NUMBER 1 2006 57
Number of States
50
40
30
20
10
01993 1994 1995 1996 1997 1998 1999 2000 2001 2002
Math 8 Reading 8 Math 8 Reading 8
Report Cards
Consequential Systems
Figure 6
State Accountability Over Time
NOTE: Gray bars indicate NAEP testing dates.

states that had adopted accountability over theperiod of study against states that did not. We fur-ther exploit the disaggregation of NAEP results byrace and ethnicity (white, black, and Hispanic).We pool the disaggregated state test data for bothreading and math.
We also consider the difference in the systemdesign (consequence vs. report card) and a fixed-state effect to reflect any other policy changes thatthe state might have adopted to improve studentperformance. Multivariate econometric modelingwas used to discern the impacts of the factors weexamined. (The full models estimated are reportedin Table A1 of the appendix.)
The overall difference in performance between4th and 8th grades that comes from accountabilityis displayed in Figure 7. For each group of students,the expected growth in achievement is higher instates that implement accountability systems thanin states that do not.
The improvement was realized by states thatattached consequences to schools’ performance.However, states with “report card” accountabilityprograms had no significantly different achievementlevels from those of states without any accounta-bility program.
Other results are also noteworthy. Testing exclu-sion rules were negatively significant—the more
students excluded, the better the results; nonethe-less, exclusion rates vary across states in a waythat does not affect the estimated importance ofaccountability. Differences in per-pupil spendingwere not significant in explaining the differencesin learning gains. This latter finding is consistentwith a large body of earlier work; in this case, thefinding provides especially important insightbecause many states face pressure to dramaticallyincrease spending to promote better learning.
At the same time, by comparing the gains foreach group, it is clear that accountability has differ-ent impacts on the groups. The overall differencesare shown in Figure 8, which identifies the black-white and Hispanic-white achievement gaps bothwith and without accountability. The comparisons(measured in standard deviation units) show thataccountability closes the gap for Hispanics butwidens it for blacks.
DESIGN ISSUESAlthough each adopted its accountability system
independently, states copied student testing andschool scoring design from each other.4 Although
Hanushek and Raymond
58 VOLUME 2, NUMBER 1 2006 FEDERAL RESERVE BANK OF ST. LOUIS REGIONAL ECONOMIC DEVELOPMENT
No Consequences
Consequences
60
50
40
30
20
10
0White Black Hispanic
NAEP Gains (scale scores)
Race/Ethnicity
Figure 7
Effect of Consequential Accountability on Achievement by Race/Ethnicity
4 A more complete discussion of these design issues is found inHanushek, Raymond, and Rivkin (2004).

small distinctions arose, the systems fall into a fewgroups; the differences provided the chance toexamine the design features of these systems andlearn whether they influence the effectiveness ofaccountability as a policy. We found that designdoes matter: The results that states obtain can bemarkedly different based only on the approachthey use.
School Scores
We begin by looking at the individual studenttest score. We know that the score a student receiveson an achievement test is influenced by multiplefactors: earlier learning, family background, test
measurement error, and the actual contribution ofhis schooling in the year tested. But a test score atone point in time captures the effect of all these,not simply that of the school.
Depending on the method of aggregating aschool score from student-level scores, the schoolscore also captures these other factors to varyingextents. Simple averages of annual test scores pro-duce results that can differ over time simply becauseof changes in the student population, a real problemin schools with high student mobility rates. Purerresults are obtained when school scores aggregatethe gain scores for individual students over time(that is, the improvements in their scores); the influ-ences of family background and prior learning tend
Hanushek and Raymond
FEDERAL RESERVE BANK OF ST. LOUIS REGIONAL ECONOMIC DEVELOPMENT VOLUME 2, NUMBER 1 2006 59
Status
–0.8
–0.6
–0.4
–0.2
0No Consequences Consequences
Difference in NAEP Gains (standard deviation)
Black-White
Hispanic-White
Figure 8
Racial/Ethnic Gaps by Consequential Accountability Status: NAEP Gains Relative to White Students
Table 1Simple Correlation of Alternative School Accountability Measures: TAAS Math for Grades 5 and 6
Average score Average gain Relative gain
Average score 1.00
Average gain 0.27 1.00
Relative gain 0.67 0.86 1.00
NOTE: Correlations are weighted by the number of students in each school. These data exclude all students moving into school during theyear plus those eligible for special education or bilingual programs. Each measure is calculated for individual grades and then aggregatedto the school level.

to disappear when these scores are used. Still, themagnitude of gains may depend on the startingpoint—low-performing students may achievehigher gains than high-performing ones—so com-parison across schools may be problematic. For thisreason, a third method (not currently in use butvaluable for comparison purposes) examines gainsrelative to other like-situated schools. We refer tothis approach as the relative gain score.
To gauge the effects that program design has onschool scores, we compute then compare the rank-ings of schools over the same set of student scores.The student scores from the Texas Assessment ofAcademic Skills (TAAS) test for 5th and 6th gradersfor over 1000 schools were used. If no difference inthe computational methods existed, the correlationsof school ranks should be unitary. The correlationresults are shown in Table 1. The low correlationof the simple average and gain scores, at 0.27, isparticularly troublesome since these are the twomethods most widely used in the United Statestoday. Even more troubling is the finding that thedifferent rankings result in many schools movingfrom the top quartile to the bottom and vice versa,completely reversing the signal about the effective-ness of the school. Better alignment is seen betweenthe other comparisons, which may suggest newoptions for calculating scores. It is difficult tojudge the success of national reform programs ifthe outcome metrics used in those inquiries are sounrelated.
CONCLUSIONSImproving educational quality has a dramatic
effect on the economic well-being of individualsand nations. The original research described herereinforces the idea that public policies can posi-tively affect the course of education quality. Thefindings demonstrate that, overall, the adoption ofaccountability policies produces higher academicgains than having no policy, but that the impactsare not equally distributed across all student groups.We also find that the designs of the systems them-selves must receive careful attention so that con-sistent and accurate information about schoolperformance can be obtained.
REFERENCESHanushek, Eric A. “The Failure of Input-Based Schooling
Policies.” Economic Journal, February 2003, 113(485),pp. F64-98.
Hanushek, Eric A. “Some Simple Analytics of SchoolQuality.” NBER Working Paper 10229, NationalBureau of Economic Research, January 2004.
Hanushek, Eric A. and Kimko, Dennis D. “Schooling,Labor-Force Quality, and the Growth of Nations.”American Economic Review, December 2000, 90(5),pp. 1184-208.
Hanushek, Eric A. and Raymond, Margaret E. “DoesSchool Accountability Lead to Improved StudentPerformance?” Journal of Policy Analysis andManagement, Spring 2005, 24(2), pp. 297-327.
Hanushek, Eric A.; Raymond, Margaret E. and Rivkin,Steven G. “Does It Matter How We Judge SchoolQuality?” Paper presented at the American EducationFinance Association annual meetings, Salt Lake City,Utah, March 11-13, 2004.
Lazear, Edward P. “Teacher Incentives.” SwedishEconomic Policy Review, 2003, 10(2), pp. 179-214.
Mulligan, Casey B. “Galton Versus the Human CapitalApproach to Inheritance.” Journal of PoliticalEconomy, December 1999, 107(6, Part 2), pp. S184-224.
Murnane, Richard J.; Willett, John B.; Duhaldeborde,Yves and Tyler, John H. “How Important Are theCognitive Skills of Teenagers in Predicting SubsequentEarnings?” Journal of Policy Analysis andManagement, Fall 2000, 19(4), pp. 547-68.
Hanushek and Raymond
60 VOLUME 2, NUMBER 1 2006 FEDERAL RESERVE BANK OF ST. LOUIS REGIONAL ECONOMIC DEVELOPMENT

Hanushek and Raymond
FEDERAL RESERVE BANK OF ST. LOUIS REGIONAL ECONOMIC DEVELOPMENT VOLUME 2, NUMBER 1 2006 61
APPENDIX
Table A1Differential Racial and Ethnic Impact of Accountability on State Growth in NAEP Reading andMathematics Performance (4th to 8th Grade), 1992-2002
Disaggregation of Accountability by ethnicity state accountability
Consequential accountability 3.40 (2.8)** 3.54 (3.0)**
Consequential accountability x black –2.04 (2.0)*
Consequential accountability x Hispanic 3.10 (2.4)*
Disaggregated x Hispanic –2.35 (2.0)*
Disaggregated x black 3.02 (2.0)*
Report card system 0.72 (0.6) 0.72 (0.6)
(%Population age 25+) � high school 0.05 (0.7) 0.06 (0.9)
School spending, $/ADM ($1000) –1.14 (0.6) –1.07 (0.6)
Change in exclusion rates 0.50 (3.5)** 0.51 (3.5)**
Black –6.34 (2.5)* –6.76 (2.6)**
Hispanic –10.17 (4.4)** –9.80 (4.2)**
Minority exposure x black –8.59 (2.7)** –8.16 (2.4)*
Minority exposure x Hispanic –4.90 (1.4) –4.98 (1.4)
Observations 348 348
Number of states 42 42
R2 0.956 0.956
NOTE: */** Indicates significance at the 5/1 percent levels. All models are estimated with state fixed effects. Models include NAEP 4thgrade scores for reading and math (lagged four years) and indicator variables for test and period. Absolute value of robust t statistics (withclustering by state) in parentheses.

Discussion
Steven G. Rivkin
also be related to other determinants of earnings,including family income and wealth, in which casethe observed return to mathematics knowledgecould conflate the actual return and related advan-tages of growing up in a higher-income family. Alter-natively, evidence on the returns to mathematicsskills, such as the returns depicted in Figure 1, mayunderstate the true return by assuming that theincrease in one’s earnings is constant in percentageterms throughout one’s career. Most studies usesamples of younger workers early in their careers,and those with higher mathematics skills may be“investing” more in the sense of foregoing currentearnings to obtain additional skills that will increasefuture earnings. Yet despite these and other con-cerns, the weight of the evidence points to a strongeconomic payoff to raising mathematics knowledge,meaning that the benefits of accountability reformsdepend on their effects on school quality.
Accountability systems adopted prior to NCLBfacilitate the study of accountability effects. Theauthors point out the substantial variation in pro-gram structure and emphasize the importance ofdesign details, including the type and severity ofsanctions, generosity of rewards, and method forestimating school and teacher effects. Long-runsuccess of accountability systems depends on aconsensus of belief that teacher and school evalu-ations and rankings are based on actual quality andnot on the skills that students bring to the class-room. Proper assessment requires the developmentof comprehensive data systems that can also beused in the study of state education systems morebroadly. Not only would flawed assessment fail to
T he passage of the No Child Left BehindAct (NCLB) represents a major shift inthe federal role in elementary and sec-ondary education. Whether it succeeds
in raising academic achievement and improvingsubsequent economic and social outcomes remainsto be seen. As Hanushek and Raymond point out,the recent, nationwide implementation of NCLBmakes it very difficult to identify the impacts ofthe reform. This difficulty led them to use existingevidence to predict the likely effects of the law.A sensible approach. Of course, the predictivepower of the existing evidence depends on boththe strength of that evidence and its relevance tothe accountability reforms mandated by NCLB.
The paper begins by documenting the growingbody of evidence showing that mathematicsachievement raises earnings and economic growth,both directly and indirectly, by increasing educa-tional attainment. The evidence indicates thatschool quality improvements could have substantialeconomic benefits and affect both average earningsand the degree of inequality. Therefore educationreforms could have a large economic payoff.
Questions do remain about the overall magni-tude of the effects and the impact of school qualityimprovements on the earnings distribution. If thosewho have a higher expected return to learningmathematics tend to receive better instruction or putforth higher effort, returns based on earnings dif-ferences may understate the value of mathematicsknowledge for some (engineers, for example) andoverstate the value for others (writers or laborers,for example). Higher mathematics achievement may
Steven G. Rivkin is an associate professor of economics at Amherst College.
Federal Reserve Bank of St. Louis Regional Economic Development, 2006, 2(1), pp. 62-63.© 2006, The Federal Reserve Bank of St. Louis. Articles may be reprinted, reproduced, published, distributed, displayed, and transmitted intheir entirety if copyright notice, author name(s), and full citation are included. Abstracts, synopses, and other derivative works may be madeonly with prior written permission of the Federal Reserve Bank of St. Louis.
62 VOLUME 2, NUMBER 1 2006 FEDERAL RESERVE BANK OF ST. LOUIS REGIONAL ECONOMIC DEVELOPMENT

reward or sanction based on true quality, it woulddiscourage high-quality teachers and administratorsfrom remaining in and entering public education.
Hanushek and Raymond argue that variationin the timing and structure of state accountabilitysystems adopted prior to the passage of NCLB canbe used to estimate the effects of reforms that aresimilar in many respects to NCLB. Complicationsarise because differences in the timing and extentof reforms may be related to other factors that affectachievement, making it difficult to isolate theaccountability effects. For example, states mayimplement a number of reforms in response tolow performance or changes in the political climate.These include alignment of the curriculum moreclosely to the type of material covered on theNational Assessment of Educational Progress(NAEP) examination, the test used in this and otherpapers. Consequently, observed changes in testscores could result from a number of factors, neces-sitating the identification of a comparison groupthat would provide a benchmark of achievementchanges not resulting directly from the newlyadopted accountability system. States yet to adoptaccountability systems are good candidates, butthey may fail to capture other systematic changesexperienced by the accountability adopters.
The results suggest that high-stakes accounta-bility systems raise achievement, but there is reasonto interpret the findings with some caution due tothe variation in program characteristics—the pos-sibility that other factors are contaminating theresults—and to the pattern of the results. Specifi-cally, given that state tests tended to focus on less-
advanced skills, improvements in schools servingpoor and minority students with lower initial scoreswould be more likely to be captured on the tests.Moreover, one might expect the introduction ofhigh-stakes examinations to have a larger impacton schools serving predominantly minority andlower-income students whose families likely placedless pressure on school administrators to raisequality than did families of middle and upper classstudents who can more easily opt out of under-performing schools by switching to the privatesector or moving to a different community.
Additional concerns revolve around the ques-tion of the size of the effects on longer-run out-comes, including academic attainment, earnings,and economic growth. The fact that the NAEP datais not the assessment used in the accountabilityprograms certainly mitigates the likelihood thattest score increases do not carry over to longer-runoutcomes or even other tests in the same subjects.Nonetheless, reports of extensive time devoted totest-taking instruction and additional emphasison the test material vis à vis other subjects high-lights the importance of structuring the incentivescorrectly.
Finally, although frustration with resource-based policies has been a catalyst for the growingdemand for accountability and other incentiveprograms, expanded resources and more-rigorousincentives are not mutually exclusive tools forimproving the schools. In fact, one measure of thesuccess of accountability efforts is the extent towhich these reforms increase the return to financialinvestments in the public schools.
Rivkin
FEDERAL RESERVE BANK OF ST. LOUIS REGIONAL ECONOMIC DEVELOPMENT VOLUME 2, NUMBER 1 2006 63

Commentary
Gerri OgleAssociate Commissioner, Missouri Department of Elementary and Secondary Education
The performance tax levy is established at $3.43.This means that a one-time calculation will be made($3.43 × the 2004 assessed valuation in the schooldistrict) when determining the amount of state aidneeded to achieve the state adequacy target in thatdistrict. A dollar value modifier is created to recog-nize districts’ increased costs as measured by higherwages, primarily in metropolitan areas. This formulawill be phased in over seven years beginning in2006-07.
Other funding will be distributed as follows:
• A $15 million Small School Fund will bedistributed to all districts having 350 or fewerstudents in average daily attendance (ADA).Two-thirds of that money will be distributedon an ADA basis; the other third will be dis-tributed on a prorated basis to those districtswith levies greater than the $3.43 perform-ance levy. The net effect of the proration isthat districts with the highest levies that areeligible for the Small School Fund will benefitthe most. (A change from the current formularemoves the extra weighting for summerschool average daily attendance.)
• A Classroom Trust Fund will be created toprovide a separate accounting for moneygenerated by riverboat gaming. Local districtswill have great flexibility in the expenditureof this money.
• A fund will be created to reimburse districtsfor the educational costs of students withdisabilities when the costs for a child’s serv-ices exceed three times the district’s currentexpenditure per ADA.
I n 2005, the Missouri legislature adopted anew school foundation formula, which willbe phased in over seven years, beginning in2006-07. It is based on the current expen-
diture of local and state dollars in those districtsmeeting all performance standards established bythe State Board of Education. It is designed toensure that all districts have at least the “stateadequacy target” of money behind each child ifthe district chooses to have a tax levy equal to orgreater than the performance tax levy. For the2006-07 school year, the target funding level is$6,117 per student; this amount will be recalcu-lated every two years.
Also, an additional allocation will be availablefor school districts that have a higher-than-averagenumber of students with unique special educationneeds, with limited English proficiency, or whoqualify for free or reduced lunch.
Because the state adequacy target includesexpenditures for the previously identified categoriesof students, the following items will no longer becategorically funded:
• exceptional pupil aid
• gifted education
• remedial reading education
• fair share fund
• text book fund
• line 14 of current formula (“at-risk” programs).
The net effect is that districts must think differ-ently now because they have a total number ofdollars with which to address the educational needsof all students rather than specified amounts thatmust be spent on certain categories of students.
Federal Reserve Bank of St. Louis Regional Economic Development, 2006, 2(1), pp. 64-65.© 2006, The Federal Reserve Bank of St. Louis. Articles may be reprinted, reproduced, published, distributed, displayed, and transmitted intheir entirety if copyright notice, author name(s), and full citation are included. Abstracts, synopses, and other derivative works may be madeonly with prior written permission of the Federal Reserve Bank of St. Louis.
64 VOLUME 2, NUMBER 1 2006 FEDERAL RESERVE BANK OF ST. LOUIS REGIONAL ECONOMIC DEVELOPMENT
The formula also calls for the minimum salaryfor a teacher to be $22,000 in 2006 and moved to$25,000 in 2010. A teacher with a master’s degreeand 10 years of experience must earn at least$30,000 in 2006-07 and $33,000 by 2009-10.
Ogle
FEDERAL RESERVE BANK OF ST. LOUIS REGIONAL ECONOMIC DEVELOPMENT VOLUME 2, NUMBER 1 2006 65
Commentary
The Honorable Brian L. BakerMissouri State Representative
mula, because of its sweeping change in direction,will take seven years to fully phase in, but will addan additional $900 million to education in that timeperiod.
Still, school districts claim it is not enough. Today, the 250 school districts suing the state
are asking for $2 billion in new tax revenue. Manyof the school districts hope the lawsuit will createa Robin Hood approach where growing districtswith large local effort will send their local taxdollars to small and poor districts. This methodof funding schools was ruled unconstitutional inTexas.
It is apparent that the 250 school districtssuing the state are dealing with several conflictswithin their own group. It would even seem that thelawyer representing these school districts is facinga conflict of interest with these school districts.
Other schools want the state to invest $1 billionin new taxes to help build schools. However,Missouri has always allowed local school districtsto fund buildings with local dollars. Very few statescan or will invest dollars in buildings.
Missouri is unlike every other state that hasfaced a lawsuit regarding funding. Voters approveda state constitutional measure that requires the stateto spend 25 percent of its funds on education.Missouri is exceeding that mandate.
Missouri has seen its student population flat-line in the past five years while education fundinghas increased 10 percent in that same time period.
Every state that has faced a lawsuit has seen thejudicial branch favor the school districts’ claims.However, in Arkansas, when school districts wontheir lawsuit, the legislature developed the political
F or 10 years Missouri has worked underthe idea that the best way to fund educa-tion is to look at the taxing ability andtax demographics of a local district and
then decide how much state aid should be providedto schools.
However, the ideology of that formula and itscomponents caused the funding system to grow outof control. The formula was flawed in that it didnot look at student need or student success. Onemust also remember that the past funding modelwas simply that—a model—with no basis foraccounting for student need or assessment.
Missouri has undertaken a 180-degree changein its method of funding education. Instead of look-ing at numbers and tax abilities of districts, it nowlooks at student need and student success.
Today, Missouri—like many states—is facing alawsuit by school districts claiming that the stateis not equitably or adequately funding education.This group of 250 school districts claims this law-suit has driven the state to make changes.
This is not the truth. The process to review andrewrite the formula began before the lawsuit wasfiled. In fact, an interim committee headed by StateSenator Charlie Shields traveled the state to startcollecting input before the school districts unitedin their lawsuit.
Further, in the development of the new formula,not one major education group testified against the“Successful Schools Funding Model.” These groupsoffered small changes and ideas, but overall sup-ported the direction of the new formula.
Beginning in 1993, this foundation formulatook four years to be fully phased in. This new for-
Federal Reserve Bank of St. Louis Regional Economic Development, 2006, 2(1), pp. 66-67.© 2006, The Federal Reserve Bank of St. Louis. Articles may be reprinted, reproduced, published, distributed, displayed, and transmitted intheir entirety if copyright notice, author name(s), and full citation are included. Abstracts, synopses, and other derivative works may be madeonly with prior written permission of the Federal Reserve Bank of St. Louis.
66 VOLUME 2, NUMBER 1 2006 FEDERAL RESERVE BANK OF ST. LOUIS REGIONAL ECONOMIC DEVELOPMENT

willpower to consolidate districts. School districtstruly risk a worse scenario as they seek a judicialaction.
In the end, one very important question needsto be addressed. Which branch of government isresponsible for funding and defining what educa-tion needs? Even if the judicial branch were to favorthe school districts involved in the lawsuit, howwill the courts enforce any of their rulings? Theday is coming where the authority of the judicialbranch on the legislature will be challenged.
Missouri’s new funding formula moves awayfrom the practice of basing funding on the taxingcapacity or tax demographics of a school district.Instead, it looks at the annual performance reportof school districts and finds the average spendingof the districts that score a perfect 100 percent.Then, it weights the needs of special education,poor students, and English proficiency students.It takes into account the cost of living and the localfunding effort of a school district.
The Successful Schools Funding Model looksat student success and student need to account forthe state input into education. It allows for growthand works to continue providing an adequate andequitable education for students.
Missouri faces many challenges. Yet, amidst thearguments facing education, Missouri has developeda legitimate and sound funding model that trulyaddress equity and adequacy.
Baker
FEDERAL RESERVE BANK OF ST. LOUIS REGIONAL ECONOMIC DEVELOPMENT VOLUME 2, NUMBER 1 2006 67

Commentary
The Honorable Yvonne WilsonMissouri State Senator
is used by the district to pay bonds, which coverexpenses for the improvement of facilities mandatedby the desegregation case.
The District’s enrollment for the current yearhas declined, resulting in a projected net loss inrevenue of more than $4 million compared withfiscal year (FY) 2005. Each year balancing thebudget becomes a little more difficult.
The District is pleased that a new state founda-tion formula was adopted in the previous legisla-tive session. The new formula, Senate Bill 287, isa “student needs” driven formula, whereas thecurrent formula relies heavily on property taxesgenerated at the local level.
The new formula creates a per-pupil allocationbased on what it takes to adequately fund educationneeds of a “regular education” student. SenateBill 287 also provides funding for “special needs”students.
Although the funding for a special needs stu-dent is a step in the right direction, there are someparts of the new formula that require some tweak-ing. For example, the new formula does not takeinto consideration districts with high percentagesof special needs students. Just as consideration wasgiven in the new formula for small districts, theformula also needs to be modified to add additionalrevenue to districts with high concentrations ofstudents eligible for free and reduced lunch.
Overall, the formula provides about $24 millionin additional revenue for the Kansas City SchoolDistrict to be phased in over seven years beginningJuly 1, 2006.
Looking ahead to the 2006 Missouri legislativesession, the Kansas City School Board will pursue
I am Senator Yvonne Wilson, representingthe Ninth District in the Missouri StateSenate, which encompasses part of JacksonCounty. Thank you for the opportunity to
discuss the challenges facing education funding inMissouri and in the Kansas City area in particular.
The Kansas City School District remains in astate of transition—from its status under court over-sight stemming from the desegregation lawsuit toa unitary status (i.e., free of court oversight). TheKansas City School District has petitioned theDepartment of Elementary and Secondary Educa-tion to approve a re-review of the district for fullaccreditation.
Outgoing Kansas City school superintendentBernard Taylor was recently asked about the mostdifficult part of his job. His response: “schoolfinances.” Dr. Taylor says the difficulty is balancingwhat you have to do to remain fiscally solvent withwhat you have to do to meet the needs of students.Adding to the district’s financial woes are reduc-tions in state support and the attempted diversionof limited resources to charter schools.
An effort to provide millions of dollars to funda state school voucher program was defeated inthe Missouri legislature this year, but supportersare sure to attempt this diversion of public schooldollars to private and religious schools in the nextsession. The proposed “tuition tax credits” woulddo nothing to improve the education of the majorityof children in the Kansas City School District whoattend public schools.
Nevertheless, the Board of Fund Commissionersis forcing the Kansas City School District to pay upto $6 million per year to charter schools. The money
Federal Reserve Bank of St. Louis Regional Economic Development, 2006, 2(1), pp. 68-69.© 2006, The Federal Reserve Bank of St. Louis. Articles may be reprinted, reproduced, published, distributed, displayed, and transmitted intheir entirety if copyright notice, author name(s), and full citation are included. Abstracts, synopses, and other derivative works may be madeonly with prior written permission of the Federal Reserve Bank of St. Louis.
68 VOLUME 2, NUMBER 1 2006 FEDERAL RESERVE BANK OF ST. LOUIS REGIONAL ECONOMIC DEVELOPMENT

a number of items related to school funding,including
• supporting the elimination of the summerschool penalty;
• supporting a 1.25 percent allowance forsummer school attendance;
• supporting the new formula’s current con-solidation of Proposition C into the basicformula;
• opposing the elimination of the dollar valuemodifier;
• supporting the creation of a regional orcounty dollar value modifier;
• opposing tax credit scholarships or vouchers;
• supporting funding for after-school programs;
• opposing the “adopt-a-school” business taxcredit; and
• opposing an increase in the number of charterschools in the district.
Although the new school funding formula willprovide an estimated annual increase in schoolfunding of $838 million, phased in over seven years,a number of lawmakers, including myself, havequestioned how the state will come up with thisadditional revenue.
Republicans constantly reject any talk of taxincreases to help fully fund the educational needsof our children, yet they continue to propose taxbreaks for large corporations and special interestgroups.
Governor Blunt and his allies in the legislatureclaim their top priority is education, but their deedsthus far have shown their rhetoric to be empty.The children of Missouri deserve better. After all,our future is in their hands.
Wilson
FEDERAL RESERVE BANK OF ST. LOUIS REGIONAL ECONOMIC DEVELOPMENT VOLUME 2, NUMBER 1 2006 69

Commentary
Terry AdamsSuperintendent of the Rolla School District
increases projected for the Rolla School Districtwill begin at $110,373 in fiscal year (FY) 2007 andincrease to $473,831 in FY 2013. This representsan increase of 1 percent in FY 2007. Consider thatit takes more than $500,000 annually to service theexisting salary schedule—that is, to accommodateincreases in the salaries of teachers and staff as theyearn advanced degrees and accumulate experience.These increases are built into the salary schedulesfor the district in much the same way as they are innearly all school districts in Missouri. Yet, underthis formula, the school district is not projectedto receive enough new money from the State ofMissouri to service the salary schedule, withoutany consideration of raises in base pay, in any oneof the seven years that the new formula will beimplemented. Furthermore, this does not take intoaccount any other inflationary increases the districtwill inevitably incur.
To get an accurate view of how the new formulawill affect the Rolla School District in future years,simulations were developed based on the followingrevenue assumptions:
1. Estimated an annual increase of $5,000,000for new construction in the district.
2. Used Missouri revenue assumptions providedby the State Senate appropriations staff.
3. Considered federal revenues to be neutral tothe budget in total.
The following assumptions were made with respectto expenditures:
1. Allowed movement on the salary schedulerepresenting a 1.6 percent annual increase.
DISTRICT OVERVIEW
R olla, Missouri, is a city of 16,367 locatedin mid-Missouri. The Chamber ofCommerce coined the phrase that Rolla
is in the middle of everywhere, but it has beenargued that it is in the middle of nowhere.
Rolla is the home of the University of Missouri–Rolla, one of the best schools of engineering in theworld. The primary and secondary public schooldistrict covers 234 square miles and currently serves4,056 students. Of the 4,056 students, 1,540 or nearly38 percent qualify for free or reduced lunches. Thisyear, once again, Rolla’s public schools achievedthe status of “accredited with distinction in per-formance.” Last year 28 graduating students quali-fied for Bright Flight scholarships, and threestudents were National Merit Scholarship recipi-ents. The Rolla School District (No. 31) has 330certificated and 246 support staff employees.
DISTRICT FINANCESBalances in school district fund 1 (general
operating fund) and fund 2 (special revenue fund,better known as the teacher’s fund) total 30.91percent of anticipated expenditures. Although thesebalances might seem excessive, it will be beneficialto have them as the new formula developed andapproved last year in Missouri is implemented.The formula represents the greatest change inschool finance since 1993, but it is inherentlyflawed with respect to both equity and adequacy.
The simulations reported to this district by thestate Senate appropriations staff indicate that the
Federal Reserve Bank of St. Louis Regional Economic Development, 2006, 2(1), pp. 70-74.© 2006, The Federal Reserve Bank of St. Louis. Articles may be reprinted, reproduced, published, distributed, displayed, and transmitted intheir entirety if copyright notice, author name(s), and full citation are included. Abstracts, synopses, and other derivative works may be madeonly with prior written permission of the Federal Reserve Bank of St. Louis.
70 VOLUME 2, NUMBER 1 2006 FEDERAL RESERVE BANK OF ST. LOUIS REGIONAL ECONOMIC DEVELOPMENT

2. Raised the base salary for FY 2007 by 3 per-cent, FY 2008 by 2 percent, and FY 2009 by1 percent. No increases in pay were assumedfor the last four years of the comparison.
3. Included a projected annual retirementbenefit increase of 1/2 percent for certificatedstaff and 1/4 percent for classified staff.
4. Estimated that health insurance wouldincrease by 5 percent annually.
5. Added a 3 percent increase for all other itemsas an estimate of inflation.
With these revenue and expenditure assump-tions, the balances will drop from a positive 31.2percent in FY 2006 to a negative 17.1 percent inFY 2012. Obviously, many changes will have to bemade in the budget prior to FY 2012.
EQUITYFor a variety of reasons, the formula does not
represent equity. The first reason is parochial innature, but Rolla doesn’t benefit as much as otherdistricts with the new formula. Second, althoughit is possible that the gap between the “have”districts and the “have not” districts may narrowsomewhat, the gap will still be wide enough to con-stitute inequity. Over the seven-year period, thedistrict currently at the bottom, spending $4,771,will increase per-pupil expenditure to $6,117—plusany adjustments built into the formula. It is assumedthat the district currently spending $13,339 perpupil, based almost entirely on current taxes, willincrease spending based on increases in assessedvalue during the same period of time. Even if thisdoes not happen as predicted, the variance between$6,117 and $13,339 would fund a reduction in thepupil/teacher ratio for the districts funded at the$6,117 level, provide better support services, and/or purchase a great deal of technology with which toteach children. Districts that spend more per pupilcan provide more opportunity to learn throughmore time spent with individual students and moreteaching resources.
Finally, the dollar value modifier (DVM) is ofdubious worth from the outset if the goal is to attainequity; but as implemented, it is ludicrous. In ten
minutes of reviewing the simulations, anyone couldfind numerous examples of injustices that wouldbe humorous if they didn’t ultimately affect somechildren in a negative way. The DVM ranges froma low of 1.0 to a high of 1.103. A DVM of 1 generatesno additional revenue, but any number higher than1 does generate additional revenue. The conceptis undoubtedly founded on the premise that it costsmore to operate a school in an area with a highercost of living. Although not all subscribe to thatconcept, it is easy to understand why the City ofSt. Louis and St. Louis County would be groupedtogether and have the highest possible DVM. It issignificantly less clear why the school district inPotosi, Missouri, would also qualify for the high-est possible DVM and the district in Owensville,Missouri, would have the lowest possible DVM. Italso makes very little sense that the Potosi, Missouri,and the Caledonia, Missouri, school districts wouldreceive the highest DVM, whereas the school dis-trict in Maries County, Missouri, receives nothingin the formula with respect to DVM. The St. LouisCity and the St. Louis County school districts aregenerally large urban and suburban school districts.By contrast the school districts in Potosi, Caledonia,and Maries County, Missouri, are all small ruralschool districts.
ADEQUACYAdequacy is the larger issue and the one with
which everyone should be concerned. The nationalaverage expenditure per student in 2005 was$8,618, and the Missouri average expenditure perstudent in 2005 was $7,451 (National EducationAssociation [NEA] Rankings and Estimates Table 5).The expenditure per student in the Rolla SchoolDistrict for the same period of time was $6,740.25(Department of Elementary and Secondary Educa-tion website). Missouri is well behind the nationalaverage, and the Rolla School District is well behindthe state average.
Education Vital Signs (2006) includes Missouriin the north central group of states, and the expendi-ture per child for FY 2004 found Missouri last inthose eight states, which are Illinois ($10,439),Indiana ($8,734), Iowa ($7,477), Kentucky ($7,719),Michigan ($8,909), Minnesota ($9,239), Missouri
Adams
FEDERAL RESERVE BANK OF ST. LOUIS REGIONAL ECONOMIC DEVELOPMENT VOLUME 2, NUMBER 1 2006 71
($7,452), Nebraska ($7,617), Ohio ($9,573), andWisconsin ($9,881).
In 2005, Missouri ranked 38th in expendituresper student (NEA Rankings and Estimates Table 5).In 2003, Missouri ranked 30th in personal incomeper capita (U.S. Census Bureau, data on personalincome per capita); but, in 2004, Missouri ranked45th in the state’s taxes per capita (U.S. CensusBureau, data on states ranked by total taxes). Thediscrepancy between per capita income and percapita taxation is a primary cause for the relativelylow expenditure per pupil in Missouri. The expen-diture per pupil in Missouri does not comparefavorably with national averages or with the groupof north central states even though the per capitaincome of Missourians indicates the ability to spendmore for education.
TIME AS IT RELATES TO ADEQUACYAlthough there are many variables that affect
performance, it is important to consider the variableof time and understand that time will equate tomoney. The average number of days attended bystudents nationally is 180 (Barrett, 1990). Missouriis tied with North Dakota for last place nationally,with a required 174-day school year. Schreens andBosker ranked time as the number-one school-levelfactor as it relates to student achievement (Marzano,2003, p. 17). Marzano found that time was the sec-ond most important school-level factor as it relatesto student achievement (p. 18). In a speech at theInternational Leadership Conference in June 2005,Lezotte stated that educators should stop viewingtime as a constant with learning optional and startconsidering time as the variable with learning asthe constant. The research in the field is clear thattime spent educating children affects levels ofperformance.
Authors Cooper and Ryan (2004) indicate thatthe United States is not doing well in internationalcomparisons of academic performance as measuredby the Third International Math and Science Study(TIMSS). The performance of U.S. fourth gradestudents is quite good, but that performance dimin-ishes as the children progress through school. It maybe that the cumulative effect of going to schoolfewer days than our international counterpoints
has a negative impact that impedes educationalgrowth over time. The following are some selectedquotations (pp. 123-24) on the topic:
1. U.S. students don’t start out behind, they fallbehind.
2. By the time U.S. students finish high school,they are not equipped to meet the interna-tional expectations demanded by a globallabor market.
3. Of the 21 nations that participated in thetwelfth grade, the United States outperformedonly two, Cyprus and South Africa.
4. Even the most advanced students, thosetaking advanced mathematics and physics,scored at the bottom when compared withtheir counterparts in other countries.
The TIMSS study tested students in math andscience at multiple grade levels. For comparativepurposes, the results of the eighth grade mathexamination are included here—the countries thatscored in the top five on the examination, along withthe number of days their children attend school.
1. Singapore 255
2. South Korea 220
3. Chinese Taipei Not available
4. Hong Kong, SAR 195
5. Japan 243
The number of days attended by students inChinese Taipei was not available, but the remainingfour countries average 228.25 days of student atten-dance annually. Again, the average in the UnitedStates is 180 school days and the requirement inMissouri is 174 school days. If time does in factmake a difference in student performance, thecumulative effect of attending school fewer daysthan our international counterparts would obvi-ously have a negative impact on our ability to com-pete academically. Given that students in the UnitedStates perform well in the fourth grade and notnearly as well in the twelfth grade, it seems likelythat the effect of attending school more days givesstudents in other nations an advantage academically.
The National Education Commission on Timeand Learning states that “No matter how theassumptions underlying the figure are modified,
Adams
72 VOLUME 2, NUMBER 1 2006 FEDERAL RESERVE BANK OF ST. LOUIS REGIONAL ECONOMIC DEVELOPMENT
the result is always the same—students abroad arerequired to work on demanding subject matter atleast twice as long as U.S. students” (Marzano,2003). This raises the following questions:
1. Does time make a difference?
2. Should Missouri make an effort to reach thenational average?
3. Do international educational achievementcomparisons mean anything in an increas-ingly globalized economy that is increasinglyknowledge based?
4. Should Missouri consider moving to inter-national standards with respect to the issueof time?
5. What will time cost?
6. Is Missouri adequately funding education?
7. Where will our children work?
FUNDING SCHOOLS AND TAXATION
Compared with other states, Missouri is 42ndin state and local taxes as a percentage of personalincome (Kessler, Stallmann, and Winter, 2006). Ifthe plan in Missouri is to enhance the economythrough low taxes, there is at least a chance forshort-term success if Kansas and Illinois are con-sidered to be competitors. If Missouri is really incompetition with countries such as China and India,it will take a paradigm adjustment to regain a com-petitive advantage.
Maybe it is time to reconsider giving studentsa three-month break every year so that they can tendand harvest the crops. The three-month break inthe summer traces back to a need for children towork on farms, but is now more closely alignedto the desire to have cheap labor for the tourismmarket. Tourism is an important element in theMissouri economy; but if tourism is enhanced bykeeping Missouri at the bottom in national com-parisons of the length of the school year, the costmay be far greater than the benefits.
Globalization, outsourcing, business closures,the national debt, an increase in personal debt, andthe trade deficit are all warning signs. Setting thestage for education at the highest international stan-
dards is obviously part of the solution. Increasingthe length of the school year could also be part ofthe solution, but it will not happen without addi-tional funding.
It was too expensive to fix the levies in NewOrleans, so we now get to replace the city. If it is tooexpensive to fix public education in the UnitedStates, there will be even larger consequences. Thisis the richest and the best country in the world.The children, the future of our nation, deserve tohave these issues addressed. It is imperative todecide what is important and pay for it.
CONCLUSIONThe premise of this paper is to emphasize the
need to improve the school system dramatically.The economy cannot be sustained if our childrendo not compare well academically with those ofother countries. The author proposes the following:
1. Look to research for answers.
2. Lengthen the school year significantly.
3. Demand reform designed to meet interna-tional standards.
4. Demand that all children, even those wholearn quickly, are challenged every day theygo to school. Closing the gaps for varioussubgroups is a worthy goal, but those wholearn quickly are ignored at society’s peril.
5. Establish a much more focused curriculumwith emphasis on skill sets that children willneed to successfully participate in the neweconomy.
None of the suggestions listed above will beinexpensive or painless. This is a prosperous nation,with good schools and many fine traditions. If, asis often quoted, the enemy of great is good, thereneeds to be motivation to improve education. Othernations that are not constrained with the inabilityto make needed adjustments are making greatstrides academically, and it is already apparentwhen comparing economic growth. Dramaticallylengthening the school year in Missouri and theUnited States is one of the more obvious reformsneeded. This would require additional fundingand is the foundation of the author’s belief thatMissouri schools are inadequately funded.
Adams
FEDERAL RESERVE BANK OF ST. LOUIS REGIONAL ECONOMIC DEVELOPMENT VOLUME 1, NUMBER 1 2006 73
REFERENCESBarrett, Michael J. “The Case for More School Days.”
The Atlantic Monthly. November 1990, pp. 78-106;http://programs.weber.edu/eslend/educ4740/Readings/MoreSchool.html.
Cooper, James M. and Ryan, Kevin. Those Who Can,Teach. Boston, MA: Houghton Mifflin, 2004.
Education Vital Signs. American School BoardJournal, 2006 (supplement), p. 25.
Kessler, Seth A.; Stallmann, Judith I. and Winter,Steven B. “Missouri State and Local Taxes andRevenues: A Fifty-State Comparison for 2002.”University of Missouri Extension, January 25, 2006;http://muextension.missouri.edu/explore/miscpubs/mp0743.htm.
Marzano, Robert J. What Works in Schools—TranslatingResearch Into Action. Alexandria, VA: Associationfor Supervision and Curriculum Development, 2003.
National Education Association. Rankings andEstimates: A Report of School Statistics Update. NEA,Fall 2005; Table 5.
U.S. Bureau of the Census. “Personal Income per Capitain Constant (2000) Dollars, 2003.” January 25, 2006,entry (last revised: February 11, 2005);http://www.census.gov/statab/ranks/rank29.html.
U.S. Bureau of the Census. “States Ranked by Total Taxesand Per Capita Amount: 2004.” January 25, 2006,entry; http://www.census.gov/govs/statetax/04staxrank.html.
Adams
74 VOLUME 1, NUMBER 1 2006 FEDERAL RESERVE BANK OF ST. LOUIS REGIONAL ECONOMIC DEVELOPMENT

FEDERAL RESERVE BANK OF ST. LOUIS REGIONAL ECONOMIC DEVELOPMENT VOLUME 2, NUMBER 1 2006 75
Commentary
Craig LarsonSuperintendent of the Rockwood School District
above state and national averages. Further, ourgraduation rate is over 90 percent, with 90 percentof the graduates going on to higher education. Forgood reason, we market ourselves as an excellentvalue in education. Members of our Board and manymembers of the state legislature cite Rockwood asan example of quality education being provided atan affordable price.
During the past eighteen months the state hascompletely rewritten the school funding formula.Rockwood was involved in testifying and discussingthe goals of a new formula throughout the legislativeprocess. The new formula is designed to graduallyinfuse additional dollars into the school fundingformula—an additional $800 million over a seven-year period. Some would say the new formula wasadopted as a way for the state to avoid being forcedto revise the formula by losing a current court case.In fact, Rockwood has been active in the “Coalitionto Fund Excellent Schools,” an organization of oversixty school districts that are “interveners” in thecurrent school funding court case that is designedto force a revision of the state’s school fundingprocedures. The court action is being advanced byover 200 school districts that are members of the“Coalition for Educational Equity” and are suingto force the state to equalize funding for districtsaround the state. The court case is continuing inspite of the recent newly adopted funding formula.
A recent quote in the May 2005 issue ofAmerican School and University stated what seemsto be the pattern for state funding of schools inMissouri: “Ideally, states would define what is asuitable or adequate education, determine what thecosts are, and provide the funding. But legislators
M y background as an educator is incurriculum and instruction. I havespent my career working to improvethe quality of instruction in class-
rooms in suburban schools. Over the years, how-ever, I have learned the importance money playsin providing a quality educational environment. Inmy current role as superintendent of the RockwoodSchool District, the fourth largest school districtin Missouri, I am continually involved in studyingschool finance. Let me provide some backgroundinformation about the Rockwood School District.
Rockwood enrolls 22,000 students in thirtyschools and covers 150 square miles. Rockwood isfunded from several sources, with local propertytax being the largest single source of funding andrepresenting 62 percent of our revenue. Additionalmajor sources of revenue include state sales tax at10 percent, desegregation funding at 8 percent, andthe state funding formula at 6 percent. The remain-ing 14 percent of our revenue comes from over thirtysources. Rockwood’s tax rate of $4.50 is approxi-mately the average rate among the twenty-threedistricts in St. Louis County. Rockwood’s revenueis approximately $7,300 per student, not includingthe funds available for special education through theSpecial School District. This is among the lowestper-pupil expenditure among the twenty-threeSt. Louis County districts.
In spite of having the fourth-lowest fundingper student in St. Louis County and spending nearthe state’s average cost per student, Rockwood hasexceptional student achievement. Many of ourschools score at the top of the state proficiency test,and our average standardized test scores are well
Federal Reserve Bank of St. Louis Regional Economic Development, 2006, 2(1), pp. 75-76.© 2006, The Federal Reserve Bank of St. Louis. Articles may be reprinted, reproduced, published, distributed, displayed, and transmitted intheir entirety if copyright notice, author name(s), and full citation are included. Abstracts, synopses, and other derivative works may be madeonly with prior written permission of the Federal Reserve Bank of St. Louis.

tend to approach the question in a more politicallyexpedient way. They look at how much funding ispolitically feasible, and allocate that amount toschool districts.” Missouri’s new formula is anattempt to provide “adequate” funding to all stu-dents by guaranteeing a floor per-pupil expenditureto each student. But the amount of the floor, $6,100,was developed as a way for the state to avoid theneed to raise new taxes to fund the formula in theearly years. The plan assumes that future economicgrowth will allow the state to increase school fund-ing over a seven-year period.
Rockwood has advocated throughout thedevelopment of the new formula for a “need driven”formula rather than a “revenue equalization for-mula.” The new formula does provide a weightingfor students’ needs if the local district is servingmore than the average number of “at risk” students,special education students, or limited Englishproficiency students. Included within the $6,117identified as the state adequacy target are certaincategorical programs that previously were fundedseparately, including exceptional pupil aid, remedialreading, gifted funding, free text revenues, and fairshare revenues. In addition, the formula, for the firsttime, includes a dollar value modifier to recognizedifferences in the regional cost of education. Afterthe above calculations, the district’s “local effort”is deducted and is based on the district’s assessedvalues as of January 1, 2004, multiplied by a “per-formance levy” of 3.43. In addition, certain otheritems are included in local effort such as paymentsin lieu of taxes, fines, state assessed railroad andutility taxes, and one-half of the district’s 2004-05“Proposition C” funds (a state sales tax to supportschools).
When fully phased in after seven years, thenew formula is anticipated to provide RockwoodSchool District approximately $20 million inadditional state revenues annually. Though this is
good news, our revenue grows only about $2.5 to$3 million annually as the new formula is phasedin. Although helpful, this small additional statefunding will not solve all of our financial issuesor enable the district to address all student needs.It certainly is a significant improvement from theprior twelve years when we have seen no increasesin our per-pupil state funding. This new fundingwill likely increase the portion of Rockwood’s oper-ating expenditures funded by state revenues fromthe current 9 percent to an estimated 14 percent.
The following are Rockwood’s and my majorconcerns related to the new formula:
• that it is fully funded during the plannedseven-year phase-in period, or more rapidlythan that if possible;
• that the importance of serving gifted studentsbe included in the student weightings similarto the current consideration for at-risk, specialeducation, and limited English proficiencystudents;
• that a dollar value modifier that more accu-rately reflects the true incremental cost ofproviding education in the metropolitanSt. Louis area be implemented;
• that the change in the distribution of salestax (Proposition C) revenues be phased inover a seven-year period of time similar tothe foundation formula; and
• that the penalty related to reduced summerschool participation be removed.
We are pleased that the legislature attemptedto adopt a student need–driven formula and theyincluded some recognition of regional variances inthe cost of education, but we believe the inclusionof the above-recommended changes could enhancethe new formula to be truly excellent.
Larson
76 VOLUME 2, NUMBER 1 2006 FEDERAL RESERVE BANK OF ST. LOUIS REGIONAL ECONOMIC DEVELOPMENT