federated kaufmann fund ii
TRANSCRIPT

Annual Shareholder Report
December 31, 2017
Share Class Primary Service
Federated Kaufmann Fund IIA Portfolio of Federated Insurance Series
Dear Valued Shareholder,
I am pleased to present the Annual Shareholder Report for your fund covering the period from January 1, 2017 throughDecember 31, 2017. This report includes Management’s Discussion of Fund Performance, a complete listing of your fund’sholdings, performance information and financial statements along with other important fund information.
In addition, our website, FederatedInvestors.com, offers easy access to Federated resources that include timely fund updates,economic and market insights from our investment strategists, and financial planning tools. We invite you to register to take fulladvantage of its capabilities.
Thank you for investing with Federated. I hope you find this information useful and look forward to keeping you informed.
Sincerely,
John B. Fisher, President
Not FDIC Insured ▪ May Lose Value ▪ No Bank Guarantee

CONTENTS
Management’s Discussion of Fund Performance . . . . . . . . . . . . . . . . . . . . . . . . . . . . . . . . . . . . . . . . . . . . . . . . . . . . . . . . . . . . . . . . . . . . . . . . . . . . . . . . . . . . . . . . . . . . . . . . . . . 1Portfolio of Investments Summary Table . . . . . . . . . . . . . . . . . . . . . . . . . . . . . . . . . . . . . . . . . . . . . . . . . . . . . . . . . . . . . . . . . . . . . . . . . . . . . . . . . . . . . . . . . . . . . . . . . . . . . . . . . . . . . 3Portfolio of Investments . . . . . . . . . . . . . . . . . . . . . . . . . . . . . . . . . . . . . . . . . . . . . . . . . . . . . . . . . . . . . . . . . . . . . . . . . . . . . . . . . . . . . . . . . . . . . . . . . . . . . . . . . . . . . . . . . . . . . . . . . . . . . . . . . 4Financial Highlights . . . . . . . . . . . . . . . . . . . . . . . . . . . . . . . . . . . . . . . . . . . . . . . . . . . . . . . . . . . . . . . . . . . . . . . . . . . . . . . . . . . . . . . . . . . . . . . . . . . . . . . . . . . . . . . . . . . . . . . . . . . . . . . . . . . . . 10Statement of Assets and Liabilities . . . . . . . . . . . . . . . . . . . . . . . . . . . . . . . . . . . . . . . . . . . . . . . . . . . . . . . . . . . . . . . . . . . . . . . . . . . . . . . . . . . . . . . . . . . . . . . . . . . . . . . . . . . . . . . . . . . . 12Statement of Operations . . . . . . . . . . . . . . . . . . . . . . . . . . . . . . . . . . . . . . . . . . . . . . . . . . . . . . . . . . . . . . . . . . . . . . . . . . . . . . . . . . . . . . . . . . . . . . . . . . . . . . . . . . . . . . . . . . . . . . . . . . . . . . . . 13Statement of Changes in Net Assets . . . . . . . . . . . . . . . . . . . . . . . . . . . . . . . . . . . . . . . . . . . . . . . . . . . . . . . . . . . . . . . . . . . . . . . . . . . . . . . . . . . . . . . . . . . . . . . . . . . . . . . . . . . . . . . . . . 14Notes to Financial Statements . . . . . . . . . . . . . . . . . . . . . . . . . . . . . . . . . . . . . . . . . . . . . . . . . . . . . . . . . . . . . . . . . . . . . . . . . . . . . . . . . . . . . . . . . . . . . . . . . . . . . . . . . . . . . . . . . . . . . . . . . 15Report of Independent Registered Public Accounting Firm . . . . . . . . . . . . . . . . . . . . . . . . . . . . . . . . . . . . . . . . . . . . . . . . . . . . . . . . . . . . . . . . . . . . . . . . . . . . . . . . . . . . . . . . 22Shareholder Expense Example . . . . . . . . . . . . . . . . . . . . . . . . . . . . . . . . . . . . . . . . . . . . . . . . . . . . . . . . . . . . . . . . . . . . . . . . . . . . . . . . . . . . . . . . . . . . . . . . . . . . . . . . . . . . . . . . . . . . . . . . 23In Memoriam . . . . . . . . . . . . . . . . . . . . . . . . . . . . . . . . . . . . . . . . . . . . . . . . . . . . . . . . . . . . . . . . . . . . . . . . . . . . . . . . . . . . . . . . . . . . . . . . . . . . . . . . . . . . . . . . . . . . . . . . . . . . . . . . . . . . . . . . . . . . . 24Board of Trustees and Trust Officers. . . . . . . . . . . . . . . . . . . . . . . . . . . . . . . . . . . . . . . . . . . . . . . . . . . . . . . . . . . . . . . . . . . . . . . . . . . . . . . . . . . . . . . . . . . . . . . . . . . . . . . . . . . . . . . . . . . 24Evaluation and Approval of Advisory Contract . . . . . . . . . . . . . . . . . . . . . . . . . . . . . . . . . . . . . . . . . . . . . . . . . . . . . . . . . . . . . . . . . . . . . . . . . . . . . . . . . . . . . . . . . . . . . . . . . . . . . . . 28Voting Proxies on Fund Portfolio Securities. . . . . . . . . . . . . . . . . . . . . . . . . . . . . . . . . . . . . . . . . . . . . . . . . . . . . . . . . . . . . . . . . . . . . . . . . . . . . . . . . . . . . . . . . . . . . . . . . . . . . . . . . . . 32Quarterly Portfolio Schedule. . . . . . . . . . . . . . . . . . . . . . . . . . . . . . . . . . . . . . . . . . . . . . . . . . . . . . . . . . . . . . . . . . . . . . . . . . . . . . . . . . . . . . . . . . . . . . . . . . . . . . . . . . . . . . . . . . . . . . . . . . . . 32

Management’s Discussion of Fund Performance (unaudited)The total return of Federated Kaufmann Fund II (the “Fund”), based on net asset value for the 12-month reporting periodended December 31, 2017, was 28.33% for the Primary Shares and 27.97% for the Service Shares. The Fund’s benchmark,the Russell Midcap® Growth Index (the RMCGI),1 a broad-based securities market index, had a total return of 25.27% forthe period. The total return of the Morningstar Insurance Mid-Cap Growth Funds Average (MIMCGFA)2 peer groupaverage for the Fund, was 25.81%. The Fund’s and MIMCGFA’s total returns for the most recently completed fiscal yearreflected actual cash flows, transaction costs and other expenses, which were not reflected in the total return of the RMCGI.
During the reporting period, the Fund’s investment strategy focused on stock selection, sector exposure and countryallocation. These were the most significant factors affecting the Fund’s performance relative to the RMCGI.
The following discussion will focus on the Fund’s Primary Shares.
MARKET OVERVIEW
As the U.S. economy enters 2018, the positive momentum in output has accelerated from its tepid pace in the previous fewyears as global growth has picked up, U.S. business confidence reached new highs and the U.S. passage of historic corporatetax reform all may help sustain the recent GDP acceleration in 2017. Earnings growth drove 2017’s equity market rallyhelped by stable global growth and a weaker dollar as well as accommodative central bank policies around the world. Globalmarkets have looked past most of the political discourse as the focus returned to company earnings and investment growthin the coming years.
Large-cap companies significantly outperformed both mid- and small-cap companies during the reporting period. TheU.S. equity markets were led by the S&P 500 Index3 which was up 21.83%. Large-cap stocks, as measured by the Russell1000® Index,4 returned 21.69%. The Russell Midcap® Index,5 representing mid-cap, returned 18.52%, and theRussell 2000® Index,6 representing small-cap stocks, returned 14.65%. Mid-cap growth stocks, as measured by the RMCGI(25.27%), also outperformed mid-cap value stocks, as measured by the Russell Midcap® Value Index7 (13.34%), throughoutthe reporting period.
The best-performing RMCGI sectors were: Utilities (64.17%), Information Technology (37.49%) and Financials(33.03%). The weakest-performing sectors during the quarter were: Energy (-5.63%), Consumer Staples (7.49%) andConsumer Discretionary (15.29%).
STOCK SELECTION
The five stocks that contributed the most to the Fund’s performance versus the RMCGI were: Corcept Therapeutics,arGEN-X, ServiceNow, Veeva Systems and Mobileye.
The five stocks that most negatively affected Fund performance were: NVIDIA, Minerva Neurosciences, ProgenicsPharmaceuticals, Illumina and U.S. Silica Holdings.
SECTOR EXPOSURE
At the end of the reporting period, approximately 72% of the portfolio was invested in four large sectors: Health Care,Information Technology, Industrials and Consumer Discretionary. These sectors have historically provided goodopportunities for bottom-up growth investors. In 2017, stock selection in Health Care and Information Technology had apositive impact on performance. The Fund maintained higher-than-benchmark exposure to cash which hurt Fundperformance. The cash position of the Fund was approximately 14.02% on average throughout the reporting period.
COUNTRY ALLOCATION
The reporting period ended with approximately 17% of the Fund invested in non-U.S. holdings. During the reportingperiod, stock selection in foreign companies8 was a positive contributor to Fund performance. However, the allocationoutside the U.S. hurt Fund performance relative to the RMCGI.
1 Please see the footnotes to the line graphs below for definitions of, and further information about, the RMCGI.
2 Please see the footnotes to the line graphs below for definitions of, and further information about, the MIMCGFA.
3 The S&P 500 is a capitalization-weighted index of 500 stocks designed to measure performance of the broad domestic economy through changes in the aggregatemarket value of 500 stocks representing all major industries.*
4 The Russell 1000® Index measures the performance of the small-cap segment of the U.S. equity universe. It includes approximately 1000 of the smallest securitiesbased on a combination of their market cap and current index membership.*
5 The Russell Midcap® Index measures the performance of the mid-cap segment of the U.S. equity universe. The Russell Midcap® Index is a subset of the Russell1000® Index. It includes approximately 800 of the smallest securities based on a combination of their market cap and current index membership.*
6 The Russell 2000® Index measures the performance of the small-cap segment of the U.S. equity universe. It includes approximately 2000 of the smallest securitiesbased on a combination of their market cap and current index membership.*
7 The Russell Midcap® Value Index measures the performance of the mid-cap value segment of the U.S. equity universe. It includes those Russell Midcap Indexcompanies with lower price-to-book ratios and lower forecasted growth values.*
8 International investing involves special risks including currency risk, increased volatility, political risks and differences in auditing and other financial standards.
* The index is unmanaged, and it is not possible to invest directly in an index.
Annual Shareholder Report1

FUND PERFORMANCE AND GROWTH OF A $10,000 INVESTMENT
The graph below illustrates the hypothetical investment of $10,0001 in the Federated Kaufmann Fund II fromDecember 31, 2007 to December 31, 2017, compared to the Russell Midcap® Growth Index (RMCGI)2 and theMorningstar Insurance Mid-Cap Growth Funds Average (MIMCGFA).3 The Average Annual Total Return table belowshows returns for each class averaged over the stated periods.
GROWTH OF A $10,000 INVESTMENT
Growth of $10,000 as of December 31, 2017
Federated Kaufmann Fund II - Primary SharesFederated Kaufmann Fund II - Service SharesRMCGI MIMCGFA
$4,000
$7,000
$10,000
$13,000
$16,000
$19,000
$22,000
$25,000
12/31/07 12/31/1712/08 12/09 12/10 12/11 12/12 12/13 12/14 12/15 12/16
$19,679$19,196
$23,895$20,527
The Fund offers multiple share classes whose performance may be greater or less than its other share class(es) due todifferences in sales charges and expenses.
Average Annual Total Returns for the Period Ended 12/31/2017
1 Year 5 Years 10 Years
Primary Shares 28.33% 16.82% 7.00%
Service Shares 27.97% 16.51% 6.74%
RMCGI 25.27% 15.30% 9.10%
MIMCGFA 25.81% 13.89% 7.46%
Performance data quoted represents past performance which is no guarantee of future results. Investmentreturn and principal value will fluctuate so that an investor’s shares, when redeemed, may be worth more orless than their original cost. Performance of a variable investment option changes over time and currentperformance may be lower or higher than what is stated. For current to the most recent month-endperformance, contact your insurance company.The performance information presented does not include thecharges and expenses imposed by the insurance company under the variable insurance product contract.Theinclusion of such charges would lower performance. Please refer to the variable insurance product prospectusfor a complete listing of these expenses. Fund shares are available exclusively as a funding vehicle for lifeinsurance companies writing variable life insurance policies and variable annuity contracts.Variableinvestment options are not obligations of or guaranteed by any bank and are not federally insured.
1 The Fund’s performance assumes the reinvestment of all dividends and distributions. The RMCGI and MIMCGFA have been adjusted to reflect reinvestment ofdividends on securities in the index and average.
2 The RMCGI measures the performance of the mid-cap growth segment of the U.S. equity universe. It includes those Russell Midcap® Index companies with higherprice-to-book ratios and higher forecasted growth values. The RMCGI is constructed to provide a comprehensive and unbiased barometer of the mid-cap growthmarket. The RMCGI is completely reconstituted annually to ensure larger stocks do not distort the performance and characteristics of the true mid-cap growthmarket. The RMCGI is not adjusted to reflect sales charges, expenses or other fees that the Securities and Exchange Commission requires to be reflected in theFund’s performance. The index is unmanaged and unlike the Fund, is not affected by cash flows. It is not possible to invest directly in an index.
3 Morningstar figures represent the average of the total returns reported by all the funds designated by Morningstar as falling into the respective category indicated.They do not reflect sales charges. The Morningstar figures in the Growth of $10,000 line graph are based on historical return information published by Morningstarand reflect the return of the funds comprising the category in the year of publication. Because the funds designated by Morningstar as falling into the category canchange over time, the Morningstar figures in the line graph may not match the Morningstar figures in the Average Annual Total Returns table, which reflect thereturn of the funds that currently comprise the category.
Annual Shareholder Report2

Portfolio of Investments Summary Table (unaudited)At December 31, 2017, the Fund’s sector composition1 was as follows:
Sector CompositionPercentage of
Total Net Assets
Health Care 30.2%
Information Technology 24.0%
Industrials 9.3%
Consumer Discretionary 8.9%
Financials 6.4%
Materials 4.9%
Real Estate 1.8%
Consumer Staples 0.8%
Energy 0.7%
Derivative Contracts2,3 0.0%
Securities Lending Collateral4 1.7%
Cash Equivalents5 12.9%
Other Assets and Liabilities—Net6 (1.6)%
TOTAL 100.0%
1 Except for Securities Lending Collateral, Cash Equivalents and Other Assets and Liabilities, sector classifications are based upon, and individual portfolio securitiesare assigned to, the classifications of the Global Industry Classification Standard (GICS), except that the Adviser assigns a classification to securities not classifiedby the GICS and to securities for which the Adviser does not have access to the classification made by the GICS.
2 Represents less than 0.1%.
3 Based upon net unrealized appreciation (depreciation) or value of the derivative contracts as applicable. Derivative contracts may consist of futures, forwards,options and swaps. The impact of a derivative contract on the Fund’s performance may be larger than its unrealized appreciation (depreciation) or value mayindicate. In many cases, the notional value or amount of a derivative contract may provide a better indication of the contract’s significance to the portfolio. Morecomplete information regarding the Fund’s direct investments in derivative contracts, including unrealized appreciation (depreciation), value and notional values oramounts of such contracts, can be found in the table at the end of the Portfolio of Investments included in this Report.
4 Cash collateral received from lending portfolio securities which is invested in short-term investments such as repurchase agreements or money marketmutual funds.
5 Cash Equivalents include any investments in money market mutual funds and/or overnight repurchase agreements other than those representing securitieslending collateral.
6 Assets, other than investments in securities and derivative contracts, less liabilities. See Statement of Assets and Liabilities.
Annual Shareholder Report3

Portfolio of InvestmentsDecember 31, 2017
PrincipalAmount
or Shares Value
COMMON STOCKS—87.0%
Consumer Discretionary—8.9%
1,395 1Amazon.com, Inc. $ 1,631,411
5,530 Ctrip.com International Ltd., ADR 243,873
34,900 1Floor & Decor Holdings, Inc. 1,698,932
10,445 Hilton Worldwide Holdings, Inc. 834,138
10,900 1JD.com, Inc., ADR 451,478
18,880 Las Vegas Sands Corp. 1,311,971
3,600 1Mohawk Industries, Inc. 993,240
11,000 Moncler S.p.A 343,668
1,024,477 NagaCorp Limited 791,170
253 1Priceline.com, Inc. 439,648
100,000 Samsonite International SA 459,348
12,700 Six Flags Entertainment Corp. 845,439
15,895 Starbucks Corp. 912,850
3,255 Vail Resorts, Inc. 691,590
15,100 2Wingstop, Inc. 588,598
16,000 1,2Yoox Net-A-Porter Group 558,457
TOTAL 12,795,811
Consumer Staples—0.8%
8,800 1Blue Buffalo Pet Products, Inc. 288,552
3,500 Constellation Brands, Inc., Class A 799,995
TOTAL 1,088,547
Energy—0.7%
33,050 US Silica Holdings, Inc. 1,076,108
Financials—6.4%
5,570 Affiliated Managers Group 1,143,243
6,470 BlackRock, Inc. 3,323,704
16,500 CIT Group Holdings, Inc. 812,295
28,900 Chimera Investment Corp. 534,072
152,600 FinecoBank Banca Fineco SPA 1,559,749
21,900 3Hamilton Lane, Inc. 775,041
68,300 Mediobanca Spa 773,536
20,200 1,2Qudian, Inc., ADR 253,308
TOTAL 9,174,948
Health Care—30.2%
7,500 Agilent Technologies, Inc. 502,275
4,800 1Align Technology, Inc. 1,066,512
5,900 1Alnylam Pharmaceuticals, Inc. 749,595
21,100 1Amphastar Pharmaceuticals, Inc. 405,964
6,685 1AnaptysBio, Inc. 673,313
45,023 1,3arGEN-x N.V. 2,833,434
17,450 1Argenx SE, ADR 1,101,793
142,420 1,4BioNano Genomics, Inc. 0
23,800 1Boston Scientific Corp. 590,002
3,721 1CRISPR Therapeutics AG 87,369
13,800 1Clementia Pharmaceuticals, Inc. 261,924
130,000 1,3ContraFect Corp. 131,300
Annual Shareholder Report4

PrincipalAmount
or Shares Value
COMMON STOCKS—continued
Health Care—continued
3,000 Cooper Cos., Inc. $ 653,640
296,737 1,3Corcept Therapeutics, Inc. 5,359,070
22,100 Danaher Corp. 2,051,322
220,470 1,3,4Dyax Corp. 531,333
47,400 1Dynavax Technologies Corp. 886,380
6,500 1Edwards Lifesciences Corp. 732,615
6,400 1GW Pharmaceuticals PLC, ADR 844,864
12,700 1Galapagos NV 1,203,108
21,500 1Galapagos NV, ADR 2,015,840
10,300 1Genmab A/S 1,707,987
9,278 1Glaukos Corp. 237,981
120,194 1Horizon Discovery Group PLC 388,570
3,600 1IDEXX Laboratories, Inc. 562,968
4,500 1Insulet Corp. 310,500
8,550 1Intellia Therapeutics, Inc. 164,331
23,200 1Intersect ENT, Inc. 751,680
155,287 1,3Minerva Neurosciences, Inc. 939,486
3,775 1Myokardia, Inc. 158,927
25,400 1Nektar Therapeutics 1,516,888
5,900 1Nevro Corp. 407,336
7,960 1PRA Health Sciences, Inc. 724,917
10,200 1Penumbra, Inc. 959,820
22,220 1,2Poxel SA 174,509
247,662 1,3Progenics Pharmaceuticals, Inc. 1,473,589
3,321 1,2Protalix Biotherapeutics, Inc. 2,196
17,700 1Repligen Corp. 642,156
83,400 1,2,3SCYNEXIS, Inc. 193,488
28,340 1,2Seres Therapeutics, Inc. 287,367
39,800 1,2Spark Therapeutics, Inc. 2,046,516
28,534 1,3,5SteadyMed Ltd. 105,576
2,945 1,3,5SteadyMed Ltd. 9,218
59,406 1,3SteadyMed Ltd. 221,481
4,400 Stryker Corp. 681,296
4,584 1Tesaro, Inc. 379,876
22,800 1Ultragenyx Pharmaceutical, Inc. 1,057,464
63,500 1Veeva Systems, Inc. 3,510,280
30,933 1Zogenix, Inc. 1,238,867
TOTAL 43,536,923
Industrials—9.3%
42,600 Air Lease Corp. 2,048,634
9,500 Alaska Air Group, Inc. 698,345
25,200 1Azul S.A., ADR 600,516
5,800 Fortive Corp. 419,630
10,300 Heico Corp. 971,805
13,124 KAR Auction Services, Inc. 662,893
10,500 Osram Licht AG 940,101
25,000 REV Group, Inc. 813,250
3,800 Raytheon Co. 713,830
8,400 Roper Technologies, Inc. 2,175,600
Annual Shareholder Report5

PrincipalAmount
or Shares Value
COMMON STOCKS—continued
Industrials—continued
8,800 1Verisk Analytics, Inc. $ 844,800
5,733 1WageWorks, Inc. 355,446
22,910 1XPO Logistics, Inc. 2,098,327
TOTAL 13,343,177
Technology—24.0%
3,000 1Adobe Systems, Inc. 525,720
95,000 1Advanced Micro Devices, Inc. 976,600
8,745 1Alibaba Group Holding Ltd., ADR 1,507,900
15,700 Amadeus IT Group S.A. 1,130,034
6,100 Broadcom Ltd. 1,567,090
11,150 Cognex Corp. 681,934
6,145 1CoStar Group, Inc. 1,824,758
30,000 1Coupa Software, Inc. 936,600
195,235 Evry AS 773,222
82,600 1GDS Holdings Ltd., ADR 1,860,978
27,200 1GoDaddy, Inc. 1,367,616
18,770 1GrubHub, Inc. 1,347,686
37,100 Marvell Technology Group Ltd. 796,537
33,100 1Microsemi Corp. 1,709,615
10,970 1MindBody, Inc. 334,036
16,545 1Q2 Holdings, Inc. 609,683
35,550 1RADWARE Ltd. 689,670
13,880 1RealPage, Inc. 614,884
4,500 1Red Hat, Inc. 540,450
16,914 STMicroelectronics N.V., ADR 369,402
11,400 1Salesforce.com, Inc. 1,165,422
25,410 1ServiceNow, Inc. 3,313,210
9,000 1Shopify, Inc. 909,000
34,920 1Splunk, Inc. 2,892,773
10,500 1Tyler Technologies, Inc. 1,859,025
16,825 1Vantiv, Inc. 1,237,479
23,715 1Workday, Inc. 2,412,764
14,995 1,2Zillow Group, Inc. 613,595
TOTAL 34,567,683
Materials—4.9%
7,840 Albemarle Corp. 1,002,657
3,900 Eagle Materials, Inc. 441,870
10,200 1Ingevity Corp. 718,794
5,000 Martin Marietta Materials 1,105,200
6,370 Sherwin-Williams Co. 2,611,955
11,700 Westlake Chemical Corp. 1,246,401
TOTAL 7,126,877
Real Estate—1.8%
7,300 1CBRE Group, Inc. 316,163
9,470 Crown Castle International Corp. 1,051,265
10,935 MGM Growth Properties LLC 318,755
13,900 Ryman Hospitality Properties 959,378
TOTAL 2,645,561
TOTAL COMMON STOCKS(IDENTIFIED COST $74,164,336) 125,355,635
Annual Shareholder Report6

PrincipalAmount
or Shares Value
WARRANTS—0.0%
Health Care—0.0%
42,500 1,3ContraFect Corp., Warrants $ 14,684
87,500 1,3ContraFect Corp., Warrants 24,649
21,060 1,3SCYNEXIS, Inc., Warrants 23,922
TOTAL WARRANTS(IDENTIFIED COST $1,300) 63,255
REPURCHASE AGREEMENT—14.6%
$18,584,000 Interest in $950,000,000 joint repurchase agreement 1.42%, dated 12/29/2017 under which Bank of America, N.A. will repurchasesecurities provided as collateral for $950,149,889 on 1/2/2018. The securities provided as collateral at the end of the period heldwith BNY Mellon as tri-party agent, were U.S. Government Agency securities maturing on 7/20/2046 and the market value of thoseunderlying securities was $969,152,887. 18,584,000
2,377,411 Interest in $950,000,000 joint repurchase agreement 1.42%, dated 12/29/2017 under which Bank of America, N.A. will repurchasesecurities provided as collateral for $950,149,889 on 1/2/2018. The securities provided as collateral at the end of the period heldwith BNY Mellon as tri-party agent, were U.S. Government Agency securities maturing on 7/20/2046 and the market value of thoseunderlying securities was $969,152,887. (purchased with proceeds from securities lending collateral). 2,377,411
TOTAL REPURCHASE AGREEMENTS(AT COST) 20,961,411
TOTAL INVESTMENT IN SECURITIES—101.6%(IDENTIFIED COST $95,127,047)6 146,380,301
OTHER ASSETS AND LIABILITIES-NET—(1.6)%7 (2,358,248)
TOTAL NET ASSETS—100% $ 144,022,053
At December 31, 2017, the Fund had the following outstanding futures contracts:
DescriptionNumber ofContracts
NotionalValue
ExpirationDate
Value andUnrealized
Depreciation1S&P 500 E-Mini Index Short Futures 16 $2,140,800 March 2018 $(14,872)
1 Non-income-producing security.
2 All or a portion of these securities are temporarily on loan to unaffiliated broker/dealers.
Annual Shareholder Report7

3 Affiliated companies.
An affiliated company is a company in which the Fund has ownership of at least 5% of the voting shares. Transactions with affiliated companiesduring the year ended December 31, 2017, were as follows:
Balance ofShares
Held12/31/2016
Purchases/Additions
Sales/Reductions
Balance ofShares
Held12/31/2017 Value
Change inUnrealized
Appreciation/Depreciation
NetRealized
Gain/(Loss)DividendIncome
arGEN-x 34,394 10,629 (—) 45,023 $ 2,833,434 $2,081,400 $ — $ —
ContraFect Corp. 42,500 87,500 (—) 130,000 $ 131,300 $ (51,575) $ — $ —
ContraFect Corp., Warrants 42,500 — (—) 42,500 $ 14,684 $ (24,306) $ — $ —
ContraFect Corp., Warrants — 87,500 (—) 87,500 $ 24,649 $ 23,774 $ — $ —
Corcept Therapeutics, Inc. 303,000 54,082 (60,345) 296,737 $ 5,359,070 $2,817,885 $ 412,089 $ —
Dyax Corp. 220,470 — (—) 220,470 $ 531,333 $ 286,611 $ — $ —
*Dynavax Technologies Corp. 56,654 — (9,254) 47,400 $ 886,380 $ 913,005 $(143,514) $ —
Hamilton Lane, Inc. — 21,900 (—) 21,900 $ 775,041 $ 372,223 $ — $11,167
Minerva Neurosciences, Inc. 122,882 32,405 (—) 155,287 $ 939,486 $ (753,227) $ — $ —
Progenics Pharmaceuticals, Inc. 275,600 10,567 (38,505) 247,662 $ 1,473,589 $ (657,787) $ (35,471) $ —
*Protalix Biotherapeutics, Inc. 38,203 — (34,882) 3,321 $ 2,196 $ 11,218 $ (4,046) $ —
SCYNEXIS, Inc. 66,360 17,040 (—) 83,400 $ 193,488 $ (48,084) $ — $ —
SCYNEXIS, Inc. Warrants 21,060 — (—) 21,060 $ 23,922 $ (14,805) $ — $ —
SteadyMed Ltd. 28,534 — (—) 28,534 $ 105,576 $ 29,961 $ — $ —
SteadyMed Ltd. 2,945 — (—) 2,945 $ 9,218 $ 6,967 $ — $ —
SteadyMed Ltd. 27,200 32,206 (—) 59,406 $ 221,481 $ 29,164 $ — $ —
*Zogenix, Inc. 31,400 7,133 (7,600) 30,933 $ 1,238,867 $ 711,474 $ (59,189) $ —
Affiliated issuers no longer in the portfolio at period end 316,184 — (316,184) — $ — $ 49,535 $(836,521) $ —
TOTAL OF AFFILIATED TRANSACTIONS 1,629,886 360,962 (466,770) 1,524,078 $14,763,714 $5,783,433 $(666,652) $11,167
* At December 31, 2017, the Fund no longer has ownership of at least 5% of the voting shares.
4 Market quotations and price evaluations are not available. Fair value determined using significant unobservable inputs in accordance with procedures established byand under the general supervision of the Fund’s Board of Trustees (the “Trustees”).
5 Denotes a restricted security that either: (a) cannot be offered for public sale without first being registered, or availing of an exemption from registration, under theSecurities Act of 1933; or (b) is subject to a contractual restriction on public sales. At December 31, 2017, these restricted securities amounted to $114,794, whichrepresented 0.1% of total net assets.
6 The cost of investments for federal tax purposes amounts to $95,470,944.
7 Assets, other than investments in securities, less liabilities. See Statement of Assets and Liabilities.
Note: The categories of investments are shown as a percentage of total net assets at December 31, 2017.
Various inputs are used in determining the value of the Fund’s investments. These inputs are summarized in the three broad levels listed below:
Level 1—quoted prices in active markets for identical securities.
Level 2—other significant observable inputs (including quoted prices for similar securities, interest rates, prepayment speeds, credit risk, etc.).Also includes securities valued at amortized cost.
Level 3—significant unobservable inputs (including the Fund’s own assumptions in determining the fair value of investments).
The inputs or methodology used for valuing securities are not an indication of the risk associated with investing in those securities.
Annual Shareholder Report8

The following is a summary of the inputs used, as of December 31, 2017, in valuing the Fund’s assets carried at fair value:
Valuation Inputs
Level 1—QuotedPrices
Level 2—Other
SignificantObservable
Inputs
Level 3—Significant
UnobservableInputs Total
Equity Securities:
Common Stocks
Domestic $ 97,289,592 $ — $531,333 $ 97,820,925
International 13,897,817 13,636,893 — 27,534,710
Debt Securities:
Warrants — 63,255 — 63,255
Repurchase Agreements — 20,961,411 — 20,961,411
TOTAL SECURITIES $111,187,409 $34,661,559 $531,333 $146,380,301
Other Financial Instruments1
Liabilities $ (14,872) $ — $ — $ (14,872)
TOTAL OTHER FINANCIAL INSTRUMENTS $ (14,872) $ — $ — $ (14,872)
1 Other financial instruments include futures contracts.
The following acronym is used throughout this portfolio:
ADR—American Depositary Receipt
See Notes which are an integral part of the Financial Statements
Annual Shareholder Report9

Financial Highlights – Primary Shares(For a Share Outstanding Throughout Each Period)
Year Ended December 31 2017 2016 2015 2014 2013
Net Asset Value, Beginning of Period $16.70 $17.42 $18.92 $19.22 $15.06
Income From Investment Operations:
Net investment income (loss) (0.14)1 (0.11)1 (0.15)1 (0.15)1 (0.12)1
Net realized and unrealized gain on investments, futures contracts andforeign currency transactions 4.54 0.56 1.44 1.91 5.76
TOTAL FROM INVESTMENT OPERATIONS 4.40 0.45 1.29 1.76 5.64
Less Distributions:
Distributions from net realized gain on investments, futures contracts andforeign currency transactions (1.94) (1.17) (2.79) (2.06) (1.48)
Net Asset Value, End of Period $19.16 $16.70 $17.42 $18.92 $19.22
Total Return2 28.33% 3.66% 6.37% 9.71% 40.12%
Ratios to Average Net Assets:
Net expenses 1.54% 1.54%3 1.53%3 1.53%3 1.53%3
Net investment income (loss) (0.77)% (0.67)% (0.84)% (0.83)% (0.75)%
Expense waiver/reimbursement4 —% 0.03% 0.00%5 0.09% 0.25%
Supplemental Data:
Net assets, end of period (000 omitted) $47,985 $42,122 $46,450 $49,425 $53,392
Portfolio turnover 44% 59% 60% 51% 71%
1 Per share numbers have been calculated using the average shares method.
2 Based on net asset value. Total returns do not reflect any additional fees or expenses that may be imposed by separate accounts of insurance companies or inconnection with any variable annuity or variable life insurance contract.
3 The net expense ratio is calculated without reduction for expense offset arrangements. The net expense ratios are 1.54%, 1.53%, 1.53% and 1.53% for the yearsended December 31, 2016, 2015, 2014 and 2013, respectively, after taking into account these expense reductions.
4 This expense decrease is reflected in both the net expense and the net investment income (loss) ratios shown above.
5 Represents less than 0.01%.
See Notes which are an integral part of the Financial Statements
Annual Shareholder Report10

Financial Highlights – Service Shares(For a Share Outstanding Throughout Each Period)
Year Ended December 31 2017 2016 2015 2014 2013
Net Asset Value, Beginning of Period $16.04 $16.82 $18.39 $18.78 $14.79
Income From Investment Operations:
Net investment income (loss) (0.17)1 (0.14)1 (0.19)1 (0.19)1 (0.16)1
Net realized and unrealized gain on investments, futures contracts andforeign currency transactions 4.33 0.53 1.41 1.86 5.63
TOTAL FROM INVESTMENT OPERATIONS 4.16 0.39 1.22 1.67 5.47
Less Distributions:
Distributions from net realized gain on investments, futures contracts andforeign currency transactions (1.94) (1.17) (2.79) (2.06) (1.48)
Net Asset Value, End of Period $18.26 $16.04 $16.82 $18.39 $18.78
Total Return2 27.97% 3.42% 6.15% 9.43% 39.67%
Ratios to Average Net Assets:
Net expenses 1.79% 1.79%3 1.78%3 1.78%3 1.78%3
Net investment income (loss) (1.02)% (0.92)% (1.07)% (1.08)% (1.00)%
Expense waiver/reimbursement4 —% 0.03% 0.00%5 0.09% 0.25%
Supplemental Data:
Net assets, end of period (000 omitted) $96,037 $78,870 $91,458 $69,369 $70,159
Portfolio turnover 44% 59% 60% 51% 71%
1 Per share numbers have been calculated using the average shares method.
2 Based on net asset value. Total returns do not reflect any additional fees or expenses that may be imposed by separate accounts of insurance companies or inconnection with any variable annuity or variable life insurance contract.
3 The net expense ratio is calculated without reduction for expense offset arrangements. The net expense ratios are 1.79%, 1.78%, 1.78% and 1.78% for the yearsended December 31, 2016, 2015, 2014 and 2013, respectively, after taking into account these expense reductions.
4 This expense decrease is reflected in both the net expense and the net investment income (loss) ratios shown above.
5 Represents less than 0.01%.
See Notes which are an integral part of the Financial Statements
Annual Shareholder Report11

Assets:
Investment in repurchase agreements $ 20,961,411
Investment in securities 125,418,890
Investment in securities, at value including $2,267,520 of securities loaned (Note 2) and including $12,636,271 of investment inaffiliated companies (identified cost $95,127,047) $146,380,301
Cash 595
Restricted cash (Note 2) 72,000
Income receivable 63,000
Receivable for investments sold 4,199
Receivable for shares sold 300,227
TOTAL ASSETS 146,820,322
Liabilities:
Payable for investments purchased 99,980
Payable for shares redeemed 175,342
Payable for daily variation margin on futures contracts 28,953
Payable for collateral due to broker for securities lending 2,377,411
Payable to adviser (Note 5) 15,454
Payable for administrative fees (Note 5) 953
Payable for distribution services fee (Note 5) 20,083
Accrued expenses (Note 5) 80,093
TOTAL LIABILITIES 2,798,269
Net assets for 7,764,138 shares outstanding $144,022,053
Net Assets Consist of:
Paid-in capital $ 81,756,415
Net unrealized appreciation of investments, futures contracts and translation of assets and liabilities in foreign currency 51,238,375
Accumulated net realized gain on investments, futures contracts and foreign currency transactions 11,228,009
Accumulated net investment income (loss) (200,746)
TOTAL NET ASSETS $144,022,053
Net Asset Value, Offering Price and Redemption Proceeds Per Share
Primary Shares:
Net asset value per share ($47,984,567 ÷ 2,504,671 shares outstanding), no par value, unlimited shares authorized $19.16
Service Shares:
Net asset value per share ($96,037,486 ÷ 5,259,467 shares outstanding), no par value, unlimited shares authorized $18.26
See Notes which are an integral part of the Financial Statements
Statement of Assets and LiabilitiesDecember 31, 2017
Annual Shareholder Report12

Investment Income:
Dividends (including $11,167 received from affiliated companies, see footnotes to Portfolio of Investments and net of foreigntaxes withheld of $15,376) $ 802,671
Interest 168,288
Net income on securities loaned 52,110
TOTAL INCOME 1,023,069
Expenses:
Investment adviser fee (Note 5) $1,730,320
Administrative fee (Note 5) 105,404
Custodian fees 27,199
Transfer agent fee 14,050
Directors’/Trustees’ fees (Note 5) 2,244
Auditing fees 33,400
Legal fees 5,630
Portfolio accounting fees 65,958
Distribution services fee (Note 5) 219,414
Printing and postage 37,325
Miscellaneous (Note 5) 29,108
TOTAL EXPENSES 2,270,052
Net investment income (loss) (1,246,983)
Realized and Unrealized Gain (Loss) on Investments, Futures Contracts and Foreign Currency Transactions:
Net realized gain on investments (including net realized loss of $666,652 on sales of investments in affiliated companies) 12,563,097
Net realized gain on foreign currency transactions 824
Net realized loss on futures contracts (149,899)
Net change in unrealized appreciation of investments (including net change in unrealized appreciation of $5,783,433 oninvestments in affiliated companies) 21,581,778
Net change in unrealized appreciation/depreciation of translation of assets and liabilities in foreign currency (274)
Net change in unrealized appreciation of futures contracts (21,823)
Net realized and unrealized gain on investments, futures contracts and foreign currency transactions 33,973,703
Change in net assets resulting from operations $32,726,720
See Notes which are an integral part of the Financial Statements
Statement of OperationsYear Ended December 31, 2017
Annual Shareholder Report13

Year Ended December 31 2017 2016
Increase (Decrease) in Net Assets
Operations:
Net investment income (loss) $ (1,246,983) $ (1,035,272)
Net realized gain on investments, futures contracts and foreign currency transactions 12,414,022 14,317,142
Net change in unrealized appreciation/depreciation of investments, futures contracts and translation of assets and liabilities inforeign currency 21,559,681 (9,799,042)
CHANGE IN NET ASSETS RESULTING FROM OPERATIONS 32,726,720 3,482,828
Distributions to Shareholders:
Distributions from net realized gain on investments, futures contracts and foreign currency transactions
Primary Shares (4,734,296) (3,022,416)
Service Shares (9,289,863) (6,304,411)
CHANGE IN NET ASSETS RESULTING FROM DISTRIBUTIONS TO SHAREHOLDERS (14,024,159) (9,326,827)
Share Transactions:
Proceeds from sale of shares 18,372,467 16,376,937
Net asset value of shares issued to shareholders in payment of distributions declared 14,024,145 9,326,827
Cost of shares redeemed (28,069,059) (36,775,523)
CHANGE IN NET ASSETS RESULTING FROM SHARE TRANSACTIONS 4,327,553 (11,071,759)
Change in net assets 23,030,114 (16,915,758)
Net Assets:
Beginning of period 120,991,939 137,907,697
End of period (including accumulated net investment income (loss) of $(200,746) and $(192,101), respectively) $144,022,053 $120,991,939
See Notes which are an integral part of the Financial Statements
Statement of Changes in Net Assets
Annual Shareholder Report14

Notes to Financial StatementsDecember 31, 2017
1. ORGANIZATION
Federated Insurance Series (the “Trust”) is registered under the Investment Company Act of 1940, as amended (the “Act”), as an open-endmanagement investment company. The Trust consists of seven portfolios. The financial statements included herein are only those of FederatedKaufmann Fund II (the “Fund”), a diversified portfolio. The financial statements of the other portfolios are presented separately. The assets of eachportfolio are segregated and a shareholder’s interest is limited to the portfolio in which shares are held. Each portfolio pays its own expenses. TheFund offers two classes of shares: Primary Shares and Service Shares. All shares of the Fund have equal rights with respect to voting, except onclass-specific matters. Fund shares are available exclusively as a funding vehicle for life insurance companies writing variable life insurancepolicies and variable annuity contracts. The investment objective of the Fund is capital appreciation.
2. SIGNIFICANT ACCOUNTING POLICIES
The following is a summary of significant accounting policies consistently followed by the Fund in the preparation of its financial statements.These policies are in conformity with U.S. generally accepted accounting principles (GAAP).
Investment ValuationIn calculating its net asset value (NAV), the Fund generally values investments as follows:
� Equity securities listed on an exchange or traded through a regulated market system are valued at their last reported sale price or officialclosing price in their principal exchange or market.
� Fixed-income securities are fair valued using price evaluations provided by a pricing service approved by the Trustees.
� Shares of other mutual funds or non-exchange-traded investment companies are valued based upon their reported NAVs.
� Derivative contracts listed on exchanges are valued at their reported settlement or closing price, except that options are valued at the mean ofclosing bid and asked quotations.
� Over-the-counter (OTC) derivative contracts are fair valued using price evaluations provided by a pricing service approved by the Trustees.
� For securities that are fair valued in accordance with procedures established by and under the general supervision of the Trustees, certainfactors may be considered such as: the last traded or purchase price of the security, information obtained by contacting the issuer or dealers,analysis of the issuer’s financial statements or other available documents, fundamental analytical data, the nature and duration of restrictionson disposition, the movement of the market in which the security is normally traded, public trading in similar securities or derivative contracts ofthe issuer or comparable issuers, movement of a relevant index, or other factors including but not limited to industry changes and relevantgovernment actions.
If any price, quotation, price evaluation or other pricing source is not readily available when the NAV is calculated, if the Fund cannot obtain priceevaluations from a pricing service or from more than one dealer for an investment within a reasonable period of time as set forth in the Fund’svaluation policies and procedures, or if information furnished by a pricing service, in the opinion of the valuation committee (“ValuationCommittee”), is deemed not representative of the fair value of such security, the Fund uses the fair value of the investment determined inaccordance with the procedures described below. There can be no assurance that the Fund could obtain the fair value assigned to an investmentif it sold the investment at approximately the time at which the Fund determines its NAV per share.
Fair Valuation and Significant Events ProceduresThe Trustees have ultimate responsibility for determining the fair value of investments for which market quotations are not readily available. TheTrustees have appointed a Valuation Committee comprised of officers of the Fund, Federated Equity Management Company of Pennsylvania(“Adviser”) and certain of the Adviser’s affiliated companies to assist in determining fair value and in overseeing the calculation of the NAV. TheTrustees have also authorized the use of pricing services recommended by the Valuation Committee to provide fair value evaluations of the currentvalue of certain investments for purposes of calculating the NAV. The Valuation Committee employs various methods for reviewing third-partypricing-service evaluations including periodic reviews of third-party pricing services’ policies, procedures and valuation methods (including keyinputs, methods, models and assumptions), transactional back-testing, comparisons of evaluations of different pricing services, and review of pricechallenges by the Adviser based on recent market activity. In the event that market quotations and price evaluations are not available for aninvestment, the Valuation Committee determines the fair value of the investment in accordance with procedures adopted by the Trustees. TheTrustees periodically review and approve the fair valuations made by the Valuation Committee and any changes made to the procedures.
Factors considered by pricing services in evaluating an investment include the yields or prices of investments of comparable quality, coupon,maturity, call rights and other potential prepayments, terms and type, reported transactions, indications as to values from dealers and generalmarket conditions. Some pricing services provide a single price evaluation reflecting the bid-side of the market for an investment (a “bid”evaluation). Other pricing services offer both bid evaluations and price evaluations indicative of a price between the prices bid and asked for theinvestment (a “mid” evaluation). The Fund normally uses bid evaluations for any U.S. Treasury and Agency securities, mortgage-backed securitiesand municipal securities. The Fund normally uses mid evaluations for any other types of fixed-income securities and any OTC derivative contracts.In the event that market quotations and price evaluations are not available for an investment, the fair value of the investment is determined inaccordance with procedures adopted by the Trustees.
Annual Shareholder Report15

The Trustees also have adopted procedures requiring an investment to be priced at its fair value whenever the Adviser determines that asignificant event affecting the value of the investment has occurred between the time as of which the price of the investment would otherwise bedetermined and the time as of which the NAV is computed. An event is considered significant if there is both an affirmative expectation that theinvestment’s value will change in response to the event and a reasonable basis for quantifying the resulting change in value. Examples ofsignificant events that may occur after the close of the principal market on which a security is traded, or after the time of a price evaluationprovided by a pricing service or a dealer, include:
� With respect to securities traded principally in foreign markets, significant trends in U.S. equity markets or in the trading of foreign securitiesindex futures contracts;
� Political or other developments affecting the economy or markets in which an issuer conducts its operations or its securities are traded;
� Announcements concerning matters such as acquisitions, recapitalizations, litigation developments, or a natural disaster affecting the issuer’soperations or regulatory changes or market developments affecting the issuer’s industry.
The Trustees have adopted procedures whereby the Valuation Committee uses a pricing service to determine the fair value of equity securitiestraded principally in foreign markets when the Adviser determines that there has been a significant trend in the U.S. equity markets or in indexfutures trading. For other significant events, the Fund may seek to obtain more current quotations or price evaluations from alternative pricingsources. If a reliable alternative pricing source is not available, the Fund will determine the fair value of the investment in accordance with the fairvaluation procedures approved by the Trustees. The Trustees have ultimate responsibility for any fair valuations made in response to asignificant event.
Repurchase AgreementsThe Fund may invest in repurchase agreements for short-term liquidity purposes. It is the policy of the Fund to require the other party to arepurchase agreement to transfer to the Fund’s custodian or sub-custodian eligible securities or cash with a market value (after transaction costs)at least equal to the repurchase price to be paid under the repurchase agreement. The eligible securities are transferred to accounts with thecustodian or sub-custodian in which the Fund holds a “securities entitlement” and exercises “control” as those terms are defined in the UniformCommercial Code. The Fund has established procedures for monitoring the market value of the transferred securities and requiring the transfer ofadditional eligible securities if necessary to equal at least the repurchase price. These procedures also allow the other party to require securities tobe transferred from the account to the extent that their market value exceeds the repurchase price or in exchange for other eligible securities ofequivalent market value.
The insolvency of the other party or other failure to repurchase the securities may delay the disposition of the underlying securities or cause theFund to receive less than the full repurchase price. Under the terms of the repurchase agreement, any amounts received by the Fund in excess ofthe repurchase price and related transaction costs must be remitted to the other party.
The Fund may enter into repurchase agreements in which eligible securities are transferred into joint trading accounts maintained by thecustodian or sub-custodian for investment companies and other clients advised by the Fund’s Adviser and its affiliates. The Fund will participateon a pro rata basis with the other investment companies and clients in its share of the securities transferred under such repurchase agreementsand in its share of proceeds from any repurchase or other disposition of such securities.
Repurchase agreements are subject to Master Netting Agreements (MNA) which are agreements between the Fund and its counterparties thatprovide for the net settlement of all transactions and collateral with the Fund, through a single payment, in the event of default or termination.Amounts presented on the Portfolio of Investments and Statement of Assets and Liabilities are not net settlement amounts but gross. As indicatedabove, the cash or securities to be repurchased, as shown on the Portfolio of Investments, exceeds the repurchase price to be paid under theagreement reducing the net settlement amount to zero.
Investment Income, Gains and Losses, Expenses and DistributionsInvestment transactions are accounted for on a trade-date basis. Realized gains and losses from investment transactions are recorded on anidentified-cost basis. Interest income and expenses are accrued daily. Dividend income and distributions to shareholders are recorded on the ex-dividend date. Foreign dividends are recorded on the ex-dividend date or when the Fund is informed of the ex-dividend date. Amortization/accretion of premium and discount is included in investment income. Distributions of net investment income, if any, are declared and paidannually. Non-cash dividends included in dividend income, if any, are recorded at fair value. Investment income, realized and unrealized gains andlosses, and certain fund-level expenses are allocated to each class based on relative average daily net assets, except that Primary Shares andService Shares may bear distribution services fees unique to those classes.
Dividends are declared separately for each class. No class has preferential dividend rights; differences in per share dividend rates are generallydue to differences in separate class expenses.
Federal TaxesIt is the Fund’s policy to comply with the Subchapter M provision of the Internal Revenue Code and to distribute to shareholders each yearsubstantially all of its income. Accordingly, no provision for federal income tax is necessary. As of and during the year ended December 31, 2017,the Fund did not have a liability for any uncertain tax positions. The Fund recognizes interest and penalties, if any, related to tax liabilities asincome tax expense in the Statement of Operations. As of December 31, 2017, tax years 2014 through 2017 remain subject to examination by theFund’s major tax jurisdictions, which include the United States of America and the Commonwealth of Massachusetts.
The Fund may be subject to taxes imposed by governments of countries in which it invests. Such taxes are generally based on either income orgains earned or repatriated. The Fund accrues and applies such taxes to net investment income, net realized gains and net unrealized gains asincome and/or gains are earned.
Annual Shareholder Report16
When-Issued and Delayed-Delivery TransactionsThe Fund may engage in when-issued or delayed-delivery transactions. The Fund records when-issued securities on the trade date and maintainssecurity positions such that sufficient liquid assets will be available to make payment for the securities purchased. Securities purchased on awhen-issued or delayed-delivery basis are marked to market daily and begin earning interest on the settlement date. Losses may occur on thesetransactions due to changes in market conditions or the failure of counterparties to perform under the contract.
Futures ContractsThe Fund purchases and sells financial futures contracts to manage currency risk and market risks. Upon entering into a financial futures contractwith a broker, the Fund is required to deposit in a segregated account, either U.S. government securities or a specified amount of Restricted cash,which is shown in the Statement of Assets and Liabilities. Futures contracts are valued daily and unrealized gains or losses are recorded in a“variation margin” account. Daily, the Fund receives from or pays to the broker a specified amount of cash based upon changes in the variationmargin account. When a contract is closed, the Fund recognizes a realized gain or loss. Futures contracts have market risks, including the risk thatthe change in the value of the contract may not correlate with the changes in the value of the underlying securities. There is minimal counterpartyrisk to the Fund since futures contracts are exchange traded and the exchange’s clearing house, as counterparty to all exchange traded futurescontracts, guarantees the futures contracts against default.
Futures contracts outstanding at period end are listed after the Fund’s Portfolio of Investments.The average notional value of short futures contracts held by the Fund throughout the period was $1,043,475. This is based on amounts held as
of each month-end throughout the fiscal period.
Foreign Exchange ContractsThe Fund enters into foreign exchange contracts for the delayed-delivery of securities or foreign currency exchange transactions. The Fund entersinto foreign exchange contracts to protect assets against adverse changes in foreign currency exchange rates or exchange control regulations.Purchased contracts are used to acquire exposure to foreign currencies, whereas, contracts to sell are used to hedge the Fund’s securities againstcurrency fluctuations. Risks may arise upon entering into these transactions from the potential inability of counterparties to meet the terms of theircommitments and from unanticipated movements in security prices or foreign exchange rates. The foreign exchange contracts are adjusted by thedaily exchange rate of the underlying currency and any gains or losses are recorded for financial statement purposes as unrealized until thesettlement date.
At December 31, 2017, the Fund had no outstanding foreign exchange contracts.
Foreign Currency TranslationThe accounting records of the Fund are maintained in U.S. dollars. All assets and liabilities denominated in foreign currencies are translated intoU.S. dollars based on the rates of exchange of such currencies against U.S. dollars on the date of valuation. Purchases and sales of securities,income and expenses are translated at the rate of exchange quoted on the respective date that such transactions are recorded. The Fund does notisolate that portion of the results of operations resulting from changes in foreign exchange rates on investments from the fluctuations arising fromchanges in market prices of securities held. Such fluctuations are included with the net realized and unrealized gain or loss from investments.
Reported net realized foreign exchange gains or losses arise from sales of foreign currencies, currency gains or losses realized between thetrade and settlement dates on securities transactions, the difference between the amounts of dividends, interest and foreign withholding taxesrecorded on the Fund’s books, and the U.S. dollar equivalent of the amounts actually received or paid. Net unrealized foreign exchange gains andlosses arise from changes in the value of assets and liabilities other than investments in securities at fiscal year end, resulting from changes in theexchange rate.
Securities LendingThe Fund participates in a securities lending program providing for the lending of equity securities to qualified brokers. The Fund normally receivescash collateral for securities loaned that is invested in an affiliated money market fund or in short-term securities including repurchaseagreements. Collateral is maintained at a minimum level of 100% of the market value of investments loaned, plus interest, if applicable. Inaccordance with the Fund’s securities lending agreement, the market value of securities on loan is determined each day at the close of businessand any additional collateral required to cover the value of securities on loan is delivered to the Fund on the next business day. Earnings oncollateral are allocated between the borrower of the security, the securities lending agent, as a fee for its services under the program and theFund, according to agreed-upon rates.
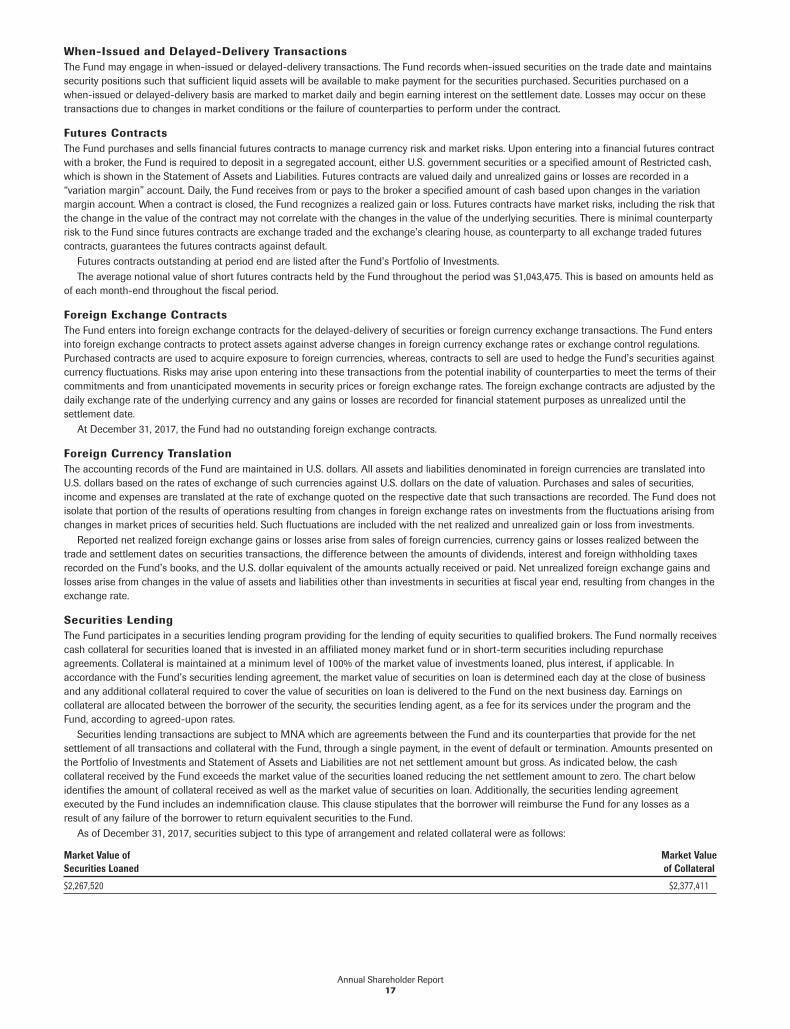
Securities lending transactions are subject to MNA which are agreements between the Fund and its counterparties that provide for the netsettlement of all transactions and collateral with the Fund, through a single payment, in the event of default or termination. Amounts presented onthe Portfolio of Investments and Statement of Assets and Liabilities are not net settlement amount but gross. As indicated below, the cashcollateral received by the Fund exceeds the market value of the securities loaned reducing the net settlement amount to zero. The chart belowidentifies the amount of collateral received as well as the market value of securities on loan. Additionally, the securities lending agreementexecuted by the Fund includes an indemnification clause. This clause stipulates that the borrower will reimburse the Fund for any losses as aresult of any failure of the borrower to return equivalent securities to the Fund.
As of December 31, 2017, securities subject to this type of arrangement and related collateral were as follows:
Market Value ofSecurities Loaned
Market Valueof Collateral
$2,267,520 $2,377,411
Annual Shareholder Report17

Restricted SecuritiesThe Fund may purchase securities which are considered restricted. Restricted securities are securities that either: (a) cannot be offered for publicsale without first being registered, or being able to take advantage of an exemption from registration, under the Securities Act of 1933; or (b) aresubject to contractual restrictions on public sales. In some cases, when a security cannot be offered for public sale without first being registered,the issuer of the restricted security has agreed to register such securities for resale, at the issuer’s expense, either upon demand by the Fund or inconnection with another registered offering of the securities. Many such restricted securities may be resold in the secondary market intransactions exempt from registration. Restricted securities may be determined to be liquid under criteria established by the Trustees. The Fundwill not incur any registration costs upon such resales. The Fund’s restricted securities, like other securities, are priced in accordance withprocedures established by and under the general supervision of the Trustees.
Additional information on restricted securities, excluding securities purchased under Rule 144A that have been deemed liquid by the Trustees,if applicable, held at December 31, 2017, is as follows:
SecurityAcquisition
Date CostMarketValue
SteadyMed Ltd. 7/29/2016 $89,311 $105,576
SteadyMed Ltd. 1/26/2015 $17,008 $ 9,218
Additional Disclosure Related to Derivative Instruments
Fair Value of Derivative Instruments
Liability
Statement ofAssets andLiabilitiesLocation
FairValue
Derivatives not accounted for as hedging instruments under ASC Topic 815
Equity contractsPayable for daily variationmargin on futures contracts $14,872*
* Includes cumulative depreciation of futures contracts as reported in the footnotes to the Portfolio of Investments. Only the current day’s variation margin is reportedwithin the Statement of Assets and Liabilities.
The Effect of Derivative Instruments on the Statement of Operations for the Year Ended December 31, 2017
Amount of Realized Gain or (Loss) on Derivatives Recognized in Income
Futures
Equity contracts $(149,899)
Change in Unrealized Appreciation or (Depreciation) on Derivatives Recognized in Income
Futures
Equity contracts $(21,823)
OtherThe preparation of financial statements in conformity with GAAP requires management to make estimates and assumptions that affect theamounts of assets, liabilities, expenses and revenues reported in the financial statements. Actual results could differ from those estimated. TheFund applies investment company accounting and reporting guidance.
3. SHARES OF BENEFICIAL INTEREST
The following tables summarize share activity:
Year Ended December 31 2017 2016
Primary Shares: Shares Amount Shares Amount
Shares sold 195,640 $ 3,425,347 172,747 $ 2,727,161
Shares issued to shareholders in payment of distributions declared 289,029 4,734,294 209,164 3,022,416
Shares redeemed (502,213) (8,803,914) (526,403) (8,309,116)
NET CHANGE RESULTING FROM PRIMARY SHARE TRANSACTIONS (17,544) $ (644,273) (144,492) $(2,559,539)
Annual Shareholder Report18

Year Ended December 31 2017 2016
Service Shares: Shares Amount Shares Amount
Shares sold 890,081 $ 14,947,120 894,648 $ 13,649,776
Shares issued to shareholders in payment of distributions declared 593,980 9,289,851 453,229 6,304,411
Shares redeemed (1,142,552) (19,265,145) (1,868,028) (28,466,407)
NET CHANGE RESULTING FROM SERVICE SHARE TRANSACTIONS 341,509 $ 4,971,826 (520,151) $ (8,512,220)
NET CHANGE RESULTING FROM TOTAL FUND SHARE TRANSACTIONS 323,965 $ 4,327,553 (664,643) $(11,071,759)
4. FEDERAL TAX INFORMATION
The timing and character of income and capital gain distributions are determined in accordance with income tax regulations, which may differfrom GAAP. These differences are due to differing treatments for foreign currency reclassifications, net operating loss utilized to offset short-termcapital gains, net operating losses, passive foreign investment company gains and losses and discount accretion/premium amortization ondebt securities.
For the year ended December 31, 2017, permanent differences identified and reclassified among the components of net assets were as follows:
Increase (Decrease)
Paid-InCapital
UndistributedNet InvestmentIncome (Loss)
AccumulatedNet Realized
Gain (Loss)
$(302,141) $1,238,338 $(936,197)
Net investment income (loss), net realized gains (losses), and net assets were not affected by this reclassification.The tax character of distributions as reported on the Statement of Changes in Net Assets for the years ended December 31, 2017 and
2016, was as follows:
2017 2016
Long-term capital gains $14,024,159 $9,326,827
As of December 31, 2017, the components of distributable earnings on a tax-basis were as follows:
Net unrealized appreciation $50,909,350
Undistributed long-term capital gains $11,356,288
The difference between book-basis and tax-basis net unrealized appreciation/depreciation is attributable to differing treatments for deferral oflosses on wash sales, mark to market of futures contracts and passive foreign investment company adjustments.
At December 31, 2017, the cost of investments for federal tax purposes was $95,470,944. The net unrealized appreciation of investments forfederal tax purposes was $50,909,357. This consists of net unrealized appreciation from investments for those securities having an excess of valueover cost of $52,187,458 and net unrealized depreciation from investments for those securities having an excess of cost over value of $1,278,101.The amounts presented are inclusive of derivative contracts.
5. INVESTMENT ADVISER FEE AND OTHER TRANSACTIONS WITH AFFILIATES
Investment Adviser FeeThe advisory agreement between the Fund and the Adviser provides for an annual fee equal to 1.30% of the Fund’s average daily net assets.Subject to the terms described in the Expense Limitation note, the Adviser may voluntarily choose to waive any portion of its fee.
Certain of the Fund’s assets are managed by Federated Global Investment Management Corp. (the “Sub-Adviser”). Under the terms of a sub-advisory agreement between the Adviser and the Sub-Adviser, the Sub-Adviser receives an allocable portion of the Fund’s adviser fee. The fee ispaid by the Adviser out of its resources and is not an incremental Fund expense. For the year ended December 31, 2017, the Sub-Adviser earned afee of $1,418,862.
Administrative FeeFederated Administrative Services (FAS), under the Administrative Services Agreement, provides the Fund with administrative personnel andservices. For purposes of determining the appropriate rate breakpoint, “Investment Complex” is defined as all of the Federated Funds subject to afee under the Administrative Services Agreement. The fee paid to FAS is based on the average daily net assets of the Investment Complex asspecified below:
Administrative FeeAverage Daily Net Assetsof the Investment Complex
0.100% on assets up to $50 billion
0.075% on assets over $50 billion
Subject to the terms described in the Expense Limitation note, FAS may voluntarily choose to waive any portion of its fee. For the year endedDecember 31, 2017, the annualized fee paid to FAS was 0.079% of average daily net assets of the Fund.
Annual Shareholder Report19

Prior to September 1, 2017, the breakpoints of the Administrative Fee paid to FAS, described above, were:
Administrative FeeAverage Daily Net Assetsof the Investment Complex
0.150% on the first $5 billion
0.125% on the next $5 billion
0.100% on the next $10 billion
0.075% on assets in excess of $20 billion
In addition, FAS may charge certain out-of-pocket expenses to the Fund.
Distribution Services FeeThe Fund has adopted a Distribution Plan (the “Plan”) pursuant to Rule 12b-1 under the Act. Under the terms of the Plan, the Fund willcompensate Federated Securities Corp. (FSC), the principal distributor, from the daily net assets of the Fund’s Primary Shares and Service Sharesto finance activities intended to result in the sale of these shares. The Plan provides that the Fund may incur distribution expenses at the followingpercentages of average daily net assets annually, to compensate FSC:
Share Class NamePercentage of Average
Daily Net Assets of Class
Primary Shares 0.25%
Service Shares 0.25%
Subject to the terms described in the Expense Limitation note, FSC may voluntarily choose to waive any portion of its fee. For the year endedDecember 31, 2017, distribution services fees for the Fund were as follows:
Distribution ServicesFees Incurred
Service Shares $219,414
When FSC receives fees, it may pay some or all of them to financial intermediaries whose customers purchase shares. For the year endedDecember 31, 2017, FSC did not retain any fees paid by the Fund. For the year ended December 31, 2017, the Fund’s Primary Shares did not incura distribution services fee; however, it may begin to incur this fee upon approval of the Trustees.
Expense LimitationThe Adviser and certain of its affiliates (which may include FSC and FAS) on their own initiative have agreed to waive certain amounts of theirrespective fees and/or reimburse expenses. Total annual fund operating expenses (as shown in the financial highlights, excluding interestexpense, extraordinary expenses, line of credit expenses and proxy-related expenses paid by the Fund, if any) paid by the Fund’s Primary Sharesand Service Shares (after the voluntary waivers and/or reimbursements) will not exceed 1.53% and 1.78% (the “Fee Limit”), respectively, up to butnot including the later of (the “Termination Date”): (a) May 1, 2018; or (b) the date of the Fund’s next effective Prospectus. While the Adviser andits applicable affiliates currently do not anticipate terminating or increasing these arrangements prior to the Termination Date, these arrangementsmay only be terminated or the Fee Limit increased prior to the Termination Date with the agreement of the Trustees.
Interfund TransactionsDuring the year ended December 31, 2017, the Fund engaged in purchase and sale transactions with funds that have a common investmentadviser (or affiliated investment advisers), common Directors/Trustees and/or common Officers. These purchase and sale transactions compliedwith Rule 17a-7 under the Act and amounted to $245,028 and $113,595, respectively.
Directors’/Trustees’ and Miscellaneous FeesCertain Officers and Trustees of the Fund are Officers and Directors or Trustees of certain of the above companies. To efficiently facilitate payment,Directors’/Trustees’ fees and certain expenses related to conducting meetings of the Directors/Trustees and other miscellaneous expenses arepaid by an affiliate of the Adviser which in due course are reimbursed by the Fund. These expenses related to conducting meetings of theDirectors/Trustees and other miscellaneous expenses may be included in Accrued and Miscellaneous Expenses on the Statement of Assets andLiabilities and Statement of Operations, respectively.
6. INVESTMENT TRANSACTIONS
Purchases and sales of investments, excluding long-term U.S. government securities and short-term obligations, for the year endedDecember 31, 2017, were as follows:
Purchases $50,367,602
Sales $59,805,236
Annual Shareholder Report20

7. CONCENTRATION OF RISK
The Fund invests in securities of non-U.S. issuers. Political or economic developments may have an effect on the liquidity and volatility of portfoliosecurities and currency holdings. At December 31, 2017, the diversification of countries was as follows:
CountryPercentage of
Net Assets
United States 82.5%
China 3.0%
Netherland 2.7%
Italy 2.3%
Belgium 2.2%
Denmark 1.2%
Singapore 1.1%
Other1 6.6%
1 Countries representing less than 1.0% have been aggregated under the designation “Other.”
8. LINE OF CREDIT
The Fund participates with certain other Federated Funds, on a several basis, in an up to $500,000,000 unsecured, 364-day, committed, revolvingline of credit (LOC) agreement. The LOC was made available to finance temporarily the repurchase or redemption of shares of the Fund, failedtrades, payment of dividends, settlement of trades and for other short-term, temporary or emergency general business purposes. The Fund cannotborrow under the LOC if an inter-fund loan is outstanding. The Fund’s ability to borrow under the LOC also is subject to the limitations of the Actand various conditions precedent that must be satisfied before the Fund can borrow. Loans under the LOC are charged interest at a fluctuatingrate per annum equal to the highest, on any day, of (a) (i) the federal funds effective rate, (ii) the one month London Interbank Offered Rate(LIBOR), and (iii) 0.0%, plus (b) a margin. The LOC also requires the Fund to pay, quarterly in arrears and at maturity, its pro rata share of acommitment fee based on the amount of the lenders’ commitment that has not been utilized. As of December 31, 2017, the Fund had nooutstanding loans. During the year ended December 31, 2017, the Fund did not utilize the LOC.
9. INTERFUND LENDING
Pursuant to an Exemptive Order issued by the Securities and Exchange Commission (SEC), the Fund, along with other funds advised bysubsidiaries of Federated Investors, Inc., may participate in an interfund lending program. This program provides an alternative credit facilityallowing the Fund to borrow from other participating affiliated funds. As of December 31, 2017, there were no outstanding loans. During the yearended December 31, 2017, the program was not utilized.
10. FEDERAL TAX INFORMATION (UNAUDITED)
For the year ended December 31, 2017, the amount of long-term capital gains designated by the Fund was $14,024,159.
Annual Shareholder Report21

Report of Independent Registered Public Accounting FirmTO THE BOARD OF TRUSTEES OF THE FEDERATED INSURANCE SERIES AND SHAREHOLDERS OFFEDERATED KAUFMANN FUND II:
Opinion on the Financial Statements
We have audited the accompanying statement of assets and liabilities, including the portfolio of investments, of the FederatedKaufmann Fund II (the “Fund”), a portfolio of Federated Insurance Series, as of December 31, 2017, the related statementof operations for the year then ended, the statements of changes in net assets for each of the years in the two-year periodthen ended and the related notes (collectively, the “financial statements”) and the financial highlights for each of the years inthe five-year period then ended. In our opinion, the financial statements and financial highlights present fairly, in all materialrespects the financial position of the Fund as of December 31, 2017, the results of its operations for the year then ended, thechanges in its net assets for each of the years in the two-year period then ended, and the financial highlights for each of theyears in the five-year period then ended, in conformity with U.S. generally accepted accounting principles.
Basis for Opinion
These financial statements and financial highlights are the responsibility of the Fund’s management. Our responsibility is toexpress an opinion on these financial statements and financial highlights based on our audits. We are a public accountingfirm registered with the Public Company Accounting Oversight Board (United States) (PCAOB) and are required to beindependent with respect to the Fund in accordance with the U.S. federal securities laws and the applicable rules andregulations of the Securities and Exchange Commission and the PCAOB.
We conducted our audits in accordance with the standards of the PCAOB. Those standards require that we plan andperform the audit to obtain reasonable assurance about whether the financial statements and financial highlights are free ofmaterial misstatement, whether due to error or fraud. Our audits included performing procedures to assess the risks ofmaterial misstatement of the financial statements and financial highlights, whether due to error or fraud, and performingprocedures that respond to those risks. Such procedures included examining, on a test basis, evidence supporting theamounts and disclosures in the financial statements and financial highlights. Such procedures also included confirmation ofsecurities owned as of December 31, 2017, by correspondence with the custodian and brokers, or by other appropriateauditing procedures. Our audits also included evaluating the accounting principles used and significant estimates made bymanagement, as well as evaluating the overall presentation of the financial statements and financial highlights. We believe thatour audits provide a reasonable basis for our opinion.
We have served as the auditor for one or more of Federated Investors’ - investment companies since 2006.
Boston, MassachusettsFebruary 14, 2018
Annual Shareholder Report22

Shareholder Expense Example (unaudited)As a shareholder of the Fund, you incur ongoing costs, including management fees and to the extent applicable, distribution(12b-1) fees and/or other service fees and other Fund expenses. This Example is intended to help you to understand yourongoing costs (in dollars) of investing in the Fund and to compare these costs with the ongoing costs of investing in otherfunds used as variable investment options. It is based on an investment of $1,000 invested at the beginning of the period andheld for the entire period from July 1, 2017 to December 31, 2017.
ACTUAL EXPENSES
The first section of the table below provides information about actual account values and actual expenses. You may use theinformation in this section, together with the amount you invested, to estimate the expenses that you incurred over theperiod. Simply divide your account value by $1,000 (for example, an $8,600 account value divided by $1,000 = 8.6), thenmultiply the result by the number in the first section under the heading entitled “Expenses Paid During Period” to estimatethe expenses attributable to your investment during this period.
HYPOTHETICAL EXAMPLE FOR COMPARISON PURPOSES
The second section of the table below provides information about hypothetical account values and hypothetical expensesbased on the Fund’s actual expense ratio and an assumed rate of return of 5% per year before expenses, which is not theFund’s actual return. Thus, you should not use the hypothetical account values and expenses to estimate the actual endingaccount balance or your expenses for the period. Rather, these figures are required to be provided to enable you to comparethe ongoing costs of investing in the Fund with other funds. To do so, compare this 5% hypothetical example with the 5%hypothetical examples that appear in the shareholder reports of the other funds.
Please note that the expenses shown in the table are meant to highlight your ongoing costs only. Therefore, the secondsection of the table is useful in comparing ongoing costs only, and will not help you determine the relative total costs ofowning different funds.
BeginningAccount Value
7/1/2017
EndingAccount Value
12/31/2017Expenses PaidDuring Period1
Actual:
Primary Shares $1,000 $1,117.90 $8.22
Service Shares $1,000 $1,116.10 $9.55
Hypothetical (assuming a 5% return before expenses):
Primary Shares $1,000 $1,017.40 $7.83
Service Shares $1,000 $1,016.20 $9.10
1 Expenses are equal to the Fund’s annualized net expense ratios, multiplied by the average account value over the period, multiplied by 184/365 (to reflect the one-half-year period). The annualized net expense ratios are as follows:
Primary Shares 1.54%
Service Shares 1.79%
Annual Shareholder Report23

In MemoriamWith profound sadness, Federated announces the passing of John F. (“Jack”) Donahue and John W. (“John”) McGonigle.They will be greatly missed.
JACK DONAHUE
(Former Chairman and President, and Emeritus Director/Trustee, of the Federated Funds, and Founder, Former Chairman, President andChief Executive Officer, and Chairman Emeritus, of Federated Investors, Inc.)
Jack Donahue, along with Richard B. Fisher, founded Federated in 1955 and served as a leader and member of the Boards ofDirectors/Trustees of the Federated Funds and the Board of Directors of Federated Investors, Inc. Mr. Donahue was a familyman of deep faith with exemplary character and fealty, who served his religion, family, community, and the Federated Fundsand Federated, as well as their shareholders, officers and employees, with distinction. His integrity, intelligence, and keensense of fiduciary duty, coupled with his faith, family and background as a West Point graduate and Strategic Air CommandB-29 pilot, served as a foundation for his strong business acumen and leadership. Among his many achievements,Mr. Donahue’s steadfast and innovative leadership of the Federated Funds and Federated, as well as within the investmentmanagement industry, led to the birth of money market funds in the 1970s and their growth as an innovative, efficient andeffective cash management vehicle throughout the 1980s, 1990s, 2000s and beyond. Federated expresses deep gratitude toMr. Donahue for his inspiring leadership, distinguished service and contributions as a husband, father, founder, Boardmember and officer, colleague and friend.
JOHN MCGONIGLE
(Former Secretary of the Federated Funds, Former Director, Secretary and Chief Legal Officer of Federated Investors, Inc.)
John McGonigle served the Federated Funds and their respective Boards with distinction for more than 50 years as FundSecretary and also served as Director for several closed-end funds. Mr. McGonigle was a gifted lawyer and wise counselorwith a genial presence, keen intellect and convivial demeanor. A man of deep faith, he was a devoted husband, father andgrandfather. A graduate of Duquesne University School of Law, Mr. McGonigle served as an officer in the U.S. Army fortwo years, achieving the rank of Captain. He also served on the staff of the Securities and Exchange Commission beforejoining Federated in 1966. Among many professional accomplishments, Mr. McGonigle helped fashion the regulatoryfoundation for money market funds, established Federated’s first offshore funds in Ireland, and represented Federated on theBoard of Governors of the Investment Company Institute where he was a member of the Executive Committee. Federatedexpresses deep gratitude for Mr. McGonigle and his impact on his family, friends, the community, and the mutualfund industry.
Board of Trustees and Trust OfficersThe Board of Trustees is responsible for managing the Trust’s business affairs and for exercising all the Trust’s powers exceptthose reserved for the shareholders. The following tables give information about each Trustee and the senior officers of theFund. Where required, the tables separately list Trustees who are “interested persons” of the Fund (i.e., “Interested”Trustees) and those who are not (i.e., “Independent” Trustees). Unless otherwise noted, the address of each person listed isFederated Investors Tower, 1001 Liberty Avenue, Pittsburgh, PA 15222. The address of all Independent Trustees listed is4000 Ericsson Drive, Warrendale, PA 15086-7561; Attention: Mutual Fund Board. As of December 31, 2017, the Trustcomprised seven portfolio(s), and the Federated Fund Family consisted of 40 investment companies (comprising108 portfolios). Unless otherwise noted, each Officer is elected annually. Unless otherwise noted, each Trustee oversees allportfolios in the Federated Fund Family and serves for an indefinite term. The Fund’s Statement of AdditionalInformation includes additional information about Trust Trustees and is available, without charge and upon request, bycalling 1-800-341-7400.
Annual Shareholder Report24

INTERESTED TRUSTEES BACKGROUND
NameBirth DatePositions Held with TrustDate Service Began
Principal Occupation(s) for Past Five Years,Other Directorships Held and Previous Position(s)
J. Christopher Donahue*Birth Date: April 11, 1949TRUSTEEIndefinite TermBegan serving: September 1993
Principal Occupations: Principal Executive Officer and President of certain of the Funds in the Federated Fund Family; Director orTrustee of the Funds in the Federated Fund Family; President, Chief Executive Officer and Director, Federated Investors, Inc.; Chairmanand Trustee, Federated Investment Management Company; Trustee, Federated Investment Counseling; Chairman and Director,Federated Global Investment Management Corp.; Chairman and Trustee, Federated Equity Management Company of Pennsylvania;Trustee, Federated Shareholder Services Company; Director, Federated Services Company.
Previous Positions: President, Federated Investment Counseling; President and Chief Executive Officer, Federated InvestmentManagement Company, Federated Global Investment Management Corp. and Passport Research, Ltd; Chairman, PassportResearch, Ltd.
Thomas R. Donahue*Birth Date: October 20, 1958TRUSTEEIndefinite TermBegan serving: May 2016
Principal Occupations: Director or Trustee of certain of the funds in the Federated Fund Family; Chief Financial Officer, Treasurer,Vice President and Assistant Secretary, Federated Investors, Inc.; Chairman and Trustee, Federated Administrative Services; Chairmanand Director, Federated Administrative Services, Inc.; Trustee and Treasurer, Federated Advisory Services Company; Director orTrustee and Treasurer, Federated Equity Management Company of Pennsylvania, Federated Global Investment Management Corp.,Federated Investment Counseling, and Federated Investment Management Company; Director, MDTA LLC; Director, Executive VicePresident and Assistant Secretary, Federated Securities Corp.; Director or Trustee and Chairman, Federated Services Company andFederated Shareholder Services Company; and Director and President, FII Holdings, Inc.
Previous Positions: Director, Federated Investors, Inc.; Assistant Secretary, Federated Investment Management Company, FederatedGlobal Investment Management Company and Passport Research, LTD; Treasurer, Passport Research, LTD; Executive Vice President,Federated Securities Corp.; and Treasurer, FII Holdings, Inc.
* Family relationships and reasons for “interested” status: J. Christopher Donahue and Thomas R. Donahue are brothers. Both are “interested” due to their beneficialownership of shares of Federated Investors, Inc. and the positions they hold with Federated and its subsidiaries.
INDEPENDENT TRUSTEES BACKGROUND
NameBirth DatePositions Held with TrustDate Service Began
Principal Occupation(s) for Past Five Years,Other Directorships Held, Previous Position(s) and Qualifications
John T. CollinsBirth Date: January 24, 1947TRUSTEEIndefinite TermBegan serving: October 2013
Principal Occupations: Director or Trustee of the Federated Fund Family; formerly, Chairman and CEO, The Collins Group, Inc.(a private equity firm) (Retired).
Other Directorships Held: Director, Current Chair of the Compensation Committee, KLX Corp.
Qualifications: Mr. Collins has served in several business and financial management roles and directorship positions throughout hiscareer. Mr. Collins previously served as Chairman and CEO, The Collins Group, Inc. (a private equity firm). Mr. Collins serves asChairman Emeriti, Bentley University. Mr. Collins previously served as Director and Audit Committee Member, Bank of America Corp.;Director, FleetBoston Financial Corp.; and Director, Beth Israel Deaconess Medical Center (Harvard University Affiliate Hospital).
G. Thomas HoughBirth Date: February 28, 1955TRUSTEEIndefinite TermBegan serving: August 2015
Principal Occupations: Director or Trustee of the Federated Fund Family; formerly, Vice Chair, Ernst & Young LLP (public accountingfirm) (Retired).
Other Directorships Held: Director, Chair of the Audit Committee, Governance Committee, Publix Super Markets, Inc.; Director,Member of the Audit Committee and Technology Committee of Equifax, Inc.
Qualifications: Mr. Hough has served in accounting, business management and directorship positions throughout his career.Mr. Hough most recently held the position of Americas Vice Chair of Assurance with Ernst & Young LLP (public accounting firm).Mr. Hough is an Executive Committee member of the United States Golf Association, he serves on the President’s Cabinet andBusiness School Board of Visitors for the University of Alabama and is on the Business School Board of Visitors for WakeForest University.
Annual Shareholder Report25

NameBirth DatePositions Held with TrustDate Service Began
Principal Occupation(s) for Past Five Years,Other Directorships Held, Previous Position(s) and Qualifications
Maureen Lally-GreenBirth Date: July 5, 1949TRUSTEEIndefinite TermBegan serving: August 2009
Principal Occupations: Director or Trustee of the Federated Fund Family; Dean of the Duquesne University School of Law; Professorand Adjunct Professor of Law, Duquesne University School of Law; formerly, Interim Dean of the Duquesne University School of Law;Associate General Secretary and Director, Office of Church Relations, Diocese of Pittsburgh.
Other Directorships Held: Director, CNX Resources Corporation (formerly known as CONSOL Energy Inc.).
Qualifications: Judge Lally-Green has served in various legal and business roles and directorship positions throughout her career.Judge Lally-Green previously served as: Associate General Secretary, Diocese of Pittsburgh; a member of the Superior Court ofPennsylvania; and as a Professor of Law, Duquesne University School of Law. Judge Lally-Green also currently holds the positions oneither a public or not for profit Board of Directors as follows: Director and Chair, UPMC Mercy Hospital; Director and Vice Chair, OurCampaign for the Church Alive!, Inc.; Director, Saint Vincent College; Member, Pennsylvania State Board of Education (public); andDirector CNX Resources Corporation (formerly known as CONSOL Energy Inc.), where she currently serves as a member of theCompensation, Nominating and Corporate Governance Committee (Chair) and the Health, Safety and Environmental Committee.Judge Lally-Green has held the positions of: Director, Auberle; Director, Epilepsy Foundation of Western and Central Pennsylvania;Director, Ireland Institute of Pittsburgh; Director, Saint Thomas More Society; Director and Chair, Catholic High Schools of theDiocese of Pittsburgh, Inc.; Director, Pennsylvania Bar Institute; Regent, St. Vincent Seminary; and Director and Chair, Cardinal WuerlNorth Catholic High School, Inc.
Charles F. Mansfield, Jr.Birth Date: April 10, 1945TRUSTEEIndefinite TermBegan serving: September 1999
Principal Occupations: Director or Trustee of the Federated Fund Family; Management Consultant.
Other Directorships Held: None.
Qualifications: Mr. Mansfield has served as a Marine Corps officer and in several banking, business management, educational rolesand directorship positions throughout his long career. He remains active as a Management Consultant.
Thomas M. O’NeillBirth Date: June 14, 1951TRUSTEEIndefinite TermBegan serving: August 2006
Principal Occupations: Director or Trustee, Chair of the Audit Committee of the Federated Fund Family; Sole Proprietor, NavigatorManagement Company (investment and strategic consulting).
Other Directorships Held: None.
Qualifications: Mr. O’Neill has served in several business, mutual fund and financial management roles and directorship positionsthroughout his career. Mr. O’Neill serves as Director, Medicines for Humanity and Director, The Golisano Children’s Museum ofNaples, Florida. Mr. O’Neill previously served as Chief Executive Officer and President, Managing Director and Chief InvestmentOfficer, Fleet Investment Advisors; President and Chief Executive Officer, Aeltus Investment Management, Inc.; General Partner,Hellman, Jordan Management Co., Boston, MA; Chief Investment Officer, The Putnam Companies, Boston, MA; Credit Analyst andLending Officer, Fleet Bank; Director and Consultant, EZE Castle Software (investment order management software); and Director,Midway Pacific (lumber).
P. Jerome RicheyBirth Date: February 23, 1949TRUSTEEIndefinite TermBegan serving: October 2013
Principal Occupations: Director or Trustee of the Federated Fund Family; Management Consultant; formerly, Senior Vice Chancellorand Chief Legal Officer, University of Pittsburgh and Executive Vice President and Chief Legal Officer, CNX Resources Corporation(formerly known as CONSOL Energy Inc.)
Other Directorships Held: None.
Qualifications: Mr. Richey has served in several business and legal management roles and directorship positions throughout hiscareer. Mr. Richey most recently held the positions of Senior Vice Chancellor and Chief Legal Officer, University of Pittsburgh.Mr. Richey previously served as Chairman of the Board, Epilepsy Foundation of Western Pennsylvania and Chairman of the Board,World Affairs Council of Pittsburgh. Mr. Richey previously served as Chief Legal Officer and Executive Vice President, CNX ResourcesCorporation (formerly known as CONSOL Energy Inc.); and Board Member, Ethics Counsel and Shareholder, Buchanan Ingersoll &Rooney PC (a law firm).
John S. WalshBirth Date: November 28, 1957TRUSTEEIndefinite TermBegan serving: January 1999
Principal Occupations: Director or Trustee, and Chair of the Board of Directors or Trustees, of the Federated Fund Family; Presidentand Director, Heat Wagon, Inc. (manufacturer of construction temporary heaters); President and Director, Manufacturers Products,Inc. (distributor of portable construction heaters); President, Portable Heater Parts, a division of Manufacturers Products, Inc.
Other Directorships Held: None.
Qualifications: Mr. Walsh has served in several business management roles and directorship positions throughout his career.Mr. Walsh previously served as Vice President, Walsh & Kelly, Inc. (paving contractors).
Annual Shareholder Report26

OFFICERS
NameBirth DateAddressPositions Held with TrustDate Service Began
Principal Occupation(s) for Past Five Yearsand Previous Position(s)
Lori A. HenslerBirth Date: January 6, 1967TREASUREROfficer since: April 2013
Principal Occupations: Principal Financial Officer and Treasurer of the Federated Fund Family; Senior Vice President, FederatedAdministrative Services; Financial and Operations Principal for Federated Securities Corp. and Edgewood Services, Inc.; and AssistantTreasurer, Federated Investors Trust Company. Ms. Hensler has received the Certified Public Accountant designation.
Previous Positions: Controller of Federated Investors, Inc.; Senior Vice President and Assistant Treasurer, Federated InvestorsManagement Company; Treasurer, Federated Investors Trust Company; Assistant Treasurer, Federated Administrative Services,Federated Administrative Services, Inc., Federated Securities Corp., Edgewood Services, Inc., Federated Advisory Services Company,Federated Equity Management Company of Pennsylvania, Federated Global Investment Management Corp., Federated InvestmentCounseling, Federated Investment Management Company, Passport Research, Ltd., and Federated MDTA, LLC; Financial andOperations Principal for Federated Securities Corp., Edgewood Services, Inc. and Southpointe Distribution Services, Inc.
Peter J. GermainBirth Date: September 3, 1959CHIEF LEGAL OFFICER,SECRETARY AND EXECUTIVEVICE PRESIDENTOfficer since: January 2005
Principal Occupations: Mr. Germain is Chief Legal Officer, Secretary and Executive Vice President of the Federated Fund Family. Heis General Counsel, Chief Legal Officer, Secretary and Executive Vice President, Federated Investors, Inc.; Trustee and Senior VicePresident, Federated Investors Management Company; Trustee and President, Federated Administrative Services; Director andPresident, Federated Administrative Services, Inc.; Director and Vice President, Federated Securities Corp.; Director and Secretary,Federated Private Asset Management, Inc.; Secretary, Federated Shareholder Services Company; and Secretary, Retirement PlanService Company of America. Mr. Germain joined Federated in 1984 and is a member of the Pennsylvania Bar Association.
Previous Positions: Deputy General Counsel, Special Counsel, Managing Director of Mutual Fund Services, Federated Investors, Inc.;Senior Vice President, Federated Services Company; and Senior Corporate Counsel, Federated Investors, Inc.
Richard B. FisherBirth Date: May 17, 1923VICE PRESIDENTOfficer since: September 1993
Principal Occupations: Vice Chairman or Vice President of some of the Funds in the Federated Fund Family; Vice Chairman,Federated Investors, Inc.; Chairman, Federated Securities Corp.
Previous Positions: President and Director or Trustee of some of the Funds in the Federated Fund Family; Executive Vice President,Federated Investors, Inc.; Director and Chief Executive Officer, Federated Securities Corp.
John B. FisherBirth Date: May 16, 1956PRESIDENTOfficer since: November 2004
Principal Occupations: Principal Executive Officer and President of certain of the Funds in the Federated Fund Family; Director orTrustee of certain of the Funds in the Federated Fund Family; Vice President, Federated Investors, Inc.; President, Director/Trustee andCEO, Federated Advisory Services Company, Federated Equity Management Company of Pennsylvania, Federated Global InvestmentManagement Corp., Federated Investment Counseling, Federated Investment Management Company; President and CEO of PassportResearch, Ltd.; President of some of the Funds in the Federated Fund Complex and Director, Federated Investors Trust Company.
Previous Positions: President and Director of the Institutional Sales Division of Federated Securities Corp.; President and Director ofFederated Investment Counseling; Director, Edgewood Securities Corp.; Director, Federated Services Company; Director, FederatedInvestors, Inc.; Chairman and Director, Southpointe Distribution Services, Inc. and President, Technology, FederatedServices Company.
Stephen Van MeterBirth Date: June 5, 1975CHIEF COMPLIANCE OFFICERAND SENIOR VICE PRESIDENTOfficer since: July 2015
Principal Occupations: Senior Vice President and Chief Compliance Officer of the Federated Fund Family; Vice President and ChiefCompliance Officer of Federated Investors, Inc. and Chief Compliance Officer of certain of its subsidiaries. Mr. Van Meter joinedFederated in October 2011. He holds FINRA licenses under Series 3, 7, 24 and 66.
Previous Positions: Mr. Van Meter previously held the position of Compliance Operating Officer, Federated Investors, Inc. Prior tojoining Federated, Mr. Van Meter served at the United States Securities and Exchange Commission in the positions of Senior Counsel,Office of Chief Counsel, Division of Investment Management and Senior Counsel, Division of Enforcement.
Stephen F. AuthBirth Date: September 13, 1956101 Park Avenue41st FloorNew York, NY 10178CHIEF INVESTMENT OFFICEROfficer since: November 2002
Principal Occupations: Stephen F. Auth is Chief Investment Officer of various Funds in the Federated Fund Family; Executive VicePresident, Federated Investment Counseling, Federated Global Investment Management Corp. and Federated Equity ManagementCompany of Pennsylvania.
Previous Positions: Executive Vice President, Federated Investment Management Company and Passport Research, Ltd. (investmentadvisory subsidiary of Federated); Senior Vice President, Global Portfolio Management Services Division; Senior Vice President,Federated Investment Management Company and Passport Research, Ltd.; Senior Managing Director and Portfolio Manager,Prudential Investments.
Robert J. OstrowskiBirth Date: April 26, 1963CHIEF INVESTMENT OFFICEROfficer since: May 2004
Principal Occupations: Robert J. Ostrowski joined Federated in 1987 as an Investment Analyst and became a Portfolio Manager in1990. He was named Chief Investment Officer of Federated’s taxable fixed-income products in 2004 and also serves as a SeniorPortfolio Manager. Mr. Ostrowski became an Executive Vice President of the Fund’s Adviser in 2009 and served as a Senior VicePresident of the Fund’s Adviser from 1997 to 2009. Mr. Ostrowski has received the Chartered Financial Analyst designation. Hereceived his M.S. in Industrial Administration from Carnegie Mellon University.
Deborah A. CunninghamBirth Date: September 15, 1959CHIEF INVESTMENT OFFICEROfficer since: June 2012
Principal Occupations: Deborah A. Cunningham was named Chief Investment Officer of Federated’s money market products in2004. She joined Federated in 1981 and has been a Senior Portfolio Manager since 1997 and an Executive Vice President of theFund’s Adviser since 2009. Ms. Cunningham has received the Chartered Financial Analyst designation and holds an M.S.B.A. inFinance from Robert Morris College.
Annual Shareholder Report27

Evaluation and Approval of Advisory Contract – May 2017FEDERATED KAUFMANN FUND II (THE “FUND”)
Following a review and recommendation of approval by the Fund’s independent trustees, the Fund’s Board of Trustees(the “Board”) reviewed and unanimously approved the continuation of the Fund’s investment advisory and subadvisorycontracts for an additional one-year term at its May 2017 meetings. The Board’s decision regarding these contracts reflectsthe exercise of its business judgment after considering all of the information received on whether to continue theexisting arrangements.
The Board had previously appointed a Senior Officer, whose duties include specified responsibilities relating to theprocess by which advisory fees are to be charged to a Federated fund. The Senior Officer has the authority to retainconsultants, experts, or staff as may be reasonably necessary to assist in the performance of his duties, reports directly to theBoard, and may be terminated only with the approval of a majority of the independent members of the Board. The SeniorOfficer prepared and furnished to the Board an independent, written evaluation that covered topics discussed below (the“Senior Officer’s Evaluation”). The Board considered the Senior Officer’s Evaluation, along with other information, indeciding to approve the investment advisory and subadvisory contracts.
The Board also considered judicial decisions concerning allegedly excessive investment advisory fees in its decision. Usingthese judicial decisions as a guide, the Board has indicated that the following factors may be relevant to an adviser’s fiduciaryduty with respect to its receipt of compensation from a fund: (1) the nature and quality of the services provided by anadviser to a fund and its shareholders (including the performance of the Fund and of comparable funds); (2) an adviser’s costof providing the services (including the profitability to an adviser of providing advisory services to a fund); (3) the extent towhich an adviser may realize “economies of scale” as a fund grows larger and, if such economies of scale exist, whether theyhave been shared with a fund and its shareholders or the family of funds; (4) any “fall-out financial benefits” that accrue toan adviser because of its relationship with a fund (including research services received from brokers that execute fund tradesand any fees paid to affiliates of an adviser for services rendered to a fund); (5) comparative fee and expense structures(including a comparison of fees paid to an adviser with those paid by similar funds); and (6) the extent of care,conscientiousness and independence with which the Fund’s board members perform their duties and their expertise(including whether they are fully informed about all facts the Board deems relevant to its consideration of an adviser’sservices and fees). The Board noted that the Securities and Exchange Commission (“SEC”) disclosure requirementsregarding the basis for the Board’s approval of the Fund’s investment advisory and subadvisory contracts generally align withthe factors listed above. Consistent with the judicial decisions and SEC disclosure requirements, the Board also consideredmanagement fees charged to institutional and other clients of Federated Equity Management Company of Pennsylvania (the“Adviser”) and any subadviser and their advisory affiliates, for what might be viewed as like services. The Board was awareof these factors and was guided by them in its review of the Fund’s investment advisory and subadvisory contracts to theextent it considered them to be appropriate and relevant, as discussed further below.
The Board considered and weighed these factors in light of its substantial accumulated experience in governing the Fundand working with Federated Investors, Inc. and its affiliates (“Federated”) on matters relating to the Federated funds. TheBoard was assisted in its deliberations by independent legal counsel. In addition to the extensive materials that comprise andaccompany the Senior Officer’s Evaluation, the Board received detailed information about the Fund and the Federatedorganization throughout the year, and in connection with its May meetings. Federated provided much of this information ateach regular meeting of the Board, and furnished additional information in connection with the May meetings at which theBoard’s formal approval of the investment advisory and subadvisory contracts occurred. At the May meetings, in addition tomeeting in separate sessions of the independent trustees without management present, senior management of the Adviseralso met with the independent trustees and their counsel to discuss the materials presented and any other matters thoughtrelevant by the Adviser or the trustees. Between regularly scheduled meetings, the Board also received information onparticular matters as the need arose. The Board’s consideration of the investment advisory and subadvisory contractsincluded review of the Senior Officer’s Evaluation, accompanying data and additional information covering such matters as:the Adviser’s and subadviser’s investment philosophy, revenue, profitability, personnel and processes; investment and operatingstrategies; the Fund’s short-term and long-term performance (in absolute terms, both on a gross basis and net of expenses, aswell as in terms relative to its particular investment program and certain competitor or “peer group” funds and/or otherbenchmarks, as appropriate) and comments on the reasons for performance; the Fund’s investment objectives; the Fund’sexpenses, including the advisory fee and the overall expense structure of the Fund (both in absolute terms and relative tosimilar and/or competing funds), with due regard for contractual or voluntary expense limitations; the use and allocation ofbrokerage commissions derived from trading the Fund’s portfolio securities (if any); and the nature, quality and extent of theadvisory and other services provided to the Fund by the Adviser and its affiliates. The Board also considered the preferencesand expectations of Fund shareholders; the entrepreneurial risk assumed by the Adviser in sponsoring the Fund; thecontinuing state of competition in the mutual fund industry and market practices; the range of comparable fees for similarfunds in the mutual fund industry; the Fund’s relationship to the Federated funds which include a comprehensive array of
Annual Shareholder Report28
funds with different investment objectives, policies and strategies which are generally available for exchange without theincurrence of additional sales charges; compliance and audit reports concerning the Federated funds and the Federatedcompanies that service them (including communications from regulatory agencies), as well as Federated’s responses to anyissues raised therein; and relevant developments in the mutual fund industry and how the Federated funds and/or Federatedare responding to them. The Board also considered that the longevity and experience of the Fund’s portfolio managementteam and their unique approach to investing may limit the utility of comparisons to other equity mutual funds. The Board’sevaluation process is evolutionary. The criteria considered and the emphasis placed on relevant criteria change in recognitionof changing circumstances in the mutual fund marketplace.
While mindful that courts have cautioned against giving such comparisons too much weight, the Board has found the useof comparisons of the Fund’s fees and expenses to other mutual funds with comparable investment programs to be relevantto its deliberations. In this regard, the Board was presented with, and considered, information regarding the contractualadvisory fee rates, total expense ratios and each element of the Fund’s total expense ratio (i.e., gross and net advisory fees,custody fees, portfolio accounting fees and transfer agency fees) relative to the Fund’s peers. The Board focused oncomparisons with other similar mutual funds more heavily than non-mutual fund products or services because it is believedthat they are more relevant. For example, other mutual funds are the products most like the Fund, in that they are readilyavailable to Fund shareholders as alternative investment vehicles. Also, they are the type of investment vehicle, in fact, chosenand maintained by the Fund’s investors. The range of their fees and expenses, therefore, appears to be a relevant indicator ofwhat consumers have found to be reasonable in the marketplace in which the Fund competes.
The Board reviewed the contractual advisory fee rate, net advisory fee rate where partially waived and other expenses ofthe Fund and noted the position of the Fund’s contractual advisory fee rate and other expenses relative to its peers. In thisregard, the Board noted that the contractual advisory fee rate was above the median of the relevant peer group, but theBoard noted the applicable waivers and reimbursements, and that the overall expense structure of the Fund remainedcompetitive in the context of other factors considered by the Board.
For comparison, the Senior Officer has reviewed Federated’s fees for providing advisory services to products outside theFederated funds (e.g., institutional and separate accounts and sub-adviser services). He concluded that mutual funds andinstitutional accounts are inherently different products. Those differences include, but are not limited to, different types oftargeted investors; being subject to different laws and regulations; different legal structures; different average account sizes andportfolio management techniques made necessary by different cash flows and different associated costs; and the time spent byportfolio managers and their teams, funds financial services, legal, compliance and risk management in reviewing securitiespricing, addressing different administrative responsibilities, addressing different degrees of risk associated with managementand a variety of different costs. The Senior Officer did not consider the fees for providing advisory services to these outsideproducts to be determinative in judging the appropriateness of mutual fund advisory fees.
Following such evaluation, and full deliberations, the Board concluded that the expenses of the Fund are reasonable andsupported renewal of the Fund’s investment advisory and subadvisory contracts.
The Board considered the nature, extent and quality of the services provided to the Fund by the Adviser and theresources of the Adviser and its affiliates dedicated to the Fund. In this regard, the Board evaluated, among other things, theAdviser’s personnel, experience, track record, overall reputation and willingness to invest in personnel and infrastructure thatbenefit the Fund. In addition, the Board reviewed the qualifications, backgrounds and responsibilities of the portfoliomanagement team primarily responsible for the day-to-day management of the Fund. The Board noted the complianceprograms of and the compliance-related resources provided to the Fund by the Adviser. The Fund’s ability to delivercompetitive performance when compared to its peer group was also deemed to be relevant by the Board as a usefulindicator of how the Adviser is executing the Fund’s investment program. The Adviser’s ability to execute this program wasone of the Board’s considerations in reaching a conclusion that the nature, extent, and quality of the Adviser’s investmentmanagement services warrant the continuation of the investment advisory and subadvisory contracts.
In evaluating the Fund’s investment performance, the Board considered performance results in light of the Fund’sinvestment objective, strategies and risks, as disclosed in the Fund’s prospectus. The Board particularly considered detailedinvestment reports on the Fund’s performance that were provided to the Board throughout the year and in connection withthe May meetings. The Senior Officer also reviewed information compiled by Federated, using data supplied byindependent fund ranking organizations, regarding the performance of, and fees charged by, other mutual funds, noting hisview that comparisons to fund peer groups may be helpful, though not conclusive, in judging the reasonableness of theproposed fees. The Board considered, in evaluating such comparisons, that in some cases individual funds may exhibitsignificant and unique differences in their objectives and management techniques when compared to other funds within anindustry peer group.
For the periods covered by the Senior Officer’s Evaluation, the Fund’s performance for the three-year and five-yearperiod was above the median of the relevant peer group, and the Fund’s performance fell below the median of the relevantpeer group for the one-year period. The Board discussed the Fund’s performance with the Adviser and recognized theefforts being taken by the Adviser in the context of other factors considered relevant by the Board.
Annual Shareholder Report29
Following such evaluation and full deliberations, the Board concluded that the performance of the Fund supportedrenewal of the Fund’s investment advisory and subadvisory contracts.
The Board also received financial information about Federated, including information regarding the compensation andancillary (or “fall-out”) benefits Federated derived from its relationships with the Federated funds. This information coverednot only the fees under the investment advisory contracts, but also fees received by Federated’s subsidiaries for providingother services to the Federated funds under separate contracts (e.g., for serving as the Federated funds’ administrator). Theinformation also detailed any indirect benefit Federated may derive from its receipt of research services from brokers whoexecute Federated fund trades. In addition, the Board considered the fact that, in order for a fund to be competitive in themarketplace, Federated and its affiliates frequently waived fees and/or reimbursed expenses and have disclosed to Fundinvestors and/or indicated to the Board their intention to do so in the future. Moreover, the Board receives regular reportingas to the institution, adjustment or elimination of these voluntary waivers. The Board considered Federated’s previousreductions in contractual management fees to certain funds in response to the Senior Officer’s recommendations.
Federated furnished information, requested by the Senior Officer, that reported revenues on a fund-by-fund basis andmade estimates of the allocation of expenses on a fund-by-fund basis, using allocation methodologies specified by the SeniorOfficer. The Senior Officer noted that, while these cost allocation reports apply consistent allocation processes, the inherentdifficulties in allocating costs continues to cause the Senior Officer to question the precision of the process and to concludethat such reports may be unreliable, since a single change in an allocation estimate may dramatically alter the resultingestimate of cost and/or profitability of a fund and may produce unintended consequences. The allocation information,including the Senior Officer’s view that fund-by-fund estimations may be unreliable, was considered in the analysis bythe Board.
The Board and the Senior Officer also reviewed information compiled by Federated comparing its profitabilityinformation to other publicly held fund management companies. In this regard, the Senior Officer concluded thatFederated’s profit margins did not appear to be excessive. The Senior Officer also noted that Federated appeared financiallysound, with the resources to fulfill its obligations under its contracts with the Fund.
The Senior Officer’s Evaluation also discussed the notion of possible realization of “economies of scale” as a fund growslarger. In this regard, the Board considered that the Adviser has made significant and long-term investments in areas thatsupport all of the Federated funds, such as personnel and processes for the portfolio management, shareholder services,compliance, internal audit and risk management functions, as well as systems technology (including technology relating tocybersecurity,) and that the benefits of these efforts (as well as any economies of scale, should they exist) were likely to beenjoyed by the fund family as a whole. The Board noted that the Adviser’s investments in these areas are extensive. Inaddition, the Board considered that Federated and its affiliates have frequently waived fees and/or reimbursed expenses andthat this has allowed fund shareholders to share potential economies of scale from a fund’s inception. Federated, as it doesthroughout the year, and in connection with the Board’s review, furnished information relative to revenue sharing or adviserpaid fees. Federated and the Senior Officer noted that this information should be viewed to determine if there was anincentive to either not apply breakpoints or to apply breakpoints at higher levels. It should not be viewed to determine theappropriateness of advisory fees, because it would represent marketing and distribution expenses. Finally, the Board alsonoted the absence of any applicable regulatory or industry guidelines on this subject, which (as discussed in the SeniorOfficer’s Evaluation) is compounded by the lack of any common industry practice or general pattern with respect tostructuring fund advisory fees with “breakpoints” that serve to reduce the fee as a fund attains a certain size.
While the Senior Officer noted certain items for follow-up reporting to the Board and further consideration bymanagement, he stated that his observations and information accompanying the Senior Officer’s Evaluation supported afinding by the Board that the management fee the Fund was reasonable. Under these circumstances, no changes wererecommended to, and no objection was raised to, the continuation of the Fund’s investment advisory andsubadvisory contracts.
In its decision to continue an existing investment advisory contract, the Board was mindful of the potential disruptions ofthe Fund’s operations and various risks, uncertainties and other effects that could occur as a result of a decision to terminateor not renew an investment advisory contract. In particular, the Board recognized that many shareholders have invested inthe Fund on the strength of the Adviser’s industry standing and reputation and with the expectation that the Adviser willhave a continuing role in providing advisory services to the Fund. Thus, the Board’s approval of the advisory andsubadvisory contracts reflected the fact that it is the shareholders who have effectively selected the Adviser by virtue ofhaving invested in the Fund. The Board concluded that, in light of the factors discussed above, including the nature, qualityand scope of the services provided to the Fund by the Adviser and its affiliates, continuation of the investment advisorycontract was appropriate.
Annual Shareholder Report30

The Board based its decision to approve the investment advisory and subadvisory contracts on the totality of thecircumstances and relevant factors and with a view to past and future long-term considerations. Not all of the factors andconsiderations identified above were necessarily relevant to the Fund, nor did the Board consider any one of them to bedeterminative. With respect to the factors that were relevant, the Board’s decision to approve the continuation of thecontracts reflects its determination that Federated’s performance and actions provided a satisfactory basis to support thedecision to continue the existing arrangements.
Annual Shareholder Report31

Voting Proxies on Fund Portfolio SecuritiesA description of the policies and procedures that the Fund uses to determine how to vote proxies, if any, relating tosecurities held in the Fund’s portfolio is available, without charge and upon request, by calling 1-800-341-7400. A report on“Form N-PX” of how the Fund voted any such proxies during the most recent 12-month period ended June 30 is availablevia the Proxy Voting Record (Form N-PX) link associated with the Fund and share class name atwww.FederatedInvestors.com/FundInformation. Form N-PX filings are also available at the SEC’s website at www.sec.gov.
Quarterly Portfolio ScheduleThe Fund files with the SEC a complete schedule of its portfolio holdings, as of the close of the first and third quarters of itsfiscal year, on “Form N-Q.” These filings are available on the SEC’s website at www.sec.gov and may be reviewed andcopied at the SEC’s Public Reference Room in Washington, DC. (Call 1-800-SEC-0330 for information on the operationof the Public Reference Room.) You may also access this information via the link to the Fund and share class name atwww.FederatedInvestors.com/FundInformation.
Annual Shareholder Report32

Variable investment options are not bank deposits or obligations, are not guaranteed by any bank and are not insured or guaranteed by theU.S. government, the Federal Deposit Insurance Corporation, the Federal Reserve Board or any other government agency. Investment invariable investment options involves investment risk, including the possible loss of principal.
This Report is authorized for distribution to prospective investors only when preceded or accompanied by the Fund’sProspectus, which contains facts concerning its objective and policies, management fees, expenses and other information.
e e eratd dFederated Kaufmann Fund IIFederated Investors Funds4000 Ericsson DriveWarrendale, PA 15086-7561
Contact us at FederatedInvestors.comor call 1-800-341-7400.
Federated Securities Corp., Distributor
CUSIP 313916827CUSIP 313916777
28136 (2/18)
Federated is a registered trademark of Federated Investors, Inc.2018 ©Federated Investors, Inc.