federico fierli contribution from many colleagues and co
TRANSCRIPT

Observing aerosols
Federico Fierli
Contribution from many colleagues
and co-workers
Acknowledge the teaching material from D.
Jacob – U-Harvard – S. Massie NCAR

“We have in this fine dust
[aerosols] a most beautiful
illustration of how the little things
in the world work great effects by
virtue of their numbers.”
-John Aitken, 1880John Aitken (1839-1919)

Why should we care about aerosol and dust ?
Human health
Air quality
Global Climate
Radiation, Chemistry, Rainfall
Aerosols are important from the molecular to the
global scale

Aerosols and human health
1952: the “London smog disaster”
Air pollution O3, CO, NO2, SO2
aerosol

Aerosols are the principle component of what we perceive as “smog”
Submicron aerosols are
primarily responsible for visibility reduction.
Pasadena, CA, on a clear day (hills are 7 km away)
Pasadena, CA, on a bad smog day
Environmental Protection Agency (EPA)
PM2.5 15 g /m3 (annual average)
PM10 150 g /m3 (24 hour)
regulations.
See national map of compliance at:
http://en.wikipedia.org/wiki/File:Pm25-24a-
super.gif

Submicron aerosols can penetrate to the deepest parts of the lung whereupon they can affect the pulmonary part of the respiratory system. For this reason many, including the EPA, consider them dangerous air pollutants.
Aerosol Deposition in Human Respiratory Tract
0
0.2
0.4
0.6
0.8
1
0.01 0.1 1 10 100
Particle Diameter (m)
Dep
ositi
on F
ract
ion
Total
Pulmonary
Nasal
Tracheo-bronchial
Aerosols and human health
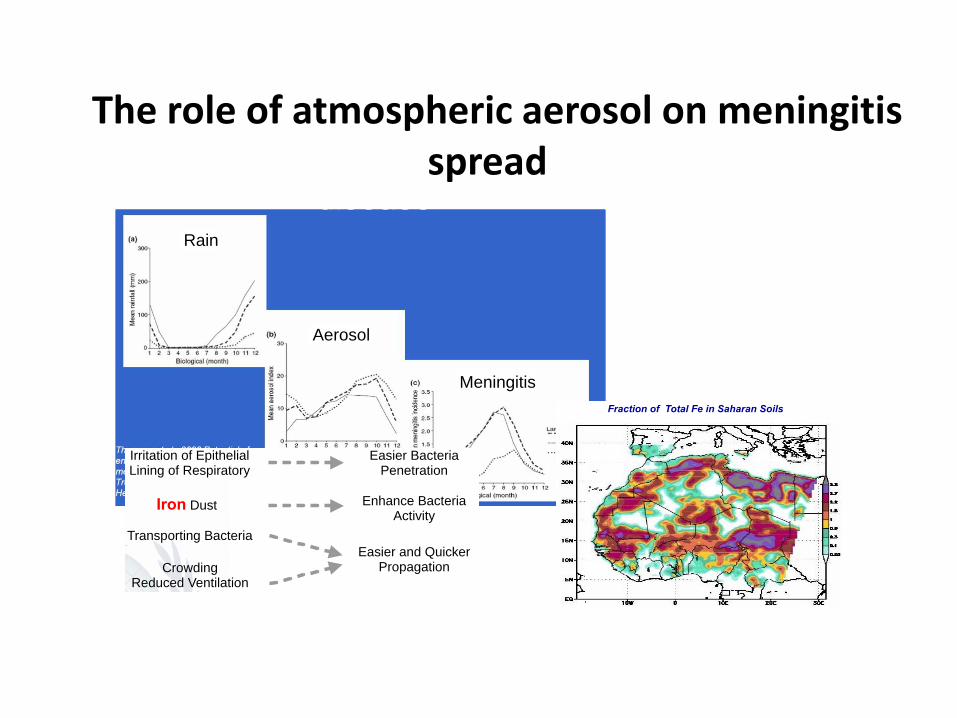
The role of atmospheric aerosol on meningitis spread
Rain
Aerosol
Meningitis
WWRP
Possible Mechanisms of t he Connect ion
14
PathogenesisOutbreak
CrowdingReduced Ventilation
Easier and Quicker Propagation
Transporting Bacteria
Iron Dust Enhance Bacteria Activity
Irritation of Epithelial Lining of Respiratory
Easier Bacteria Penetration
Fraction of Total Fe in Saharan Soils

Pollution/dust in India
Sea Salt
Saharan dust
SmokePollution?
Pollution/dust in China
Dust and smoke are Transported to the North-East Atlantic. From MODIS

Seinfeld and Pandis
450 / 3100
= 15%

Annual mean PM2.5 concentration (2002) derived from MODIS satellite instrument data

Aerosols : solid and liquid particles suspended in the air
Size: nm to 100 microns (range of 105)
Lifetime: Troposphere (days to weeks) Stratosphere (year)
Primary aerosol: emitted directly into the air
Secondary aerosol: gas to particle conversion
Composition: sulfate, ammonium, nitrate, sodium,
trace metals, carbonaceous, crustal, water
Carbonaceous
elemental: emitted directly into the air (e.g. diesel soot)
organic: a) directly by sources (e.g combustion, plant leaf)
b) condensation of low volatile organic gases
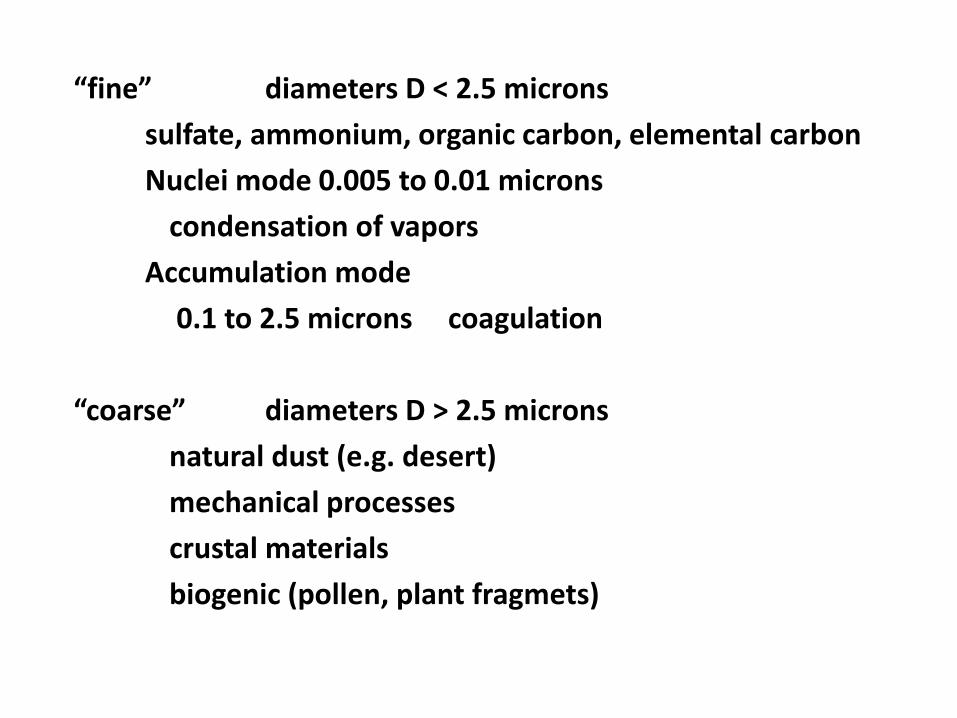
“fine” diameters D < 2.5 microns
sulfate, ammonium, organic carbon, elemental carbon
Nuclei mode 0.005 to 0.01 microns
condensation of vapors
Accumulation mode
0.1 to 2.5 microns coagulation
“coarse” diameters D > 2.5 microns
natural dust (e.g. desert)
mechanical processes
crustal materials
biogenic (pollen, plant fragmets)

Aerosol Types and Origin
• Aerosol particles larger than about 1 m in size are produced by windblown dust and sea salt from sea spray and bursting bubbles.
• Aerosols smaller than 1 µm are mostly formed by condensation processes such as conversion of sulfur dioxide (SO2) gas (released from volcanic eruptions) to sulfate particles and by formation of soot and smoke during burning processes.
• After formation, the aerosols are mixed and transported by atmospheric motions and are primarily removed by cloud and
precipitation processes.

0.01 0.1 1.0 10.0
It presents 3 modes :
- « nucleation »: radius is between 0.002 and 0.05 mm. They result from combustion processes, photo-chemical reactions, etc.
- « accumulation »: radius is between 0.05 mm and 0.5 mm. Coagulation processes.
- « coarse »: larger than 1 mm. From mechanical processes like aeolian erosion.
« fine » particles (nucleation and accumulation) result from anthropogenic activities, coarse particles come from natural processes.
Aerosol Size Distribution

Size Distribution
Log-normal particle size distribution
dN/dr = (Ni / (2 ) 1/2 r ln) exp {- (ln r/ln r0)2/2ln2)
Units: number per cm-3 per microns
i=1,2 2 modesNi, total number of particles for mode i (cm-3)r, radii (microns), mode width (dimensionless)r0, modal radii (microns)
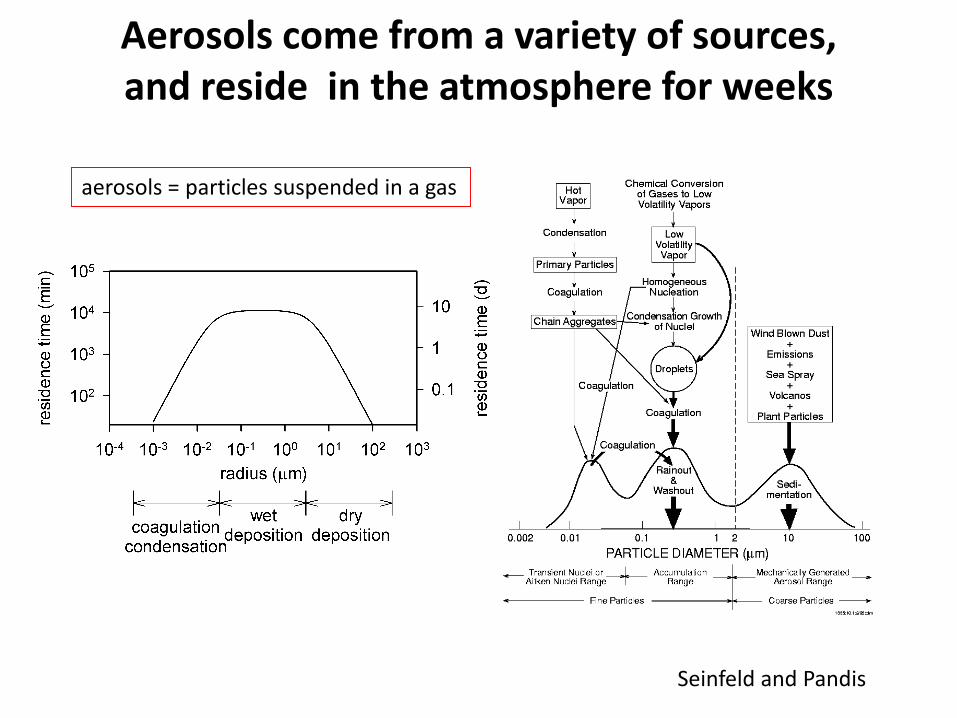
Aerosols come from a variety of sources, and reside in the atmosphere for weeks
aerosols = particles suspended in a gas
Seinfeld and Pandis
Size Distribution
Seinfeld and Pandis
“remote continental air”<100 nm: ultrafine
100 nm<dp<1 m: accumulation
sub-2.5 m: fine
coarse
NumberDensity n
SurfaceArea(n π r2)
VolumeDensity(n 4/3 π r3)

Key aerosol microphysical parameters
Particle size and size distributionAerosol particles > 1 mm in size are produced by windblown dust and sea salt from sea spray and bursting bubbles. Aerosols smaller than 1 mm are mostly formed by condensation processes such as conversion of sulfur dioxide (SO2) gas to sulfate particles and by formation of soot and smoke during burning processes
Effective radiusMoment of size distribution weighted by particle area and number density distribution
Complex refractive indexThe real part mainly affects scattering and the imaginary part mainly affects absorption
Particle shapeAerosol particles can be liquid or solid, and therefore spherical or nonspherical.The most common nonspherical particles are dust and cirrus

The bimodal nature of the size-number distribution of atmospheric particles suggests at least two distinct mechanisms of formation, and the chemical composition of the particles reflects their origins.
Fine particles have a diameter smaller than about 2.5 mm, and are produced by the condensation of vapors, accumulation, and coagulation. They have a chemical composition that reflects the condensable trace gases in the atmosphere: SO2, NH3, HNO3, VOC’s, and H2O. The chemical composition is water with SO4
-2, NO3-, NH 4
+, Pb, Cl-, Br-, C(soot), and organic matter; where biomass burning is prevalent, K+.
Coarse Particles have a diameter greater than about 2.5 mm, are produced by mechanical weathering of surface materials. Their lifetimes, controlled by fallout and washout, are generally short. The composition of particles in this size range reflects that of the earth's surface - silicate (SiO2), iron and aluminum oxides, CaCO3 and MgCO3; over the oceans , NaCl.

Global dust emissions (modeled)
Fairlie et al. [2007]
1 cent coin= 2.5 g


Dust event – how it works ?

Dust event – how frequent is it ?

Dust event – impacts on Particulate Matter

Aerosols and climate
IPCC, AR4
Direct effect –Light is scattered and absorbed
DrivesGlobal Warming

“Warm clouds” clouds with liquid droplets“Mixed phase clouds” clouds with liquid and ice

Aerosol-radiation interactions
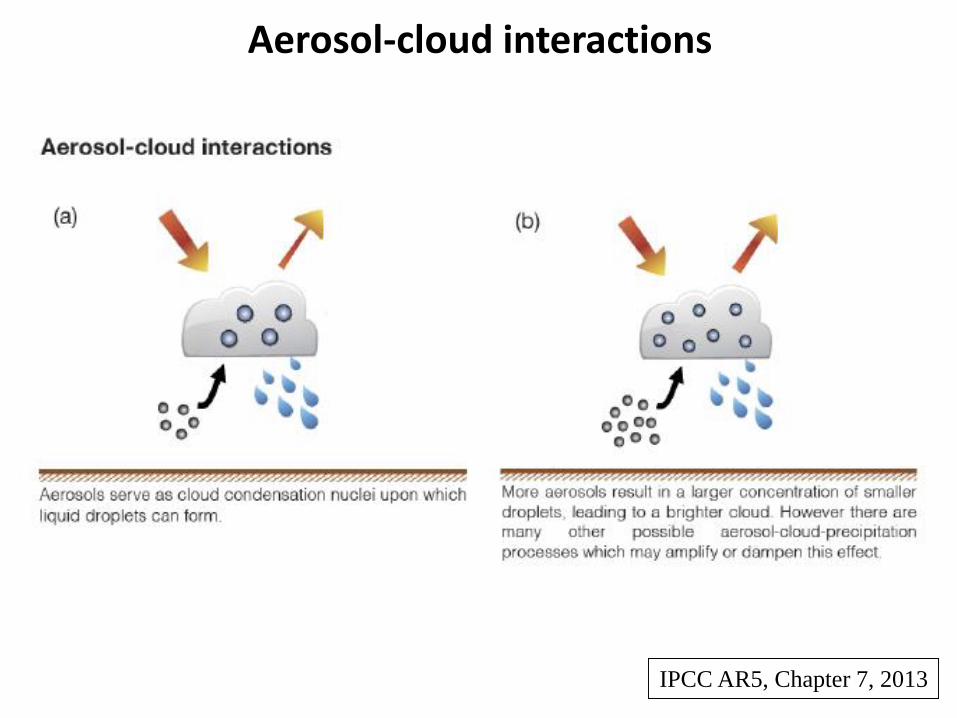
Aerosol-cloud interactions
IPCC AR5, Chapter 7, 2013

Aerosol radiative forcings
IPCC AR5, Chapter 7, 2013

Aerosol “indirect effect” on climate
clean cloud (few particles):large cloud droplets• low albedo• efficient precipitation
polluted cloud (many particles):small cloud droplets• high albedo• suppressed precipitation
(very controversial)

Aerosols and climate: indirect effect
• aerosols are the “seeds” upon which water vapor condenses to form a cloud (these are called “cloud condensation nuclei, or CCN).
• If people make more aerosols, we make more cloud droplets, but because there is a fixed amount of water vapor in the air these droplets will be smaller.
• smaller droplets scatter light more efficiently!
• smaller cloud droplets may also impact rain from these clouds.
• very difficult effect to observe and model!
“Ship Tracks” off the coast of Washington
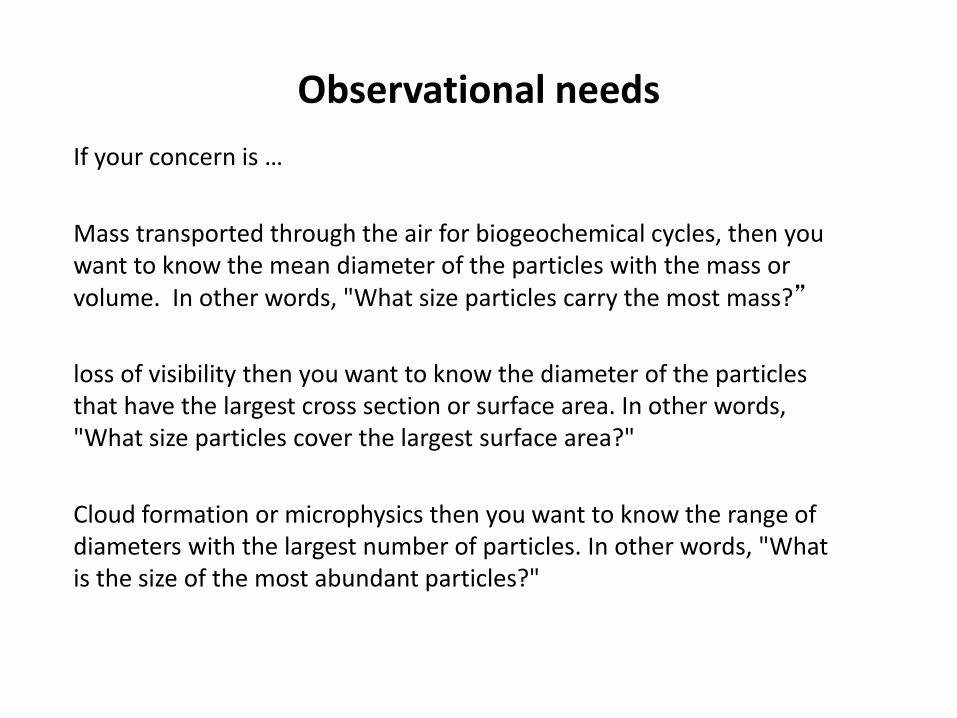
Observational needs
If your concern is …
Mass transported through the air for biogeochemical cycles, then you want to know the mean diameter of the particles with the mass or volume. In other words, "What size particles carry the most mass?”
loss of visibility then you want to know the diameter of the particles that have the largest cross section or surface area. In other words, "What size particles cover the largest surface area?"
Cloud formation or microphysics then you want to know the range of diameters with the largest number of particles. In other words, "What is the size of the most abundant particles?"

Observational needs
If your concern is…
human health then you need to know about both the mass and number of the particles, because only a certain size particle can enter the lungs.
Direct climate effect then you need to know about global distribution and impact on radiative budget

Observational needs
There is no perfect instrument – they observe a specific aspect at a different time and spatial scale …

Ground-based – reference stations
Gravimetric method – reference for air quality monitoring
Advantage: direct measure of mass – reliable
Disadvantage: relatively expensive, need for operator, not global coverage
https://www.eionet.europa.eu/etcs/etc-atni/products/etc-atni-reports/etcacm_tp_2011_21_pm10equivalence

Ground-based – optical instruments
https://doi.org/10.4209/aaqr.2017.12.0611

Remote Sensing Overview
• What is “remote sensing”?– Using artificial devices, rather than our eyes, to observe or measure
things from a distance without disturbing the intervening medium• It enables us to observe & measure things on spatial, spectral, & temporal
scales that otherwise would not be possible
• It allows us to observe our environment using a consistent set of measurements throughout the globe, without prejudice associated with national boundaries and accuracy of datasets or timeliness of reporting
• How is remote sensing done?– Electromagnetic spectrum
• Passive sensors from the ultraviolet to the microwave
• Active sensors such as radars and lidars
– Satellite, airborne, and surface sensors
– Training and validation sites
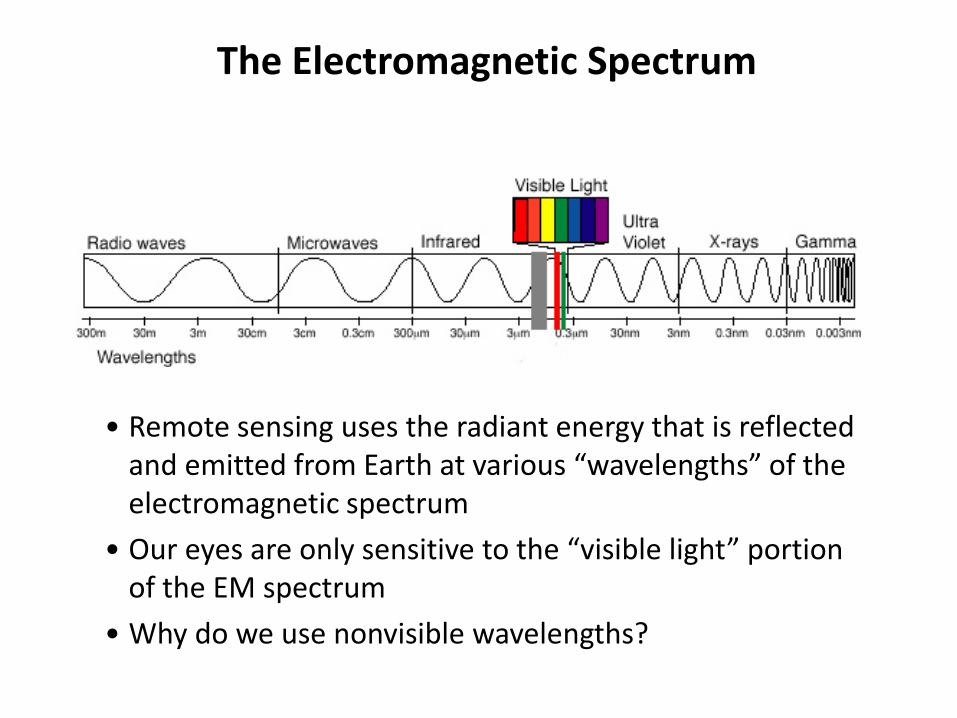
• Remote sensing uses the radiant energy that is reflected and emitted from Earth at various “wavelengths” of the electromagnetic spectrum
• Our eyes are only sensitive to the “visible light” portion of the EM spectrum
• Why do we use nonvisible wavelengths?
The Electromagnetic Spectrum

Key aerosol optical parameters
Optical depthnegative logarithm of the direct-beam transmittancecolumn integrated measure of the amount of extinction
(absorption + scattering)
Single-scattering albedo v0
given an interaction between a photon and a particle, the probabilitythat the photon is scattered in some direction, rather than absorbed
Scattering phase functionprobability per unit solid angle that a photon is scattered into a particular
direction relative to the direction of the incident beam
Angstrom exponent aexponent of power law representation of extinction vs. wavelength
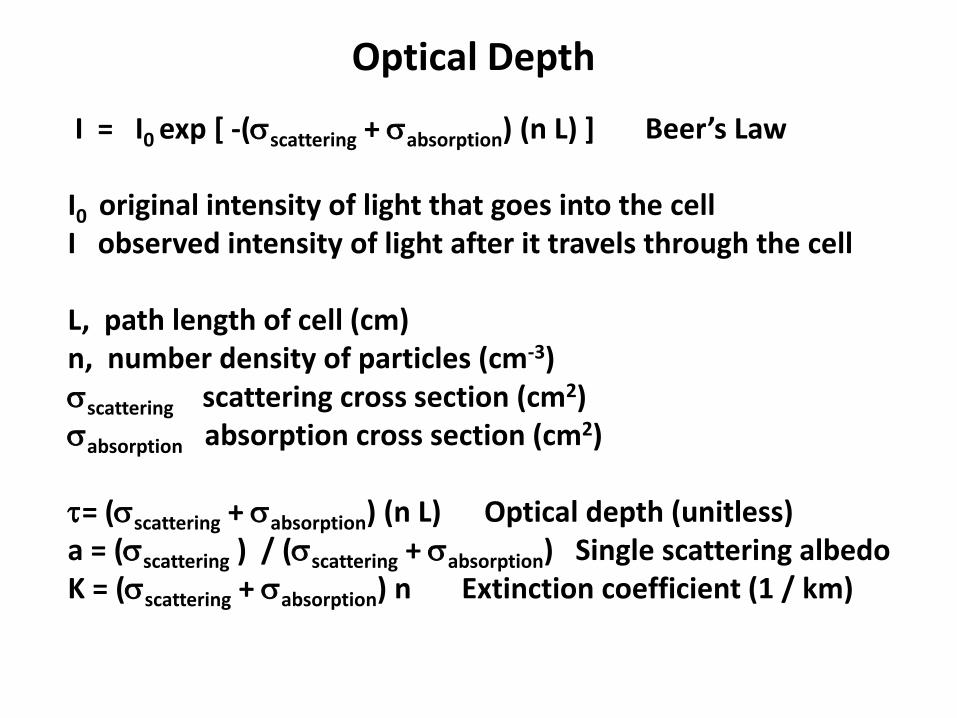
Optical Depth
I = I0 exp [ -(scattering + absorption) (n L) ] Beer’s Law
I0 original intensity of light that goes into the cellI observed intensity of light after it travels through the cell
L, path length of cell (cm)n, number density of particles (cm-3)scattering scattering cross section (cm2)absorption absorption cross section (cm2)
= (scattering + absorption) (n L) Optical depth (unitless)a = (scattering ) / (scattering + absorption) Single scattering albedoK = (scattering + absorption) n Extinction coefficient (1 / km)

Optical Properties
ext () = 103 Qext (r,) r2 dN/dr dr extinction (units km-1)
r particle radius (m)dn / dr particle size distribution (# cm-3 m-1)
Qext (r , ) extinction efficiency (from Mie theory)
Qext = Qsca + Qabs (sca=scattering, abs = absorption)
Q is a function of the complex index of refractioni.e. composition
Size parameter x = 2 r /
Optical depth contribution in path length ds is () ds

Mie Scattering
Qext
Mie scattering(spherical particles)
Sensitivity to m2
m, complex index ofrefraction
Increase absorption, m2
m = 1.33 + i m2
The fine details becomesmoother
Note as particle sizebecomes large,
Qext -> 2
m2=0.001
0.01
0.03
0.10
Bohren and Huffman
Each curveis offset by 1

General Results
Size parameter x = 2 r / for = wavelength
For very small particles x << 1 (Rayleigh scattering)scattering 1 / 4 The sky is Blue
For medium size particles (aerosols), x ~1 (Mie scattering)
scattering ~ 1/ The sky is grey
For big size particles (cloud droplets, cirrus) x >> 1Qext -> 2 independent of Clouds are white

Aerosol optics
particles scatter most
efficiently in the part of
the size spectrum with
the longest atmospheric
lifetimes!

Radiation detected by satellites
• Air scattering depends on geometry and can be calculated (Rayleigh scattering)
• Clouds completely obscure the surface and have to be masked out
• Aerosols redirect incoming radiation by scattering and also absorb a fraction
• Surface reflectance is a property of the surface

Advantages:Better time resolution
Disadvantages:One side of the Earth -> needs of constellationslarge viewing angles at the borders -> geometrical distorsionsOnly VIS/IR and passive Obs.
Advantages:More near to Earth -> Higher spatial resolutionUsed also for Active Obs.(Radar/Lidar) and PMWDisadvantages:Poorer time resolution -> needs of constellation
Satellite orbits

Just like the human eye, satellite sensors detect the total amount of solar radiation that is reflected from the earth’s surface (Ro) and backscattered by the atmosphere from aerosol, pure air, and clouds. A simplified expression for the relative radiation detected by a satellite sensor (I/Io) is:
I / Io = Ro e-+ (1- e-) P
Satellite Detection of Aerosols
Today, geo-synchronous and polar orbiting satellites can detect different aspects of aerosols over the globe daily.
where is the aerosol optical thickness and P the angular light scattering probability.
Height Type Size Angle Shape
dHdCdDdPdSSPDCHI

Apparent Surface Reflectance, R• The surface reflectance R0 is obscured by aerosol scattering and absorption before it reaches the sensor
• Aerosol acts as a filter of surface reflectance and as a reflector solar radiation
Aerosol as Reflector: Ra = (e-t – 1) P
R = (R0 + (e-t – 1) P) e-t
Aerosol as Filter: Ta = e-t
Surface reflectance R0
• The apparent reflectance , R, detected by the sensor is: R = (R0 + Ra) Ta
• Under cloud-free conditions, the sensor receives the reflected radiation from surface and aerosols
• Both surface and aerosol signal varies independently in time and space
• Challenge: Separate the total received radiation into surface and aerosol components

Aerosol Effect on Surface Color and Surface Effect
• Aerosols add to the reflectance and sometimes reduce the reflectance of surface objects
• Aerosols always diminish the contrast between dark a bright surface objects
• Haze and smoke aerosols change the color of surface objects to bluish while dust adds a yellowish tint.
• Dark surfaces like ocean and dark vegetation makes the aerosol appear bright.
• Bright surfaces like sand and clouds makes the aerosol invisible.

Apparent Surface Reflectance, R
Aerosols will increase the apparent surface reflectance, R, if P/R0 < 1. For this reason, the reflectance of ocean and dark vegetation increases with τ.
When P/R0 > 1, aerosols will decrease the surface reflectance. Accordingly, the brightness of clouds is reduced by overlying aerosols.
At P~ R0 the reflectance is unchanged by haze aerosols (e.g. soil and vegetation at 0.8 um)..
At large τ (radiation equilibrium), both dark and bright surfaces asymptotically approach the ‘aerosol reflectance’, P
The critical parameter whether aerosols will increase or decrease the apparent reflectance, R, is the ratio of aerosol angular reflectance, P, to bi-directional surface reflectance, R0, P/ R0
0
0.1
0.2
0.3
0.4
0.5
0.6
0.7
0.8
0.9
1
0 0.5 1 1.5 2 2.5 3 3.5 4
Aerosol Optical Thickness, AOT
Ap
pa
ren
t R
efl
ec
tan
ce
,R
--+ ePeRR ))1((0
Clouds at all wavelengths, P/Ro<o.5
Ocean at >0.6 umVegetation at 0.4 um, P/Ro>10
Soil at >0.6 umVegetation at >0.6 um, P/Ro=1
Vegetation at 0.5 um, P/Ro=2-5
Best fit P values:Haze: P = 0.38Dust: P = 0.28

Photometers – ground-based

Photometers – ground-based

256 citations
Climatology from AERONET
Co
olin
gH
eatin
g
Ha
nsen
et al. (1
99
7)
Dubovik, O., B. Holben, T. F. Eck, A. Smirnov, Y. J. Kaufman, M. D. King, D. Tanré, and I. Slutsker, 2002: Variability
of absorption and optical properties of key aerosol types observed in worldwide locations. J. Atmos. Sci., 59, 590–608.
https://doi.org/10.4209/aaqr.2017.12.0611

Active Remote Sensing - Lidar

Active Remote Sensing – Lidar Satellite
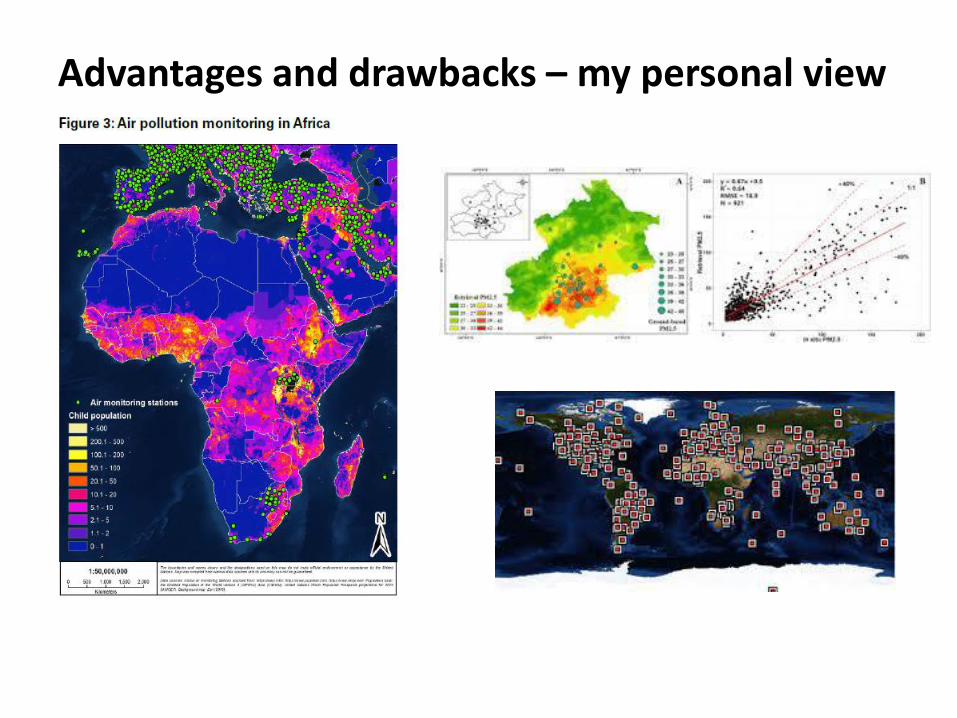
Advantages and drawbacks – my personal view

Advantages and drawbacks – my personal view
In-situ gravimetric Measurements of mass –accurate
Local coverage – no over sea – relatively expensive – no aerosol types
In-situ optical Cheaper, potentiallypervasive
Not direct, less accurate, calibration needed
Remote Sensing satellite Global, cover long time range
Optical parameters,difficult to derive aerosol type – no info on vertical
Ground-based Dense networks, calibrated, insights on aerosol size
Not global, no info on vertical
Lidar Information on vertical structure, insights on aerosol size and optical properties
Not global, expensive

Seinfeld and Pandis, Atmospheric Chemistry and Physics, 1998.
Bohren and Huffman, Absorption and Scattering of Light by Small Particles, 1983.
Finlayson-Pitts & Pitts, Chemistry of the Upper and Lower Atmosphere, Chapt. 9.
Few “historical papers”
Prospero et al. Rev. Geophys. Space Phys., 1607, 1983; Charlson et al. Nature 1987; Charlson et al., Science, 1992.Ramanathan et al., Science, 2001; Andreae and Crutzen, Science, 1997; Dickerson et al., Science 1997; Jickells et al., Global Iron Connections Between Desert Dust, Ocean Biogeochemistry and Climate, Science, 308 67-71, 2005.
References