fedessa european self storage annual survey 2016 · 4 | fedessa european self storage annual survey...
TRANSCRIPT
FEDESSA European Self Storage Annual Survey 2016

UNITEDKINGDOM
IRELAND
PORTUGAL
DENMARK
BELGIUM
LITHUANIA
LATVIA
ESTONIA
NORWAY
ICELAND
FINLAND
HUNGARY
ITALY
SWITZERLAND
AUSTRIA
ROMANIA
CZECHREPUBLIC
FRANCE
NETHER-LANDS
GERMANY
SWEDEN
SPAIN
POLAND
0.045
0.016
0.054
0.031
0.0010.004
0.006
0.005
0.006
0.000
0.001
0.050
0.003
0.014
0.017
0.012
0.001
0.014
0.009
0.037 0.023
0.002
0.003
2016FLOOR AREA PER CAPITA HEAT MAP
EUROPEAN KEY0 - 0.010 square metres 0.011 - 0.020 square metres 0.021 - 0.030 square metres
0.031 - 0.040 square metres 0.041 - 0.050 square metres 0.051 - 0.060 square metres
0.848US
0.170AUSTRALIA
To see full statistics for each country please visit jll.co.uk/selfstorage or fedessa.org

FEDESSA European Self Storage Annual Survey 2016 | 3
Contents
Page 4 Introduction
Page 5 Executive summary
Page 6 Economic and real estate overview
Page 12 Industry overview
Page 16 Survey results
Page 23 Outlook
Page 25 Additional information
Page 26 Reference tables
4 | FEDESSA European Self Storage Annual Survey 2016
Introduction
This is the fifth consecutive annual survey carried out by the Federation of European Self Storage Associations (FEDESSA) amongst its member associations and their member companies. Following the success of last year’s report, this is the second year that it has been produced by JLL. The survey provides a valuable insight into the industry across Europe. It is aimed at helping investors, funders and operators in this growing and dynamic market.
There are now over 2,700 facilities across Europe providing 7.776 million square metres of space. Markets such as the UK and the Netherlands have been established for more than 20 years and offer more than 0.05 square metres of space per capita, compared to other countries where the sector is younger and the amount of available space is much lower.
JLL and FEDESSA have received responses from operators in 16 countries who operate just under 700 stores which make up a quarter of the total market. Responses to the Self Storage Association UK’s (SSA UK) Annual Survey 2016 have been added to this report where appropriate.
We have included the main findings in the survey results section, while responses to all questions can be found in the reference tables section at the back of this report.
This year, a simpler map has been provided in the printed copy of this survey, but an online interactive map has been produced showing much more detailed information. The map is available on both the FEDESSA and JLL websites.
We hope that you find this helpful and informative and welcome any feedback from operators, owners, suppliers or other readers of the report so that we can make further improvements in the future.
Rennie Schafer Ollie Saunders Chief Executive Officer – FEDESSA Lead Director – Self Storage, JLL
October 2016
FEDESSA European Self Storage Annual Survey 2016 | 5
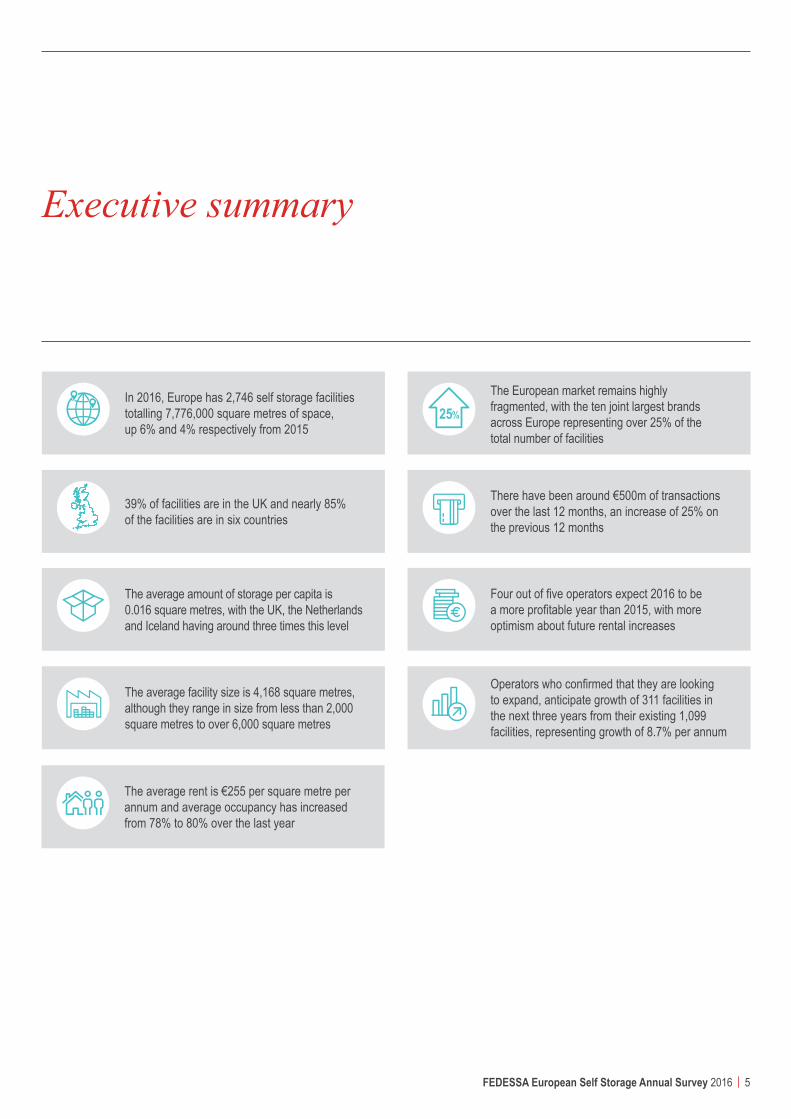
Executive summary
In 2016, Europe has 2,746 self storage facilities totalling 7,776,000 square metres of space, up 6% and 4% respectively from 2015
The European market remains highly fragmented, with the ten joint largest brands across Europe representing over 25% of the total number of facilities
The average amount of storage per capita is 0.016 square metres, with the UK, the Netherlands and Iceland having around three times this level
Four out of five operators expect 2016 to be a more profitable year than 2015, with more optimism about future rental increases
The average rent is €255 per square metre per annum and average occupancy has increased from 78% to 80% over the last year
39% of facilities are in the UK and nearly 85% of the facilities are in six countries
There have been around €500m of transactions over the last 12 months, an increase of 25% on the previous 12 months
The average facility size is 4,168 square metres, although they range in size from less than 2,000 square metres to over 6,000 square metres
Operators who confirmed that they are looking to expand, anticipate growth of 311 facilities in the next three years from their existing 1,099 facilities, representing growth of 8.7% per annum
25
6 | FEDESSA European Self Storage Annual Survey 2016
Economic and real estate overview
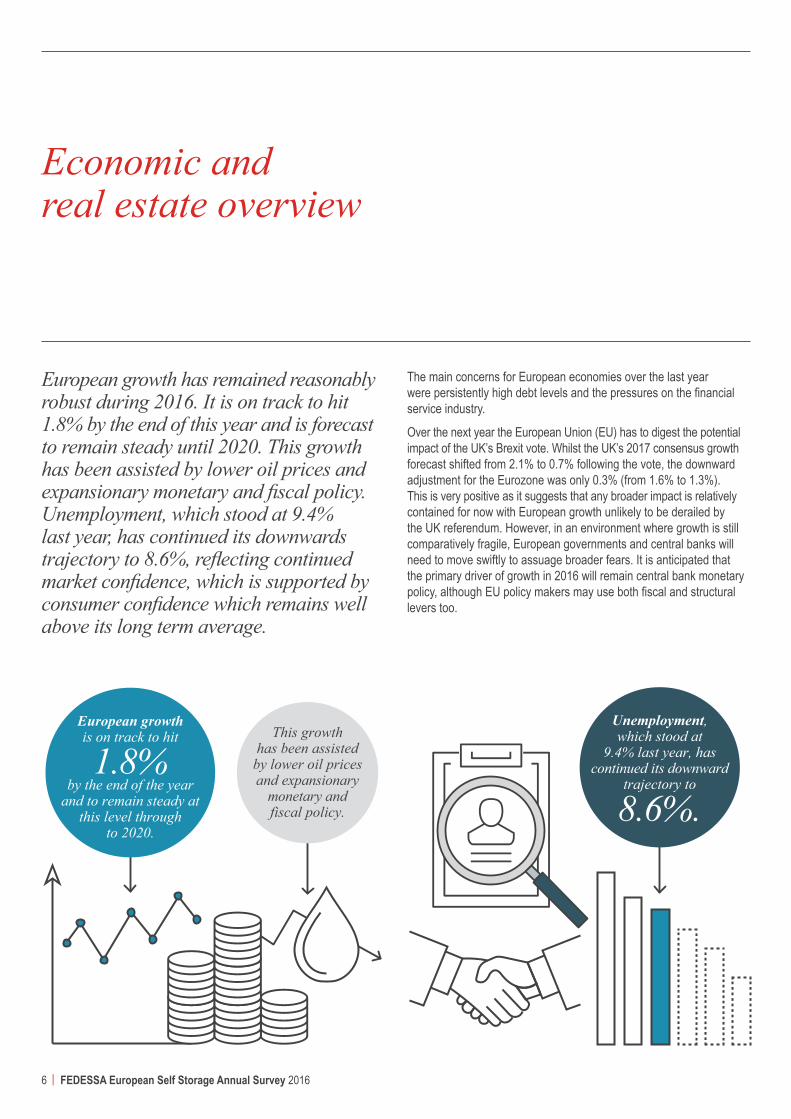
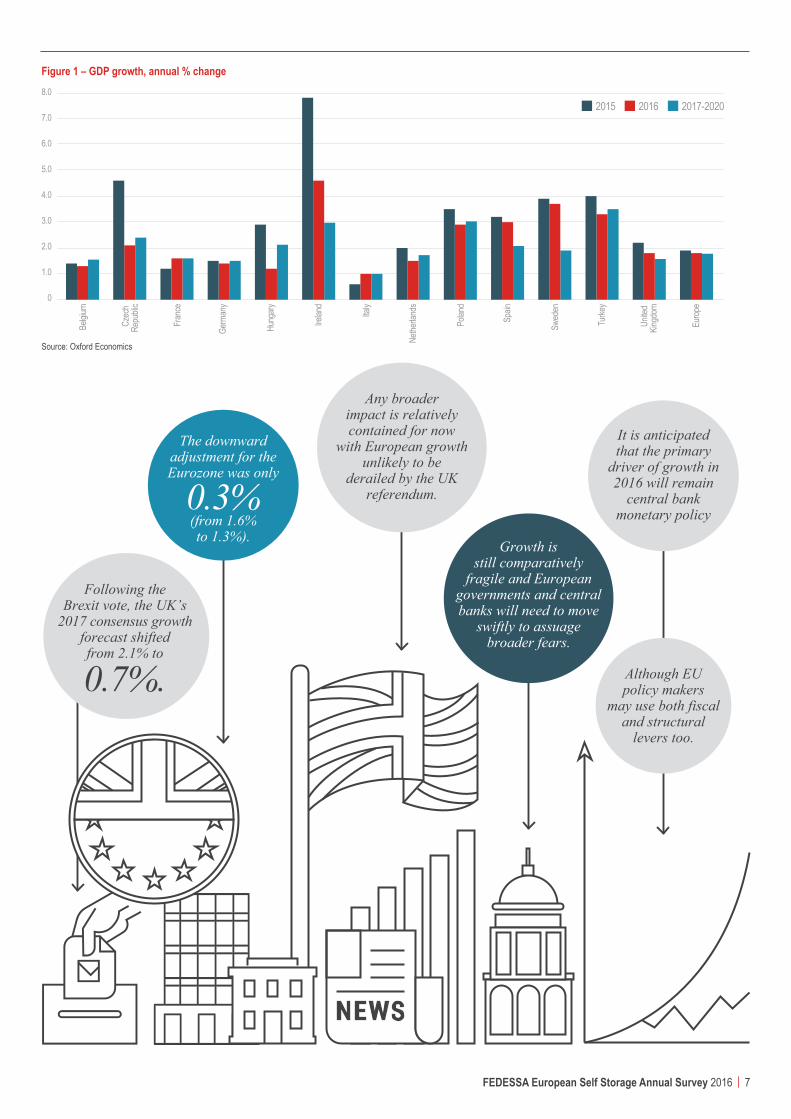
European growth has remained reasonably robust during 2016. It is on track to hit 1.8% by the end of this year and is forecast to remain steady until 2020. This growth has been assisted by lower oil prices and expansionary monetary and fiscal policy. Unemployment, which stood at 9.4% last year, has continued its downwards trajectory to 8.6%, reflecting continued market confidence, which is supported by consumer confidence which remains well above its long term average.
European growth is on track to hit
1.8% by the end of the year
and to remain steady at this level through
to 2020.
This growth has been assisted
by lower oil prices and expansionary
monetary and fiscal policy.
Unemployment, which stood at
9.4% last year, has continued its downward
trajectory to
8.6%.
The main concerns for European economies over the last year were persistently high debt levels and the pressures on the financial service industry.
Over the next year the European Union (EU) has to digest the potential impact of the UK’s Brexit vote. Whilst the UK’s 2017 consensus growth forecast shifted from 2.1% to 0.7% following the vote, the downward adjustment for the Eurozone was only 0.3% (from 1.6% to 1.3%). This is very positive as it suggests that any broader impact is relatively contained for now with European growth unlikely to be derailed by the UK referendum. However, in an environment where growth is still comparatively fragile, European governments and central banks will need to move swiftly to assuage broader fears. It is anticipated that the primary driver of growth in 2016 will remain central bank monetary policy, although EU policy makers may use both fiscal and structural levers too.
FEDESSA European Self Storage Annual Survey 2016 | 7
8.0
7.0
6.0
5.0
4.0
3.0
2.0
1.0
0
Belgi
um
Czec
h Re
publi
c
Fran
ce
Germ
any
Hung
ary
Irelan
d
Italy
Nethe
rland
s
Polan
d
Spain
Swed
en
Turke
y
Unite
d Kin
gdom
Europ
e
2017-202020162015
Figure 1 – GDP growth, annual % change
Source: Oxford Economics
The downward adjustment for the Eurozone was only
0.3%(from 1.6% to 1.3%).
Following the Brexit vote, the UK’s
2017 consensus growth forecast shifted from 2.1% to
0.7%.
Any broader impact is relatively contained for now
with European growth unlikely to be
derailed by the UK referendum.
It is anticipated that the primary
driver of growth in 2016 will remain
central bank monetary policy
Although EU policy makers
may use both fiscal and structural
levers too.
Growth is still comparatively
fragile and European governments and central banks will need to move
swiftly to assuage broader fears.
8 | FEDESSA European Self Storage Annual Survey 2016
Economic and real estate overview
Alternative investment now
represents at least 15% of overall investment and in the first half of 2016 alternatives made up 23% of the total UK real estate market.
The UK and Germany have a
respective 30% and 18% of the total
market in the first half of 2016.
For the first half of 2016 there was a 5%
reduction (€97 billion) in real estate investment
volumes, compared to the same period last year
(€102 billion in the first half of 2015).
2015 saw a significant 16% rise
in investment volumes to €242 billion, close to matching pre-recession
investment volumes of €245 billion in
2007.
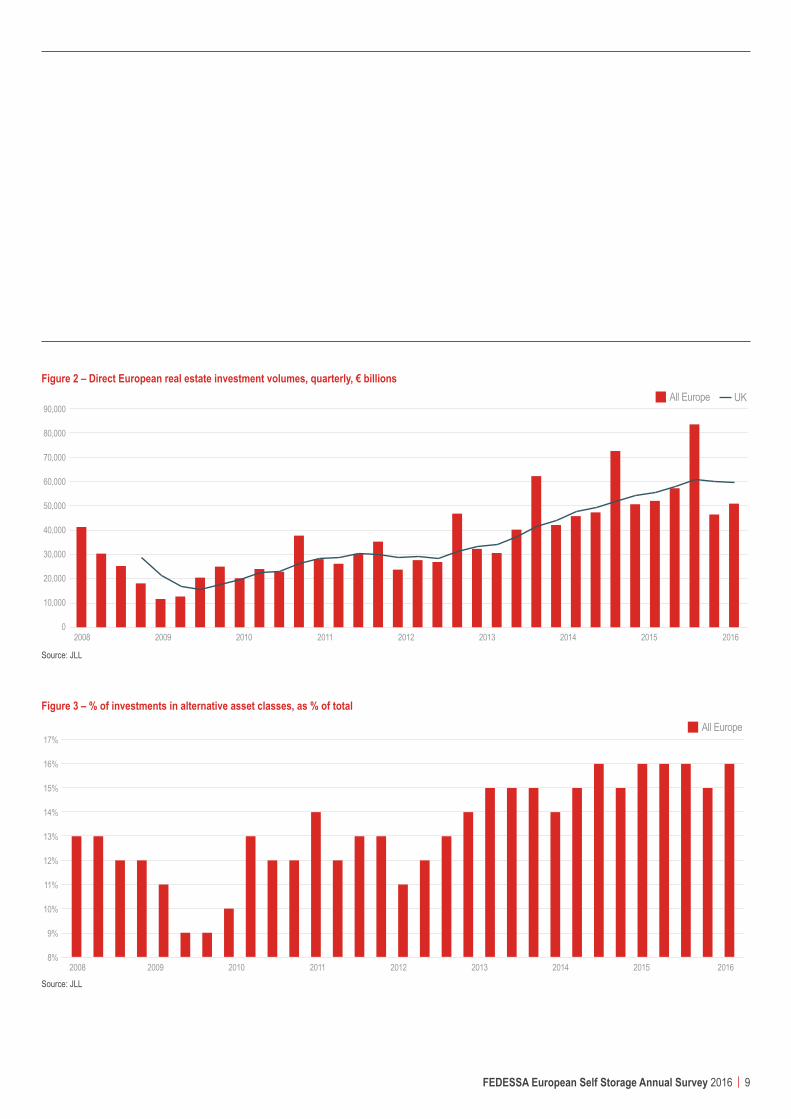
Real estate investment marketThe past 12 months have continued to see significant capital flows into European Commercial Real Estate. 2015 saw a 16% rise in investment volumes, compared to 2014, to €242 billion, close to matching pre-recession investment volumes of €245 billion in 2007. The modest 5% reduction in real estate investment volumes for the first half of 2016 (€97 billion), compared to the same period last year (€102 billion in the first half of 2015) is thought to be more a reflection on the standout performance of 2015, rather than a material change in the first half of 2016.
The UK and Germany continue to represent the main destinations for European real estate capital, with a respective 30% and 18% of the total market in the first half of 2016.
In this crowded real estate investment market, investors are finding it increasingly challenging to allocate capital in traditional real estate
sectors. This is encouraging investors into alternative markets such as student housing, healthcare and self storage. Alternative investment now represents at least 15% of overall investment, compared to 10% in 2009 and in the first half of 2016 alternatives made up 23% of the total UK real estate market.
Investment volumes over the coming 12 months are expected to be lower in the UK compared to the same period in 2015, but at similar levels in other European markets. The argument for investing in alternative asset classes remains compelling due to a combination of record low interest rates, improving user demand and a favourable supply and demand equation. The uncertainty following the UK’s vote to leave the EU means that the market is now anticipating that policy rates in Europe are likely to remain in negative territory for at least three more years. This is providing an extra cushion for the sector relative to other asset classes.
FEDESSA European Self Storage Annual Survey 2016 | 9
Figure 2 – Direct European real estate investment volumes, quarterly, € billions
Source: JLL
Source: JLL
Figure 3 – % of investments in alternative asset classes, as % of total
17%
16%
15%
14%
13%
12%
11%
10%
9%
8%2008 2009 2010 2011 2012 2013 2014 2015 2016
All Europe
90,000
80,000
70,000
60,000
50,000
40,000
30,000
20,000
10,000
02008 2009 2010 2011 2012 2013 2014 2015 2016
UKAll Europe

10 | FEDESSA European Self Storage Annual Survey 2016
100%
90%
80%
70%
60%
50%
40%
30%
20%
10%
0%
20
18
16
14
12
10
8
6
4
2
0
Portu
gal
Roma
nia
Irelan
d
Polan
d
Austr
ia
Hung
ary Italy
Lithu
ania
Nethe
rland
s
Latvi
a
Eston
ia
Norw
ay
Germ
any
Switz
erlan
d
Fran
ce
Czec
hRe
publi
c
Spain UK
Finlan
d
Swed
en
Denm
ark
Icelan
d
Belgi
um
Europ
eav
erage
Facilities per million population1990 2025
Economic and real estate overview
Figure 4 – Urbanisation
Source: JLL/UN
The impact of urbanisation on self storage demandThe level of urbanisation of a country is known to be an important driver for self storage demand. A higher percentage of people living in cities puts more pressure on urban space, and as a result, rising property prices and smaller living spaces. When space is limited in homes, people will be more likely to choose to store their possessions in self storage.
Figure 4 shows the percentage of each country’s population who lived in urban areas in 1990, along with predictions for 2025. In Europe 73.8% of people live in cities and this number is expected to rise to over 75% by 2025. The collation between urbanisation and self storage provision is clearly not absolute, but it does show a strong link.
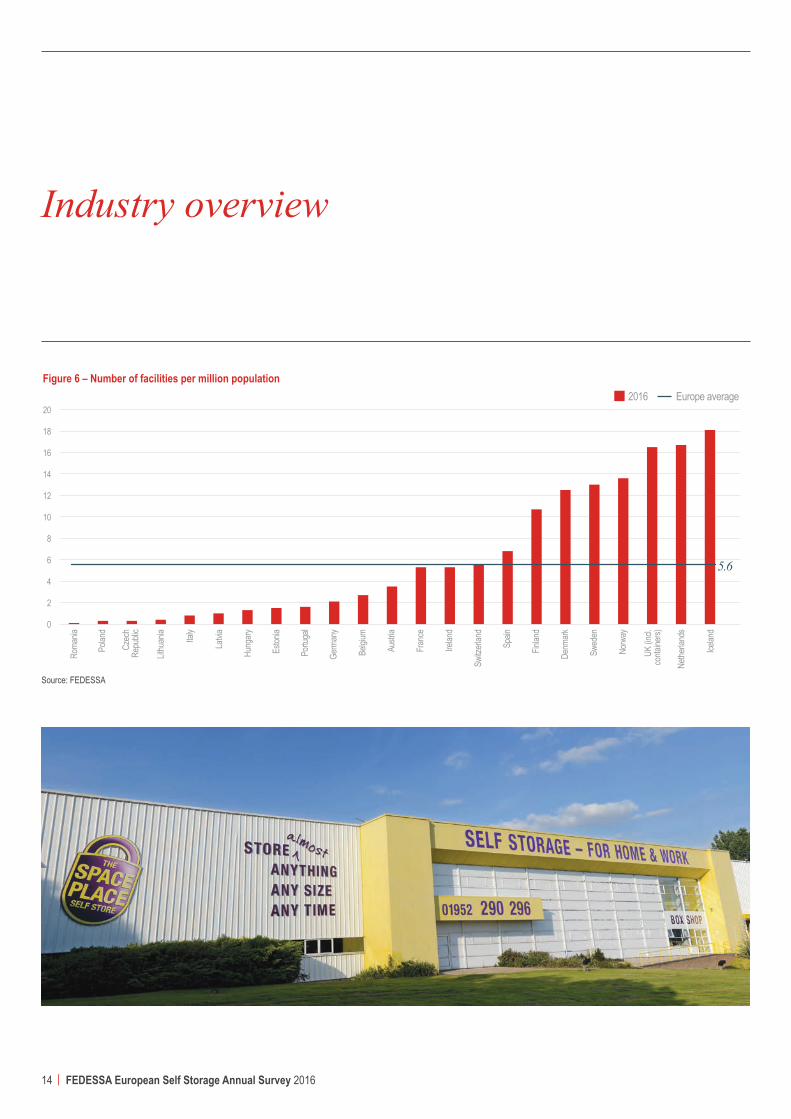
Iceland has one of the highest urbanisation rates in Europe at 94%, and also has the highest number of self storage facilities per million population. This highlights the market potential for self storage in some highly urbanised, but under provided for markets.

FEDESSA European Self Storage Annual Survey 2016 | 11
Safestore acquired the 12 store portfolio of SpaceMaker in July 2016 for around £45m, having previously managed the portfolio.
Storage Giant acquired two self storage facilities in Telford and Leicester in June 2016 from The Space Place.
Lock & Leave’s four stores in the UK were incorporated into Big Yellow’s main portfolio and their Armadillo platform in April 2016. The deal transacted at £21m.
24storage acquired 10 stores and two satellite stores between November 2015 and February 2016. The first acquisition provided over 15,000 square metres of lettable space with the ability to develop another 2,600 square metres of space for 170m SEK, while the second acquisition added a further 1,145 square metres to the portfolio for a price of 13.6m SEK.
The five stores of Less Mess Storage Inc were acquired by Metric Capital Partners in Q4 2015. The stores are located in Poland and the Czech Republic.
A majority stake in Easybox in Italy was sold in Q4 2015 by Caledonia Investments.
City Self Storage sold their Spanish portfolio of eight stores to BlueSpace in Q3 2015.
Key deals
There continues to be an active market for self storage real estate, with a relatively liquid market for the asset type. As well as new entrants to the market, existing operators and investors continue to look at consolidation.JLL estimate that there have been more than €500m of transactions over the last twelve months, with a mix of portfolio and individual asset sales, which is an increase of 25% on the previous 12 months, providing a strong body of comparable evidence.
The key transactions are:
“Since the end of 2013, the market has come back with dynamism. Traction is there.” Marc Oursin, Shurgard

12 | FEDESSA European Self Storage Annual Survey 2016
UK
39.2%
Others
15.8%
France
12.4%Spain
11.4%Netherlands
10.3%
Germany
6.2%Sweden4.7%
Industry overview
Number of facilitiesThe self storage industry has continued to grow in Europe during 2015/16. We estimate that there are now 2,746 facilities, which is an increase of 6% on the number in 2015, or an additional 149 facilities. There is now 7.776 million square metres of self storage space.
Measuring the exact number of self storage facilities and the space is challenging. There are conflicts in the definition of self storage, for example some countries include container storage and others do not. There are also a growing number of small self storage businesses, often co-sharing sites with other developments on rural land. Every year more research is put into determining the size of the industry and improved data does account for some of the year-on-year changes.
Six countries have nearly 85% of the total number of facilities in Europe. The UK market is the largest with 39% of the total number of European facilities, followed by France, Spain, the Netherlands, Germany and then Sweden. The largest number of new openings has been in the UK, which has seen 55 new facilities open in the last 12 months.

FEDESSA European Self Storage Annual Survey 2016 | 13
UK
39.2%
Others
15.8%
France
12.4%Spain
11.4%Netherlands
10.3%
Germany
6.2%Sweden4.7%
Floor area per capita The amount of self storage available per person is greatest in the UK, with the Netherlands and Iceland following closely behind. All three countries have around three times more space than the European average, which is 0.016 square metres per capita. These figures are consistent with those seen last year, which suggest that when compared with the more mature markets in the USA and Australia, which have 0.848 square metres and 0.17 square metres per capita respectively, there are still opportunities for growth. However, it is unlikely that the amount of self storage space per person will ever reach the same levels as that of the USA, given a number of factors including the availability and price of land.
Total available spaceAll but four countries have increased or maintained the same supply of space since the last survey. The UK has added 176,000 square metres of space, which represents a 5% increase in supply. Germany has also increased the amount of rentable space available by just over 50,000 square metres.
0.00
0.010
0.020
0.030
0.040
0.050
0.060
Polan
d
Lithu
ania
Roma
nia
Czec
h R
epub
lic
Eston
ia
Latvi
a
Italy
Hung
ary
Portu
gal
Germ
any
Switz
erlan
d
Austr
ia
Belgi
um
Spain
Fran
ce
Norw
ay
Irelan
d
Finlan
d
Denm
ark
Swed
en
Icelan
d
Nethe
rland
s
UK (in
cl.co
ntaine
rs)
Europe average2016
0.016
Figure 5 – Floor area per capita (square metres)
Source: FEDESSA
“Awareness of self storage is very low in Poland, with less than one in ten people knowing what it is. It is not a developed market in this part of Europe.” Guy Pinsent, Less Mess Storage
UK incl containersCurrent Lettable Area 3,493,000 square metres2016
FranceCurrent Lettable Area 930,000 square metres2016
NetherlandsCurrent Lettable Area 849,000 square metres2016
SpainCurrent Lettable Area 640,000 square metres2016
GermanyCurrent Lettable Area 463,000 square metres2016
SwedenCurrent Lettable Area 370,000 square metres2016
14 | FEDESSA European Self Storage Annual Survey 2016
0
2
4
6
8
10
12
14
16
18
20
5.6
Roma
nia
Polan
d
Czec
hRe
publi
c
Lithu
ania
Italy
Latvi
a
Hung
ary
Eston
ia
Portu
gal
Germ
any
Belgi
um
Austr
ia
Fran
ce
Irelan
d
Switz
erlan
d
Spain
Finlan
d
Denm
ark
Swed
en
Norw
ay
UK (in
cl.co
ntaine
rs)
Nethe
rland
s
Icelan
d
Europe average2016
Industry overview
Figure 6 – Number of facilities per million population
Source: FEDESSA
FEDESSA European Self Storage Annual Survey 2016 | 15
“In Italy our biggest problems are that awareness is so low plus the financial market doesn’t understand the sector.” Cesare Carcano, Casaforte
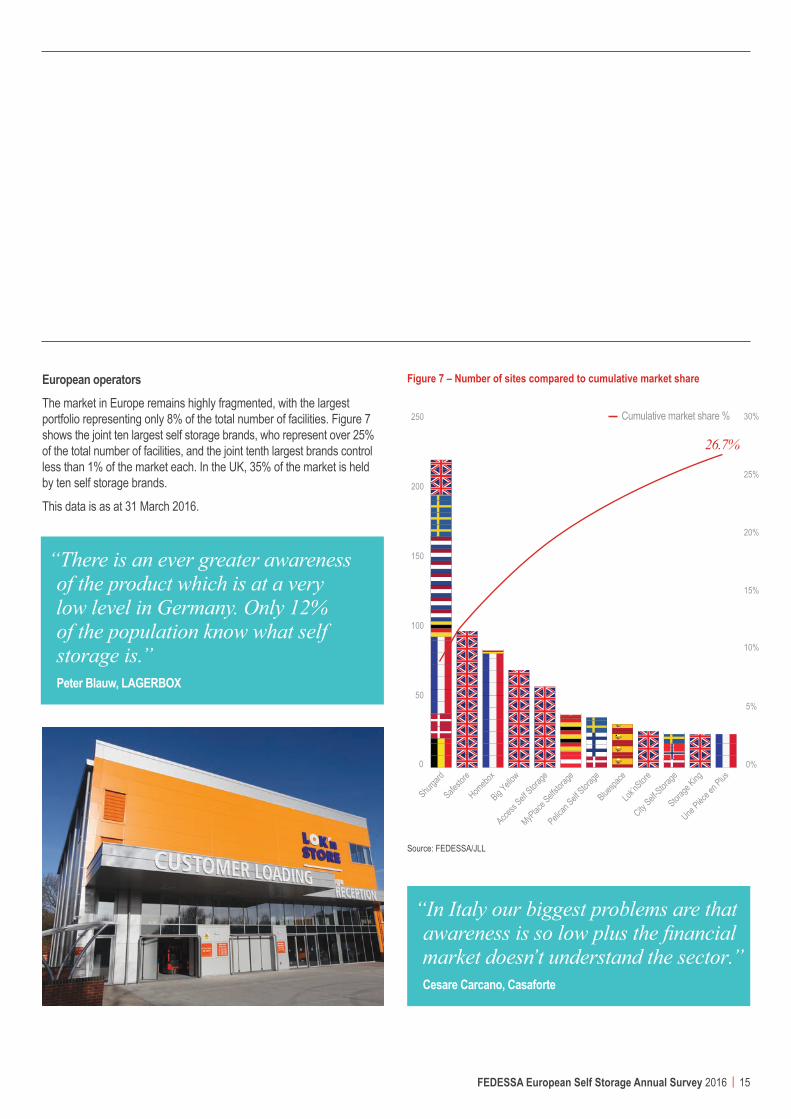
Figure 7 – Number of sites compared to cumulative market share
0%
5%
10%
15%
20%
25%
30%
0
50
100
150
200
250
Shurgar
d
Cumulative market share %
Une Pièc
e en P
lus
Storage
King
Lok’nS
tore
Bluespa
ce
City Self-
Storage
Pelican
Self Stora
ge
MyPlace S
elfstora
ge
Access
Self Stora
ge
Big Yello
w
Homebo
x
Safesto
re
26.7%
European operatorsThe market in Europe remains highly fragmented, with the largest portfolio representing only 8% of the total number of facilities. Figure 7 shows the joint ten largest self storage brands, who represent over 25% of the total number of facilities, and the joint tenth largest brands control less than 1% of the market each. In the UK, 35% of the market is held by ten self storage brands.
This data is as at 31 March 2016.
“There is an ever greater awareness of the product which is at a very low level in Germany. Only 12% of the population know what self storage is.” Peter Blauw, LAGERBOX
Source: FEDESSA/JLL
16 | FEDESSA European Self Storage Annual Survey 2016
Survey results
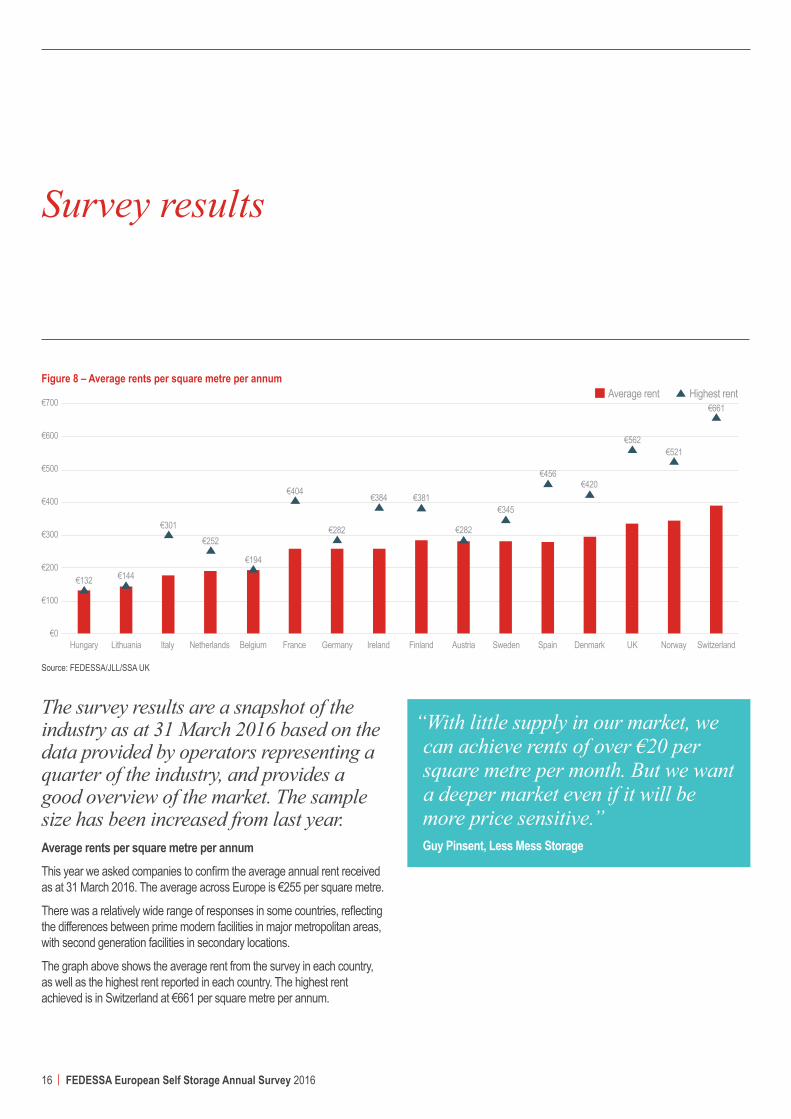
The survey results are a snapshot of the industry as at 31 March 2016 based on the data provided by operators representing a quarter of the industry, and provides a good overview of the market. The sample size has been increased from last year.Average rents per square metre per annumThis year we asked companies to confirm the average annual rent received as at 31 March 2016. The average across Europe is €255 per square metre.
There was a relatively wide range of responses in some countries, reflecting the differences between prime modern facilities in major metropolitan areas, with second generation facilities in secondary locations.
The graph above shows the average rent from the survey in each country, as well as the highest rent reported in each country. The highest rent achieved is in Switzerland at €661 per square metre per annum.
“With little supply in our market, we can achieve rents of over €20 per square metre per month. But we want a deeper market even if it will be more price sensitive.” Guy Pinsent, Less Mess Storage
Figure 8 – Average rents per square metre per annum
€700
€600
€500
€400
€300
€200
€100
€0Hungary
€132 €144
€301€252
€404
€282
€381
€456€420
€562€521
Lithuania GermanyBelgiumNetherlands IrelandItaly France SpainFinland UKAustria Sweden Denmark SwitzerlandNorway
Average rent Highest rent
€194
€384
€282
€345
€661
Source: FEDESSA/JLL/SSA UK
FEDESSA European Self Storage Annual Survey 2016 | 17
UKItaly IrelandFinlandAustria NorwaySpain Germany Switzerland NetherlandsDenmark Belgium HungaryLithuaniaSweden France
Occupied space 2016 Europe average 2016100%
90%
80%
70%
60%
50%
40%
30%
20%
10%
0%
80%
Source: FEDESSA/JLL/SSA UK
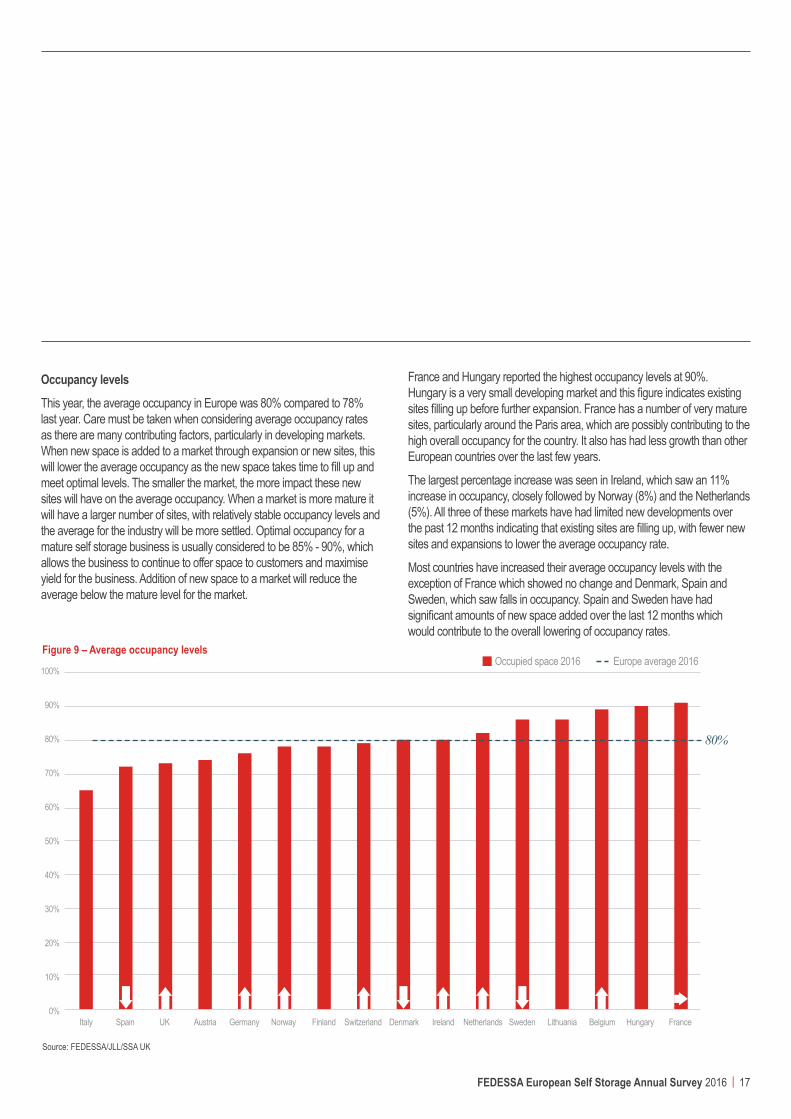
Occupancy levelsThis year, the average occupancy in Europe was 80% compared to 78% last year. Care must be taken when considering average occupancy rates as there are many contributing factors, particularly in developing markets. When new space is added to a market through expansion or new sites, this will lower the average occupancy as the new space takes time to fill up and meet optimal levels. The smaller the market, the more impact these new sites will have on the average occupancy. When a market is more mature it will have a larger number of sites, with relatively stable occupancy levels and the average for the industry will be more settled. Optimal occupancy for a mature self storage business is usually considered to be 85% - 90%, which allows the business to continue to offer space to customers and maximise yield for the business. Addition of new space to a market will reduce the average below the mature level for the market.
France and Hungary reported the highest occupancy levels at 90%. Hungary is a very small developing market and this figure indicates existing sites filling up before further expansion. France has a number of very mature sites, particularly around the Paris area, which are possibly contributing to the high overall occupancy for the country. It also has had less growth than other European countries over the last few years.
The largest percentage increase was seen in Ireland, which saw an 11% increase in occupancy, closely followed by Norway (8%) and the Netherlands (5%). All three of these markets have had limited new developments over the past 12 months indicating that existing sites are filling up, with fewer new sites and expansions to lower the average occupancy rate.
Most countries have increased their average occupancy levels with the exception of France which showed no change and Denmark, Spain and Sweden, which saw falls in occupancy. Spain and Sweden have had significant amounts of new space added over the last 12 months which would contribute to the overall lowering of occupancy rates.
Figure 9 – Average occupancy levels
18 | FEDESSA European Self Storage Annual Survey 2016
100%
90%
80%
70%
60%
50%
40%
30%
20%
10%
0%
Domestic area %Business area %Europe average
Finland
Norway
Denmark
Switzerlan
dFran
ce
Lithuan
iaUKAust
ria
Germany
Belgium
Netherla
nds
Sweden
Italy
Ireland Spai
n
67%
Survey results
“There are big differences between operating in different countries across Europe.” Guy Pinsent, Less Mess Storage
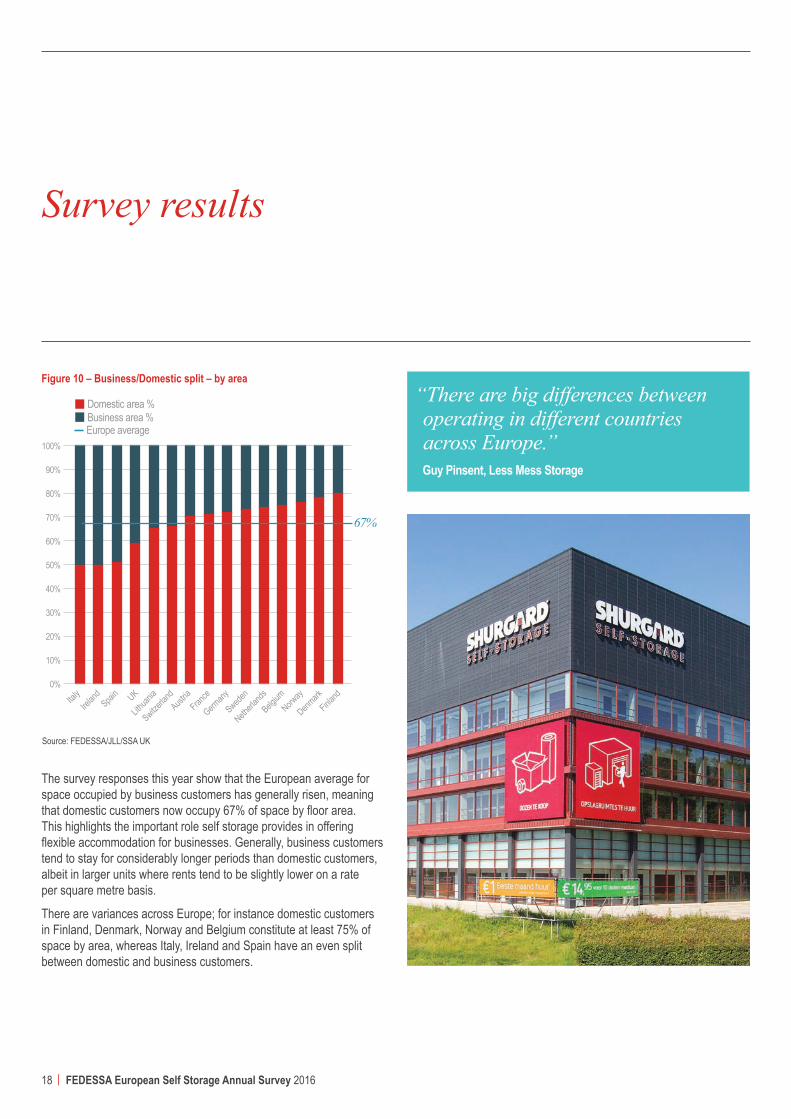
The survey responses this year show that the European average for space occupied by business customers has generally risen, meaning that domestic customers now occupy 67% of space by floor area. This highlights the important role self storage provides in offering flexible accommodation for businesses. Generally, business customers tend to stay for considerably longer periods than domestic customers, albeit in larger units where rents tend to be slightly lower on a rate per square metre basis.
There are variances across Europe; for instance domestic customers in Finland, Denmark, Norway and Belgium constitute at least 75% of space by area, whereas Italy, Ireland and Spain have an even split between domestic and business customers.
Figure 10 – Business/Domestic split – by area
Source: FEDESSA/JLL/SSA UK
FEDESSA European Self Storage Annual Survey 2016 | 19
“Our portfolio is just over 22% of commercial customers and we are increasingly urbanised.” Claus Mathisen, Pelican Self Storage
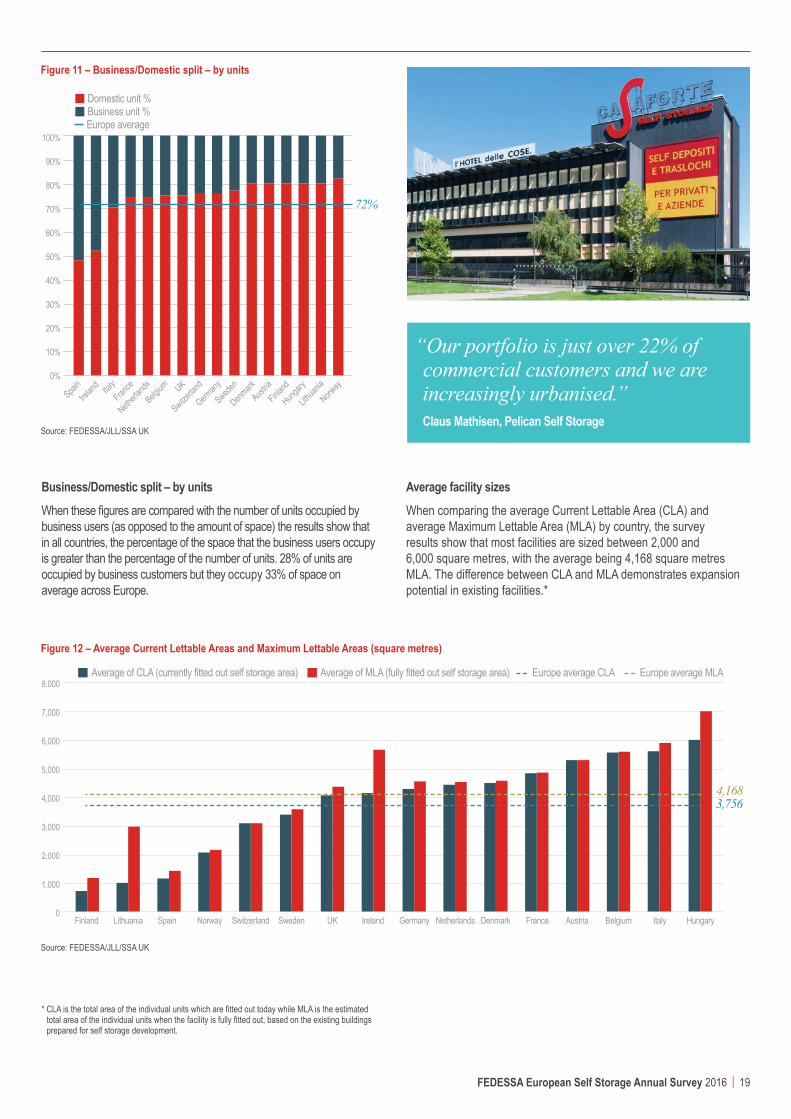
Business/Domestic split – by units When these figures are compared with the number of units occupied by business users (as opposed to the amount of space) the results show that in all countries, the percentage of the space that the business users occupy is greater than the percentage of the number of units. 28% of units are occupied by business customers but they occupy 33% of space on average across Europe.
Average facility sizes When comparing the average Current Lettable Area (CLA) and average Maximum Lettable Area (MLA) by country, the survey results show that most facilities are sized between 2,000 and 6,000 square metres, with the average being 4,168 square metres MLA. The difference between CLA and MLA demonstrates expansion potential in existing facilities.*
* CLA is the total area of the individual units which are fitted out today while MLA is the estimated total area of the individual units when the facility is fully fitted out, based on the existing buildings prepared for self storage development.
100%
90%
80%
70%
60%
50%
40%
30%
20%
10%
0%
Domestic unit %Business unit %Europe average
Finland
Norway
Denmark
Switzerlan
dFran
ce
Lithuan
iaUKAust
ria
Germany
Belgium
Netherla
nds
Sweden
Italy
IrelandSpai
n
72%
Hungary
Figure 11 – Business/Domestic split – by units
Source: FEDESSA/JLL/SSA UK
Figure 12 – Average Current Lettable Areas and Maximum Lettable Areas (square metres)
8,000
7,000
6,000
5,000
4,000
3,000
2,000
1,000
0UK ItalyIrelandFinland AustriaNorwaySpain GermanySwitzerland Netherlands Denmark Belgium HungaryLithuania Sweden France
3,7564,168
Average of CLA (currently fitted out self storage area) Average of MLA (fully fitted out self storage area) Europe average CLA Europe average MLA
Source: FEDESSA/JLL/SSA UK

20 | FEDESSA European Self Storage Annual Survey 2016
Survey results
Source of enquiriesThe survey results this year show that websites and the internet again account for the majority of enquiries, with 58% of enquiries across Europe (excluding the UK) in March 2016 generated online.
As awareness increases about the sector, we are seeing a growth in the number of enquiries from referrals and other sources (which could include telephone, advertising and mobile apps) and a decline in enquiries from directories. As noted in last year’s survey, it is not usually known if enquiries are generated as a result of first having seen a store with prominent signage. However, the importance of awareness and the impact of the internet were a consistent theme that emerged from our operator interviews.
“Internet enquiries are booming – in the last 12 months we have at least doubled the number of enquiries.” Cesare Carcano, Casaforte
Website
58%Referrals
16%
Other
9%Directories
5%
Signage
12%

FEDESSA European Self Storage Annual Survey 2016 | 21
“Transparency on pricing is good for customers and we have a full time pricing manager.” Claus Mathisen, Pelican Self Storage
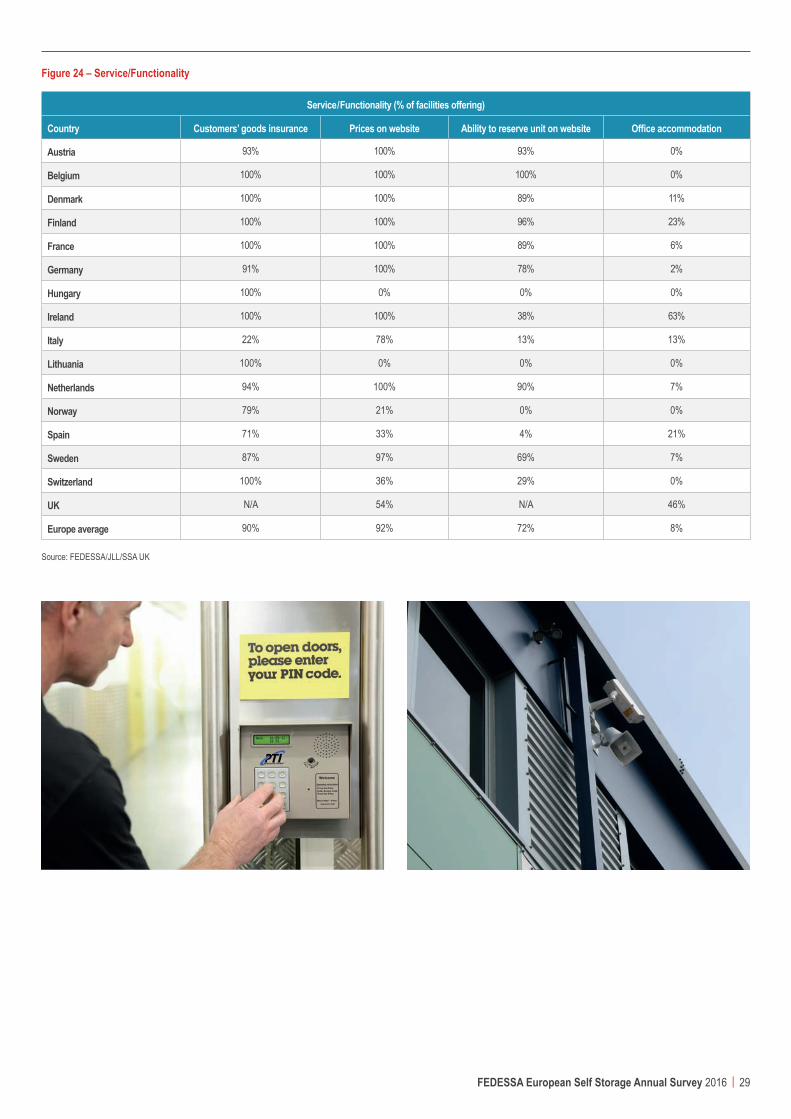
Tenure The self storage business model has a range of tenures, from those which are owner occupied freehold businesses, to management contracts, where no ownership of the underlying real estate exists. In the survey the tenure type varies by country; ranging between Norway and Lithuania where all of those in the survey were held leasehold; to Hungary, France, Austria, Italy, Belgium and Germany where more than 80% are held freehold. The average freehold ownership across Europe is 74%. Based on discussions at various industry forums and statements by prominent industry participants, a significant majority of investors, operators and funders prefer freehold sites. However, availability of land or capital do not always allow this and the self storage model has proven to work effectively under a leasehold model when established correctly. It will be interesting to see if over time more operators consider leasehold properties to gain access to areas where freehold property is simply not available.
Online pricing The overwhelming majority of operators have their prices online and many operators provide the ability to make reservations on their website in some form.
Operators take a number of different views on the ability to reserve rooms online – some operators still want potential customers to call them or to visit the site so that the benefits of self storage can be better articulated, particularly where a large proportion of their customer base are first time users of self storage. Other operators want to provide full transparency on pricing and to secure sales via their online platforms.
The UK is excluded from the percentage of facilities with reservations via their website as this data was not collected in the SSA UK survey.
Figure 13 – Facilities with prices online and the ability to make reservations via website
0%
10%
20%
30%
40%
50%
60%
70%
80%
90%
100%Prices on website % Ability to reserve unit on website %
Spain
Europe averageIreland
Norway
GermanyUK Italy
Netherlands
Switzerland
DenmarkBelgium
FranceAust
riaFinland
Sweden
Source: FEDESSA/JLL/SSA UK
Figure 14 – Split between tenure
0%
10%
20%
30%
40%
50%
60%
70%
80%
90%
100%Freehold Leasehold Europe freehold average
Spain
Lithuan
iaIrel
andNorw
ay
GermanyUK Ital
ySwede
n
Netherla
nds
Switzerlan
d
Denmark
Belgium
France
Austria
Hungary
Finland
74%
Source: FEDESSA/JLL/SSA UK
22 | FEDESSA European Self Storage Annual Survey 2016
Survey results
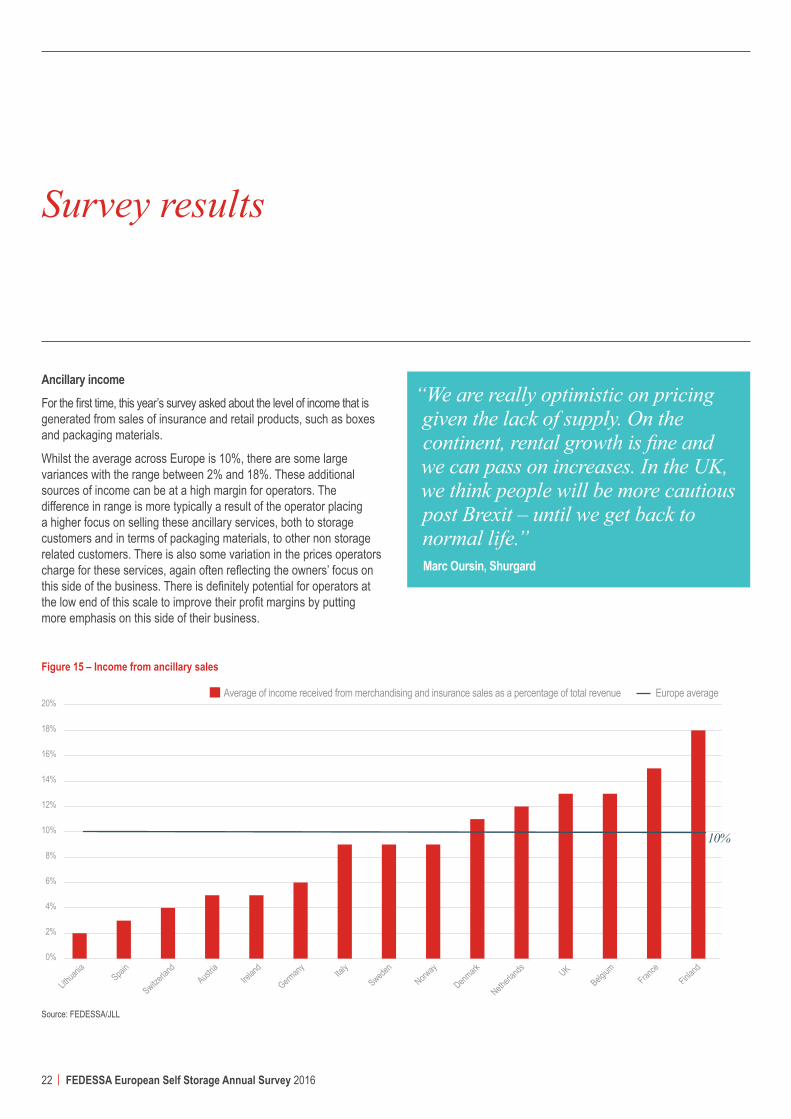
Ancillary income For the first time, this year’s survey asked about the level of income that is generated from sales of insurance and retail products, such as boxes and packaging materials.
Whilst the average across Europe is 10%, there are some large variances with the range between 2% and 18%. These additional sources of income can be at a high margin for operators. The difference in range is more typically a result of the operator placing a higher focus on selling these ancillary services, both to storage customers and in terms of packaging materials, to other non storage related customers. There is also some variation in the prices operators charge for these services, again often reflecting the owners’ focus on this side of the business. There is definitely potential for operators at the low end of this scale to improve their profit margins by putting more emphasis on this side of their business.
0%
2%
4%
6%
8%
10%
12%
14%
16%
18%
20%Europe average Average of income received from merchandising and insurance sales as a percentage of total revenue
Spain
Lithuan
iaFinla
ndIrel
andNorw
ay
Germany UKItal
ySwede
n
Netherla
nds
Switzerlan
d
Denmark
Belgium
France
Austria
10%
Figure 15 – Income from ancillary sales
“We are really optimistic on pricing given the lack of supply. On the continent, rental growth is fine and we can pass on increases. In the UK, we think people will be more cautious post Brexit – until we get back to normal life.” Marc Oursin, Shurgard
Source: FEDESSA/JLL

FEDESSA European Self Storage Annual Survey 2016 | 23
“There is a greater focus on putting prices on websites. I think it will be much more transparent in two years when all prices will be online.” Peter Blauw, LAGERBOX
Outlook
Operators were asked how they viewed the outlook for the self storage market over the next 12 months. Profitability Around 80% of respondents felt that 2016 would be a better year for increasing profitability than 2015, with only 3% believing that conditions would deteriorate. This sentiment has improved from 2015 when 73% felt that the next year would be better. The SSA UK responses have been included but these were provided before the UK EU referendum vote.
Rental growth Operators are much more confident this year about rental growth, with a total of 62% of respondents expecting there to be increases, compared to only 35% in 2015. Just over a third of respondents were expecting rents to remain the same compared to 57% in 2015.
0%
10%
20%
30%
40%
50%
60%
70%2015 2016
Decrease Remain the same Increase less than inflation in your country
Increase greater than inflation in your country
Figure 17 – Rental growth
Figure 16 – Profitability outlook
0%
10%
20%
30%
40%
50%
60%
70%2015 2016
Slightly worse than last year
It will be the same as last year
Slightly better than last year
Much better than last year
Source: FEDESSA/JLL/SSA UK
Source: FEDESSA/JLL/SSA UK
24 | FEDESSA European Self Storage Annual Survey 2016
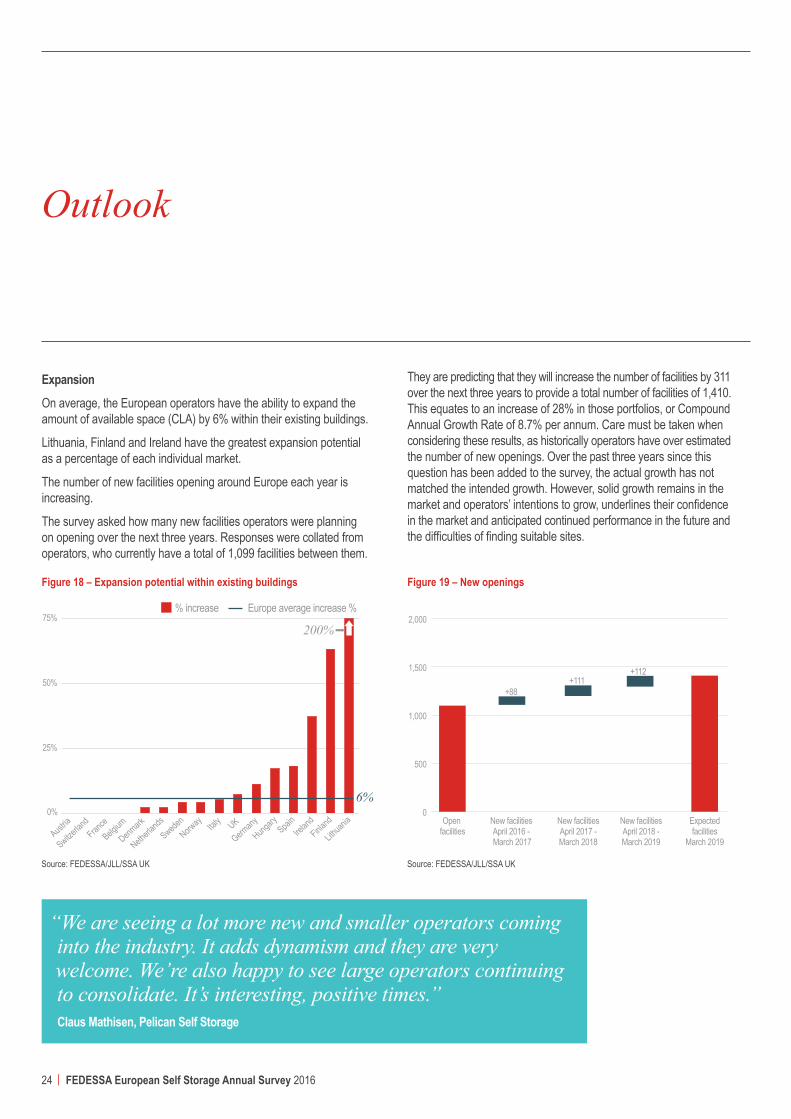
Expansion On average, the European operators have the ability to expand the amount of available space (CLA) by 6% within their existing buildings.
Lithuania, Finland and Ireland have the greatest expansion potential as a percentage of each individual market.
The number of new facilities opening around Europe each year is increasing.
The survey asked how many new facilities operators were planning on opening over the next three years. Responses were collated from operators, who currently have a total of 1,099 facilities between them.
They are predicting that they will increase the number of facilities by 311 over the next three years to provide a total number of facilities of 1,410. This equates to an increase of 28% in those portfolios, or Compound Annual Growth Rate of 8.7% per annum. Care must be taken when considering these results, as historically operators have over estimated the number of new openings. Over the past three years since this question has been added to the survey, the actual growth has not matched the intended growth. However, solid growth remains in the market and operators’ intentions to grow, underlines their confidence in the market and anticipated continued performance in the future and the difficulties of finding suitable sites.
“We are seeing a lot more new and smaller operators coming into the industry. It adds dynamism and they are very welcome. We’re also happy to see large operators continuing to consolidate. It’s interesting, positive times.” Claus Mathisen, Pelican Self Storage
Spain
Lithuan
iaFinla
ndIrel
and
Hungary
Norway
GermanyUKItal
ySwede
n
Netherla
nds
Switzerlan
d
Denmark
Belgium
France
Austria
% increase Europe average increase %
0%
25%
50%
75%
6%
200%
Figure 18 – Expansion potential within existing buildings
Source: FEDESSA/JLL/SSA UK
Open facilities
New facilities April 2016 - March 2017
New facilitiesApril 2017 -March 2018
New facilitiesApril 2018 -March 2019
Expectedfacilities
March 2019
0
500
1,000
1,500
2,000
+88+111
+112
Figure 19 – New openings
Source: FEDESSA/JLL/SSA UK
Outlook

FEDESSA European Self Storage Annual Survey 2016 | 25
Membership of FEDESSAThe following associates are current members of FEDESSA:• Belgian Self Storage Association ASBL• Asociace Self-Storage – The Czech Republic• Self Storage Association Denmark• Pienvarastoyhdistys ry – Finland• CISS – La Chambre Interprofessionnelle du Selfstockage – France• Verband Deutscher Selfstorage Unternehmen e.V. – Germany• Irish Self Storage Association• AIS - Associazione Imprese di Self Storage – Italy• The Netherlands Self-storage Association• Norwegian Self Storage Association• AESS – Asociación Española de Self Storage – Spain• Self Storage Association Sweden• 3SA – Swiss Self-Storage Association• Self Storage Association United Kingdom
MethodologyAn online survey was sent to operators in each country by FEDESSA and JLL. Data was requested at both company and store level to gain as much comprehensive information as possible. Some associations exclude certain operators, for example those who only provide containerised storage.JLL collated the results and conducted operator interviews, with data provided from the following sources:• Economic and real estate overview: Research provided by JLL
research team• Industry overview: Collected by each member association and
consolidated by FEDESSA• Survey results: Collected and consolidated by JLL from online
survey responses of FEDESSA members. Number of sites verified from operator responses and on operator websites
• Outlook: Collected and consolidated by JLL from online survey responses of FEDESSA members
• Reference tables: Industry overview from information consolidated by FEDESSA with survey results collected and consolidated by JLL from online survey responses.
Interviewees• Peter Blauw, LAGERBOX• Cesare Carcano, Casaforte• Claus Mathisen, Pelican Self Storage• Marc Oursin, Shurgard• Guy Pinsent, Less Mess Storage
Additional information

26 | FEDESSA European Self Storage Annual Survey 2016
Reference tables
Figure 20 – Europe supply data
Country Population Estimated number of facilities
Current Lettable Area (square metres)
Floor space per capita (square metres)
Facilities per million population
2015 2016 Chg 2015 2016 Chg 2015 2016 Chg 2015 2016 Chg 2015 2016 Chg
Austria 8,440,000 8,569,633 ▲ 26 30 ▲ 76,000 78,000 ▲ 0.009 0.009 ► 3.1 3.5 ▲
Belgium 11,156,000 11,138,000 ▼ 30 30 ► 130,000 130,000 ► 0.012 0.012 ► 2.7 2.7 ►
Czech Republic 10,466,000 10,554,000 ▲ 3 3 ► 11,000 11,000 ► 0.001 0.001 ► 0.3 0.3 ►
Denmark 5,642,000 5,695,000 ▲ 67 71 ▲ 175,000 176,000 ▲ 0.031 0.031 ► 11.9 12.5 ▲
Estonia 1,306,000 1,306,000 ► 2 2 ► 2,000 2,000 ► 0.002 0.002 ► 1.5 1.5 ►
Finland● 5,428,000 5,534,000 ▲ 79 59 ▼ 130,000 130,000 ► 0.023 0.023 ► 14.6 10.7 ▼
France 66,874,000 64,711,000 ▼ 336 340 ▲ 920,000 930,000 ▲ 0.014 0.014 ► 5.0 5.3 ▲
Germany 79,829,000 81,277,000 ▲ 143 170 ▲ 412,000 463,000 ▲ 0.005 0.006 ▲ 1.8 2.1 ▲
Hungary 9,860,000 9,823,000 ▼ 1 13 ▲ 6,000 35,000 ▲ 0.001 0.004 ▲ 0.1 1.3 ▲
Iceland 328,630 332,000 ▲ 5 6 ▲ 11,000 15,000 ▲ 0.033 0.045 ▲ 15.2 18.1 ▲
Ireland 4,812,000 4,705,000 ▼ 25 25 ► 80,000 80,000 ► 0.017 0.017 ► 5.2 5.3 ▲
Italy 60,437,000 59,860,000 ▼ 46 46 ► 163,000 163,000 ► 0.003 0.003 ► 0.8 0.8 ►
Latvia 1,991,000 1,943,000 ▼ 2 2 ► 5,000 5,000 ► 0.003 0.003 ► 1.0 1.0 ►
Lithuania N/A 2,824,000 N/A 1 N/A 1,500 N/A 0.001 N/A 0.4
Netherlands 16,982,000 16,989,000 ▲ 282 284 ▲ 839,000 849,000 ▲ 0.049 0.050 ▲ 16.6 16.7 ▲
Norway● 5,077,000 5,282,000 ▲ 71 72 ▲ 116,000 84,000 ▼ 0.022 0.016 ▼ 14.0 13.6 ▼
Poland 38,449,000 38,627,000 ▲ 8 10 ▲ 17,500 10,500 ▼ 0.000 0.000 ► 0.2 0.3 ▲
Portugal 10,594,000 10,303,000 ▼ 16 16 ► 49,500 49,500 ► 0.005 0.005 ► 1.5 1.6 ▲
Romania 19,896,000 19,339,000 ▼ 3 1 ▼ 7,500 12,500 ▲ 0.000 0.001 ▲ 0.2 0.1 ▼
Spain 47,727,000 46,041,000 ▼ 263 313 ▲ 520,000 640,000 ▲ 0.011 0.014 ▲ 5.5 6.8 ▲
Sweden● 9,575,000 9,868,000 ▲ 122 128 ▲ 400,000 370,000 ▼ 0.041 0.037 ▼ 12.7 13.0 ▲
Switzerland 8,057,000 8,405,000 ▲ 45 47 ▲ 74,000 48,000 ▼ 0.009 0.006 ▼ 5.6 5.6 ►
UK (incl containers) 64,884,000 65,158,000 ▲ 1,022 1,077 ▲ 3,317,000 3,493,000 ▲ 0.051 0.054 ▲ 15.8 16.5 ▲
Europe in total 487,810,630 488,283,633 ▲ 2,597 2,746 ▲ 7,461,500 7,776,000 ▲ 0.015 0.016 ▲ 5.3 5.6 ▲
US 321,000,000 324,000,000 ▲ 52,500 51,000 ▼ 232,000,000 274,807,000 ▲ 0.723 0.848 ▲ 163.6 157.4 ▼
Australia* 23,850,000 23,850,000 ► 1,300 1,300 ► 4,050,000 4,050,000 ► 0.170 0.170 ► 54.5 54.5 ►
●Reduction in number due to revised definition by country associations. *There has been no updated data on the size of the Australian market published over the last 12 months, so the most recently published data has been used.
Source: FEDESSA
FEDESSA European Self Storage Annual Survey 2016 | 27
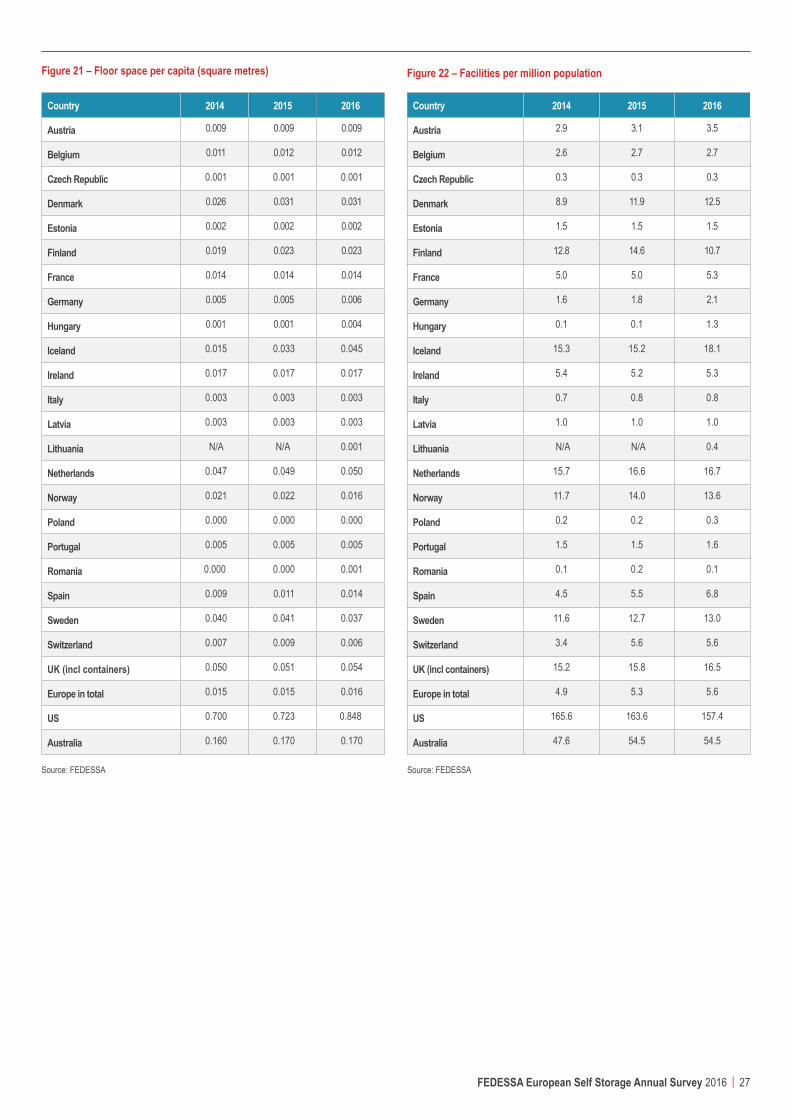
Figure 21 – Floor space per capita (square metres)
Country 2014 2015 2016
Austria 0.009 0.009 0.009
Belgium 0.011 0.012 0.012
Czech Republic 0.001 0.001 0.001
Denmark 0.026 0.031 0.031
Estonia 0.002 0.002 0.002
Finland 0.019 0.023 0.023
France 0.014 0.014 0.014
Germany 0.005 0.005 0.006
Hungary 0.001 0.001 0.004
Iceland 0.015 0.033 0.045
Ireland 0.017 0.017 0.017
Italy 0.003 0.003 0.003
Latvia 0.003 0.003 0.003
Lithuania N/A N/A 0.001
Netherlands 0.047 0.049 0.050
Norway 0.021 0.022 0.016
Poland 0.000 0.000 0.000
Portugal 0.005 0.005 0.005
Romania 0.000 0.000 0.001
Spain 0.009 0.011 0.014
Sweden 0.040 0.041 0.037
Switzerland 0.007 0.009 0.006
UK (incl containers) 0.050 0.051 0.054
Europe in total 0.015 0.015 0.016
US 0.700 0.723 0.848
Australia 0.160 0.170 0.170
Source: FEDESSA
Figure 22 – Facilities per million population
Country 2014 2015 2016
Austria 2.9 3.1 3.5
Belgium 2.6 2.7 2.7
Czech Republic 0.3 0.3 0.3
Denmark 8.9 11.9 12.5
Estonia 1.5 1.5 1.5
Finland 12.8 14.6 10.7
France 5.0 5.0 5.3
Germany 1.6 1.8 2.1
Hungary 0.1 0.1 1.3
Iceland 15.3 15.2 18.1
Ireland 5.4 5.2 5.3
Italy 0.7 0.8 0.8
Latvia 1.0 1.0 1.0
Lithuania N/A N/A 0.4
Netherlands 15.7 16.6 16.7
Norway 11.7 14.0 13.6
Poland 0.2 0.2 0.3
Portugal 1.5 1.5 1.6
Romania 0.1 0.2 0.1
Spain 4.5 5.5 6.8
Sweden 11.6 12.7 13.0
Switzerland 3.4 5.6 5.6
UK (incl containers) 15.2 15.8 16.5
Europe in total 4.9 5.3 5.6
US 165.6 163.6 157.4
Australia 47.6 54.5 54.5
Source: FEDESSA
28 | FEDESSA European Self Storage Annual Survey 2016
Reference tables
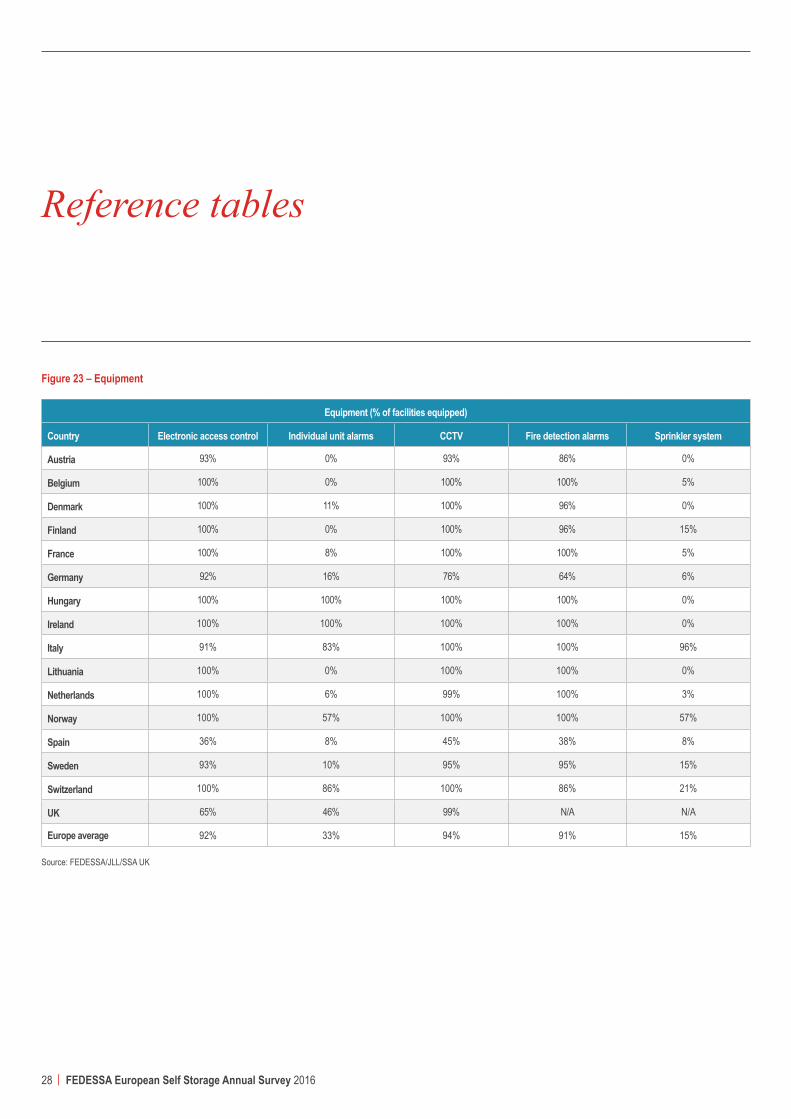
Figure 23 – Equipment
Equipment (% of facilities equipped)
Country Electronic access control Individual unit alarms CCTV Fire detection alarms Sprinkler system
Austria 93% 0% 93% 86% 0%
Belgium 100% 0% 100% 100% 5%
Denmark 100% 11% 100% 96% 0%
Finland 100% 0% 100% 96% 15%
France 100% 8% 100% 100% 5%
Germany 92% 16% 76% 64% 6%
Hungary 100% 100% 100% 100% 0%
Ireland 100% 100% 100% 100% 0%
Italy 91% 83% 100% 100% 96%
Lithuania 100% 0% 100% 100% 0%
Netherlands 100% 6% 99% 100% 3%
Norway 100% 57% 100% 100% 57%
Spain 36% 8% 45% 38% 8%
Sweden 93% 10% 95% 95% 15%
Switzerland 100% 86% 100% 86% 21%
UK 65% 46% 99% N/A N/A
Europe average 92% 33% 94% 91% 15%
Source: FEDESSA/JLL/SSA UK
FEDESSA European Self Storage Annual Survey 2016 | 29
Service/Functionality (% of facilities offering)
Country Customers’ goods insurance Prices on website Ability to reserve unit on website Office accommodation
Austria 93% 100% 93% 0%
Belgium 100% 100% 100% 0%
Denmark 100% 100% 89% 11%
Finland 100% 100% 96% 23%
France 100% 100% 89% 6%
Germany 91% 100% 78% 2%
Hungary 100% 0% 0% 0%
Ireland 100% 100% 38% 63%
Italy 22% 78% 13% 13%
Lithuania 100% 0% 0% 0%
Netherlands 94% 100% 90% 7%
Norway 79% 21% 0% 0%
Spain 71% 33% 4% 21%
Sweden 87% 97% 69% 7%
Switzerland 100% 36% 29% 0%
UK N/A 54% N/A 46%
Europe average 90% 92% 72% 8%
Figure 24 – Service/Functionality
Source: FEDESSA/JLL/SSA UK
30 | FEDESSA European Self Storage Annual Survey 2016
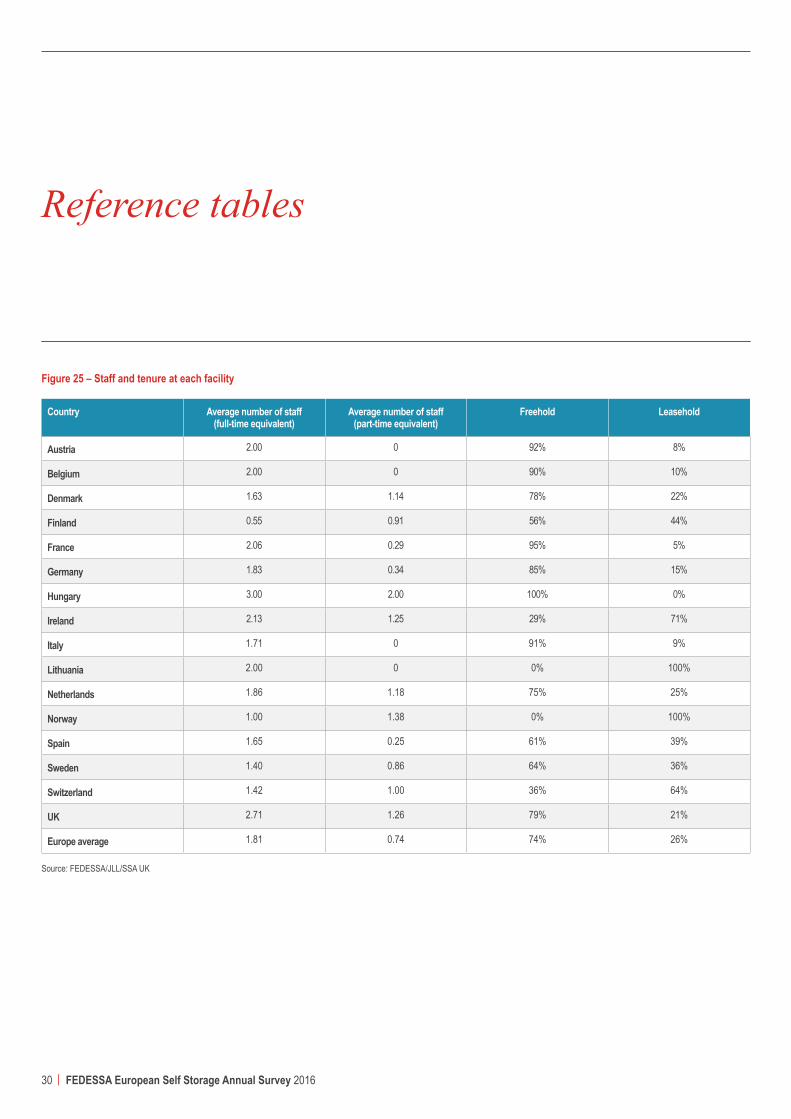
Reference tables
Country Average number of staff (full-time equivalent)
Average number of staff (part-time equivalent)
Freehold Leasehold
Austria 2.00 0 92% 8%
Belgium 2.00 0 90% 10%
Denmark 1.63 1.14 78% 22%
Finland 0.55 0.91 56% 44%
France 2.06 0.29 95% 5%
Germany 1.83 0.34 85% 15%
Hungary 3.00 2.00 100% 0%
Ireland 2.13 1.25 29% 71%
Italy 1.71 0 91% 9%
Lithuania 2.00 0 0% 100%
Netherlands 1.86 1.18 75% 25%
Norway 1.00 1.38 0% 100%
Spain 1.65 0.25 61% 39%
Sweden 1.40 0.86 64% 36%
Switzerland 1.42 1.00 36% 64%
UK 2.71 1.26 79% 21%
Europe average 1.81 0.74 74% 26%
Figure 25 – Staff and tenure at each facility
Source: FEDESSA/JLL/SSA UK

jll.co.uk© 2016 Jones Lang LaSalle IP, Inc. and the Federation of European Self Storage Associations (FEDESSA). All rights reserved. The information contained in this document is proprietary to JLL and FEDESSA. All such documentation and information remains the property of JLL and FEDESSA and shall be kept confidential. Reproduction of any part of this document is authorized only to the extent necessary for its evaluation. It is not to be shown to any third party without the prior written authorization of JLL and FEDESSA. All information contained herein is from sources deemed reliable; however, no representation or warranty is made as to the accuracy thereof.
Contacts
Ollie Saunders Lead Director +44 (0)20 7087 5843 [email protected]
Tom Caines Investment and Development +44 (0)20 7087 5860 [email protected]
Luca Villani JLL Italy +39 0285868651 [email protected]
Joe Guilfoyle Corporate Transactions +44 (0)20 7399 5572 [email protected]
Nick Wride JLL Spain +34 93 445 3368 [email protected]
Daniel Thorpe JLL Alternatives Research +44 (0)20 7087 5765 [email protected]
Paul Ben-Nathan Corporate Transactions +44 (0)20 7087 5332 [email protected]
Kathryn Pitts Valuation +44 (0)20 7087 5989 [email protected]
Frank Rambow JLL Germany +49 211 13006 745 [email protected]
Paul Cooper JLL France +33 1 40 55 17 29 [email protected]
Rennie Schafer Chief Executive Officer +44 (0)1270 623150 [email protected]
Paola Barraza Membership Services Officer +32 460 96 8725 [email protected]
jll.co.uk/selfstorage
fedessa.org