feeding africa’s cities: the case of the supply chain of...
TRANSCRIPT

Feeding Africa’s cities: The case of the Supply Chain of Teff to Addis Ababa
Minten, Bart; Legesse, Ermias Engida; Beyene, Seneshaw Tamru; Werako, Tadesse Kuma
Abstract
Urbanization is quickly increasing in Africa, raising important questions on how food value chains
to cities function and what the implications of urban growth are for the local food trade and farm
sector. We study the rural–urban value chain of teff in Ethiopia, by value its most important staple
value chain. Relying on unique large-scale surveys at different levels in this value chain, we find—
in contrast to conventional wisdom—that value chains are relatively short and that average farmers
obtain a high share, of about 80 percent, of the final consumer price in the major terminal market,
Addis Ababa. We further find that producer prices decline in line with transportation costs the
further farmers live from the city, that seasonal price movements are rather small, and that average
stock release by farmers is smooth over the year.
Keywords: agricultural transformation, teff, value chains, Ethiopia
“…Africa could produce enough food to feed itself; alas, too few subsistence farmers get a chance to sell their produce (and usually get less than 20 percent of the market price).”
The Economist, March 2nd- March 8th, 2013, p.9, in Leaders, “Aspiring Africa”. 1. Introduction The importance of cities is rapidly growing. It is estimated that more than half of the world
population was living in cities in 2010, up from 30 percent in the 1950s. Urbanization is rapidly
increasing in Africa as well: the urbanization rate is projected to be as high as 60 percent by 2050
(UN Population Division 2010) and there are increasing concerns by local policy makers on the
increasing dependence of African cities on imported foods.1 This dependency on imports is often
blamed on uncompetitive local value chains (e.g. Rakotoarisoa, Iafrata, and Paschali 2011).
However, few studies have looked in a scientific way at the functioning of domestic food value
chains in developing countries, and especially so in Africa. This lack of research leads to a
debate that might not be well informed.
Based on an innovative survey design involving detailed primary surveys at different levels in
the value chain from major production areas to a major urban center, we analyze in this paper the
value chain structure, price formation, and marketing behavior in rural–urban staple food value
chains in Ethiopia. In particular, we study teff being marketed from the most important
production zones (representing 42 percent of the commercial surplus nationally and more than
90 percent of the supply to Addis Ababa) to the biggest city in the country, Addis Ababa,
estimated officially to be home to 4 million people but likely much larger, and therefore among
the bigger cities in Africa. We find that rural–urban value chains are relatively short. Consistent
with this structure, we find that margins in these major commercial domestic staple value chains
are surprisingly small and that the average share of the final retail price that the producer
receives reaches about 80 percent. We further find that producer prices over space decline in line
with transportation costs, releases by the producer of teff stocks in storage over the year is rather
smooth, and distress sales are of minor importance.
1 Christiaensen and Devarajan (2013) find that since the mid-2000s, Africa converted from a net exporter of agricultural products to a net importer. Much of the growth in imports concerns staples for the rapidly expanding urban populations. They state that “except for wheat, which is a temperate-zone crop, these are all products in which Africa enjoys a comparative advantage” (Christiaensen and Devarajan 2013, 185).

Our findings are in contrast with a number of common perceptions on food value chains in
developing countries. First, as shown in the quote above, it is often assumed that farmers only
obtain a small share of the final retail prices.2 However, few systematic recent reviews based on
representative surveys have been done on this issue.3 Second, another perception is that food
value chains are characterized by many layers of traders between producers and consumers,
leading to inefficiency (e.g. Masters 2008; World Bank, 2009). For example, the World Bank in
its flagship report on agriculture states that “in agriculture-based and transforming countries …
layers of intermediaries are common in the marketing of food staples and other agricultural
commodities” (World Bank 2008, 119).4 Third, smallholder farmers are often perceived to be
driven to distress sales just after harvest when prices are low (e.g. Grootaert, Oh, and Swamy
2002; Poulton et al. 2006; Jayne et al. 2010).
There are, however, a number of problems with the evidence base on the functioning of these
staple food markets. First, the common practice in food value chain analysis is that often only
uses anecdotal or qualitative evidence and it does not rely on reliable and representative surveys
(e.g. Webber and Labaste 2009; Nang’ole, Mithöfer, and Franzel 2011; World Bank 2009).
Moreover, there is often a lack of reliable data at a larger scale in Africa (Jerven 2013) making it
difficult to make credible inferences on the state of agricultural marketing. Second, in the case
that studies were fielded, they typically focus on randomly selected farmers, with the
disadvantage that the selected farmers might be of relative less importance in major food supply
areas and might thus not present a representative picture of the farmers that effectively
participate in value chains of specific food crops (World Bank 2009).
2 While producer shares are an imperfect indicator of marketing performance – e.g. Tomek and Robinson (1972, p.115) caution that “there is a tendency to use the number to indicate the ‘well-being’ of farmers or to indicate that marketing costs are ‘too high’. In fact the farmer’s share statistic has little to say about either problem” - , we will use it in some of our analysis given that it is commonly used in the debate.
3 Ahmed and Rustagi (1987) compared producer shares in final retail prices in Asia and Africa in the 80s. They show that producer shares in final consumer prices were as high as 75 to 90 percent in Asia but as low as 35 to 60 percent in Africa. Gollin and Rogerson (2010) find in Uganda that farmgate prices for cassava and maize are often significantly less than half of wholesale prices, across many crops and regions. The World Bank (2008) estimates the share that farmers receive of the final retail price of maize in Ghana at 56 percent. 4 Mattoo, Mishra, and Narain (2007) and Landes and Burfisher (2009) argue that in the case of India most agricultural trade is mediated by a large number of intermediaries which not only inflate prices but this system also takes time to move products from farmers to consumers, leading to large transit costs. Trienekens (2011) argues that local value chains in developing countries are long, in contrast with modern supermarket channels and export markets. Staple cereal chains are often found to be long and complex in Africa, as documented in Ghana (World Bank 2008) and Ethiopia (Rashid and Negassa 2011; Rashid and Minot 2010).

The impact of these common perceptions is not to be underestimated as government and other
stakeholders often intervene in these markets assuming that they are not working well. Some
examples illustrate this. First, cooperative marketing is often promoted on the assumption that it
increases bargaining power of farmers, solves some of the economies of scale issues that farmers
face in the market, and thereby will improve the prices smallholders receive for their produce
(Bernard et al. 2010; CTA 2012; DFID 2004). Second, modern commodity exchanges are
increasingly been established in Africa to improve objective grading, transparency, as well as
competition in agricultural markets (Gabre-Madhin 2012). Third, credit schemes (e.g. warehouse
receipt systems or communal storage schemes) are being promoted to reduce the impact of
distress sales (World Bank 2012; DFID 2004). In such schemes, farmers use their unsold
produce as collateral to obtain credit to meet immediate expenditures, enabling them to hold onto
their produce to sell later in off-season when they will benefit from higher prices.
The findings from our research point to some important policy implications. First, given the lack
of good data on food value chains and the often fast changes that are happening in such value
chains globally (e.g. Reardon et al. 2012), more effort in the collection of reliable updated
primary data is required. Such data might better inform the policy debate on the extent of
different constraints in the functioning of these food value chains and on ways that policies can
address them. Second, policies aimed at improving market efficiencies—such as stimulating
increasing involvement of cooperatives in output marketing (CTA 2012), the establishment of
modern exchanges (Francesconi and Heerink 2010; Gabre-Madhin 2012), or warehouse receipt
systems (World Bank 2009, 2012)—should be carefully assessed as to where exactly these
policies are expected to improve market functioning, especially of staples, and what the expected
benefits would be compared to the costs. 2. Background and Data
Teff (Eragrostis tef) is a major staple food crop in Ethiopia, as measured by a number of
indicators. In 2011/12, it was estimated that teff made up 20 percent of all the cultivated area in
Ethiopia, covering about 2.7 million hectares and grown by 6.3 million farmers (CSA 2012).
Compared to other cereals, teff is considered a lower risk crop as it can withstand adverse
weather conditions and it can be stored for longer period without major impacts (Fufa et al.

2011). Teff is also valued for its fine straw, which is used for animal feed as well as mixed with
mud for building purposes.
On the consumption side, teff’s grain is mainly used for making enjera, a spongy flatbread, the
main national dish in Ethiopia (as well as Eritrea). Teff is more readily eaten by urban than by
rural households. Berhane, Paulos, and Tafere (2011) show, relying on national household
consumption data, that urban consumption per capita is as high as 61 kg per year. This compares
to 20 kg per capita per year for rural areas. They further illustrate the high income elasticity for
teff, evaluated at 1.10 in urban areas and 1.20 in rural areas. Teff is therefore an economically
superior good that is relatively more consumed by the rich than by the poor. The lower
consumption by the poor is also partly explained by the high prices of teff which are typically
twice as high as the cheapest cereal, i.e. maize (Minten et al. 2014).
An important factor in any food market is quality. The most widespread distinction used in the
teff value chain relates to the color of the grain. The distinction between magna (“superwhite”),
white, mixed, and red teff is widely used and well known by farmers as well as traders, and we
will therefore use it as a measure for quality throughout this paper. Teff quality is often evaluated
by origin as well and while the quality of teff is also judged by a number of other factors, such as
aroma, texture, and nutritional quality, these are often difficult to measure objectively.
The purpose of the study is to understand how the rural–urban teff value chain functions. We
rely on data from major teff producing areas and follow the value chain from there to Addis
Ababa, the capital of Ethiopia. To get at this information, two types of activities were organized.
Interviews were conducted with key informants in the value chain in September and October
2012. That information was used to design questionnaires for each level in the value chain.
These questionnaires were then fielded at the end of 2012. The implemented instruments
included surveys upstream in the value chain with teff producers and communities, midstream
with rural and urban wholesalers and truckers, and downstream with cereal shops, mills, and
cooperative retail. 1,800 primary survey interviews were conducted in total.
Upstream in the value chain, we selected 1,200 teff farmers. The selection of these farmers
involved several steps. First, the five zones with the highest commercial surplus of teff in the
country were chosen. In 2011/12, these five zones combined represented 38 percent and
42 percent of the national teff area and commercial surplus, respectively. Second, within each

production zone, the woredas were ranked from smallest to largest producer (in terms of area
cultivated). We then divided the woredas in two, the less productive (cultivating all together 50
percent of the area) and the more productive woredas (cultivating all together 50 percent of
the area). Two woredas were randomly selected from each group. Third, a list of all the kebeles
of the selected woredas was obtained. Two kebeles were randomly chosen from the top 50
percent producing kebeles and one from the low 50 percent producing kebeles. Fourth, a list of
all teff producers in the preceding season in the selected kebeles was then made. They were
ranked from small to large teff producers (based on areas cultivated). We then divided the
farmers in two groups, the small production (cultivating all together 50 percent of the area) and
the large production farmers (cultivating all together 50 percent of the area). Twenty farmers
were then selected: 10 from the small production and 10 from the large production farmers. In
total, 240 farmers were interviewed per zone.5 Data on teff areas at the woreda and kebele level
were collected from relevant representatives from the Ministry of Agriculture.
Midstream, the following strategy was followed. First, 40 rural wholesalers were interviewed in
each rural zone. For each woreda, the major trading town or temporary wholesale market used
by farmers in that woreda was selected. A census of all traders in that market/town was then
made. As the focus of the study was to understand the value chain from rural areas to Addis
Ababa, ten traders that ship teff to Addis Ababa were then randomly selected from this list in
these towns/markets. Four such towns/markets were selected for each zone. Second, in Addis
Ababa, 75 wholesale traders and brokers were interviewed in total. One-third was interviewed in
the Ehil Beranda wholesale market and two-thirds in the Ashwa Meda market, reflecting the
relative shares of teff wholesale marketing for Addis Ababa that each market handles. Twenty-
five wholesalers were randomly selected in Ehil Beranda (13 without and 12 with shops) and 50
(25 with and 25 without shops) in Ashwa Meda. Ninety truck drivers transporting teff were also
interviewed (one-third in Ehil Beranda and two-thirds in Ashwa Meda).
5 To understand to what extent the farmers that were surveyed are different compared to other farmers, we run first a probit comparing other farmers to teff farmers and then comparing teff famers from our survey to all teff farmers in the same surveyed zones. For this exercise, we used the Ethiopian Rural Socio-economic Survey (ERSS), representative at the national level, and fielded with 4,000 households in 2011/2012 in rural areas and small towns across Ethiopia. The right-hand variables in the probit are age, gender, marital status, and religion of the head of household, size of household, distance to an all-weather road, land owned, and zonal dummies. First, we find that teff farmers own significantly more land than other farmers. Teff farmers are also characterized by significantly larger households as well as a higher percentage of male-headed households. This might be related to the high labor requirements for teff production. Second, when comparing the teff farmers from our survey with those from the ERSS in the same zones, we find no significant differences on relevant variables.

Downstream, we relied on a stratified sampling scheme to select a representative sample of teff
retail shops in Addis Ababa. Based on the map of the city, we created five geographical strata
with two neighboring similar sub-cities in each stratum. We then randomly selected one sub-city
from each stratum, giving us in total five sub-cities to work with. Next, we collected information
from the city’s Trade and Industry Office, which provided us the complete lists of teff outlets in
each sub-city. We then randomly selected outlets to be interviewed. First, all the consumer
cooperatives selling teff were surveyed at the sub-city level. Second, in each selected sub-city,
four kebeles were selected randomly. In each selected kebele, all the flour mills were surveyed
and five cereal shops were randomly selected and surveyed. In total, 282 retail outlets were
interviewed.
Table 2.1 gives an overview of the sample and some basic characteristics of the different value
chain agents. The teff value chain is dominated by men. Fifteen percent of the retail outlets are
managed by women but their contribution to other functions in the value chain midstream is
limited. Ninety-five percent of the rural wholesalers and all the truck drivers and urban
wholesalers are men. Female-headed teff farming households make up 5 percent of our sample.
The level of education is slightly higher for value chain agents midstream, with average years of
education between 8 and 9 years. It is lowest for the farmers at 5 years. The average years of
experience in the teff business is around 8 and 10 years for all agents while truck drivers have an
average experience of 6.5 years.
Table 2.1—Sample set-up and basic descriptive 3. Description of the teff Value Chain
3.1. Marketing Upstream
Table 3.1 presents some basic descriptives of teff marketing upstream, i.e. by farmers. An
average teff producer sold 507 kg in the year prior to the survey. The majority of this teff sold
was white, making up two-thirds of all teff sold, while the quantities of mixed and red teff sold
are rather small. We find that 36 percent of all the produced teff is sold but that there are large
differences between different qualities. While 58 percent of the production of magna
(“superwhite”) teff is sold, this is as low as 13 percent for red teff.

The number of marketing transactions by these farmers is rather limited. The median is 1 and the
average is 1.75. Farmers were asked for each marketing transaction to give details on the
specifics of that transaction. The majority of the sales are to traders at local wholesale markets or
to traders with a fixed shop, often in regional markets. Farmers traveled on average 1.5 hours to
get to the place of sales and on-farm sales or sales in the village are therefore relatively less
important, in contrast with other countries in Africa (Chamberlin and Jayne 2013). Direct sales to
consumers make up 7 percent of all transactions. Sales to cooperatives or government institutions
(such as the Ethiopian Grain Trade Enterprise) are rather limited: they make up less than
1 percent of the sales transactions. While cooperatives are very important in input distribution in
Ethiopia, they are not a significant participant in cereal output markets (see also Minten et al.
2014).
An average sales transaction concerns 300 kg of teff for a value of 3,776 Birr (or about 200
USD). In 84 percent of the sales transactions, this was handled by a male member of the
household. Inter-linked transactions with traders are of very little importance upstream. Ninety-
nine percent of the transactions were paid immediately and in cash. In only 2 percent of the
transactions did the farmer receive input advances from the buyer. This low level of advances
and tied credit in staple food markets has also been found elsewhere (Reardon et al. 2012).
Distress sales, usually immediately after harvest, are presumed to be important in this type of
agricultural markets (Fufa et al. 2011; Grootaert, Oh, and Swamy 2002; Poulton et al. 2006).6
We use two indicators as a measure of distress in teff marketing. For each sale transaction,
farmers were asked to indicate if they would have sold teff at that time if the price of teff would
have been 10 percent lower. If they said yes, a follow-up question was asked if they would have
sold at a price that would have been 50 percent lower. While the positive answers to these
questions can be used as measures of distress sales, we recognize that these indicators are crude,
given their hypothetical nature as well as their retrospectiveness, and should therefore be used
with caution. Using these indicators, it is estimated that 19 percent of the transactions were sold
in distress and 10 percent in extreme distress (Table 3.1). In contrast, in 71 percent of the
6 “… [teff] farmers usually sell their produce immediately after harvest, resulting in high supply in those seasons,
thereby leading to lower farm gate prices. In almost all cases of the focus group discussions conducted, the study noted that the immediate selling behavior of farmers is the result of their immediate liquidity requirements.” (Fufa et al. 2011, 26)

transactions, farmers would not have accepted at the time of sales a lower price of that order of
magnitude.
Table 3.1—Characteristics of marketing transactions by teff farmers 3.2. Marketing Midstream and Downstream
Table 3.2 presents marketing descriptives of value chain agents midstream and downstream.
Their yearly teff turnover varies between 36 ton for urban retailers to almost 700 ton for urban
wholesalers and brokers. Few of the traders report to be involved in long-time storage. The
traders were asked details on the different types of services that are provided to suppliers and
clients. The data indicate seemingly important transaction costs between different layers of the
value chain, especially related to correctly assessing quantity and quality. Weighing happens at
every level, at the time of purchase as well as sales. Quality assessments are also done for each
transaction. This is usually done through visual checks or by rubbing the teff. Some of the agents
report to even chew the teff to determine its quality (47 percent, 28 percent, and 20 percent of the
urban traders/brokers, rural traders, and retailers respectively).
Family, kin, and ethnic relationship are often presumed to be important in agricultural trade
(Gabre-Madhin 2001; Fafchamps and Minten 1999). Table 3.2 shows that urban brokers/traders
work with a rather limited number of suppliers—seven on average over a 12 month period—and
that they procure almost two-thirds of their supplies from the zones that they are originally from.
This suggests tight, often family, networks at that level. The fact that traders purchase mostly
from home networks might suggest information asymmetries that might create costly market
frictions for those outside this network (e.g. Hoffman and Gatobu 2014). On the other hand, only
7 percent of the retailers work with suppliers that are originally from the same zones as theirs.
Questions were further asked on the importance of credit and advances. In contrast with the farm
level, credit is more prevalent in the value chain midstream and downstream, often explaining
the prevalence of these kin relationships in business (McMillan and Woodruff 1999). While few
of the rural traders pay their suppliers on credit, this is much more important for urban
wholesalers (60 percent) and urban retailers (45 percent). However, the credit is mostly of short
duration. The average duration varies between 7 and 17 days. The share of traders that are paid
on credit by clients is high as well. Advances are sometimes given to ensure supplies—

20 percent of the urban retailers reported giving advances. However, no urban traders reported
providing advances.
Table 3.2—Descriptive of marketing agents 4. Structure and Price Formation
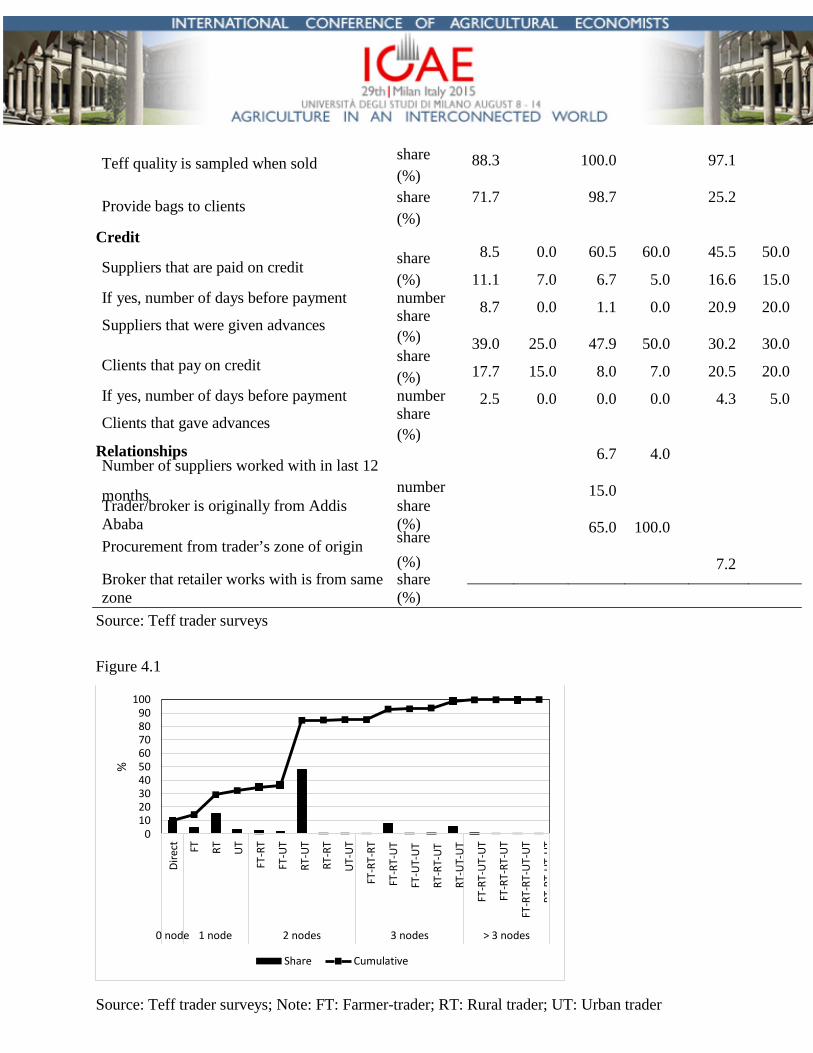
4.1. Structure of the Value Chain
To get at the structure of the teff value chain, rural and urban wholesalers and urban retailers
were asked from whom they obtained supplies (and to whom they sold). The importance of each
type of seller in total supplies was asked for each three-month period over the 15 months prior to
the survey. This procurement information at each level allows us to deduct the prevalence of
different value chain structures. We identify three main players in these value chains, i.e. the
farmer-trader (FT) or rural assembler who operates in the village, the rural trader (RT) who
operates on rural markets or in regional towns, and the urban trader (UT) or broker who operates
on urban markets. We categorize the different value chains by the number of nodes between the
urban retailer and the teff farmer.7 Based on procurement responses of the different value chain
agents, there are 18 possible chains from farmer to retailer, ranging from 0 nodes where retailers
buy directly from farmers to 5 nodes (FT-RT-RT-UT-UT). For example, the FT-RT-UT supply
chain represents a chain with 3 nodes where teff is sold to a farmer-trader (FT), who sells to a
rural trader (RT), who then sells to an urban trader (UT).
Figure 4.1—Prevalence of different value chain structures between urban teff retailers and
farmers
Figure 4.1 shows the surprisingly short supply chain that is commonly in place to ship teff to
Addis Ababa. The cumulative line in the Figure illustrates that there are 0, 1, 2, 3, or more than 3
nodes in the teff value chain for 9.8%, 22.4%, 52.8%, 13.9%, and 1.0% of the teff sold by urban
7 To be able to make these calculations, some assumptions were made. First, simple averages over traders were calculated. No large differences were noted when weighted averages were used. Second, small alternative channels (such as cooperatives) were added to the rural traders’ category. Third, some traders reported to purchase from other traders at the same level (1.3% of the rural traders; 9.8% of the urban traders/brokers). This was taken into account in the first stage and other sources of procurement were set proportionally in the second stage of procurement as in the first stage except for the trader of the same level, which was set to 0%. This assumption was needed to avoid indefinite loops; it however affected less than 0.5% of the supply chain allocation.

retailers.8 In 85% of the cases, there are 2 trade nodes or less between retailers and farmers. The
results are largely consistent if we triangulate the sales and procurement patterns at different
levels. The most prevalent structure of the value chain from these major production zones to the
urban city is from producer to regional trader to urban trader/broker to urban retailer (used in
48% of the teff supplies to Addis). In 28% of cases, urban retailers obtain their products directly
in rural areas (bypassing the urban wholesale markets), making the value chain shorter. On the
other hand, the value chain can also be longer, as rural traders procure 13 percent of their
produce from rural assemblers or farmer-traders and 10 percent of the urban wholesalers/brokers
obtain produce from other urban wholesalers/brokers.9 However, in the most common case, there
are three intermediaries found between farmers and urban consumers. The finding of such a
structure is against conventional wisdom.10
4.2. Price Formation in the Chain
Prices were carefully collected at each stage of the value chain for each quality at the time of the
survey. Information on the origin of the teff (i.e. the woreda) was asked as well as that is also
often seen as an important determinant of quality, though difficult to verify objectively. Prices
were asked from farmers at the time of the survey for their most common place of sale. While
they might not have sold teff recently, farmers are often very well aware of current prices for the
major crops that they grow. The advantage of this method is that there are fewer problems with
recall. For traders, prices were asked for all qualities that they were selling that day or week.
One issue with the price comparisons throughout the chain is that the surveys were fielded at
different periods. The rural surveys were fielded in November 2012 while the urban surveys
were fielded in December 2012. To address this problem, a wholesale market price survey was
8 Note that eighty-six percent of what these retail shops sell is sold directly to consumers. The rest of the buyers are mostly enjera sellers and restaurants. 9 Ninety-two percent of all the teff sales by the interviewed urban wholesale traders was destined to Addis Ababa. While Addis Ababa was seen in the past as a clearing house for national cereal trade, i.e. the national cereal trade went through Addis Ababa as all major traders were stationed there (Gabre-Madhin 2001), this is seemingly less the case now than before. The larger agricultural marketing flows in the country, as well as improved communications, might have contributed to that change (Minten et al. 2014). Urban traders were also asked to indicate from which zone they procured teff. The five production zones where the producer surveys were fielded make up for 91 percent of all the teff coming to Addis Ababa. In our survey set-up, we thus captured well the major suppliers to Addis Ababa as well as end-users, rarely the case in surveys of food value chains.
10 Fufa et al. state “The teff value chain is fragmented and involves many players. Most farmers sell to assemblers individually, who then sell on to traders and wholesalers. Most teff is sold at harvest when prices are low.” (2011, 2)

h
conducted where prices for different teff qualities and origins were carefully and consistently
collected on a daily basis with a large number of traders in three urban wholesale markets during
each of the periods. This information allows for an adjustment in price levels between periods
and for a consistent comparison over the value chain. To do so, wholesale prices were regressed
on weekly dummies and all prices were adjusted, depending on the week that prices were
collected, by the coefficient from this regression, assuming that absolute margins stayed similar
between these periods. Prices are consequently expressed in reference to wholesale prices of the
first week of November (last week of Tikimt).
Using these prices, we run a regression of the following form where the price of teff is a function
of the characteristics of the product, for example, through variety choices or through embedded
services or locational characteristics. A simple model of the following form can then be run:
N
ph = ∑ βkh k =0
X k +ν
where ph is the price of the product h, Xkh is the quantity of the attribute k of the product h, βkh the
implicit price, and ν a stochastic error term.11 The results are reported in Table 4.1.
In a first specification, the price of teff is regressed on different “pooled” (i.e. prices from
different surveys) value chain level (farm gate, rural market, urban wholesale market, with urban
retail markets as the default) and quality dummies. The results show the consistency in price
composition, with farmgate prices lower than rural market prices, rural market prices
significantly below urban wholesale prices, and urban retail prices higher than wholesale prices.
The results also show the significant quality premiums that are attached to different teff qualities,
with the best quality (magna teff) being valued with an average premium of 419 Birr per quintal
over the worst quality (red teff), representing a 25% higher price at the retail level. The
coefficients from this specification illustrate that the share of the farmgate in final retail prices of
teff are a high 78 percent to 84 percent, depending on the quality. When farmers sell on rural
markets, where most of the farmer sales happen, shares are even higher. Half of the margin
between farm gate and retailers consists of the margin between the village and urban wholesale
markets. The urban distribution margin makes up for the rest.
11 As the purpose of the exercise is to understand price formation in the value chains from rural areas to Addis,
we only include these producer prices where commercial surplus sold to Addis in the village as a whole was reported.

We further note strong price heterogeneity within a “level”. For the producers, we note
significantly different prices between farmgate and market prices. We also note significantly (as
shown by an F-test) lower prices on rural markets for those reported by farmers compared to
prices of traders that ship teff to Addis, as shown in specification 2. This is partly explained by
the fact that most of the traders that ship to Addis are located closer to Addis than average
farmers in our dataset. This is confirmed by the fact that when an interaction of reported rural
market prices by farmers with a closeness to Addis dummy (along the median of the reported
distance by farmers in our dataset) is included in the regression and when we test for differences
between this interaction term and reported procurement prices on rural markets by traders, no
significant differences are found (specification 3).
Table 4.1— Price regressions over the rural-urban teff value chain (price at time of survey; Birr/quintal)
On urban wholesale markets, a significant difference is found in the price that is reported by
rural traders that sell there (the “procurement” price) and reported sales prices by brokers and
urban traders on these markets. That difference is relative large (28 Birr/quintal) and significant
as indicated by an F-test. The difference between these prices can partly be explained by
transaction costs such as broker fees (an average of 6.5 Birr/quintal in our dataset) and loading
and unloading costs (on average 2.8 and 3.1 Birr/quintal respectively; this is however only done
if the buyer is located on the urban wholesale market). There is also the possibility of rents which
are seemingly important in this specification. When we include woreda dummies as additional
controls for quality, this difference disappears however and the finding of significant rents on
these urban wholesale markets is not robust. Finally, we split the urban retail prices in three
levels, those reported by mills (the default), by consumer cooperatives, and by cereal shops.
While cooperatives have a negative coefficients indicating cheaper prices, these are however not
significant at conventional statistical levels.
As we collected information on prices over time, over space, as well as in quantities sold by
different farmers, this allows us to calculate the average producer share in the Addis Ababa retail
price over the year of the survey. This is in contrast with the analysis presented above where we
only used prices at the time of the survey. For this exercise, we use as the retail prices the

average price reported by the retailers for every two months for the four qualities over the 12
months prior to the survey. The producer prices are then divided by retail prices for the same
period and for the same quality. For the calculation of prices, we weigh them by the quantity sold
by particular producer as to represent the commercial value chain. Using this method, the
average share of the producer in the final retail price in Addis Ababa—reflecting the share of the
consumer price that went to the producer for the 12 months prior to the survey—is estimated to
be as high as 79.4 percent. The median is evaluated at 79.2 percent. This calculation with
different price collection methods thus confirms the order of magnitude that was found with the
previous method.
Detailed data were further collected on teff production costs at the farm level. This allows us to
calculate profits at that level. We find that despite the high shares of producers in final retail
prices and the high absolute profits compared to the costs, farmers do seemingly not make very
high profits per unit of time from the production of teff. It is estimated that monetary input costs
make up 23% of the total value of output (Table 4.2). However, teff is a labor-intensive crop and
little labor-saving mechanization is currently used. About 141 person-days are needed on
average per hectare per production cycle, i.e. for preparation of the field until final harvesting
and threshing. When average and median rewards per person-day are calculated, this amounts to
39 Birr/day and 23 Birr/day respectively (or 2.25 and 1.33 USD/day), barely above the
international poverty lines that are commonly used (1.25 USD/day).12
While we lack good cost data at the trader level, we however have access to accurate transport
costs. Transport costs make up 42 Birr/quintal on average or almost 69% of the price difference
between rural and urban wholesale prices (taking as a reference specification 2), and only 3% of
the final retail price (in the case of the most commonly traded white teff). The rest is rewards to
traders’ inputs, including search, personal travel, storage, licenses, bagging, weighing, quality
and quantity assessments, and risk taking. Unfortunately, we lack accurate data to calculate
rewards to these individual activities.
Table 4.2— Variable production costs and profits for teff farmers
12 Evaluated with the exchange rate at time of production, i.e. the end of the year 2011.

The average price composition picture is for the first week of November when overall prices are
relatively high (as it is just before the new harvest). Producer shares will come down when prices
are relatively low after the harvest period. Farmers that are further out obtain a lower share as
well. The issues with temporal and spatial variation are discussed in more depth below, in
sections 5 and 6 respectively. 5. Temporal Variation
Seasonality is important in most agricultural markets but especially in Ethiopia because of a
short rainfall season, limited irrigation possibilities, and therefore often the reliance on one crop
a year (Dercon and Krishnan 2000; Devereux, Sabates-Wheeler, and Langhurst 2012).13 We look
in this section at seasonality in price behavior, in storage, and in use of production, including
sales. As for most agricultural crops in Ethiopia, teff production is characterized by significant
seasonality. Crops are mostly planted in July and August while the major harvest periods is
situated in the months of November and December.
Data were collected at the farm level on monthly storage, sales, and consumption of teff.
Households were asked to carefully indicate in which months teff harvests were coming from the
field and what the level of teff storage was at the end of each month. Monthly teff withdrawal for
sales, consumption, or other uses from these stocks had to be noted as well. Enumerators and
farmers were asked to ensure that inflow and outflow of teff stocks were consistent for every
month. Figure 5.1 shows how these measures change over the year. The figure on the left
illustrates the average smooth withdrawal of teff from peak storage after harvest (at about 800 kg
per household in the month of March). This average storage level comes down to about 100 kg
per household in November.14 The graph also indicates strong differences between households.
The lowest 25th percentile teff farmers does not hold stocks for three months while the 75th
percentile holds continuously stock over the year, going up to 1 ton in the post-harvest period.
We note however at each level smooth stock withdrawal, seemingly not associated with distress
sales after harvest.
13 The existence of seasonality in prices and supply is not an indication per se of inefficiency. A number of
authors (e.g. Williams and Wright, 2005; Benirschka and Binkley, 1995) have argued that seasonality in prices for a storable products should ideally reflect storage costs as well the opportunity costs of money in these settings.
14 Teff can be stored for relatively longer periods without quality loss and the graph suggests that some farmers indeed store across years seemingly using teff as a savings device.

The Figure on the right shows monthly sales, consumption, and stock changes. Stock changes are
calculated by comparing monthly changes in stock position, i.e. positive values indicate a stock
buildup while negative values signal stock release. This is calculated for the mean, median, the
25th, and the 75th percentile of storage levels in the household dataset. Stock buildup is
happening during the months of November until March. Stock withdrawal is mainly done
between March and October. Similar patterns - but different quantities - are noted for the
average, median, and different percentiles withdrawal. Stock release is highest during the period
of July–August (Hamle-Nehassie), also the month when the sowing of teff takes place. The main
uses of teff production are consumption and sales.15 Teff consumption increases immediately
after harvest and stays stable over the year. It drops to half the level in the months before the
harvest. As expected, we also note strong seasonal patterns in the sales of teff. Surprisingly, the
peak of sales in our survey data is not immediately after harvest but it is a couple of months
afterwards.
Figure 5.1—Seasonality in storage (left side) and average monthly use of Teff (right side) To get at seasonal movements in prices, we rely on prices collected in the last ten years by the
Central Statistical Agency (CSA) on the markets in the same five production areas that we
surveyed as well as in the urban retail markets of Addis. Following the method of Aker and
Fafchamps (2014), we regress the logarithms of real producer and consumer prices as well as the
gross real margins on monthly, yearly, market, and quality dummies. The results in Table 5.1
show that the lowest prices are observed just after the harvest and threshing period (January–
March) and the highest prices toward the end of the year (August–October). Over the period
considered, retail and producer prices increased significantly by 9 percent and 14 percent
respectively in the months of August–October compared to the post-harvest price. Similar
seasonal price amplitudes have also been found in other studies (Rashid and Negassa 2011;
Minten et al. 2012). Compared to other cereals in Ethiopia, teff has a similar seasonal price
movement as wheat (Minten et al., 2012). However, sorghum (15%) and maize (25%) prices are
characterized by larger amplitudes, likely driven by relatively more difficulties in storage for
these crops.
15 Sales and consumption are the most important uses of teff production. They make up 46 percent and 33 percent, respectively, of total use of the production in the year prior to the survey.

We further test how gross margins – defined as the difference between urban retail and rural
market prices - are affected by seasonality. Margins are slightly higher during the post-harvest
period from January until March. Compared to this period, real gross margins decline by about
6% in the months from July to September. The higher prices in the beginning of the year might
be partly driven by higher transport costs during the post-harvest period given higher demand for
transport services during that period in rural areas (Minten et al. 2012).
Table 5.1—Seasonality effects in gross margins and prices (2001-2012) 6. Variation over Space
Transportation costs and remoteness matter enormously in agricultural markets in developing
countries (Teravaninthon and Raballand 2009; Deichmann, Shilpi, and Vakis 2009; Fafchamps
and Shilpi 2003; Gollin and Rogerson 2010). In this section, we study how teff transportation
and marketing behavior differ over space between Addis Ababa and rural production areas. First,
we look at the transport sector and analyze how teff is shipped from rural to urban areas. Second,
we discuss how farmers’ teff marketing is related to these transportation costs.
To better understand how the transport sector for agricultural products in Ethiopia works, a
survey was implemented with truck drivers that ship teff from rural areas to Addis Ababa’s
wholesale markets, where they were interviewed. Truck drivers were asked about the
characteristics of themselves, the owner of the truck, and about the type of trucks used. Detailed
questions were also asked about the last roundtrip (coming from rural areas to Addis Ababa and
leaving from Addis Ababa to rural areas). Note that in most of the cases, transport services are
delivered to traders by specialized transport companies and that few of the traders operate their
own trucks. In our sample, only 23% of the rural traders and 3% of the urban traders stated to
operate their own trucks.
Table 6.1 presents some of the descriptive statistics. The average carrying capacity of a truck that
ships teff to Addis Ababa is rather small, i.e. 5 ton. It has been used for about 10 years and its
value is evaluated at about 0.5 million Birr (or about 25,000 USD). In only 10 percent of cases is
the driver also the owner of the truck. Most of the businesses involved in the transport of teff are

small in size as the median number of trucks owned is one.16 The average distance covered in the
last trip was 228 kilometer. Twenty percent of the trucks drove on non-paved bad quality roads
during the trip while 46 percent only drove on paved roads. The cost of transport is 18
Birr/quintal per 100 km (or almost 10 USD/ton per 100 km), significantly lower than recent
estimates (24 USD/ton per 100 km) on the costs from primary to terminal markets (World Bank
2012). It might be that there is significant competition in these commercial agricultural areas,
driving down costs compared to other areas in Ethiopia. On the trip to Addis Ababa, transporters
transported goods for about two sellers - given the relatively small quantities sold by farmers,
these are almost always traders - and they delivered goods to over three buyers on average. In
82 percent of the cases, a transport broker was used to find a load. Transport charges for the
return trip to rural areas are similar to traveling to Addis Ababa. However, in one-quarter of the
cases the truck was empty on the return, indicating that it is often more complicated to find
goods to ship out of Addis Ababa than to Addis Ababa. This is possibly confirmed by the higher
prices that brokers charge for finding loads for trips out of Addis Ababa.
Table 6.1—Descriptive of transport To understand how distance traveled is related with transport charges in these settings, transport
charges per quintal are regressed on different explanatory variables including distance but also
the size of the truck, road quality, number of sellers and buyers, and the use of a broker. We
include a quadratic term in the distance as to allow for potential curvature in the effect of
distance. Two specifications were run, one including data for the trip to Addis Ababa only and a
second one where data for the round trip—when mostly no teff is transported—are added as
well. The results are shown in Table 6.2. Distance and the intercept—reflecting the fixed part of
the transportation cost—are the only variables that come out significant in the regression. It is
estimated that for every 100 km extra traveled, transport charges go up by about 13 Birr per
quintal (about 7 USD per ton per 100 km).
16 The World Bank (2012) shows that different types of companies are active in the transport sector in Ethiopia, including private companies with large fleets, transport associations consisting of a group of private operators with a limited number of trucks, government operated public transportation companies, and enterprises and sole proprietors that involve one or more individuals owning and operating their own trucks. Our results indicate that the latter companies take care of most teff transport.

Table 6.2—Determinants of transportation costs by trucks (in Birr/quintal) Assuming that transportation costs would be transmitted to farmers, this is supposed to show up
in farm prices. Using local polynomial smoothing estimates, Figure 6.1 shows the relationship of
the reported producer prices at the time of the survey with transportation costs to Addis Ababa.
We note overall significant decreases in teff prices the farther that farmers are located from the
terminal market. While at the time of the survey the share of the producer price in the final retail
price of the most traded teff quality (the white variety) close to the city reaches over 90 percent,
this drops to 80 percent for the most remote farmers. We further note strong variability in price
levels for those villages that have to pay more than 120 Birr/quintal to ship teff to Addis. Price
setting in these more remote settings is seemingly more driven by localized demand and supply
parameters and isolated markets have been shown to be associated with higher price volatility
(see e.g. Jacks, O'Rourke, and Williamson 2011).
Figure 6.1—Producer price of Teff by transportation costs to Addis Ababa We further formally test the influence of transport costs on producer prices through a
multivariate regression framework where we control for other confounding factors in price
formation. We use as the dependent variable in this case the reported price that the farmer
received in teff marketing transactions in the last 12 months prior to the survey. In a first short
model, we regress prices on quality dummies and transport costs to Addis. In a second longer
model, we control for place of sales, quantity sold, as well as the timing of sales on top of
transportation costs to Addis Ababa. Standard errors are estimated after accounting for within
cluster (kebele) correlations and possible heteroskedasticity. The results of the regression are
shown in Table 6.3. They show how producer prices drop significantly with increasing
transportation costs to Addis. We test through an F-test if producer prices drop as fast as
transportation costs to Addis Ababa increase. In both cases, this hypothesis cannot be rejected,
indicating that teff producer prices drop in line with transportation costs.17,18 The results further
17 This is in contrast to results reported by Minten and Kyle (1999) in Zaire as well as Gollin and Rogerson (2010) in Uganda. They find that producer prices drop much faster, possibly linked with decreasing levels of competition and increasing risk.
18 A specification was also tried where woreda dummies were included to additionally control for quality. In none of the cases was the F-test significant.

show that prices at the farmgate are lower, but not significantly, than on markets and that farmers
that sell larger quantities are usually able to negotiate higher per unit prices (e.g. Fafchamps and
Hill 2005).
Table 6.3—Determinants of producer teff prices (obtained price for marketing transactions over the last 12 months; Birr/quintal)
While we find that producer prices vary significantly over space, other production and marketing
measures show strong associations across space as well. Figure 6.2 (left side) shows how
production and commercial surplus per teff producing household vary with transportation costs
to Addis Ababa. We see the highest commercial surpluses achieved by farmers that face the
lowest transportation costs. Commercial surplus decreases to almost zero for those farmers that
are most remote; these farmers drop to subsistence levels. Measured as the difference between
production and sales, consumption levels of teff per household show less variation over space.
However, the most remote farmers have slightly lower consumption levels of teff.19 The right side
of Figure 6.2 shows how the quantities of commercial surplus that are sold to traders that ship the
product to Addis Ababa vary by transportation costs to Addis Ababa. As could be expected, we
find a strong relationship. For those farmers that live close by, the majority of commercial surplus
is sold to traders that ship to Addis Ababa. For farmers that live further out, they ship to other
places or to other types of sellers or more importantly, they just sell less.
Figure 6.2—Commercial surplus and quantity sold to traders shipping to Addis by transportation costs to Addis
In Figure 6.3, we further illustrate, using local polynomial smoothing estimates, how input costs,
the value of production, and rewards to labor in teff production change over space. Again, strong
spatial patters are noted, as has been shown in other settings (Fafchamps and Shilpa 2003;
Jacoby and Minten 2009). Monetary production costs per hectare – most importantly chemical
fertilizer and seeds – are about three times as high in the least remote areas compared to the most
remote ones. The value of output per hectare also shows a strong link with remoteness, driven by
higher yields as well as higher output prices. It falls to half the level from the least to the most
19 Possibly illustrating the economic superior characteristics of teff as more remote households are often poorer
(e.g. Jacoby and Minten 2009).

remote areas. To get at the profits at the farm level, the value of output is compared to monetary
input costs (not including labor). Figure 6.3 shows how these rewards to labor inputs change
over space. While rewards in half of the domain hover around 40 Birr/day, this drops quickly
beyond that distance and rewards to labor fall to zero in the areas that are mostly subsistent and
do not ship teff to Addis. The results therefore show strong heterogeneity in teff production and
marketing practices and pay-offs, linked with location with respect to major terminal markets, as
has been noted before (see e.g. Schultz 1953)
Figure 6.3—Profits and rewards to Teff labor by transportation costs to Addis
7. Conclusions
The increasing urbanization in developing countries raises important questions on how food
value chains function and on how opportunities can be harnessed from these changes to allow for
better food security for rural as well as urban poor. We look in this study in particular at the case
of the rural–urban value chain of teff in Ethiopia, by value its most important staple value chain,
relying on an innovative survey format. Surveys were fielded at each layer of the value chain
from major production areas counting for 42 percent of national commercial surplus and for
more than 90 percent of the supply to the main terminal market in Addis Ababa, the capital of
Ethiopia and also its largest city. We therefore look at the functioning of the most important
staple value chain in the country. Almost 1,800 primary survey interviews with producers,
traders, truck drivers, and retailers were conducted for this study.
We find that these value chains are relatively unsophisticated. At the farm level, there are no
interlinked transactions with buyers of the produce (often seen in other countries, especially in
more developed value chains), the role of credit is minor, and most of the transactions are cash
transactions. Midstream and downstream, due to lack of grading and standardization we see
significant efforts in checking quality and quantity at the time of each transaction along the value
chain. Overall however, value chains are short – in 85% of the cases, there are 2 trade nodes or
less between retailers and farmers - and farmers obtain a relatively high share of the final retail
price (on average 80 percent). The majority of the farmers would not have accepted a
significantly lower price at their times of sales, indicating the relatively minor importance of

distress sales in farmers’ marketing decisions. Producer prices decline in line with transportation
costs, seasonal prices are relatively small and storage release is
smooth over the year. In contrast with common perceptions, commercialization in these major
teff-producing areas of Ethiopia seems therefore fairly well organized and while there are areas
for marketing improvement, these are not likely to lead to major reductions in consumer price
levels or increases in farmer prices given the relatively small share of marketing costs.
Our results raise questions as to why they are in contrast to conventional thinking. Several
reasons can be forwarded. First, the literature on value chain functioning is heavily dominated by
case study research (e.g. Dawe et al. 2008; Hayami, Kikuchi, and Marciano 1999), often raising
questions on the representativeness of findings.20 Second, changes are quickly happening in
these value chains, especially in these zones where much of the teff produced is marketed, driven
by improvements in transport infrastructure, better communication, and increasing demand for
food choice and quality in cities (e.g. Reardon et al. 2012). It is possible that research has not
kept pace with these changes. Third, we studied a relatively un-sophisticated market where there
is little value addition. The situation might be different for other products (Miller and Jones
2010). Fourth, we looked here at a case of cereals where assessment of quality and quantity is
relatively straightforward, and losses in the value chain are relatively small. Value chains of root
crops where assessments of quality and quantity are more complicated or of fruits and vegetables
where perishability and losses are a more important issue might lead to a different structure and
higher margins. Fifth, we studied a product that has a relatively high price in urban retail market.
For example, the price of teff is on average double the price of maize (Minten et al. 2012). As
such, even if the maize market in Ethiopia performs as well as that for teff, the share of the final
retail price that maize producers receive will result in a different picture. Teff is also a major
staple crop. The situation might be different for non-staples or for products where markets are
thin. Sixth, the value and services that traders bring to the system are often not well appreciated.
In the face of increasing or volatile food prices, traders are often blamed.21 In consequence, their
importance in the value chain may often be overstated. Seventh, differences in agricultural.
20 Such case study approach is seemingly often linked with budget and time constraints in value chain assessments as well as with the difficulty of implementing surveys over different value chain participants.
21 For example, India forbade forward trading on commodity exchanges for a number of crops as to control food inflation. The increasing global volatility in food prices has been blamed as well on extensive speculation, but disproven by some authors (Irwin, Sanders, and Merrin 2009).

marketing behavior in Ethiopia compared to other African countries, possibly driven by the
widespread availability of donkeys, the high rural population density, and the storability of teff
might be factors leading to differences with other crops and countries. Unfortunately, evidence is
in general thin in these areas and the findings from this study call for further research on other
crops as well as other countries.
Our findings also point to some important policy implications. First, given the difficulty in
correctly assessing market functioning, policies aimed at improving market efficiencies—such as
stimulating increasing involvement of agricultural cooperatives in output marketing, the
establishment of modern exchanges, or warehouse receipt systems—should be closely examined
to determine how and where these policies are expected to improve market functioning and what
the expected benefits would be compared to the costs of their implementation. Second,
increasing investments in road infrastructure to bring in more remote areas and the lowering of
transportation costs through removal of barriers in investments (World Bank 2012) is shown to
be linked to the prices that farmers receive as well as to rewards to labor and are therefore
important to increase agricultural income of farmers. Third, if the objective of policy makers is
to reduce consumer prices in urban areas, relatively more attention should be given to lower farm
production costs given that these costs make up the biggest part of the final retail price.

Tables and Figures
Table 2.1 Farmers Number of
Unit Mean Median Standard
deviation
observations 1200 - - Gender head of
household share male 95.3 - -
Level of education years of schooling
4.6 4.0 2.9
Experience in teff
business years 9.6 10.0 1.5 Rural wholesalers Number of observations 205 - - Gender share male 94.6 - -
Level of education years of schooling
7.9 9.0 3.9
Experience in teff
business years 9.5 8.0 7.8 Truck drivers Number of observations 90 Gender share male 100.0
Level of education years of schooling
9.4 10.0 1.8
Experience as truck
driver years 6.5 5.0 5.9 Urban wholesalers/brokers Number of observations 75 - - Brokers share 65.3 - - Traders share 64.0 - - Gender share male 100.0 - -
Level of education years of schooling
8.7 8.0 3.4
Experience in teff
business years 8.9 7.0 6.7 Urban retailers Number of observations 282 - - Mills share 83.3 - - Cereal shops share 9.9 - -

Type of buyer: Farmers
%
0.6
Farmer-assembler (farmer trader) % 5.2 Assemblers from outside village % 5.5 At wholesale market: traveling trader going to Addis Ababa % 17.5 At wholesale market: traveling trader going elsewhere % 16.3
Trader with fixed shop, selling teff to Addi s Ababa % 29.8 Trader with fixed shop, selling teff elsewhere % 17.4 Consumer % 7.0 Other (miller, cooperative, EGTE/government) % 0.7 Total % 100.0
On the farm or home % 3.1 Trader shop (fixed) % 60.3 Local (weekly) market % 34.7 Other (roadside, cooperative, at mill) % 1.9 Total % 100.0
Travel time between departure and arrival sal location
es minutes 92.0 80.0 65.3
Time spent at location of sale before sale hours 0.9 0.5 1.0 Total quantity sold per transaction Type of teff sold:
Magna
kg
%
299
22.4
200 685
White % 60.3 Mix % 7.2
deviation
Consumer cooperatives share 6.7 - - Gender share male 84.7 - -
Level of education years of schooling
7.7 8.0 4.4
Experience in teff
business years 8.2 5.0 7.8 Source: Teff value chain surveys
Table 3.1
Commercial surplus Unit Mean Median Standard
Teff sold per household, quantity kg 507 250 1130 Teff, commercial surplus for producing households % 36 33 26
Characteristics of marketing transactions Transactions per teff farmer for producing
households number 1.75 1.00 1.52
Sale location:

Table 3.2
Rural traders Unit Mean Median Mean Median Mean Median
1000 Birr 242.4 71.5 122.4 8.9 337.4 78.7
ton 252.6 134.3 694.1 585.0 35.9 25.0 share (%) 13.7 21.3
share (%)
44.9
9.3
31.1
share (%) 93.2 40.0 98.4
share (%) 100.0 100.0 99.3
share (%) 97.6 100.0 100.0
share (%) 68.3 88.0 62.3
share (%) 28.3 46.7 20.4
share (%) 23.4 1.3 23.5
share (%)
91.7
46.7
67.1
share (%) 85.9 90.7 -
share (%) 94.6 100.0 99.2
Red % 10.2
Total amount received Birr 3,776 1,800 18,082 Price received Birr/quintal 1,065 1,000 232 Person that sold the teff % male 84.0 Payment in cash % 99.6 Input advances received from buyer % yes 1.9 Payment in cash and immediately % 99.1 100.0 9.1 Farmer would have sold at 10% lower price at time of
sale % yes 19.5 Farmer would have sold at 50% lower price at time of
sale % yes 10.1 Source: Teff producer survey; Note: EGTE = Ethiopian Grain Trade Enterprise.
Value assets
Yearly turnover of teff
Do storage of teff for longer than a month
Services for suppliers
Picked up teff in own/rented truck
Teff is weighed when bought
Teff quality is sampled when bought
If yes, visually checked
If yes, rubbed teff by hand
If yes, chewed the teff
Bags are provided to suppliers
Services for clients
Deliver to clients
Grade and sort to sell to clients
Teff is weighed when sold
Urban traders/ brokers
Urban retailers
88.3 100.0 97.1
71.7 98.7 25.2
8.5
0.0
60.5
60.0
45.5
50.0
11.1 7.0 6.7 5.0 16.6 15.0
8.7 0.0 1.1 0.0 20.9 20.0
39.0 25.0 47.9 50.0 30.2 30.0
17.7 15.0 8.0 7.0 20.5 20.0
2.5 0.0 0.0 0.0 4.3 5.0
6.7
4.0
15.0
65.0 100.0
7.2
%
Dire
ct
FT
RT
UT
FT-R
T
FT-U
T
RT-U
T
RT-R
T
UT-U
T
FT-R
T-RT
FT-R
T-UT
FT-U
T-UT
R T-R
T-UT
RT-U
T-UT
FT-R
T-UT
-UT
FT-R
T-RT
-UT
FT-R
T-RT
-UT-
UT
RTRT
UTUT
Teff quality is sampled when sold share (%)
Provide bags to clients share (%)
Credit
Suppliers that are paid on credit share (%)
If yes, number of days before payment number
Suppliers that were given advances share (%)
Clients that pay on credit share (%)
If yes, number of days before payment number
Clients that gave advances share (%)
Relationships Number of suppliers worked with in last 12
months number Trader/broker is originally from Addis Ababa
share (%)
Procurement from trader’s zone of origin share (%)
Broker that retailer works with is from same zone
Source: Teff trader surveys Figure 4.1
share (%)
100
90 80 70 60 50 40 30 20 10
0
0 node 1 node 2 nodes 3 nodes > 3 nodes
Share Cumulative
Source: Teff trader surveys; Note: FT: Farmer-trader; RT: Rural trader; UT: Urban trader

Table 4.1
Unit Specification 1 Specification 2 Specification 3 Specification 4
t- Level Source Coeff. value* Coeff. t-value Coeff. t-value Coeff. t-value Farmgate sales Farm survey yes=1 -265.6 -23.02 -267.4 -23.06 -304.5 -16.49 -228.1 -20.80 Farmgate sales interacted with nearby Addis dummy Rural market procurement Pooled Rural market procurement Farm survey
yes=1 yes=1 yes=1
-223.7
-47.50
-239.5
-33.74
66.3
-281.6
2.92
-27.04
-202.0
-26.24 Rural market procurement, interacted with nearby Addis dummy yes=1 73.1 5.74
Rural trader Rural market shipping to Addis Urban wholesale market Urban wholesale market
survey Pooled Rural trader
yes=1 yes=1
-137.0
-33.40
-208.8 -42.25 -208.4 -42.22 -175.7 -31.59
procurement survey Urban trader
yes=1 -148.0 -29.74 -147.7 -29.69 -108.4 -19.25
Urban wholesale market sales Urban retail sales - mills
survey Urban retailer
yes=1 -120.7 -21.74 -120.4 -21.69 -101.1 -16.00
(default)*** survey yes=1 Urban retailer Urban cooperative retail sales survey yes=1 -16.2 -1.58 -16.8 -1.63 -13.3 -1.16
Urban retailer Urban cereal shops sales survey yes=1 0.8 0.08 1.2 0.11 -5.8 -0.52 Magna teff (default) yes=1 White teff yes=1 -95.0 -19.60 -91.9 -19.04 -83.7 -17.44 -67.7 -14.74 Mixed teff yes=1 -201.5 -37.59 -203.1 -37.76 -198.8 -37.55 -171.6 -31.50 Red teff yes=1 -419.0 -64.07 -419.3 -64.04 -413.1 -63.72 -385.7 -60.48 Intercept 1653.8 404.46 1654.2 395.60 1649.2 398.32 1442.2 114.99 Woreda fixed effects no no no yes Number of observations 3316 3316 3316 3251 R squared 0.67 0.67 0.68 0.74

MSE F-test if rural
market price reported F() Prob>F F() Prob>F F()** Prob>F F() Prob>F … by farmers is equal to reports by traders 15.77 0.00 0.00 0.99 11.74 0.00 F-test if reported urban wholesale procurement price … is equal to urban wholesale sales price 18.16 0.00 18.09 0.00 1.11 0.29 *: t-values in bold are significant at the 5% level; robust standard errors **: rural market prices reported by the farmers in the least remote half of the sample ***: default in specification 1 is all urban retail; in other specifications, it is urban mills
Table 4.2
Standard Unit Mean Median Deviation Value of production Birr/ha 11,407 9,600 6,901 Total monetary input costs
Birr/ha
2,674
2,387
2,922
Profit per hectare Birr/ha 8,735 7,435 6,947 Total labor use
Person- days/ha
140.6
112.5
119.8
Rewards to labor
Birr/person- day
39.4
22.6
82.7
Source: Teff producer survey.

February yes=1 -0.010 -1.47 -0.009 -0.41 -0.003 -0.43 March yes=1 0.002 0.30 0.009 0.43 0.008 1.43 April yes=1 0.022 3.17 0.007 0.33 -0.024 -3.55 May yes=1 0.073 9.67 0.024 1.23 -0.050 -6.83 June yes=1 0.116 18.33 0.072 3.69 -0.049 -7.91 July yes=1 0.126 17.85 0.057 2.90 -0.060 -8.94 August yes=1 0.119 14.88 0.077 3.90 -0.059 -7.59 September yes=1 0.137 19.05 0.075 3.68 -0.067 -9.69 October yes=1 0.086 9.52 0.086 4.02 -0.010 -1.13 November yes=1 0.096 12.59 0.061 2.69 -0.040 -5.49 December yes=1 0.067 8.41 0.032 1.34 -0.041 -5.29
Intercept Quality dummies
6.167 yes
197.09 6.847 yes
203.16 0.683 yes
22.25
Market fixed effects yes no yes
kgs
kgs
Figure 5.1
1000
900
800
700
600
500
400
300
200
100
0
25th percentile
median
75th percentile
average
N-D D-J J-F F-M M-A A-M M-J J-J J-A A-S S-O O-N
600
400
200
0
-200
sales consumption Stock buildup 25th percentile Stock buildup median Stock buildup 75th percentile Stock buildup average
N-D D-J J-F F-M M-A A-M M-J J-J J-A A-S S-O O-N
Source: Teff producer survey. Table 5.1
Producer (ln(Pp)) Retail (ln(Pr)) ln(Pr)-ln(Pp)
Month (January=default)
Unit Coeff.
t- value* Coeff. t-value Coeff.
t- value
Year fixed effects yes yes yes Number of observations 21972 396 21972 R-squared 0.61 0.89 0.33 Source: Central Statistical Agency; Prices deflated by the Consumer Price Index adjuste to 2012 prices) *: robust standard errors; t-values in bold are significant at the 5% level

Table 6.1
Carrying capacity quintals 51.2 50.0 15.8 Age years 9.7 7.0 14.1 Value 1000 Birr 500.0 500.0 261.9
n n
Standar Unit Mean Media d
de io n viat
n Characteristics of truck
Characteristics of truck driver Is also the owner share (%) 10.7
Characteristics of owner Gender % male 98.1 Education years 8.8 10.0 3.8 Trucks owned number 1.1 1.0 0.6
To Addis Ababa From Addis Ababa
Characteristics of last trip Mean Media Standar
d deviatio
n Mean Media
Standar d
deviatio n
Distance km 228 254 145 231 260 149 Road quality:
- Only paved road share (%) 45.6 46.6 - Drove on non-paved road but good
quality share (%) 33.0 33.0 - Drove on non-paved bad quality road share (%) 21.4 20.4
Time for travel between departure and
arrival hours 6.8 8.0 3.7 6.8 8.0 3.8 Time for unloading/loading/searching hours 4.7 5.0 2.7 4.7 5.0 2.6 Time for whole trip hours - - - 22.6 23.3 8.0 Trucks which were empty share (%) 0.0 25.2 Capacity of truck used % 94.9 100.0 13.9 81.0 100.0 35.3 Total value of good transported 1000 Birr 66.8 65.0 23.3 160.0 150.0 86.0
Transport payment Birr/quint al
41.8 40.0 19.5 46.1 40.0 28.4
Number of sellers transported for number 2.4 2.0 5.2 3.9 3.0 3.7 Number of buyers delivered to number 3.4 4.0 1.3 4.0 3.0 3.4 Transport broker used % yes 82.4 83.0 Payment to transport broker Birr 174 150 104 258 250 109 Source: Teff transporter survey.

Table 6.2
Birr/
quint
al 10
00
600
800
1200
14
00
Explanatory variables
Unit
Trip to Addis Ababa only Roundtrip
Coeff. t-value* Coeff. t-value Distance 100 km 13.23 6.97 12.00 5.33 Distance squared 100 km -0.45 -1.63 -0.35 -1.37 Size of truck quintals -0.06 -0.81 -0.05 -0.96 Road quality (default only paved road):
Drove on non-paved road but good quality yes=1 -0.17 -0.05 3.99 0.84
Drove on non-paved bad quality road yes=1 3.52 1.21 2.03 0.81
Number of sellers transported for number 0.09 0.77 0.02 0.10 Number of buyers delivered to number 0.32 0.37 0.03 0.47 Broker used yes=1 3.55 1.56 -0.71 -0.22 To Addis Ababa yes=1 1.87 0.53 Intercept 12.68 3.15 16.31 2.56 Number of observations 101 177 R-squared 0.69 0.35 Root MSE 11.46 19.37 Source: Teff transporter survey; * t-values in bold are significant at the 5 percent level; robust
standard errors Figure 6.1
0 50 100 150 Transport costs to Addis (Birr/quintal)
Confidence interval 95% Producer prices
Source: Teff producer survey. Note: Local polynomial smoothing estimates with 95% confidence
intervals

Table 6.3 Short model Long model Unit Coeff. t-value* Coeff. t-value Transport costs to Addis from kebele
Birr/quintal
-1.10
-2.38
-0.87
-2.15
Transport time to nearest market
log(minutes)
14.36
1.40
Quantity log(quintal) 31.92 4.32 Farmgate yes=1 -25.00 -0.62 Color teff (Magna=default) White -49.82 -2.41 -53.00 -3.01 Mixed -133.94 -4.79 -136.79 -5.37 Red -268.14 -10.17 -279.81 -12.77 Intercept 1203.42 37.08 1329.10 22.35 Monthly dummies no yes Number of observations 2046 2046 R squared 0.13 0.37 MSE 216.69 185.16 F-test if producer prices drop as fast as… F() Prob>F F() Prob>F … transport costs to Addis increase
0.04
0.83
0.10
0.75
* Standard errors are estimated after accounting for within cluster (kebele) correlations and possible heteroskedasticity; t-values in bold are significant at the 5% level
kgs
1000
0
500
1500
20
00
2500
kgs
sold
per
hou
seho
ld to
trad
ers
ship
ping
to A
ddis
0
200
400
600
800
Figure 6.2
0 50 100 Transport costs to Addis (Birr/quintal)
Confidence interval 95% Sales per household Confidence interval 95% Production per house
0 50 100 Transport costs to Addis (Birr/quintal)
Confidence interval 95% Quantity sold
Source: Teff producer survey. Note: Local polynomial smoothing estimates with 95% confidence
intervals

Figure 6.3
Birr/
ha
0 50
00
1000
0 15
000
Birr/
day
20
-20
0 40
60
0 50 100 Transport costs to Addis (Birr/quintal)
Confidence interval 95% Cash production c Confidence interval 95% Gross value teff o
0 50 100 Transport costs to Addis (Birr/quintal)
Confidence interval 95% Rewards to lab
Source: Teff producer survey. Note: Local polynomial smoothing estimates with 95% confidence intervals
References Ahmed, R., and N. Rustagi. 1987. “Marketing and Price incentives in African and Asian
countries: A comparison.” In Agricultural marketing strategy and pricing policy, edited by
D. Elz. Washington, DC: World Bank. Aker, J.C., and M. Fafchamps. 2014. “How does mobile phone coverage affect farm-gate prices?
Evidence from West Africa.” World Bank Economic Review, Forthcoming. Bernard, T., D.J. Spielman, A.S. Taffesse, and E.Z. Gabre-Madhin. 2010. Cooperatives for
Staple Crop Marketing. IFPRI Research Monograph 164, Washington, DC: International
Food Policy Research Institute.
Benirschka, M., and J.K. Binkley. 1995. “Optimal Storage and Marketing over Space and Time.”
American Journal of Agricultural Economics 77:512-524. Berhane, G., Z. Paulos, and K. Tafere. 2011. Foodgrain Consumption and Calorie Intake
Patterns in Ethiopia. ESSP II Working Paper 23. Addis Ababa, Ethiopia: International Food
Policy Research Institute / Ethiopia Strategy Support Program II.

Chamberlin, J., and T.S. Jayne. 2013. “Unpacking the Meaning of ‘Market Access’: Evidence
from Rural Kenya.” World Development 41: 245–264.
Christiaensen, L., and S. Devarajan. 2013. “Making the most of Africa’s growth.” Current
History 112 (754): 181–187.
CSA (Central Statistical Agency). 2012. Agricultural Sample Survey 2011/2012: Report on area
and production of major crops. Addis Ababa: Central Statistical Agency.
CTA (Technical Centre for Agricultural and Rural Cooperation). 2012. Going to waste – missed
opportunities in the battle to improve food security. CTA Policy Brief 7. Brussels: Technical
Centre for Agricultural and Rural Cooperation.
Dawe, D.C., P.F. Moya, C.B. Casiwan, and J.M. Cabling. 2008. “Rice marketing systems in the
Philippines and Thailand: Do large numbers of competitive traders ensure good
performance?” Food Policy 33 (5): 455–463.
Deichmann, U., F. Shilpi, and R. Vakis. 2009. “Urban Proximity, Agricultural Potential and
Rural Non-farm Employment: Evidence from Bangladesh.” World Development 37 (3):
645–660.
Dercon, S., and P. Krishnan. 2000. “Vulnerability, seasonality and poverty in Ethiopia.” Journal
of Development Studies 36 (6): 25–53.
Devereux, S., R. Sabates-Wheeler, and R. Longhurst. 2012. Seasonality, rural livelihoods, and
development. New York: Earthscan.
DFID (Department for International Development). 2004. “Rethinking tropical agricultural
commodities.” London: Department for International Development. http://dfid-agriculture-
consultation.nri.org/summaries/wp10.pdf
Fafchamps, M., and B. Minten. 1999. “Relationships and traders in Madagascar.” Journal of
Development Studies 35 (6): 1–35.
Fafchamps, M., and F. Shilpi. 2003. “The Spatial Division of Labour in Nepal.” Journal of
Development Studies 39 (6): 23–66.
Fafchamps, M., and R.V. Hill. 2008. “Price Transmission and Trader Entry in Domestic
Commodity Markets.” Economic Development and Cultural Change 56: 729–766.

Francesconi, G.N., and N. Heerink. 2010. “Ethiopian Agricultural Cooperatives in an Era of
Global Commodity Exchange: Does Organizational Form Matter?” Journal of African
Economies 20 (1): 153–177.
Fufa, B., B. Behute, R. Simons, and T. Berhe. 2011. Strengthening the Teff Value Chain in
Ethiopia. Addis Ababa, Ethiopia: Ethiopian Agricultural Transformation Agency (ATA).
Gabre-Madhin, E.Z. 2001. Market Institutions, Transaction Costs, and Social Capital in the
Ethiopian Grain Market. IFPRI Research Report 124. Washington, DC: International Food
Policy Research Institute (IFPRI).
———. 2012. A market for Abdu: Creating a Commodity Exchange in Ethiopia. Occasional
Essays Series. Washington, DC: International Food Policy Research Institute (IFPRI).
Gollin, D., and R. Rogerson. 2010. Agriculture, Roads, and Economic Development in Uganda.
National Bureau of Economic Research Working Paper 15863. Cambridge, Massachusetts:
National Bureau of Economic Research.
Grootaert, C., G. Oh, and A. Swamy. 2002. “Social capital, education, and credit markets:
Empirical evidence from Burkina Faso.” In Social capital and economic development,
edited by J. Islam, T. Kelly, and S. Ramaswamy, 85–103. Cheltenham Glos, UK: Edward
Elgar Publishing.
Hayami, Y., M. Kikuchi, and E.B. Marciano. 1999. “Middlemen and peasants in rice marketing
in the Philippines.” Agricultural Economics 20 (2): 79–93.
Hoffman, V., and K. Gatobu. 2014. “Growing their own: Unobservable quality and the value of
self-provisioning.” Journal of Development Economics 106: 168-178
Irwin, S.H., D.R. Sanders, and R.P. Merrin. 2009. “Devil or Angel? The Role of Speculation in
the Recent Commodity Price Boom (and Bust).” Journal of Agricultural and Applied
Economics 41: 377–391.
Jacks, D.S., K.H. O'Rourke, and J.G. Williamson. 2011. "Commodity price volatility and world
market integration since 1700." Review of Economics and Statistics 93 (3): 800-813.
Jacoby, H., and B. Minten. 2009. “On measuring the benefits of lower transport costs.” Journal
of Development Economics 89 (1): 28–38.

Jayne, T.S., D. Mather, and E. Mghenyi. 2010. "Principal challenges confronting smallholder
agriculture in sub-Saharan Africa." World development 38(10): 1384-1398.
Jerven, M. 2013. Poor Numbers: How we are misled by African development statistics and what
to do about it. Ithaca, NY: Cornell University Press.
Landes, M.R., and M.E. Burfisher. 2009. Growth and Equity Effects of Agricultural Marketing
Efficiency Gains in India. USDA-ERS Economic Research Report 89. Washinton, DC:
United States Department of Agriculture – Economic Research Service (USDA-ERS).
Masters, A. 2008. “Unpleasant middlemen.” Journal of Economic Behavior & Organization 68
(1): 73–86.
Mattoo, A., D. Mishra, and A. Narain. 2007. From competition at home to competing abroad.
Washington, DC: World Bank. McMillan, J., and C. Woodruff. 1999. "Interfirm relationships and informal credit in Vietnam."
Quarterly journal of Economics (1999): 1285-1320. Miller, C., and L. Jones. 2010. Agricultural value chain finance: Tools and lessons.
Warwickshire: FAO and Practical Action Publishing. Minten, B., and S. Kyle. 1999. “The effect of distance and road quality on food collection,
marketing margins, and traders’ wages: Evidence from the former Zaire.” Journal of
Development Economics 60 (2): 467–495.
Minten, B., D.C. Stifel, and S. Tamru. 2014. “Structural transformation of cereal markets in
Ethiopia.” Journal of Development Studies 50(5): 611-629.
Minten, B., S. Tamru, E. Engida, and T. Kuma. 2013. Ethiopia’s Value Chains on the Move: The
Case of Teff. ESSP Working Paper 52. Addis Ababa, Ethiopia: International Food Policy
Research Institute / Ethiopia Strategy Support Program II.
Nang’ole, E.M., D. Mithöfer, and S. Franzel. 2011. Review of guidelines and manuals for value
chain analysis for agricultural and forest products. ICRAF Occasional Paper 17. Nairobi:
World Agroforestry Centre (ICRAF).
Poulton C., J. Kydd, S. Wiggins and A. Dorward (2006) “State intervention for food price
stabilisation in Africa: can it work?” Food Policy 31(4): 342-356.
Rakotoarisoa, M., M. Iafrata, and M. Paschali. 2011. Why has Africa become a net food
importer? Explaining Africa’s agricultural and food trade deficit. Rome: Food and
Agriculture Organization of the United Nations.
Rashid, S., and N. Minot. 2010. “Are staple food markets in Africa efficient? Spatial Price
Analyses and Beyond.” Paper presented at the Comesa policy seminar “Food price
variability: Causes, consequences, and policy options", Maputo, Mozambique, January 25–
26.
Rashid, S., and A. Negassa. 2011. Policies and Performance of Ethiopian Cereal Markets. ESSP
II Working Paper 21. Addis Ababa, Ethiopia: International Food Policy Research Institute /
Ethiopia Strategy Support Program II.
Reardon, T., K. Chen, B. Minten, and L. Adriano. 2012. The Quiet Revolution in Staple Food
Value Chains. Enter the Dragon, the Elephant, and the Tiger. Mandaluyong City,
Philippines: Asian Development Bank; International Food Policy Research Institute.
Schultz, T.W. 1953. The Economic Organisation of Agriculture. New York, McGraw Hill. Teravaninthon, S., and G. Raballand. 2009. Transport prices and costs in Africa: A review of the
international corridors. Washington, DC: World Bank.
Tomek, W.G., and K.L. Robinson. 1972. Agricultural Product Prices. Ithaca, NY: Cornell
University Press.
Trienekens, J.H. 2011. “Agricultural value chains in developing countries: A framework for
analysis.” International Food and Agribusiness Management Review 14 (2): 51–82.
United Nations (UN) Population Division. 2010. World Urbanization Prospects: The 2009
Revision. New York: UN Population Division.
Webber, M., and P. Labaste. 2009. Building competitiveness in Africa’s agriculture: A guide to
value chain concepts and applications. Washington, DC: World Bank.
Williams, J.C., and B.D. Wright. 2005. Storage and Commodity Markets. Cambridge:
Cambridge University Press. 520p.
World Bank. 2008. World Development Report 2008: Agriculture for Development. Washington,
DC: World Bank.

———. 2009. Eastern Africa: A study of the regional maize market and marketing costs. Report
number 49831-ET. Washington, DC: World Bank.
———. 2012. Agribusiness Indicators: Ethiopia. Report number 68237-ET. Washington, DC:
World Bank.