feeding the fish of the future 9th november 2010
TRANSCRIPT
Marine Conservation Society
Feeding the fish of the future
9th November 2010
Paddy Campbell
BioMar Ltd.
Introduction
• Raw material used in last 10 years
– Fishmeal and protein sources
– Fish oil and vegetable oils
• Current raw material use and comparison of Scotland to Norway, Chile and Canada
• Comparisons to other non Salmonid species reference: Tilapia
(Note: Based mainly on BioMar’s view and industry figures)
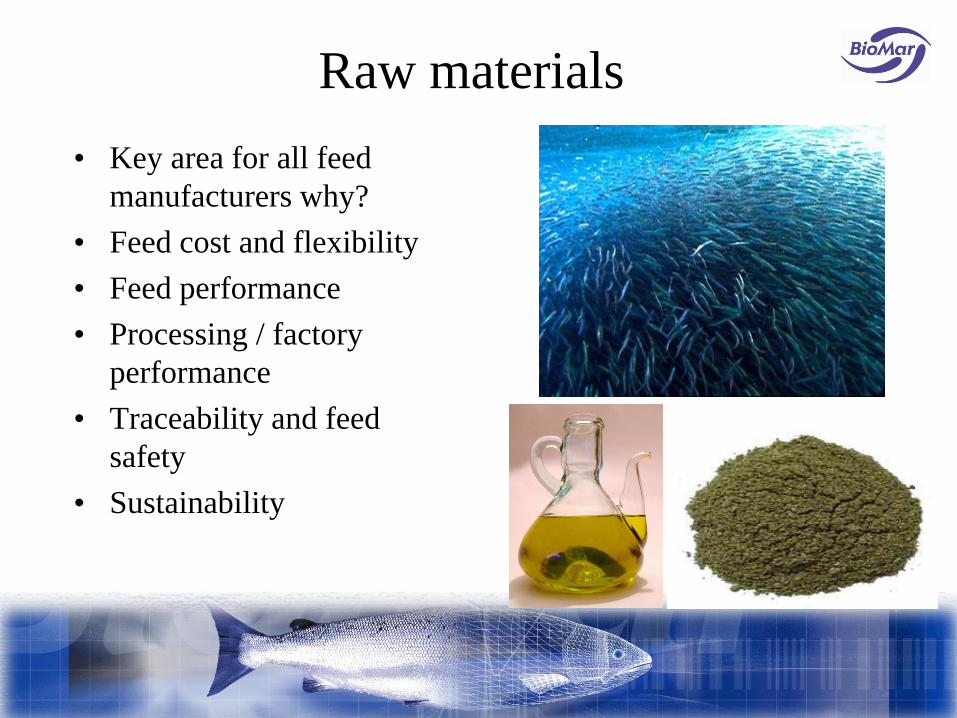
Raw materials
• Key area for all feed
manufacturers why?
• Feed cost and flexibility
• Feed performance
• Processing / factory
performance
• Traceability and feed
safety
• Sustainability
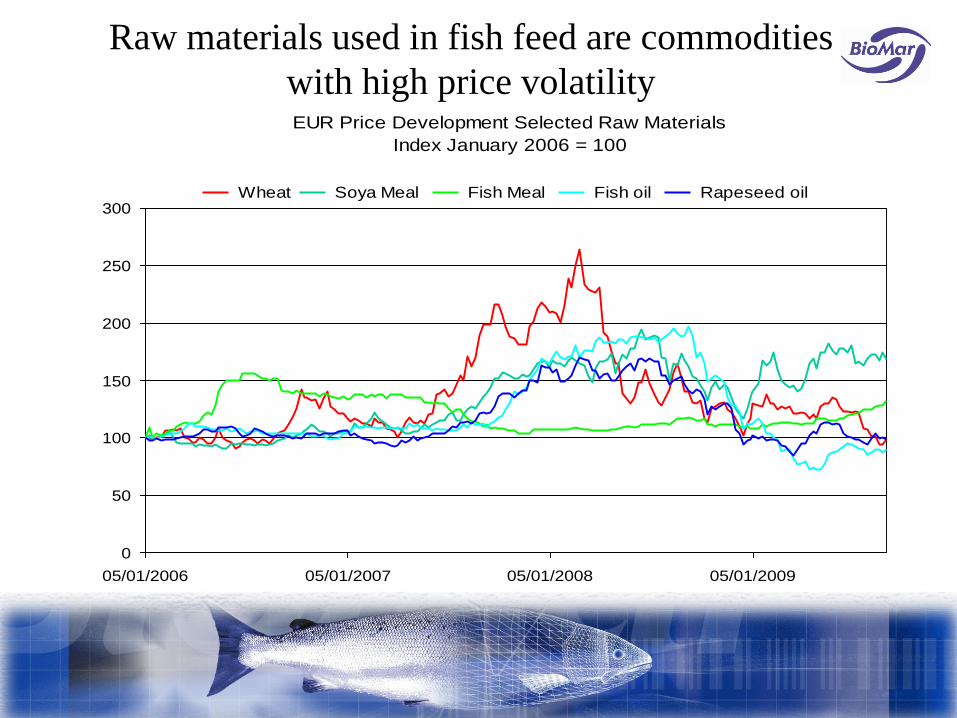
Raw materials used in fish feed are commodities
with high price volatilityEUR Price Development Selected Raw Materials
Index January 2006 = 100
0
50
100
150
200
250
300
05/01/2006 05/01/2007 05/01/2008 05/01/2009
Wheat Soya Meal Fish Meal Fish oil Rapeseed oil
Fishmeal and alternative protein
sources
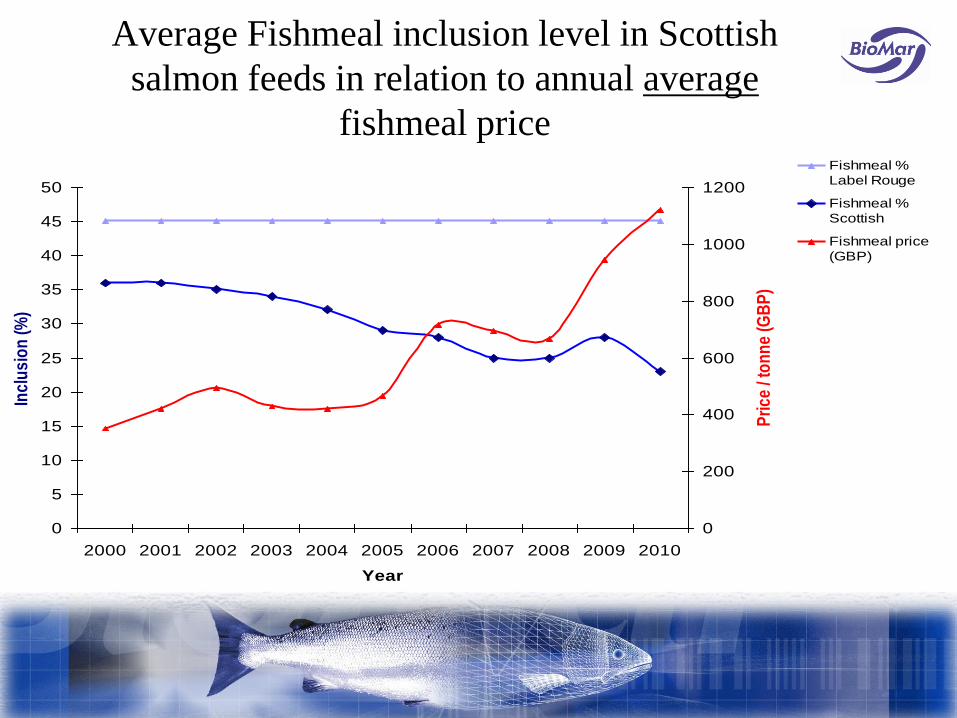
Average Fishmeal inclusion level in Scottish
salmon feeds in relation to annual average
fishmeal price
0
5
10
15
20
25
30
35
40
45
50
2000 2001 2002 2003 2004 2005 2006 2007 2008 2009 2010
Year
Incl
usi
on
(%
)
0
200
400
600
800
1000
1200
Pri
ce /
ton
ne
(GB
P)
Fishmeal %
Label Rouge
Fishmeal %
Scottish
Fishmeal price
(GBP)

Use of fishmeal and it’s vegetable protein
replacers over time in Scottish salmon feeds
0
5
10
15
20
25
30
35
40
2000 2001 2002 2003 2004 2005 2006 2007 2008 2009 2010
Year
% in
clus
ion
Fishmeal
Oilseed meals
Refined vegetableproteins
fishmeal Sunflower cakeHi Pro Soya Soy protein conc. Corn gluten
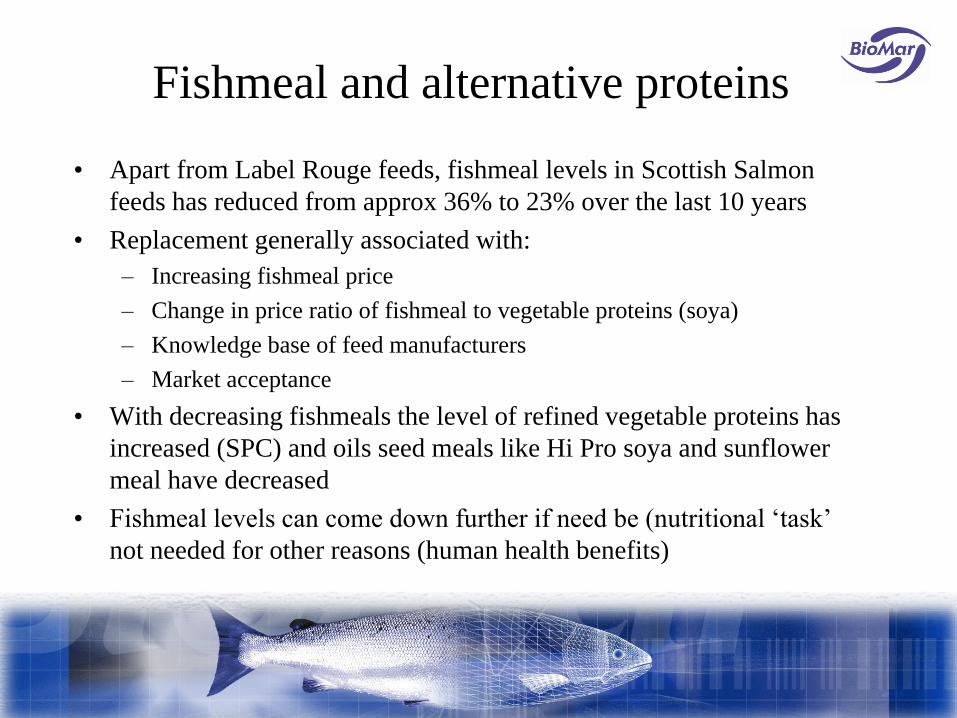
Fishmeal and alternative proteins
• Apart from Label Rouge feeds, fishmeal levels in Scottish Salmon
feeds has reduced from approx 36% to 23% over the last 10 years
• Replacement generally associated with:
– Increasing fishmeal price
– Change in price ratio of fishmeal to vegetable proteins (soya)
– Knowledge base of feed manufacturers
– Market acceptance
• With decreasing fishmeals the level of refined vegetable proteins has
increased (SPC) and oils seed meals like Hi Pro soya and sunflower
meal have decreased
• Fishmeal levels can come down further if need be (nutritional ‘task’
not needed for other reasons (human health benefits)

Fish oil, vegetable oils and EPA and
DHA|
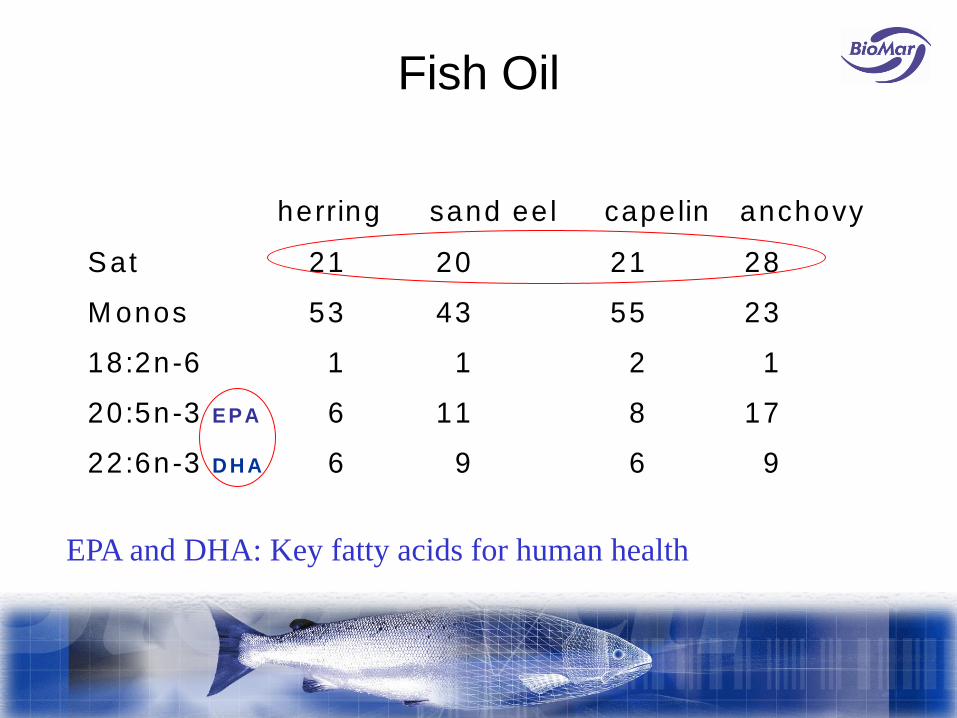
Fish Oil
herring sand ee l capelin anchovy
Sat 21 20 21 28
M onos 53 43 55 23
18:2n-6 1 1 2 1
20:5n-3 EPA 6 11 8 17
22:6n-3 D H A 6 9 6 9
EPA and DHA: Key fatty acids for human health

Vegetable Oil choice
soya rape palm olive linseed
16:0 11 4 44 10 7
18:1 22 56 39 78 15
18:2n-6 53 26 11 7 18
18:3n-3 8 10 1 1 56
20:5n-3 EPA 0 0 0 0 0
22:6n-3 D H A 0 0 0 0 0
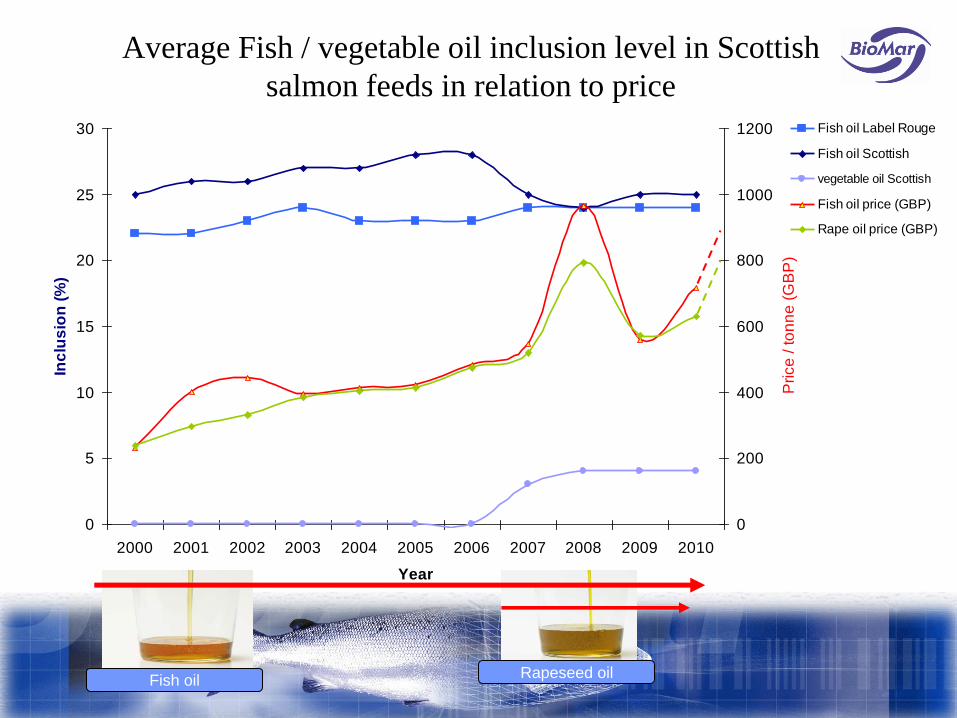
Average Fish / vegetable oil inclusion level in Scottish
salmon feeds in relation to price
0
5
10
15
20
25
30
2000 2001 2002 2003 2004 2005 2006 2007 2008 2009 2010
Year
Inc
lus
ion
(%
)
0
200
400
600
800
1000
1200
Price
/ to
nn
e (
GB
P)
Fish oil Label Rouge
Fish oil Scottish
vegetable oil Scottish
Fish oil price (GBP)
Rape oil price (GBP)
Fish oilRapeseed oil

What does our use of fish oil and vegetable oil mean
in regard to EPA and DHA levels in flesh?
• Assume a use of both NH and SA fish oils with the
majority being NH fish oils
• Assume 26% EPA and DHA for SA fish oil
• Assume 14% EPA and DHA for NH fish oil
• Vegetable oil use as of today (average 4% inclusion in
feeds)
• Scottish salmon will have an average of approximately
16% EPA and DHA (% of flesh oil)
• 2.25% of fillet (14% fat in fillet)
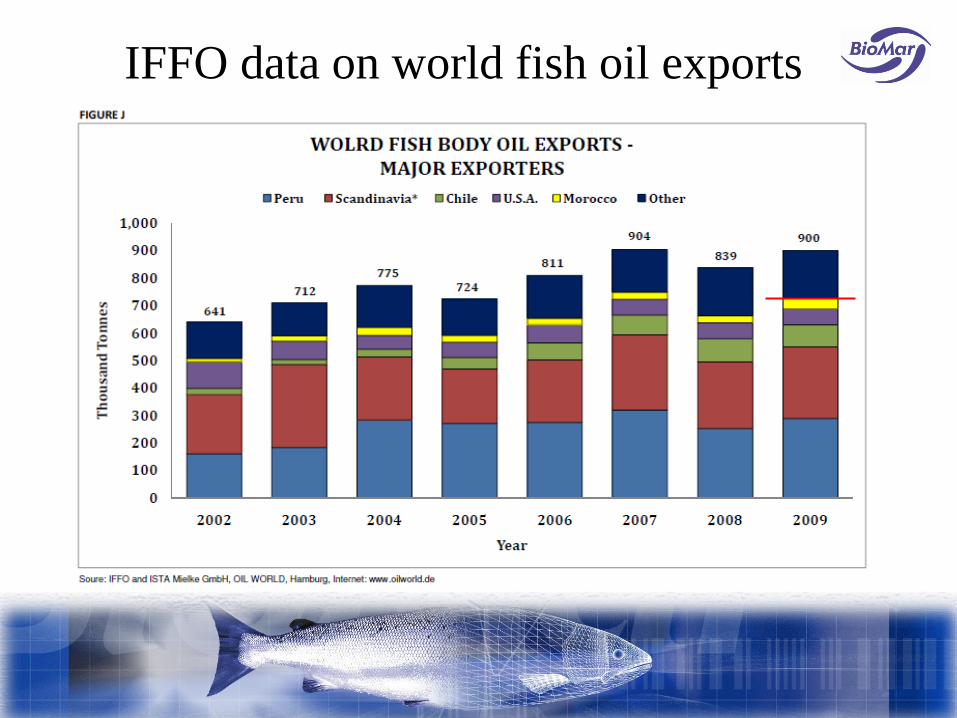
IFFO data on world fish oil exports

Growth in Omega 3 refining industry / year and
volume of fish oil used / year (GOED, 2010)G
row
th /
yea
r (%
)
Ton
nes
/ y
ea
r

Focus on EPA / DHA and fish oil supply
Supply
Farming
Farming + human consumption
Farming + human consumption
Farming +
human consumption
Farming
FarmingSupply
Supply
10% EPA and DHA
in fillet fat
7.5% EPA and
DHA
5.0% EPA and
DHA
Figure showing 3 scenarios for fish oil supply and use based on 10%, 7.5% and 5% EPA and DHA
targets for farmed salmonids production (FHL, Norway)
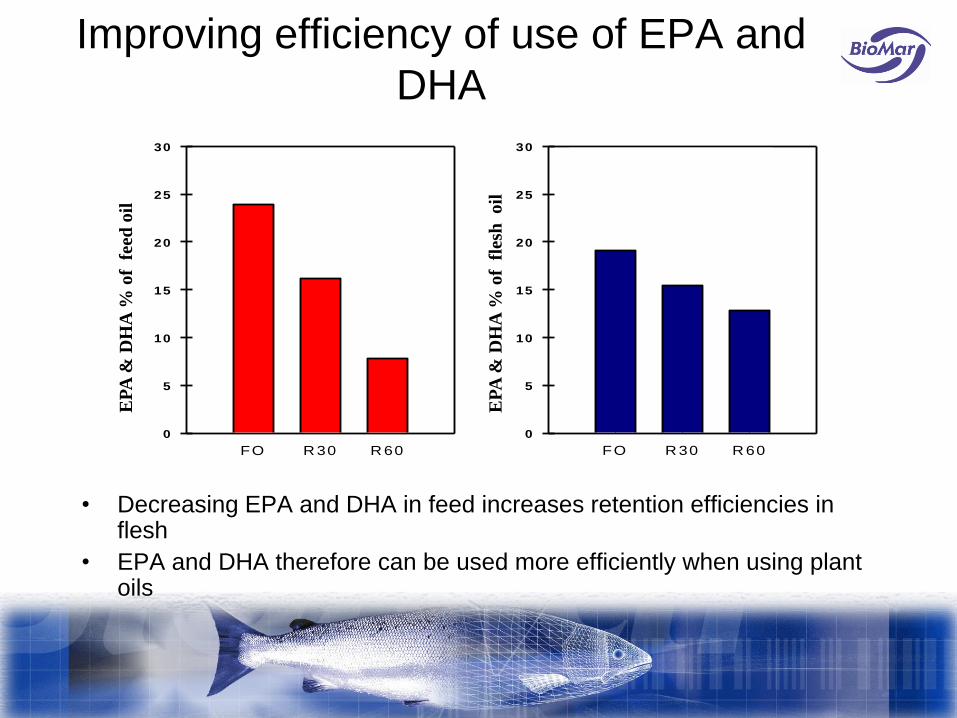
Improving efficiency of use of EPA and
DHA
• Decreasing EPA and DHA in feed increases retention efficiencies in flesh
• EPA and DHA therefore can be used more efficiently when using plant oils
FO R 30 R 60
EP
A+
DH
A,
% a
v f
ett
sy
rer
0
5
10
15
20
25
30
EPA+D H A i fôr
FO R 30 R 60
EP
A+
DH
A,
% a
v f
ett
sy
rer
0
5
10
15
20
25
30
EPA+D H A i fisk
EP
A &
DH
A %
of
fee
d o
il
EP
A &
DH
A %
of
fle
sh o
il

Fish oil, vegetable oils and EPA and
DHA|
• Only very modest replacement of fish oil with vegetable
oil has taken place in Scotland
• Scottish salmon therefore contains high levels of EPA and
DHA (approx 16% of fillet fat)
• Global supply of fish oil / EPA and DHA becoming critical
• We use far more than other salmon producing countries /
tonne of fish produced
• Unlike fishmeal this is not a nutritional challenge but a
market driven development

Current raw material use and comparison
of Scotland to Norway, Chile and
Canada

Current estimated raw material inclusion (weighted average
of all products) in different salmon farming regions
23
24
36
4
13
45
25
17
13
23
15
34
15
13
19
12
21
21
11
3
13
17
12
24
22
48
13
0%
10%
20%
30%
40%
50%
60%
70%
80%
90%
100%
% in
clu
sio
n
Scotland
standard
Scotland LR Norway Chile Canada
Country / feed type
Starch sources
Poultry oil
Vegetable oils
Land animal proteins
Vegetable proteins
Fish oil
Fishmeal
Total Marine
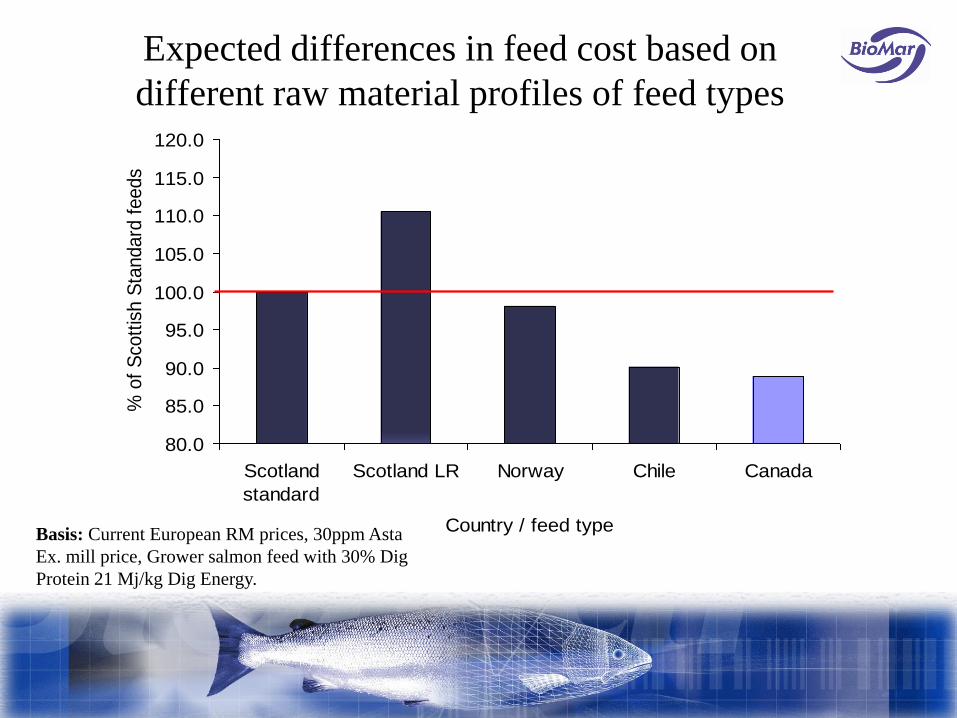
Expected differences in feed cost based on
different raw material profiles of feed types
80.0
85.0
90.0
95.0
100.0
105.0
110.0
115.0
120.0
Scotland
standard
Scotland LR Norway Chile Canada
Country / feed type
% o
f S
cott
ish S
tandard
feeds
Basis: Current European RM prices, 30ppm Asta
Ex. mill price, Grower salmon feed with 30% Dig
Protein 21 Mj/kg Dig Energy.

Current raw material use and comparison of
Scotland to Norway, Chile and Canada
• Main difference between Scottish feeds (non Label Rouge)
and Norwegian feeds is the higher use of fish oil in
Scotland
• Main difference between Chilean and Canadian salmon
feeds and European feeds is the use of land animal proteins
and oil, principally poultry meal, feather meal, bloodmeal
and poultry oil
• Considering above currently feed price will be ± 10% from
typical Scottish feed price
Comparison to other species e.g.
Tilapia

Tilapia Grower feed in relation to Scottish
salmon feed
23
24
36
4
13
2.52
41.5
10
9
35
0%
10%
20%
30%
40%
50%
60%
70%
80%
90%
100%
% in
clu
sio
n
Scotland standard Tilapia Grower
Feed type
Starch sources
Poultry oil
Vegetable oils
Land animal proteins
Vegetable proteins
Fish oil
Fishmeal

Comparison to other species e.g. Tilapia
• Tilapia only have a small requirement for marine raw
materials (approximately 6% total fishmeal and fish oil)
• Tilapia feeds lower in protein (32%) and energy
(15.5MJ/kg)
• Tilapia utilize carbohydrate as energy source also hence
higher level of starch sources (wheat, corn, sorghum)
• Feed cost approximately 50% of salmon feed
• Commercial FCRs 1.9 (Tilapia) vs. 1.2 (salmon)
• No requirement to achieve a flesh EPA and DHA level
Summary
• Fishmeal levels have decreased overtime, further decreases are possible depending upon knowledge and price
• A far bigger challenge is the use of Fish oil. We use far more fish oil / tonne of salmon in Scotland compared to all other salmon rearing countries, this is market driven not a nutritional requirement
• Use of LAPs of course gives Chile and Canada a major benefit in feed and hence production costs
• Scottish Salmon feeds are much higher in marine raw materials compared to feeds for other species such as Tilapia
• Differentiation in both feeds and salmon products has been far quicker in the UK than elsewhere, an important part of this has been healthy eating (EPA and DHA) and sustainability (choice of raw materials in particular marine raw materials)
• How do we continue to differentiate but deal with important issues like our fish oil use?