feeding the future: how to meet the challenge - march...
TRANSCRIPT

Feeding the future:
How to meet the challenge
CMAA International Cocoa Conference
13th March 2015 │ Miami, Florida

2
Six key global developmental challenges confronts us this century
I believe that there are six key developmental challenges that confront all of us this century:
Food security
Water security
Energy security
Impact of climate change
Sustainable growth
Inclusive growth

3
Agri-sector comprises a huge global market: US$5.9 trillion inproduction value with attractive growth prospects. Olam currently participates in 26% of this addressable market
Eth
anol
Bio
die
sel
DAP
Oilseeds
Biofuels
Fertiliser
Ure
aN
PK
CAGR(07-11)* 8.0% 11.4% 10.3% 13.8% 4.5% 15.5% 8.4%
Olam’s current participation

4
Food security defined
Food SecurityAvailability Accessibility
Adequacy
Affordability
• Logistics (storage, transport and distribution) to ensure access to food for all people –both during normal times and emergencies
• Pricing of food and purchasing power of households
• Quantity (sufficient amount of various nutrition components –energy, protein etc) and quality of food (safe, nutritious…)
• Addresses the ‘supply side’ of food security at the national-level
- Domestic production- Net trade- Food Aid
1
2
3
4
5
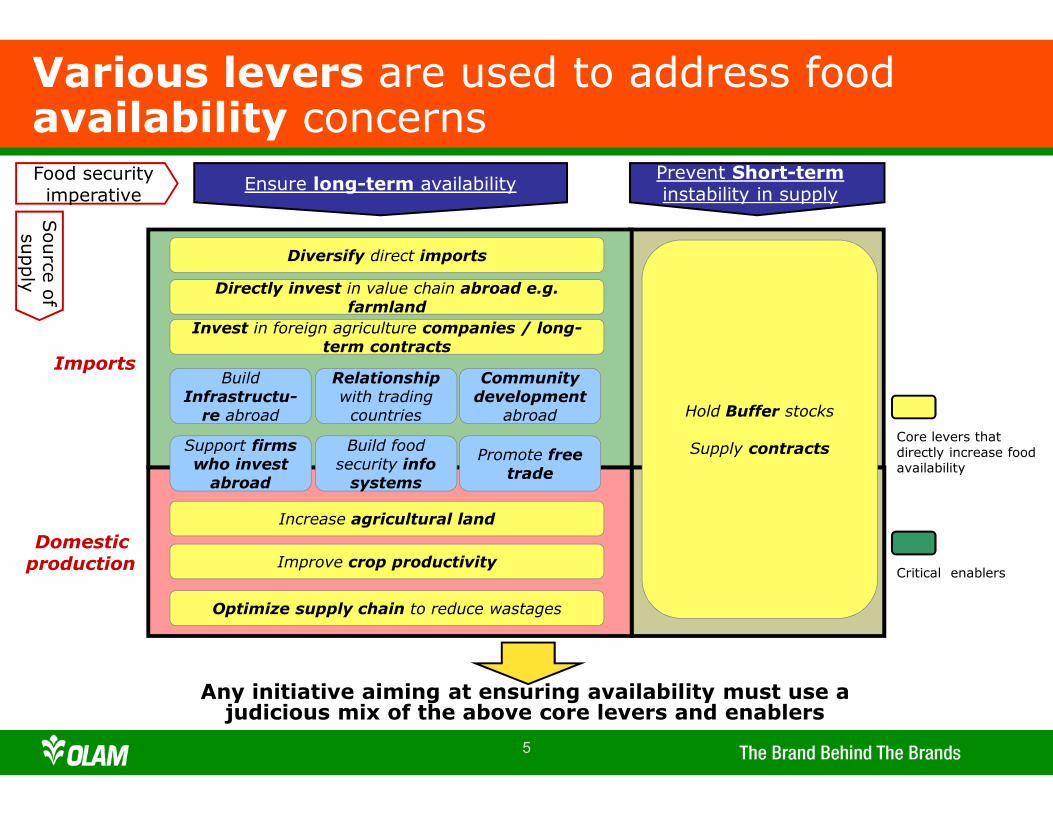
availabilityterm -longEnsure
Imports
Domestic production
Prevent Short-term instability in supply
Food security imperative
Source o
f su
pply
Directly invest in value chain abroad e.g. farmland
Invest in foreign agriculture companies / long-term contracts
BuildInfrastructu-re abroad
Relationship with trading countries Hold Buffer stocks
Supply contracts
Increase agricultural land
Improve crop productivity
Optimize supply chain to reduce wastages
Diversify direct imports
Community development abroad
Support firms who invest abroad
Build food security info systems
Promote free trade
Core levers that directly increase food availability
Critical enablers
Any initiative aiming at ensuring availability must use a judicious mix of the above core levers and enablers
Various levers are used to address food availability concerns

6
Oct 2011FAO Food Price Index
(Oct 2011)Food Commodity Price Indices
(Oct 2011)
2008 & 2011 Food Price Inflation:Cyclical or secular / structural trend?
7
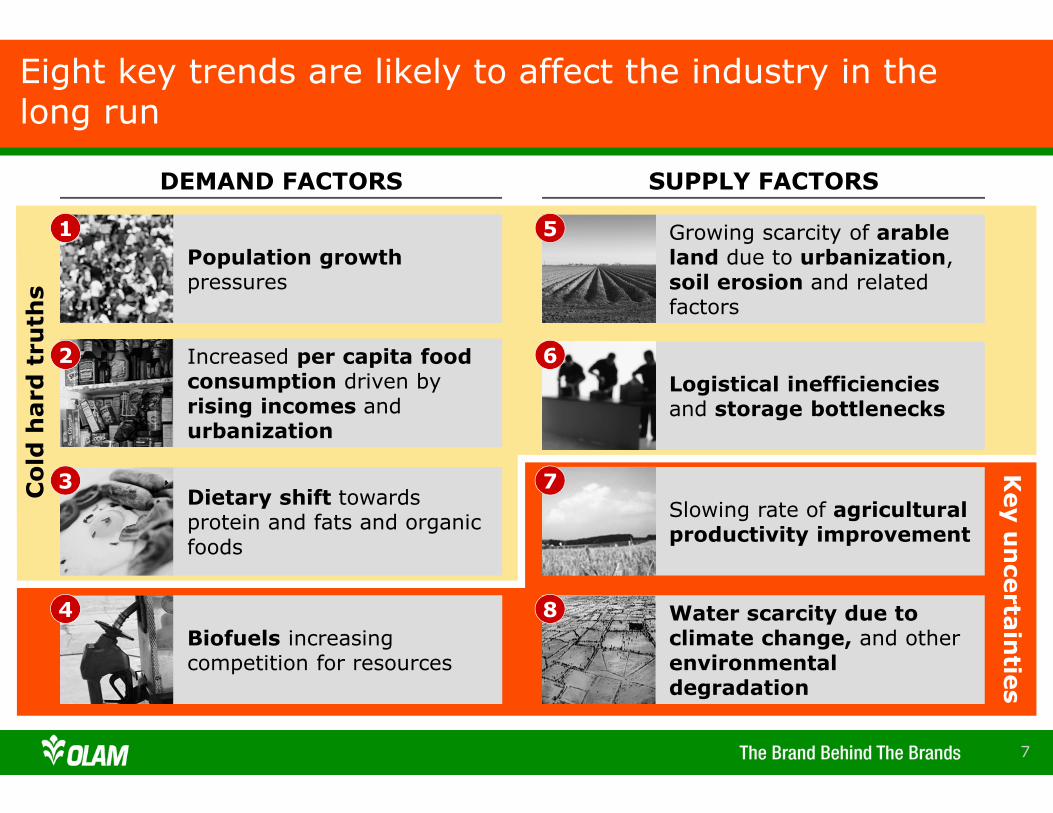
Eight key trends are likely to affect the industry in the long run
DEMAND FACTORS SUPPLY FACTORS
Population growth pressures
1
Increased per capita food consumption driven by rising incomes and urbanization
2
Dietary shift towards protein and fats and organic foods
3
Biofuels increasing competition for resources
4
Growing scarcity of arable land due to urbanization, soil erosion and related factors
5
Slowing rate of agriculturalproductivity improvement
7
Water scarcity due to climate change, and other environmental degradation
8
Logistical inefficienciesand storage bottlenecks
6
Cold hard truths
Key uncertainties

8 8
2.3x
1.2x
Asia & Africa will be the key regions to supply
Demand: Growing global population to increase overall consumption, particularly in developing markets

99
0.6%1.1%
0.4%
1979-81 1997-99
2015E 2030Ex 1997-
2030 CAGR
Demand: Rising income levels will result in increased food consumption and shift in dietary habits
HIGHER GDP/CAPITA CORRELATED WITH INCREASED CONSUMPTION
GROWTH IN MEAT CONSUMPTION MAINLY FROM DEVELOPING COUNTRIES
0
50
100
150
World
29
36 40 44
Developingcountries
12
25
32 36
Industrialcountries
80
88
96 100
Meat consumption (kg/capita)
2,000
3,000
4,000
0 20 40 60
Austria
Ireland
USA
Italy
UK
HK
Portugal
Korea
Taiwan
Turkey
2013 Per Capita GDP (USD K)
2013 Per capita daily calorie intake
FranceGermany
Canada
Spain
Greece
NZ
S. Arabia
Russia
Brazil
Mexico
Argentina
China
Malaysia
S. Africa
Peru
Thailand
Morocco
Indonesia
Philippines
Vietnam
Côte d'Ivoire
IndiaCambodia
Bangladesh
1010
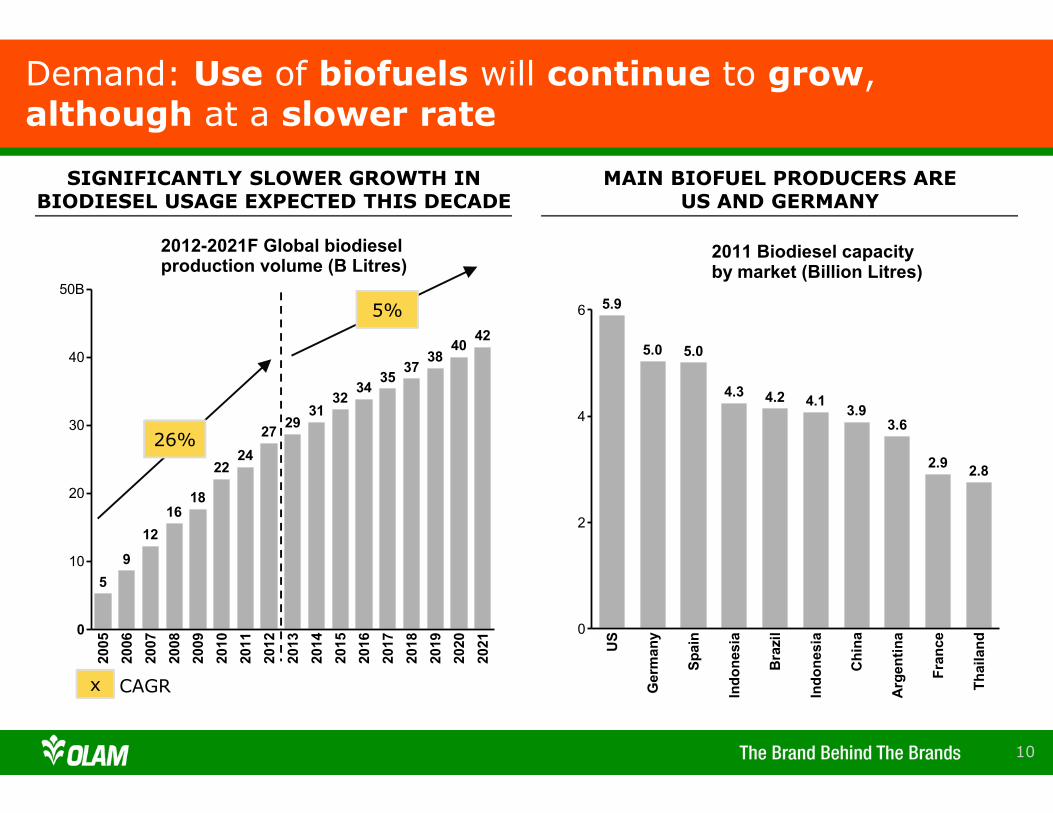
26%
5%
x CAGR
Demand: Use of biofuels will continue to grow, although at a slower rate
SIGNIFICANTLY SLOWER GROWTH IN BIODIESEL USAGE EXPECTED THIS DECADE
MAIN BIOFUEL PRODUCERS AREUS AND GERMANY
0
10
20
30
40
50B
2005
5
2006
9
2007
12
2008
16
2009
18
2010
22
2011
24
2012
27
2013
29
2014
31
2015
32
2016
342017
35
2018
37
2019
38
2020
40
2021
42
2012-2021F Global biodieselproduction volume (B Litres)
0
2
4
6
US
5.9
Germany
5.0
Spain
5.0
Indonesia
4.3
Brazil
4.2
Indonesia
4.1
China
3.9
Argentina
3.6
France
2.9
Thailand
2.8
2011 Biodiesel capacityby market (Billion Litres)

11
Biofuels: Feedstock used for biofuel production and quantity produced will affect demand for commodities
ADVANCEMENTS IN TRANSPORTATION INDUSTRY WOULD AFFECT DEMAND FOR BIOFUELS
HOW BIOFUEL IS PRODUCED IN FUTURE AFFECTS DEMAND FOR DIFFERENT TYPES OF COMMODITIES
Use of biofuels in aviation
Electrification of ground vehicles
Gen 1 Gen 1.5 Gen 2 Gen 3
Corn Sugarcane Crop Waste Algae
Accounts for 40% of biofuel production today
Full potential hindered by US Agri Policy & Europe climate
Technology is complex and costly
Technology still in infancy
Source of
biofuel
• Biofuels will continue to grow with increasing global mobility
• Electric vehicle uptake unlikely to displace biofuel demand
• Non-food feedstock unlikely to be commercialized at large scale in next 10 years, corn still most relevant in near term
What do we think will happen?
1212
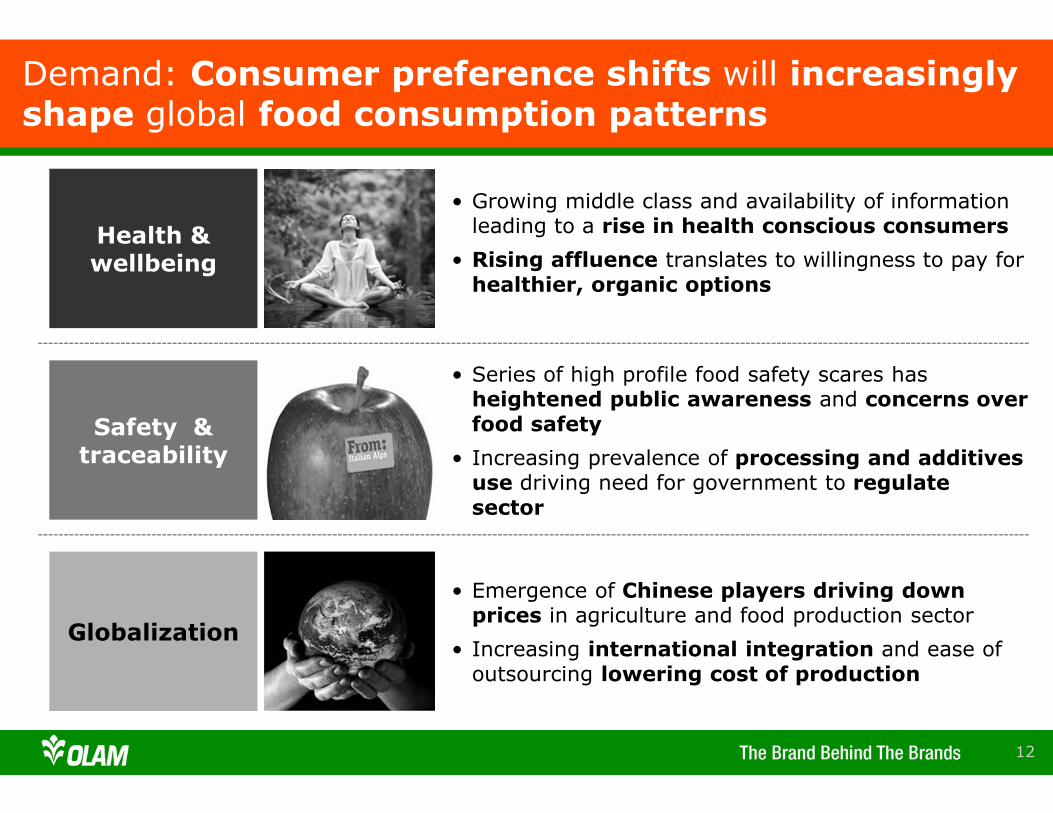
Globalization
Health & wellbeing
Safety & traceability
• Emergence of Chinese players driving down prices in agriculture and food production sector
• Increasing international integration and ease of outsourcing lowering cost of production
• Growing middle class and availability of information leading to a rise in health conscious consumers
• Rising affluence translates to willingness to pay for healthier, organic options
• Series of high profile food safety scares has heightened public awareness and concerns over food safety
• Increasing prevalence of processing and additives use driving need for government to regulate sector
Demand: Consumer preference shifts will increasingly shape global food consumption patterns

13
SustainableFood
Global agribusiness takes off
Sustainable Food: Today, market for organic commodities & fair trade is small but growing strongly
US LEADS ORGANIC FOOD MARKET BUT SHARE OF ORGANIC FOOD SMALL
HIGH GROWTH IN ORGANIC DEMAND EXPECTED TO
CONTINUE
RETAIL SALES OF FAIR TRADE PRODUCTS HAVE BEEN GROWING STEADILY
3x
Source: Organic Trade Association; Fair Trade International
Emergence of geneticengineering
Food Crisis
Green Revolution
1970 1980 1990 2000 2010 20141960
Organic Food Fair Trade
15%CAGR

14
Wealthier people, healthier diets: As incomes rise, dietary preferences become more sophisticated
What does this mean for us?
• How can we adapt our business to suit changing consumer food patterns?
• What do we need to be considered a responsible, fair and transparent partner?
Image
Healthier diets to combat “rich man” diseases
More of greens, whole grains, natural ingredients; Less of sugars, fats & processed
food
Image
Eating with social responsibilities in mind
Traceability of food products and responsible food production (e.g. fair trade) an increasing
concern
Image
Nutrition levels rising in emerging markets
Rice substituting inferior sources of nutrition (e.g. tubers and roots) in emerging markets
like Africa
1515
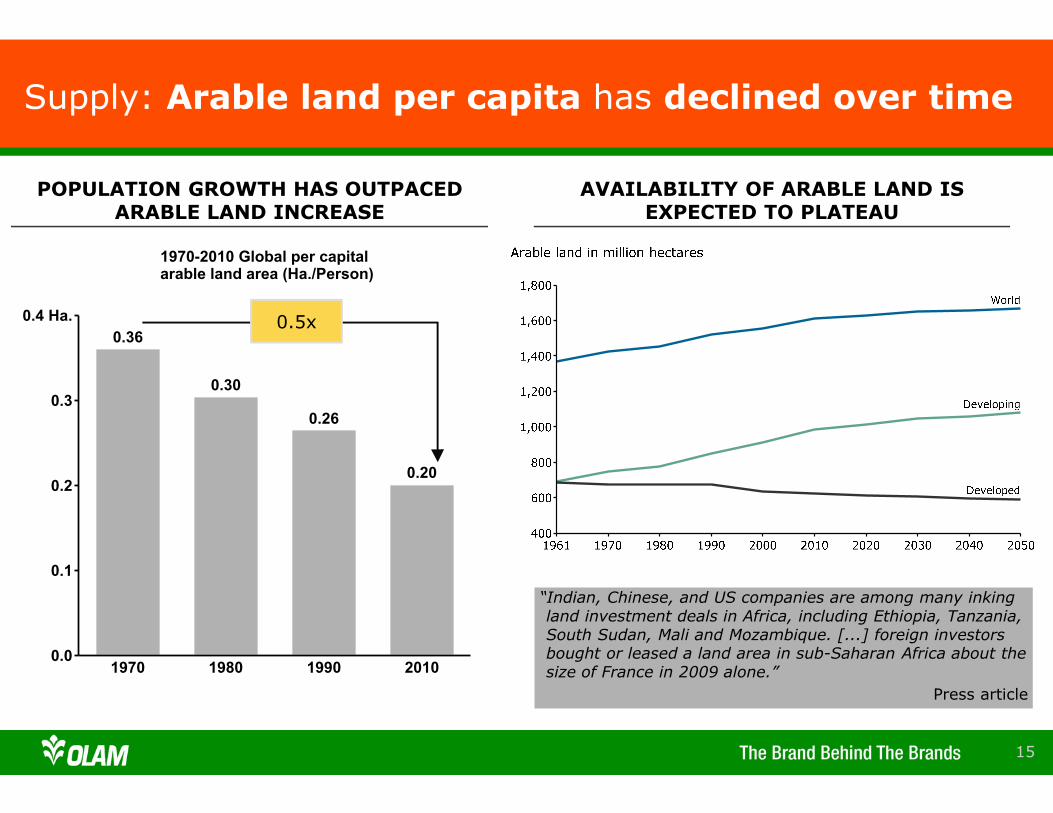
“Indian, Chinese, and US companies are among many inking land investment deals in Africa, including Ethiopia, Tanzania, South Sudan, Mali and Mozambique. [...] foreign investors bought or leased a land area in sub-Saharan Africa about the size of France in 2009 alone.”
Press article
Supply: Arable land per capita has declined over time
POPULATION GROWTH HAS OUTPACED ARABLE LAND INCREASE
AVAILABILITY OF ARABLE LAND IS EXPECTED TO PLATEAU
0.5x
0.0
0.1
0.2
0.3
0.4 Ha.
1970
0.36
1980
0.30
1990
0.26
2010
0.20
1970-2010 Global per capitalarable land area (Ha./Person)
1616
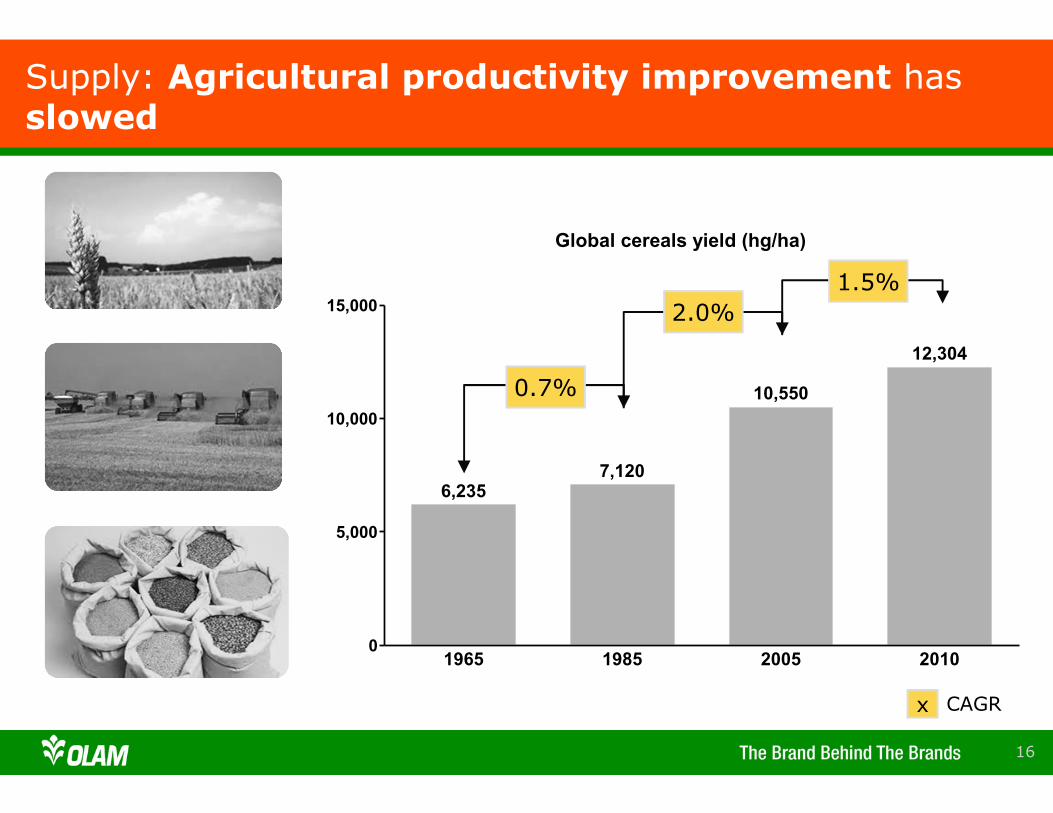
Supply: Agricultural productivity improvement has slowed
0
5,000
10,000
15,000
1965
6,235
1985
7,120
2005
10,550
2010
12,304
Global cereals yield (hg/ha)
0.7%
2.0%1.5%
x CAGR

17
Agricultural productivity: Slowdown in productivity improvement could be abated by tech advancements
AGRI PRODUCTIVITY IMPROVEMENT HAS STARTED TO SLOW DOWN…
…BUT TECH ADVANCEMENTS COULD UNLOCK NEW POTENTIAL IN PRODUCTIVITY
0.7%
CAGR
Big Data in the Fields
Image
Big Data to increasingly drive production decisions
as pioneered by Climate Corp
Farming with Robots
Image
Farmbots and drones to surpass manual labor, boosting
field efficiency
3D Printing of Food
Image
“Food cartridges” and “bioink” changes landscape of food processing and preparation
GM – the New Norm
Image
Breakthrough in commercialization of more GM
varieties
2.0%1.5%
• Emerging players that digitalize their supply chain earlier on will catch up quickly
• Both private and public sectors will see investments in technology as a means to resolving scarcity
• High level of uncertainty dependent on technological breakthrough
What do we think will happen?
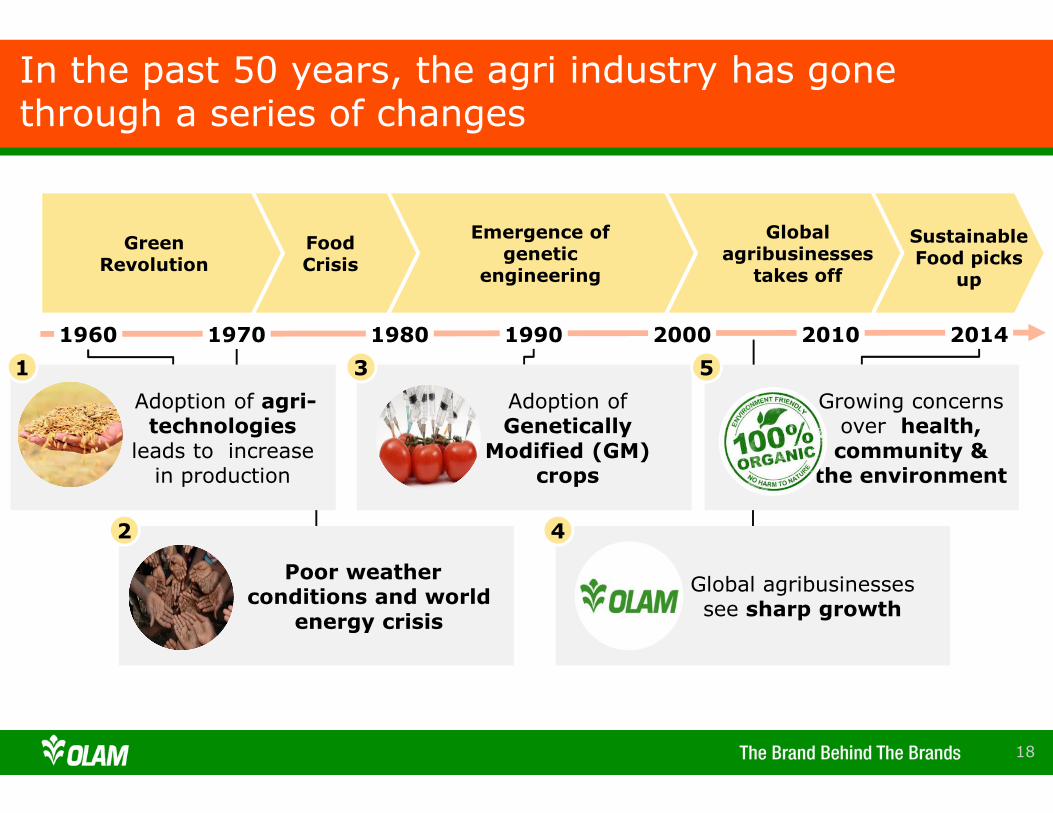
18
Poor weather conditions and world
energy crisis
2
Global agribusinesses see sharp growth
4
In the past 50 years, the agri industry has gone through a series of changes
Global agribusinesses
takes off
Emergence of genetic
engineering
Food Crisis
Green Revolution
1970 1980 1990 2000 2010 2014
Sustainable Food picks
up
1960
Adoption of agri-technologies
leads to increase in production
1
Adoption of Genetically
Modified (GM) crops
3
Growing concerns over health, community &
the environment
5

19
Green Revolution: Production boomed in the 60s due to improved yields and agri technology
Source: Land Commodities Research
Green Revolution led to spike in growth
Green Revolution led to spike in growth
Sustainable Food
Global agribusiness takes off
Emergence of geneticengineering
Food Crisis
Green Revolution
1970 1980 1990 2000 2010 20141960
HYV seeds Fertilizers Irrigation
+ +

20
Sustainable Food
Global agribusiness takes off
Food Crisis: Production shortfalls in 1970s caused record food prices
0
100
200
300
400
FAO Food Price Index (1990 = 100)
1961 1971 1981 1991 2001 2010Source: FAO
EARLY ’70S MARKED BY PRODUCTION SHORTFALLS
• Unfavorable weather conditions in major food producing countries
- E.g. Prolonged droughts in Sahel countries in Africa
• Energy crisis resulting in spike in cost of petroleum-based inputs
- Fertilizer prices tripled in 1973
LEADING TO SOARING FOOD PRICES
Emergence of geneticengineering
Food Crisis
Green Revolution
1970 1980 1990 2000 2010 20141960
21
Sustainable Food
Global agribusiness takes off
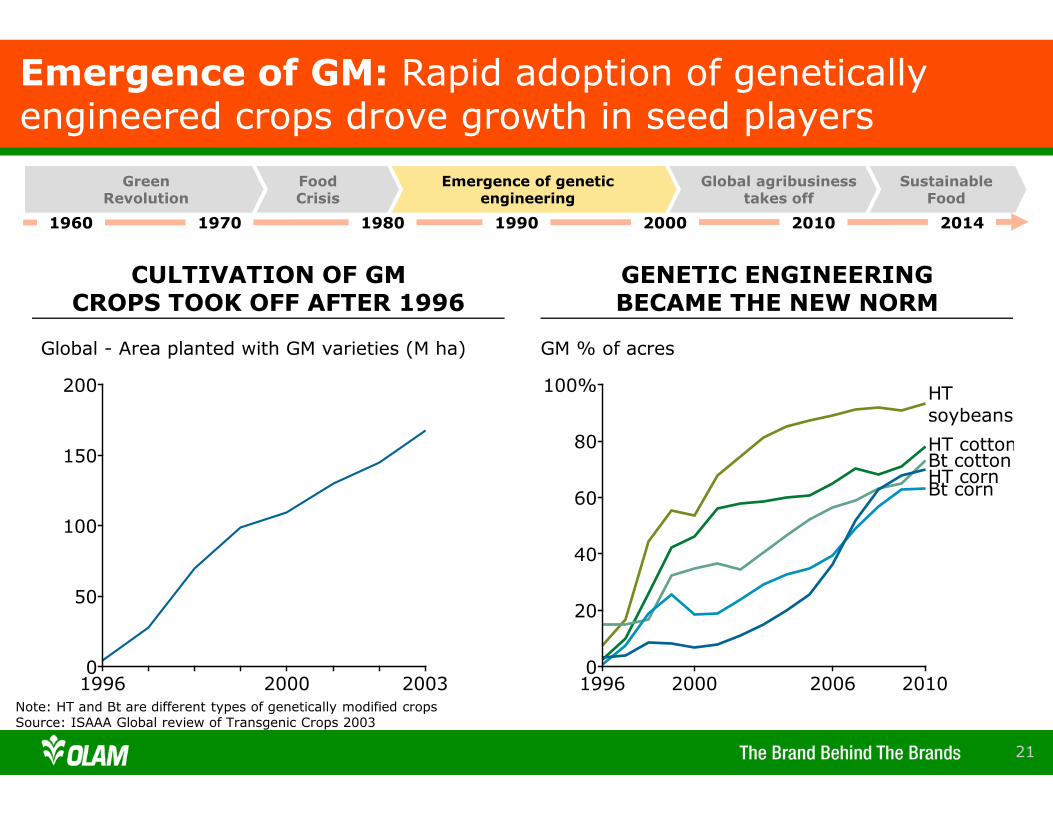
Emergence of GM: Rapid adoption of genetically engineered crops drove growth in seed players
0
20
40
60
80
100%
GM % of acres
HTsoybeans
Bt corn
1996 2000 2006 2010
HT cottonBt cottonHT corn
Note: HT and Bt are different types of genetically modified cropsSource: ISAAA Global review of Transgenic Crops 2003
CULTIVATION OF GM CROPS TOOK OFF AFTER 1996
GENETIC ENGINEERING BECAME THE NEW NORM
0
50
100
150
200
Global - Area planted with GM varieties (M ha)
1996 2000 2003
Emergence of geneticengineering
Food Crisis
Green Revolution
1970 1980 1990 2000 2010 20141960

2222
Supply: Adverse weather conditions and climate change have resulted, and may result, in supply shocks

23
Climate change & Water scarcity: Natural environment will be increasingly challenging
Source: US Dept of Energy; IPCC
Worst case
High emission levels
Best case
Low emission levels
“If carbon emissions not curbed, half the world will be living under extreme water scarcity”
“If carbon emissions not curbed, half the world will be living under extreme water scarcity”
(KM3)
Degree of climate change will affect global
temperatures & water scarcity
Water for irrigation also challenged by water
demand for urbanization
• Environmental degradation and water scarcity will persist; agri production will become more challenging
• Greater global emphasis on reducing carbon footprints; however coordinated efforts across countries expected to remain difficult
What do we think will happen?

24
By 2025, 36 countries, home to 1.4B peoplewill be affected by water scarcity
Source: National Intelligence Council, Global Trends 2025: A Transformed World International, 2008
Physical water scarcity: More than 75% of river flows are allocated to agriculture, industries, or domestic purposes. This definition of scarcity – relating water availability to water demand – implies that dry area are not necessarily water-scare.
Approaching physical water scarcity: More than 60% of river flows are allocated. These basins will experience physical water scarcity the near future.
Economic water scarcity: Water resources are abundant relative to water use, with less than 25% of water from rivers withdrawn for human purposes, but malnutrition exists.
Little or no water scarcity: Abundant water resources relative to use. Less than 25% of water from rivers is withdrawn for human purposes.
Not estimated

25
Many of the largest rivers in the Himalayas Hindu Kush region are strongly dependent upon snow and glacial melt for waterflow.Indeed, some scenarios suggest a 20–90% increase in annual flow due to glacial reduction, followed by a 10–40% decline, as glaciers and snow fall below critical thresholds for functions as water towers in 2050–2100. Combined with possible extreme precipitation events, this may result in greater seasonal droughts, and damage from floods. (Source: Rees and Collins, 2004; UNEP, 2007).
Impact of Climate Change
2626
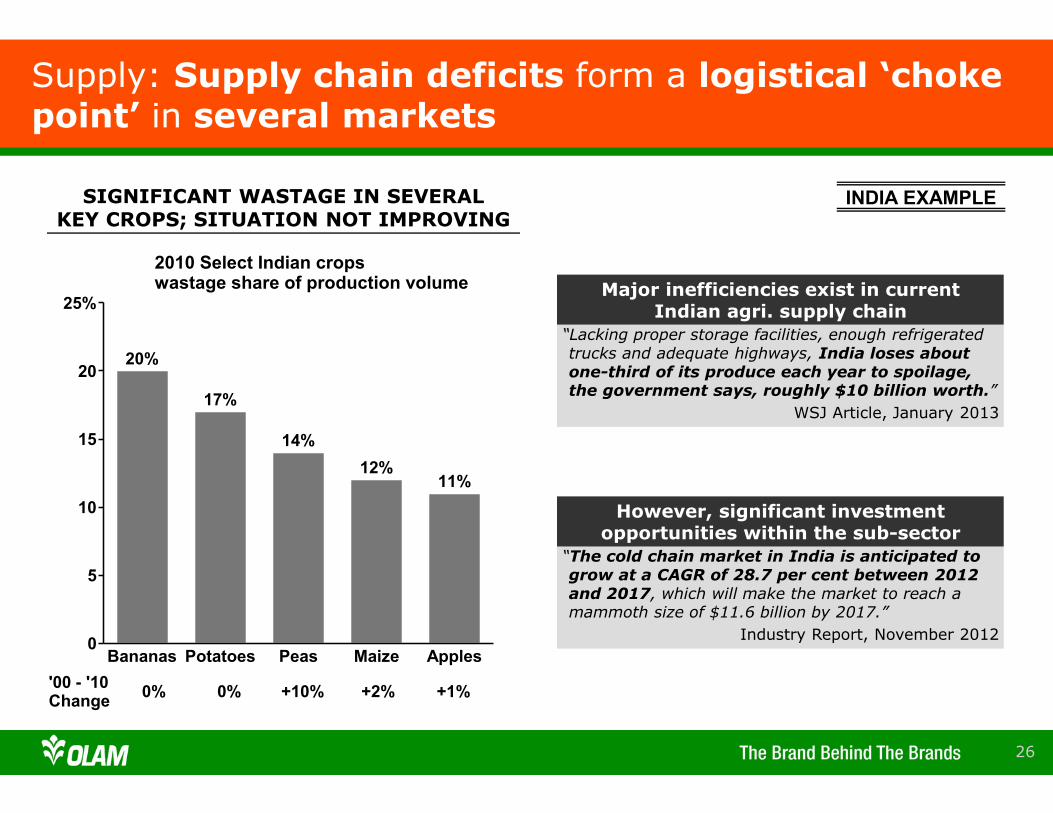
“Lacking proper storage facilities, enough refrigerated trucks and adequate highways, India loses about one-third of its produce each year to spoilage, the government says, roughly $10 billion worth.”
WSJ Article, January 2013
INDIA EXAMPLE
Major inefficiencies exist in currentIndian agri. supply chain
“The cold chain market in India is anticipated to grow at a CAGR of 28.7 per cent between 2012 and 2017, which will make the market to reach a mammoth size of $11.6 billion by 2017.”
Industry Report, November 2012
However, significant investment opportunities within the sub-sector
SIGNIFICANT WASTAGE IN SEVERALKEY CROPS; SITUATION NOT IMPROVING
Supply: Supply chain deficits form a logistical ‘choke point’ in several markets
0
5
10
15
20
25%
Bananas
20%
Potatoes
17%
Peas
14%
Maize
12%
Apples
11%
2010 Select Indian cropswastage share of production volume
0%0% +10% +2% +1%'00 - '10Change

27
Agri-sector will require significant investment
over the long-term
Agri-sector will require significant new investment estimated at US$200B every year over the next ~ 40 years to meet growing demand

2828
Supply: A 40% increase in global supply required to meet future demand for key staple grains
Total =

29 29
% change
Yieldlevers
Areaharvestedlevers
Supply: With limited supply of new land, all available levers will have to be used to increase production

30
Four possible scenarios for 2040Supply structure
Demand/Supply BalanceScarcity Over supply
Supply sources today
Commodities Revolution
Tech Disruption
World in Imbalance
Today is Tomorrow
New supply sources

31
Q&A

32
Thank You