fem modeling and weight reduction of a solar energy driven
TRANSCRIPT

Acta Technica Jaurinensis
Vol. 8, No.4, pp. 296-311, 2015 DOI: 10.14513/actatechjaur.v8.n4.385
Available online at acta.sze.hu
296
FEM Modeling and Weight Reduction of a Solar Energy Driven Racing Car Chassis
L. Fehér, J. Égert
Department of Applied Mechanics, Faculty of Mechanical Engineering Information Technology and Electrical Engineering
Széchenyi István University 9026 Győr 1 Egyetem tér, Hungary
[email protected], [email protected]
Abstract: The paper demonstrates the strength analysis of a solar energy driven racing car chassis with two different mechanical modeling, beam-bar and shell modeling. Weight reduction is also a key point in the stages of car design. Reducing the weight of the car results in higher fuel efficiency and usually better dynamical properties. The weight reduction was performed with three different materials, steel, aluminium-alloy and laminated fibre reinforced composites. The paper shows the complete mechanical modeling process from construction of the mechanical model to the analysis of the laminated composite chassis structure and the results of the weight reduction.
Keywords: car chassis, steel, aluminium-alloy, fibre reinforced composite, strength analysis, FEM, weight reduction
1. Introduction
The investigated car was designed by the SZEnergy team (SZEnergy is a students’ team for solar car development at Széchenyi István University) for the Shell Eco Marathon race series. The aim of the Shell Eco Marathon competition is to achieve the lowest fuel consumption. Fuel efficiency is one of the most important points in car design not only at this competition but also in general in car manufacturing. There are many international regulations in the vehicle industry to limit the emission of carbon dioxide. A higher efficiency of fuel consumption is not only advantageous for the drivers’ budget but also beneficial for the environment. This parameter depends on a lot of things (car weight, air-drag, type of combustion engine, etc.). The paper deals only with one aspect, the weight reduction.
There is a famous saying by Colin Chapman who was a car designer and builder. He said “Adding power makes you faster on the straights. Subtracting weight makes you faster everywhere.” [14] This principle also works in the Eco Marathon race series but in this case it sounds like this: Subtracting weight makes you save fuel everywhere.

L. Fehér and J. Égert – Acta Technica Jaurinensis, Vol. 8, No. 4, pp. 296-311, 2015
297
The main goal of the analysis was to determine the stress distribution in the chassis and therefore to reduce the weight of the racing car [1]. The investigation concentrated on the chassis because it is one of main parts of the car and it represents a considerable part of its mass. Three different materials and two different mechanical models were used to analyse the structure and to realize the weight reduction. The paper also examines in detail the determination of the critical load cases and it describes the results of stress analysis and weight reduction.
2. Geometry and load cases
2.1. Layout of the solar racing car
The investigated solar car was designed for the Urban Concept category in the Shell Eco Marathon race. The racing car has a traditional car layout, a car body and a chassis separately [2]. The solar cells were fixed on the car body.
The geometry of the chassis under the car body was available from the SZEnergy students’ design team (Fig. 1.). The chassis carries all the loads and holds all other parts together. It is a welded beam-bar structure with closed thin-walled square and circle profiles (Fig. 1.). The weight of the original chassis geometry (Fig. 1.) was 55.6 kg for steel, 19.2 kg for aluminium alloy and 7.17 kg for laminated fibre reinforced composite material.
Figure 1. The geometry of the investigated chassis

L. Fehér and J. Égert – Acta Technica Jaurinensis, Vol. 8, No. 4, pp. 296-311, 2015
298
2.2. Basic and critical load cases
For the stress analysis two different mechanical models were built and during the mechanical modelling only the chassis was considered. First the critical loads were determined which are acting on the structure during different driving manoeuvres. Two groups of loads were defined. The basic load cases (BL) is the first group which consist of elementary load parts and the other is the critical load cases (CL) which give the starting point for the dimensioning of the car chassis. The mechanical problem is linear therefore the critical loads can be built up as a superposition of basic loads.
The basic load cases group consist of seven basic load sets. These are the following:
BL1 dead weight of the chassis and other parts, BL2 body forces from longitudinal acceleration at emergency braking, BL3 body forces from lateral acceleration at turning with full speed, BL4 moments from the front wheels at braking, BL5 forces from the driver at braking, BL6 loads from the acceleration of non-braked rear wheels, BL7 moments from the wheels at turning.
From the loading point of view three critical situations can occur during the race. These critical situations can be characterised by the superposition of basic load sets:
CL1 emergency braking: BL1 + BL2 + BL4 + BL5 + BL6, CL2 turning with full speed: BL1 + BL3 + BL7, CL3 emergency braking at turning with full speed:
BL1 + BL2 + BL3 + BL4 + BL5 + BL6 + BL7.
BL1 - Loads from the dead weight of the chassis and other parts
This load case originates from the weight of the car with every coupled part and from the body of the driver. It is determined by the acceleration of gravity g and the mass
density of each component. The mass density values are for steel 37820 kg/ms ,
for aluminium alloy 32 700 kg/ma and for the composite material 31200 kg/mc . This body force loading occurs in every critical load cases.
BL2 - Body forces from longitudinal acceleration at emergency braking
The maximum acceleration Sma (negative value) appears during the race at
emergency braking. Only the front wheels of the car are supposed to be braked so the
Sma maximum deceleration is determined by the slip point of the front wheels. This
Sma maximum deceleration is caused by the tangential coordinate of EF
reaction force
(Fig. 2.). Newton's second law and the principle of conservation of angular momentum are used to determine this Sma maximum deceleration:
0
En cb
F m ga b c
(1)

L. Fehér and J. Égert – Acta Technica Jaurinensis, Vol. 8, No. 4, pp. 296-311, 2015
299
where EnF is normal reaction force on the front wheels, a, b, c are geometric data of
the car, cm is the mass of the car (Fig. 2.), 0 is the coefficient of static friction and g
is the acceleration of gravity. Using equation (1) and Newton's second law the Sma
maximum deceleration is
00
0
Et EnSm
c c
F F ba g
m m a b c
. (2)
In formulas (1) and (2) a static friction 0 0 9. was considered as the upper limit of
the real kinetic friction. The maximum deceleration values are for steel chassis 23 75 m/sSma . , for aluminium chassis 23 53 m/sSma . and for composite chassis 23 47 m/sSma . .
Figure 2. Geometric data and reaction forces in the slide point of the front wheels at braking
BL3 - Body forces from lateral acceleration at turning with full speed
At turning with full speed considerable body forces work on the car and all other coupled parts. They come from the lateral acceleration at turning with full speed. In this manoeuvre two possible critical events can occur. These are the turning-over and the sliding of the car. These two critical events cannot occur at the same time. The lateral accelerations were determined for both situations and two different values were obtained. From these the lower critical lateral acceleration value causes the real situation, which occurs first.
Figure 3. Geometric data and reaction forces in the slide point of the wheels at turning
A S B
a bcm g
c Smm a
EF
EnF
c
HEtF
EHF
y
z
x
z
S c S cT m a
cm g
JF
t
1t 2t
c
B J
SDC
BF
00

L. Fehér and J. Égert – Acta Technica Jaurinensis, Vol. 8, No. 4, pp. 296-311, 2015
300
Only the sliding event is shown because it happens first. Newton's second law was used to determine the Sca maximum side-slip lateral acceleration. It was assumed that
both wheels slide at the same time (Fig. 3.)
Bn Jn cF F m g (3)
0 0c Sc Bt Jt Bn Jn cm a F F ( F F ) m g (4)
where Sca is the maximum lateral acceleration, Bt JtF ,F are the tangential reaction
forces in lateral direction on the left and right side, Bn JnF ,F are the normal reaction
forces. In formulas (3) and (4) a static friction 0 0 9. was also considered as the
upper limit of the real kinetic friction.
From equations (3), (4) the maximum lateral acceleration is
20 8 83 m/sSca g . . (5)
BL4 - Moments from the front wheels at braking
At braking the tangential coordinate of the EF
reaction force (Fig. 2.) causes a torque
on the front axle. This torque can be determined by the following formula:
00
02 2 2w w w
ct Et En cd d b d
M F F m g( a b c )
, (6)
where 558 mmwd is the outside diameter of wheel, a, b, c are the dimensions of the
centre of gravity S of the car, 0 0 9. is coefficient of static friction, g is the
gravitational acceleration. The torque on the front axle are 141 NmctM for steel
chassis, 115 NmctM for aluminium alloy chassis and 110 NmctM for composite
chassis.
BL5 - Forces from the driver at braking
At braking the driver pushes the brake pedal and this activity causes a reaction force in the driver’s seat as well. This load was modelled with two concentrated forces. One force acts on the driver’s seat console and the other acts on the mounting point of the brake pedal. This force was determined by measurement and its magnitude is 500 N.
BL6 - Loads from the acceleration of non-braked rear wheels
At emergency braking tangential forces originate from the rear wheels. The total
tangential coordinate of aF
force (Fig. 4.) can be determined from the principle of
conservation of angular momentum:
3
2at w SmF m a (7)

L. Fehér and J. Égert – Acta Technica Jaurinensis, Vol. 8, No. 4, pp. 296-311, 2015
301
where wm is the mass of the wheel, Sma is the maximum deceleration.
Figure 4. Forces on the rear non-braked wheel at emergency braking
The translational motion part of tangential coordinate atF of aF
force was considered
in BL2 load case. Thus the load from non-braked rear wheels deceleration at emergency braking is
3 1
2 2at at at w Sm w Sm w SmF F F m a m a m a , (8)
where atF is the total part of tangential coordinate and atF is the translational motion
part of tangential coordinate of the aF
force. In the analysis only aluminium alloy
wheel-discs were considered with the mass of 8 41 kgwm . . Therefore the additional
force is 15 77 NatF . for steel chassis, 14 84 NatF . for aluminium alloy chassis
and 14 59 NatF . for composite chassis.
BL7 - Moments come from turning loads
Bending moments in the front and rear axles come from the lateral forces when the car is turning. These bending moments were determined from the critical lateral forces
BtF and BtF (Fig. 3.).
The four wheels were loaded with different bending moments, because the force values are different on the four wheels. These bending moments could be calculated with the following formulas:
2 00 02 2
w wLFy LFn c
d d t cbM F m g
a b t
, (9)
2 00 02 2
w wLSy LSn c
d d t caM F m g
a b t
, (10)
0 10 02 2
w wRFy RFn c
d d c tbM F m g
a b t
, (11)
0 HF
0
wm
Sw Smm a
wm gR
H aF
atF
z
y

L. Fehér and J. Égert – Acta Technica Jaurinensis, Vol. 8, No. 4, pp. 296-311, 2015
302
0 10 02 2
w wRSy RSn c
d d c taM F m g
a b t
, (12)
where L index means the left side of the car, R index means the right side of the car, F index is for the front wheels of the car, S index is for the rear wheel of the car,
558 mmwd is the outside diameter of the tyre, a, b are the coordinates of the centre
of gravity of the car, 0 0 9. is coefficient of static friction, g is the gravitational
acceleration and cm is the mass of the car.
3. FEM modelling of the chassis
The finite element method (FEM) was used for the stress analysis. For the analysis two types of mechanical models of chassis were applied: a simple beam-bar model and a more complex shell model [12].
The beam-bar model consists of beam-bar elements modelled by their central lines and additional concentrated mass elements that are modelling the effect of the other parts of the car. From these additional mass elements the chassis obtains further loading,
weight G mg
and body forces T ma
.
Figure 5. The FEM beam-bar model with additional masses and boundary conditions
At the wheels the chassis is supported by spring elements that are modelling the elastic support of the wheels. The spring coefficients xc , yc and zc are different in
reality. The coefficient zc could only be determined by measurement (Fig. 6.) and the
same value 36 10 mm/Nzc was applied for the tangential coefficients xc and yc .
x
zc
akkumke felfm m
kom
2 2v üm m
2 2v üm m
3km
1km
ke mm m
ke mm m
2km
1km
2km
zy
2 2v üm m
3km
3km
ke felfm m
xc
xc
yc
yc
zc
zc
zc
zc

L. Fehér and J. Égert – Acta Technica Jaurinensis, Vol. 8, No. 4, pp. 296-311, 2015
303
Figure 6. Measurement of the spring coefficient zc
The beam-bar model can only be applied to analyse of the chassis made of steel and aluminium alloy because the traditional beam and bar elements cannot model thin walled laminated beam-bar structures.
The chassis made of laminated fibre reinforced composite material can be modelled by laminated orthotropic shell elements. As mentioned before the chassis is built up of thin walled closed profile beams. For the shell model the beams of the chassis are modelled with their outer surfaces. The wall thickness and the number of layers were design parameters. The shell FEM model and the additional mass elements are shown in Fig. 7. The additional mass elements and the boundary condition were the same by the beam-bar FEM model.
Figure 7. The shell FEM model with additional mass elements
akkumke felfm m
kom
ke mm m
2 2v üm m
xyz
1km
3km
2 2v üm m
2km3km
1km
2km
ke mm mke felfm m

L. Fehér and J. Égert – Acta Technica Jaurinensis, Vol. 8, No. 4, pp. 296-311, 2015
304
In the laminated shell model two weave types (plain weave and twill weave) of reinforcement were used for the two different laminated composite structures. The material properties of these two composites are shown in Table 2.
By composites it is very important to define the optimal fibre orientations and layer structures. In our models one composite layer’s thickness was 0.25 mm. The shell models were built from eight layers e.g. 1.5 mm wall thickness and the warp fibre orientations were parallel to the beam-axes.
The von Mises equivalent stress theory was used to evaluate the strength analysis and to dimension for isotropic materials. The von Mises equivalent stress and the safety criterion are defined by (13)
2 2 2
0,2
1( )
2eq I II II III I III pvon Mises R , (13)
where I II III, , are principal stresses and 0,2pR is the yield stress of material.
Composites are not isotropic materials so they need different failure criteria then metals. In this analysis the Tsai-Wu failure criterion was applied (14). If the left side value is bigger than the one in the criterion, it means the starting point of the failure of the composite structure [3] [4]
22 21 2 12
1 2
1 1 1 1
T C T C T C T CX X Y Y X X Y Y S
2 2
23 131 2
1 11
T C T CS S X X Y Y
(14)
where identify the normal stress coordinates and identify the shear stress coordinates in the fibre direction coupled natural coordinate system 1x , 2x , 3x .
Directions 1x , 2x lie in the plane of layer and direction 1x shows the orientation of the
fibres. In the (13) Tsai-Wu criterion 1 2E E and 3E are Young moduli in direction 1, 2
and 3, 12 21 and 13 23 Poisson’s coefficients, 12G and 23 13G G are
independent shear moduli, T TX Y is the tension strength in direction 1 and 2,
C CX Y is the compression strength in direction 1 and 2, S is the shear strength and
is the mass density.
4. Results of FEM stress analysis
4.1. Results of beam-bar modeling
Laminated composite structures cannot be analysed with the usual beam-bar modelling so the following beam-bar computations were made only for these two homogeneous metal materials, i.e. steel and aluminium alloy.

L. Fehér and J. Égert – Acta Technica Jaurinensis, Vol. 8, No. 4, pp. 296-311, 2015
305
The beam-bar FEM analysis was performed with the material properties in Table 1. In the table E is the Young modulus, is the Poisson’s coefficient, 12G is the shear
modulus, 0 2p ,R is the yield stress and is the mass density of the material.
Table 1. Material properties of metal materials
Steel Aluminium alloy
MPaE 206800 72000
0.29 0.2963
MPaG 80155 27771.3
0 2 MPap ,R 250 280
3t/m 7.8210-9 2.710-9
The most important results of FEM strength analysis of beam modelling provide maximum von Mises equivalent stress distributions along the beams which can be used for the comparison of the three critical load cases and for the dimensioning of the chassis. The maximum equivalent von Mises stress distribution for the three critical load cases are shown for the aluminium alloy chassis in Fig. 7.-9. The character of maximum stress distribution is the same for the steel chassis as well, only the stress values are different.
(a) Longitudinal beams (b) Cross beams
Figure 7. Maximum von Mises stress distribution for the CL1 critical loading case (aluminium chassis)
The comparison of the three critical load cases CL1-CL3 showed that the CL3 is the most dangerous (Fig. 9.). In this complex critical load case the maximum equivalent von Mises stress is on the chassis 116 MPa for aluminium alloy and 135.78 MPa for steel. These maximum stress values occur in the same place. This is the front axle and the chassis connection area.

L. Fehér and J. Égert – Acta Technica Jaurinensis, Vol. 8, No. 4, pp. 296-311, 2015
306
(c) Longitudinal beams (d) Cross beams
Figure 8. Maximum von Mises stress distribution for the CL2 critical loading case (aluminium chassis)
(e) Longitudinal beams (f) Cross beams
Figure 9. Maximum von Mises stress distribution for the CL3 critical loading case (aluminium chassis)
From one part of the chassis the loads can pass over to other areas and this can cause local maximum values. The connection area is a small area and this causes these critical high values. But if the safety factor for case CL3 is calculated with both metal materials these show that the chassis fulfils the safety criterion (13) for both materials.
Using the (15) expression the n safety factor is 1.84 for steel material and 2.41 for aluminium alloy
0,2
max
p
eq
Rn
(15)
where 0 2p ,R is the yield strength and eqmax is the maximum equivalent stress value.
The safety factor values show that there is emergency reserve in both structures of metal materials. This fact enables the weight to be reduced, for example reducing the wall thickness of beams.

L. Fehér and J. Égert – Acta Technica Jaurinensis, Vol. 8, No. 4, pp. 296-311, 2015
307
Also an important task is to find the critical cross sections and critical points of the chassis. From the results of beam-bar modelling, shown in Fig. 7-9., the critical points and the critical cross sections of the chassis have been obtained. The results show good correlation between steel and aluminium-alloy so the places of critical points are the same for both metal structures. These critical points are assigned with numbers and they are shown in Fig. 10.
Figure 10. Critical points of the aluminium alloy chassis
4.2. Results of laminated shell modeling
The material and strength properties of applied composite materials are summarized in Table 2.
Table 2. Material properties of the applied composite material
Twill weave Plain weave
1 2E E [MPa] 35734 45514
3E [MPa] 3500 3500
12 21 [ - ] 0.07 0.06
13 23 [ - ] 0.35 0.35
12G [MPa] 2115 2722
23 13G G [MPa] 1296.3 1296.3
T TX Y [MPa] 321 562
C CX Y [MPa] 521 580
S [MPa] 23 26,3
[t/mm3] 1.1910-9 1.2310-9
L. Fehér and J. Égert – Acta Technica Jaurinensis, Vol. 8, No. 4, pp. 296-311, 2015
308
In Table 2. 1 2E E and 3E are Young moduli in direction 1, 2 and 3, 12 21 and
13 23 Poisson’s coefficients, 12G and 23 13G G are independent shear moduli,
T TX Y is the tension strength in direction 1 and 2, C CX Y is the compression
strength in direction 1 and 2, S is the shear strength and is the mass density.
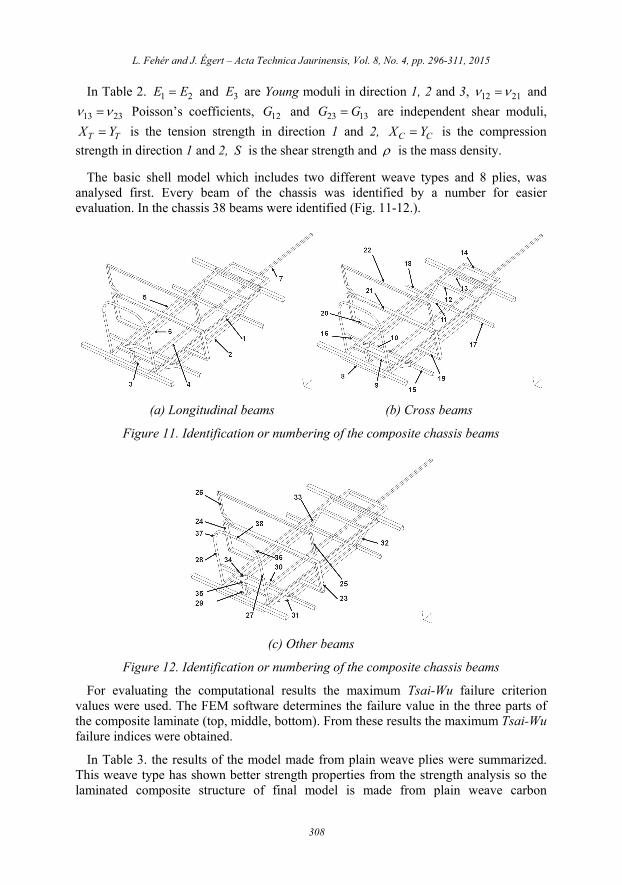
The basic shell model which includes two different weave types and 8 plies, was analysed first. Every beam of the chassis was identified by a number for easier evaluation. In the chassis 38 beams were identified (Fig. 11-12.).
(a) Longitudinal beams (b) Cross beams
Figure 11. Identification or numbering of the composite chassis beams
(c) Other beams
Figure 12. Identification or numbering of the composite chassis beams
For evaluating the computational results the maximum Tsai-Wu failure criterion values were used. The FEM software determines the failure value in the three parts of the composite laminate (top, middle, bottom). From these results the maximum Tsai-Wu failure indices were obtained.
In Table 3. the results of the model made from plain weave plies were summarized. This weave type has shown better strength properties from the strength analysis so the laminated composite structure of final model is made from plain weave carbon

L. Fehér and J. Égert – Acta Technica Jaurinensis, Vol. 8, No. 4, pp. 296-311, 2015
309
composite. As seen in Table 3. the Tsai-Wu failure indices are over one value in a lot of beams. This means these beams will fail in the given critical load case.
This case is not acceptable because the chassis cannot fail in any of the critical load cases. However (see Table 3.) the maximum failure index is much less than one in a lot of beams. This is also not an ideal case because this means that the beams are over-dimensioned. For the optimal chassis structure a homogeneous stress state has to be achieved, i.e., a homogeneous maximum failure index distribution should be realized.
The results of Table 3. were considered as the starting point for the construction of the laminated shell structure. In those beams where the failure index is greater than one the ply number has to be increased. The ply number could be decreased where the failure index is less than one. The chassis is a symmetrical structure and this fact was also considered in the laminate plies construction. As a result the beams with the same function on the right side and on the left side of the chassis were constructed with the same ply number.
Table 3. Values of failure criteria of plain weave composite chassis
The above computations showed that the shear-force is a dangerous internal force in lot of beams. Therefore, two plies with 45° warp orientation in the inner and outer side of the laminate structure were used in the beams where high shear-forces occur (see Fig. 13.). With this modification the following modified laminate plies structure was built up:
Beams with 2 plies: 4, 7, 10, 11, 14, 15, 16, 22, 27, 28, 30, 35, 36, 37, 38
Beams with 3 plies: 31, 34,
Beams with 4 plies: 12, 17, 18,
Beams with 5 plies: 29, 32, 33
Beams with 6 plies: 3, 8, 9 45°
Beams with 8 plies: 1, 5, 2, 6, 23, 24, 25, 26 45°
Beams with 9 plies: 19, 20, 21 45°
Beams with 18 plies: 13 45°
1 2 3 4 5 6 7 8 9 10CL1 1.0158 1.829 0.54 0.008 0.91 1.88 0.0009 0.0169 0.012 0.0067
CL2 1.32 0.85 0.749 0.0097 0.76 0.7 0.0028 0.295 0.479 0.0416
CL3 1.642 1.149 1.272 0.008 1.58 1.159 0.002 0.349 0.48 0.048
11 12 13 14 15 16 17 18 19 20
CL1 0.049 0.04 3.37 0.31 0.00837 0.00997 0.15 0.15 2.72 2.68
CL2 0.167 0.12 0.66 0.0036 0.02 0.011 0.15 0.15 2.84 0.26
CL3 0.188 0.24 3.49 0.23 0.017 0.018 0.319 0.26 3.63 0.76
21 22 23 24 25 26 27 28 29 30
CL1 1.06 0.0036 0.43 0.33 1.84 2.14 0.013 0.0013 0.051 0.025
CL2 1.01 0.15 4.14 3.14 0.7 0.71 0.014 0.011 0.14 0.046
CL3 1.2 0.16 4.52 3.1 0.68 0.71 0.017 0.008 0.29 0.044
31 32 33 34 35 36 37 38
CL1 0.024 0.71 0.63 0.028 0.034 0.00001 0.000009 0.000008
CL2 0.27 0.1 0.14 0.063 0.048 0.0013 0.0017 0.0002
CL3 0.24 0.2 0.29 0.072 0.068 0.0014 0.0015 0.00026

L. Fehér and J. Égert – Acta Technica Jaurinensis, Vol. 8, No. 4, pp. 296-311, 2015
310
The list above shows that the ply numbers could be decreased in most of the beams compared to the basic initial laminate structure. Also it can be observed that there are a few beams in which the ply number has to be increased. From the computation one can state that the beam number 13 is the most critical beam in the chassis. In this beam the ply number has to be increased up to 18.
The final weight of this above modified laminate structure is 7.17 kg. This means that the chassis is approximately 12 kg applying composite materials, which means 62.5 % weight reduction compared to the aluminium alloy chassis.
Figure 13. Ply structure in beams number 1, 5, 2, 6, 23, 24, 25, 26
5. Conclusion
The paper focused on a real-life engineering problem experienced in the Shell Eco marathon competition. In this race the weight of the car is key to reach success like in any other car race. The paper shows an example of how laminated composite materials can be used for a chassis structure and therefore to reduce weight. For the FEM strength analysis different mechanical models of the chassis with critical load cases were applied. The FEM strength analysis was carried out in three critical load cases.
From the results of beam-bar modelling an overview was obtained concerning stress distribution in metal chassis. From the initial identical wall-thickness of the composite construction a laminate composite chassis was constructed with nearly homogeneous stress distribution. The weight of the basic laminated composite structure with 8 plies was 8.77 kg. From the results of FEM analysis of the basic laminated model an optimal layer structure was achieved. This means that every beam has nearly a homogeneous

L. Fehér and J. Égert – Acta Technica Jaurinensis, Vol. 8, No. 4, pp. 296-311, 2015
311
stress state. The weight of the final laminated composite chassis structure was only 7.17 kg.
Having compared the final laminated carbon composite chassis to the aluminium alloy chassis the weight reduction is almost 12 kg, namely 62.5 %. Using this chassis the fuel consumption can be significantly reduced.
References
[1] Mat MH, Ab Ghani AR: Design and Analysis of ‘Eco’ Car Chassis. Procedia Engineering, Vol. 41, pp. 1756–1760, 2012. DOI: 10.1016/j.proeng.2012.07.379
[2] Heißing B, Ersoy M: Chassis Handbook. Vieweg+Teubner Verlag, Berlin, 2011.
[3] Hinton MJ, Kaddour AS, Soden PD: Failure criteria in fibre-reinforced-polymer composites. Elsevier Science Ltd, Oxford, 2004.
[4] Kollár PL, Springer GS: Mechanics of Composite Structures. Cambridge University Press, Cambridge, 2003.
[5] Matthews FL, Davies GAO, Hitchings D, Soutis C: Finite element modelling of composite materials and structures. Woodhead Publishing Limited, Cambridge, 2000.
[6] Hyer MW: Stress analysis of fiber-reinforced composite materials. McGraw-Hill Companies, Singapore, 1998.
[7] Kaw AK: Mechanics of composite materials. CRC Press LLC, New York, 1997.
[8] Elhajjar R, Saponara LV, Muliana A: Smart composites Mechanics and Design. CRC Press, New York, 2014.
[9] Herakovich CT: Mechanics of fibrous composites. John Wiley & Sons Inc., New York, 1998.
[10] Barbero EJ: Finite element analysis of composite materials. CRC Press, Boca Raton, 2008.
[11] Barbero EJ: Finite element analysis of composite materials using ANSYS. CRC Press, Boca Raton, 2014.
[12] Aczél Á, Bojtár G, Fehér L, Keresztes D: FE Analysis of the 3D bar model of the chassis of a racing car (Versenyautó alváz térbeli rúdmodelljének végeselemes analízise). GÉP, Vol. 7-8, pp. 3-8., 2011.
[13] Égert J, Aczél Á, Fehér L, Körmendy Á: Modeling possibilities and critical loading of the chassis of a racing car (Versenyautó alváz mechanikai modellezési lehetőségei és kritikus terhelései). GÉP, Vol. 7-8, pp. 43-48., 2011.
[14] Lawrence M: Colin Chapman Wayward Genius. Breedon Books Publishing, 2003.