female admissions (aged 16-50 years) to adult, general ... · report from the intensive care...
TRANSCRIPT

Female admissions (aged 16-50 years) to adult, general critical care units in England, Wales and Northern Ireland reported as ‘currently pregnant’ or ‘recently pregnant’ Report from the Intensive Care National Audit & Research Centre
1 January 2009 to 31 December 2012
This work was commissioned and funded by The Obstetric Anaesthetists’ Association.
Report published: December 2013 Author: ICNARC

© ICNARC 2013. All rights reserved
ICNARC disclaims any proprietary interest in any trademarks or trade-names other than its own
Intensive Care National Audit & Research Centre
Napier House, 24 High Holborn, London WC1V 6AZ
T: 020 7269 9288
F: 020 7831 6879

Obstetric admissions to critical care 2009-2012 3 of 80
1 January 2009 to 31 December 2012
Report published: December 2013
Contents
1. Foreword ................................................................................................................................................ 6
2. Background ............................................................................................................................................ 9 2.1 Intensive Care National Audit & Research Centre (ICNARC) ............................................................... 9 2.2 The Case Mix Programme (CMP) ....................................................................................................... 10
Figure 1. Timing and overview of data collected for the Case Mix Programme .................................... 11 Figure 2. Example of calculation of APACHE II Score .......................................................................... 12 Figure 3. Numbers of critical care units submitting data by quarter, 2007 to 2012 ............................... 13
3. Obstetric-related fields in Version 3.0 and later of the CMP dataset ............................................. 14
4. CMP data validation ............................................................................................................................ 15 4.1 Data validation .................................................................................................................................... 15 4.2 Revalidation of obstetric admissions in the CMP Database ................................................................ 15
Figure 4. Results of revalidation of obstetric admissions ...................................................................... 17
5. Results .................................................................................................................................................. 18 5.1 Number and proportion of admissions ................................................................................................ 18
Figure 5. Flow diagram of female admissions to critical care aged 16-50 years reported as 'currently
pregnant', 'recently pregnant' or neither on admission to the critical care unit ...................................... 19 Figure 6. Trend in admissions reported as ‘currently pregnant’ or ‘recently pregnant’ as a percentage of
all admissions, 2009 to 2012 ................................................................................................................. 20 Figure 7. Trend in admissions reported as ‘currently pregnant’ or ‘recently pregnant’ as a percentage of
female admissions aged 16-50 years, 2009 to 2012 ............................................................................. 21 Figure 8. Trend in the percentage of female admissions aged 16-50 reported as ‘currently pregnant’ or
‘recently pregnant’ classified as obstetric-related, 2009 to 2012 ........................................................... 22 Table 1. Primary reason for admission to the critical care unit for female admissions aged 16-50 years
reported as ‘recently pregnant’ – obstetric-related admissions (N=3,909) ............................................ 23 Table 2. Primary reason for admission to the critical care unit for female admissions aged 16-50 years
reported as ‘recently pregnant’ – non-obstetric admissions (N=1,696) ................................................. 26 Table 3. Primary reason for admission to the critical care unit for female admissions aged 16-50 years
reported as ‘currently pregnant’ – non-obstetric admissions (N=1,085) ................................................ 35 Table 4. Primary reason for admission to the critical care unit for female admissions aged 16-50 years
reported as ‘currently pregnant’ – obstetric-related admissions (N=103) .............................................. 42 5.2 Extrapolation and comparison with national figures ............................................................................ 44
Figure 9. Trend in extrapolated total number of currently and recently pregnant admissions to adult,
general critical care units in England, Wales and Northern Ireland, 2009 to 2012 ................................ 45 Figure 10. Trend in estimated rate of currently and recently pregnant admissions to adult, general
critical care units in England, Wales and Northern Ireland per 1,000 maternities, 2009 to 2012 .......... 46 5.3 Case mix, outcome and resource use ................................................................................................. 46
Table 5. Case mix of female admissions to critical care aged 16-50 years reported as ‘currently
pregnant’, ‘recently pregnant’ or neither on admission to the critical care unit ...................................... 47

Obstetric admissions to critical care 2009-2012 4 of 80
1 January 2009 to 31 December 2012
Report published: December 2013
Figure 11. Trend in mean age of female admissions aged 16-50 reported as ‘currently pregnant’ or
‘recently pregnant’, 2009 to 2012 .......................................................................................................... 48 Figure 12. Trend in percentage of admissions from theatre for female admissions aged 16-50 reported
as ‘currently pregnant’ or ‘recently pregnant’, 2009 to 2012 .................................................................. 49 Figure 13. Trend in mean ICNARC Physiology Score for female admissions aged 16-50 reported as
‘currently pregnant’ or ‘recently pregnant’, 2009 to 2012 ...................................................................... 50 Figure 14. Trend in mean APACHE II Score for female admissions aged 16-50 reported as ‘currently
pregnant’ or ‘recently pregnant’, 2009 to 2012 ...................................................................................... 51 Table 6. Outcomes for female admissions to critical care aged 16-50 years reported as ‘currently
pregnant’, ‘recently pregnant’ or neither on admission to the critical care unit ...................................... 51 Figure 15. Trend in critical care unit mortality for female admissions aged 16-50 reported as ‘currently
pregnant’ or ‘recently pregnant’, 2009 to 2012 ...................................................................................... 52 Figure 16. Trend in acute hospital mortality for female admissions aged 16-50 reported as ‘currently
pregnant’ or ‘recently pregnant’, 2009 to 2012 ...................................................................................... 53 Table 7. Resource use for female admissions to critical care aged 16-50 years reported as ‘currently
pregnant’, ‘recently pregnant’ or neither on admission to the critical care unit ...................................... 53 Figure 17. Trend in the percentage of critical care bed-days by level of care for female admissions
aged 16-50 reported as ‘currently pregnant’ or ‘recently pregnant’, 2009 to 2012 ................................ 54 5.4 Obstetric-related data for admissions reported as ‘currently pregnant’ ............................................... 55
Figure 18. Gestation (weeks) for female admissions aged 16-50 reported as ‘currently pregnant’ on
admission to the critical care unit .......................................................................................................... 56 Figure 19. Gestation (trimesters) for female admissions aged 16-50 reported as ‘currently pregnant’ on
admission to the critical care unit .......................................................................................................... 57 5.5 Obstetric-related data for admissions reported as ‘recently pregnant’ ................................................ 57
Figure 20. Outcome of recent pregnancy for female admissions aged 16-50 reported as ‘recently
pregnant’ on admission to the critical care unit ..................................................................................... 59 Figure 21. Trend in percentage of admissions following live and/or stillbirths for female admissions
aged 16-50 reported as ‘recently pregnant’ on admission to the critical care unit ................................. 60 Figure 22. Gestation (weeks) for female admissions aged 16-50 reported as ‘recently pregnant’ on
admission to the critical care unit (by outcome of recent pregnancy) .................................................... 61 Figure 23. Gestation (trimesters) for female admissions aged 16-50 reported as ‘recently pregnant’ on
admission to the critical care unit (by outcome of recent pregnancy) .................................................... 62 Figure 24. Trend in percentage of preterm deliveries (gestation less than 37 weeks) for female
admissions aged 16-50 reported as ‘recently pregnant’ on admission to the critical care unit (live and/or
stillbirths only) ........................................................................................................................................ 63 Figure 25. Days from delivery to critical care admission for female admissions aged 16-50 reported as
‘recently pregnant’ on admission to the critical care unit (by outcome of recent pregnancy) ................ 64 Figure 26. Number of live births and/or stillbirths from previous pregnancies for female admissions
aged 16-50 reported as ‘recently pregnant’ on admission to the critical care unit ................................. 65 Figure 27. Number of previous Caesarean sections (excluding most recent pregnancy) for female
admissions aged 16-50 reported as ‘recently pregnant’ on admission to the critical care unit .............. 66

Obstetric admissions to critical care 2009-2012 5 of 80
1 January 2009 to 31 December 2012
Report published: December 2013
Figure 28. Mode of delivery for female admissions aged 16-50 reported as ‘recently pregnant’ on
admission to the critical care unit (live and/or stillbirths only) ................................................................ 67 Figure 29. Trend in percentage of admissions following Caesarean for female admissions aged 16-50
reported as ‘recently pregnant’ on admission to the critical care unit (live and/or stillbirths only) ......... 68 Figure 30. Number of live births from recent pregnancy for female admissions aged 16-50 reported as
‘recently pregnant’ on admission to the critical care unit (live and/or stillbirths only) ............................ 69 Figure 31. Number of stillbirths from recent pregnancy for female admissions aged 16-50 reported as
‘recently pregnant’ on admission to the critical care unit (live and/or stillbirths only) ............................ 70 Figure 32. Trend in multiple births for female admissions aged 16-50 reported as ‘recently pregnant’ on
admission to the critical care unit (live and/or stillbirths only), 2009-2012 ............................................. 71 Figure 33. Number of babies in NICU following recent pregnancy for female admissions aged 16-50
reported as ‘recently pregnant’ on admission to the critical care unit (live births only) .......................... 72 Figure 34. Number of babies in NICU following recent pregnancy, split by term (gestation 37 weeks or
more) and preterm (gestation less than 37 weeks), for female admissions aged 16-50 reported as
‘recently pregnant’ on admission to the critical care unit (live births only) ............................................. 73
Appendix 1. Flow diagrams and definitions for obstetric-related fields in Version 3.0 and later of the
Case Mix Programme dataset .................................................................................................................... 74
Appendix 2. Case Mix Programme and CCMDS definitions ................................................................... 78 Case Mix Programme definitions .............................................................................................................. 78 Level of care definitions from the Critical Care Minimum Data Set (CCMDS) .......................................... 79

Obstetric admissions to critical care 2009-2012 6 of 80
1 January 2009 to 31 December 2012
Report published: December 2013
1. Foreword
This is the second Intensive Care National Audit & Research Centre (ICNARC) report on obstetric
admissions to UK intensive care units (ICUs) during the period 2009 to 2012, commissioned by the
Obstetric Anaesthetists’ Association (OAA). This important document identifies the number of cases,
severity and type of illness, level and type of support required and final outcomes of critically ill obstetric
patients and their babies.
ICNARC was established in 1994 to provide a system to compare outcomes and identify key indicators in
critical care management in adults. It aims to improve the organisation and practice of adult critical care
which dovetails with the Royal College of Anaesthetists’ stated aim to improve standards in anaesthesia
and critical care. ICNARC coordinates a national, comparative audit of patient outcomes from adult, critical
care units in England, Wales and Northern Ireland known as the Case Mix Programme (CMP).
Approximately 90% of adult, general critical care units in England, Wales and Northern Ireland participate in
the CMP. 214 adult, general critical care units participated between 2009 and 2012 (468,668 admissions);
of these admissions, 207,874 were female (44.4% of total) and 26.8% aged 16-50 years (55,791).
Obstetric patients have benefitted from changes resulting from audit findings in the UK confidential
maternal death enquiry1 (now called MBRRACE-UK, Mother and babies: reducing risk through audits and
confidential enquiries across the UK). This audit has led to considerable improvements in maternity care
and a major reduction in deaths related to pregnancy over the last 60 years from causes such as pre-
eclampsia and thrombo-embolism. However, a consistent finding of reports published over the last few
years, and highlighted in the 2011 report, has been the need for improved specialist clinical care to assist
with the recognition, treatment and referral of critical illness during and immediately after pregnancy. In
2011, key recommendations were made for policy makers, service commissioners, providers and
healthcare professionals to invest in this multi-disciplinary care. Providing appropriate high quality care and
funding streams for the sick mother is posing an additional burden on resources at a time of rapid increases
in national childbirth rates2 and financial constraints on the maternity services. The ICNARC obstetric report
gives valuable insight into this patient population and provides morbidity as well as mortality statistics. It is
1 Saving Mothers’ Lives: Reviewing maternal deaths to make motherhood safer 2006–2008 March 2011. The Eighth
Report of the Confidential Enquiries into Maternal Deaths in the United Kingdom. Centre for Maternal and Child
Enquiries (CMACE), BJOG 118 (Suppl. 1), 1–203
2 Statistical Bulletin: Births in England and Wales, 2012. Office for National Statistics, London, July 2013
(http://www.ons.gov.uk/ons/dcp171778_317196.pdf)

Obstetric admissions to critical care 2009-2012 7 of 80
1 January 2009 to 31 December 2012
Report published: December 2013
worth noting that ICNARC captures only the portion of Level 2 and Level 3 critically ill parturients who are
referred to UK ICUs. We recognise that many additional patients will also be managed in a maternity unit
setting out with critical care and previous reports (SCASMM & PECCM)3,4 indicate a prevalence of severe
morbidity of up to fifty times mortality figures.
This second ICNARC/OAA report is a baseline descriptive analysis of admissions from units participating in
the CMP with admissions reported to be “currently pregnant” or “recently pregnant” (within 42 days of
admission to the critical care unit) aged 16-50 years. There were 1,188 “currently pregnant” admissions
and 5,605 “recently pregnant” admissions, 12.1% of the total female ICU admissions in this age group, with
a mean age of 30 years. Overall, the incidence of “currently pregnant” or “recently pregnant” admissions to
UK critical care units is approximately 290 per 100,000 maternities. This compares to a maternal death rate
of 14 per 100,000 maternities in the 2011 Confidential Enquiry report.1
As in the previous report, the primary reasons for admission in the larger “recently pregnant” sub-group
were obstetric causes, with ante- or post-partum haemorrhage reported as the primary diagnosis in 2,014
(36%) cases. Fifty-three percent were admitted straight from the operating theatre (as opposed to only
21% in the currently pregnant group). Similar to the last report, the vast majority (91%) of “currently
pregnant” women were admitted for non-obstetric reasons, again with respiratory complications being the
single most common diagnosis (39%). Overall the mean APACHE II score was 10 (CMP overall non-
obstetric mean: 16). 127 deaths were reported in the four year period, 97 in the recently pregnant and 30 in
the currently pregnant group. Two-thirds of in-hospital deaths among obstetric admissions to critical care
units occurred during the original critical care unit admission and, overall, at least 90% of these deaths
occurred in critical care, one quarter after readmission.
The OAA committee worked closely with ICNARC to refine and develop the dataset including re-audit and
quality assessment with some early data queries. We are confident we have a robust report covering
admissions over the past four years. We are grateful to Professor Kathy Rowan and her staff at ICNARC
for producing this report, which provides the largest series of UK obstetric ICU patients and details of the
majority of hospital maternal deaths in ICU.
3 Scottish Audit of Severe Maternal Morbidity: 6th Annual Report. Reproductive Health Programme. NHSQIS,
Scotland 2011 (www.nhshealthquality.org/nhsqis/files/SCASMM_REP_APR10.pdf)
4 Providing Equity of Critical and Maternity Care for the Critically ill Pregnant or Recently Pregnant Woman. The Royal
College of Obstetricians and Gynaecologists, The Obstetric Anaesthetists Association, The Royal College of
Midwives, The British Maternal and Fetal Medicine Society, The Intensive Care Society. RCoA, London, July 2011
(http://www.oaa-anaes.ac.uk/content.asp?ContentID=323)

Obstetric admissions to critical care 2009-2012 8 of 80
1 January 2009 to 31 December 2012
Report published: December 2013
We encourage further subset analysis into this data, as has been successfully undertaken in the non-
obstetric population over the past 20 years. Examples include analysis of level of care, quality of transfer of
the critically ill parturient and outcomes of mothers and babies who labour and/or deliver whilst critically ill.
We hope that this report will be valuable to all members of the multidisciplinary teams, as well as to local
administrators and national planners to improve our care for critically ill pregnant women.
Audrey C Quinn The Obstetric Anaesthetists’ Association Chair, National Intercollegiate OAA MCC group

Obstetric admissions to critical care 2009-2012 9 of 80
1 January 2009 to 31 December 2012
Report published: December 2013
2. Background
2.1 Intensive Care National Audit & Research Centre (ICNARC)
The Intensive Care National Audit & Research Centre (ICNARC) has its origins in the UK APACHE II Study
(1987-1993). Established in 1994 on a two-year (1994-1995), pump-priming grant from the Department of
Health (England) and Welsh Health Common Services Authority (Wales), ICNARC became an independent
Registered Charity in July 1994 (Registered Charity Number: 1039417).
ICNARC’s aim is to foster improvements in the organisation and practice of adult critical care (intensive and
high dependency care) to improve patient care and outcomes. Towards achieving part of this aim,
ICNARC coordinates a national, comparative audit of patient outcomes from adult, critical care units in
England, Wales and Northern Ireland known as the Case Mix Programme (CMP). Currently, approximately
94% of adult, general critical care units in England, Wales and Northern Ireland are participating in the
CMP.
The CMP is a voluntary, performance assessment programme using high quality clinical data to facilitate
local quality improvement through routine feedback of comparative outcomes and key quality indicators to
clinicians/managers in adult critical care units. The CMP is included as a national clinical audit for the
Department of Health Quality Accounts.
Following an approach from the Joint Standing Committee of the Royal College of Anaesthetists and Royal
College of Obstetricians and Gynaecologists, an agreed number of obstetric-related fields were
incorporated into the ICNARC Case Mix Programme Dataset Specification (Version 3.0), initially released
to software developers in February 2006, and subsequently collected by units participating in the CMP,
incrementally, from late 2006 onwards. Data for these obstetric-related fields are prompted for collection
for all females admitted to participating critical care units.
This report is a baseline descriptive analysis of admissions between 2009 and 2012 to units participating in
the CMP reported to be ‘currently pregnant’ or ‘recently pregnant’.

Obstetric admissions to critical care 2009-2012 10 of 80
1 January 2009 to 31 December 2012
Report published: December 2013
2.2 The Case Mix Programme (CMP)
The CMP recruits predominantly adult, general critical care units. Adult, general critical care units are
defined as either standalone intensive care units (ICUs) or combined intensive care/high dependency units
(ICU/HDUs). Participation in the CMP is entirely voluntary.
CMP specified data are recorded prospectively and abstracted retrospectively by trained data collectors
according to precise rules and definitions – set out in the ICNARC Case Mix Programme Dataset
Specification (currently Version 3.1). Data collectors from each unit are trained prior to commencing data
collection with retraining of existing staff, or training of new staff, also available. CMP training courses are
held at regular intervals each year.
CMP specified data are collected on consecutive admissions to each participating critical care unit and are
submitted to ICNARC quarterly. Data are validated locally, on data entry, and then undergo extensive
central validation, for completeness, illogicalities and inconsistencies, with Data Validation Reports (DVRs)
returned to units for correction and/or confirmation. The validation process is repeated until all queries
have been resolved and then the data are incorporated into the CMP Database (CMPD).
Participating units receive comparative Data Analysis Reports (DARs) on patient outcomes and key
potential quality indicators, in which they can identify their own unit data and compare with all units
participating in the CMP. In addition, staff at units can interrogate the CMPD by submitting analysis
requests to ICNARC.
Data collected for the CMP include alphanumeric unit/admission identifiers, demographics (e.g. age, sex,
ethnicity), case mix (e.g. acute severity, comorbidity, surgical status, reason for admission), outcome (e.g.
unit/acute hospital survival) and activity (e.g. unit/acute hospital length of stay) for each admission to each
critical care unit.
Details of the timing and overview of data collected for the CMP are shown in Figure 1.

Obstetric admissions to critical care 2009-2012 11 of 80
1 January 2009 to 31 December 2012
Report published: December 2013
Figure 1. Timing and overview of data collected for the Case Mix Programme
Acute severity of illness is measured by the APACHE II and the ICNARC Physiology Scores. These scores
are based on raw physiology data collected in the first 24 hours following admission to the critical care unit.
For each physiological variable that contributes to the score, a weighting is added based on the degree of
derangement from the normal range. These weightings are summed to calculate a score. The range of
APACHE II scores is 0 to 71, with higher scores indicating increased severity. Figure 2 shows the scoring
system used to calculate the APACHE II score. For example, for female admissions to adult general critical
care units, aged 16 to 50 years and reported as ‘currently pregnant’ or ‘recently pregnant’, lower scores of
0-17 are associated with a hospital mortality rate of approximately 1%, rising to approximately 85% for
higher scores >42.
Reason for admission to the critical care unit is coded using the ICNARC Coding Method (ICM).5 The ICM,
developed specifically for the CMP, is a five-tiered (type of condition – surgical/non-surgical, body system,
anatomical site, pathological/physiological process and condition), hierarchical method for coding reasons
for admission or underlying conditions in critical care.
5 Young JD, Goldfrad C, Rowan K, on behalf of the ICNARC Coding Method Working Group. Development and testing
of a hierarchical method to code the reason for admission to intensive care units: the ICNARC Coding Method. Br J
Anaesth 2001; 87:543-8.

Obstetric admissions to critical care 2009-2012 12 of 80
1 January 2009 to 31 December 2012
Report published: December 2013
Figure 2. Example of calculation of APACHE II Score
The primary reason for admission is assessed and recorded at admission to and during the first 24 hours in
the critical care unit. It is deemed to be the most important underlying condition or reason for admission to
the critical care unit and should describe what is happening to the admission that precluded management
on the hospital ward. Each reason for admission should contain a minimum of three levels in the
hierarchical structure.
Raw data, rather than derived variables (e.g. date of birth rather than age in years etc.), are collected for all
variables, where possible. Data are collected for each admission and readmissions are linked centrally.
Version 3.0 of the ICNARC Case Mix Programme Dataset Specification, incorporating the obstetric-related
fields, was initially released to all CMP software developers in February 2006. Following export and
process-flow compliance testing with ICNARC, the software was subsequently released to participating
units permitting transition from Version 2.0 to Version 3.0 data collection. Since January 2009, all critical
care units in the CMP have been collecting data to Version 3.0 or later of the dataset specification. The
numbers of units submitting data by quarter (from 2007 to 2012) are shown in Figure 3.
Physiology Maximum weighting Temperature 4 Blood pressure 4 Respiratory rate 4 Heart rate 4 Oxygenation 4 pH 4 Sodium 4 Potassium 4 Creatinine 4 Haematocrit 4 White blood cell count 4 Glasgow Coma Score 12 (15-GCS) Severity of illness = 60 Age 6 Comorbidity 5 APACHE II Score = 71

Obstetric admissions to critical care 2009-2012 13 of 80
1 January 2009 to 31 December 2012
Report published: December 2013
Figure 3. Numbers of critical care units submitting data by quarter, 2007 to 2012
0
20
40
60
80
100
120
140
160
180
200
Num
ber
of a
dult,
gen
era
l crit
ical
car
e un
itsw
ith d
ata
rece
ived
and
val
idat
ed b
y IC
NA
RC
2007
Q1
2007
Q2
2007
Q3
2007
Q4
2008
Q1
2008
Q2
2008
Q3
2008
Q4
2009
Q1
2009
Q2
2009
Q3
2009
Q4
2010
Q1
2010
Q2
2010
Q3
2010
Q4
2011
Q1
2011
Q2
2011
Q3
2011
Q4
2012
Q1
2012
Q2
2012
Q3
2012
Q4
Date of critical care unit admission (quarter)
Pre-introduction Post-introduction

Obstetric admissions to critical care 2009-2012 14 of 80
1 January 2009 to 31 December 2012
Report published: December 2013
3. Obstetric-related fields in Version 3.0 and later of the CMP dataset
For all female admissions to a critical care unit participating in the CMP, data are collected which indicate
whether the woman is reported as ‘currently pregnant’, ‘recently pregnant’ (within 42 days of admission to
the critical care unit) or neither of these (‘not known to be pregnant’).
For female admissions that are reported as ‘currently pregnant’, either the gestation or the expected date of
delivery is requested.
For female admissions that are reported as ‘recently pregnant’, the following fields are requested:
• assisted conception used for recent pregnancy;
• gestation at delivery of recent pregnancy;
• actual date of delivery of recent pregnancy;
• molar pregnancy associated with recent pregnancy;
• number of live births (babies) or stillbirths from previous pregnancies;
• number of previous Caesarean sections excluding most recent pregnancy;
• outcome of recent pregnancy;
• number of live births (babies) from recent pregnancy;
• number of stillbirths from recent pregnancy;
• number of babies in NICU following recent pregnancy; and
• hysterectomy at/since delivery of recent pregnancy.
Flow diagrams and full definitions for the obstetric-related fields in the CMP dataset are included in
Appendix 1.
For the purpose of this report, admissions reported as ‘currently pregnant’ or ‘recently pregnant’ were
classified as either obstetric-related or non-obstetric based on all relevant information included in the
CMPD admission record, including primary and secondary reasons for admission, gestation, time from
delivery to admission to the critical care unit, location prior to admission, etc. [Note: Recording of a primary
reason for admission is compulsory for all admissions in the CMPD. Recording of a secondary reason for
admission is optional. The accuracy of the classification of reasons for admission into obstetric-related and
non-obstetric may therefore be dependent on the level of detail included in the admission record.]
Obstetric admissions to critical care 2009-2012 15 of 80
1 January 2009 to 31 December 2012
Report published: December 2013
4. CMP data validation
4.1 Data validation
The CMP rigorously validate all data to ensure the quality of the data prior to analysis and reporting is
complete and accurate. All data included in this report are based on fully validated data.
CMP data undergo a thorough three stage validation process:
Stage one
Data are loaded into the CMP database where over 600 checks are run. This eliminates the most
fundamental dataset errors, such as missing, invalid and/or unusual values.
Stage two
Data are passed through a pre-validation process, checking for any form of duplication, both within newly
submitted data and against all existing CMP data for the unit.
Stage three
A full validation cycle is run on all individual admission records in the period, and also across the period as
a whole. A Data Validation Report (DVR) is sent to the unit for any erroneous or unusual data to be
completed, confirmed or corrected. This process also includes checking for readmissions of the same
patient. This validation cycle will repeat until data in a period are declared clean and ready for analysis, and
the admissions are locked within our database.
4.2 Revalidation of obstetric admissions in the CMP Database
In 2012, the membership of the Obstetric Anaesthetists’ Association (OAA) queried reported obstetric
events in critical care admissions that were deemed unlikely or unusual, with ICNARC.
As a result, ICNARC undertook an extensive, national data review of all obstetric admissions held in the
CMP Database between 2006 and 2012.
A summary of the review process is provided overleaf.

Obstetric admissions to critical care 2009-2012 16 of 80
1 January 2009 to 31 December 2012
Report published: December 2013
Review process
Stage one
• Further to meeting with representatives from the OAA, ICNARC undertook a thorough review of all
obstetric admissions held in the CMP Database. ICNARC examined various cohorts of obstetric
admissions based on broad categories identified by the OAA relating to various conditions and unlikely
events (e.g. hypovolemic shock, postpartum haemorrhage etc.).
• ICNARC undertook additional data linkage to follow unusual obstetric admissions through each
hospital/critical care event in order to revalidate the accuracy of the data, this included reviewing text
box notes and locations prior to admission to critical care.
• ICNARC undertook an initial small, random sample survey of units (n=11) with reported unusual
obstetric admissions.
Stage two
• ICNARC reviewed results from the initial review based on a number of extreme results (i.e. those
unusual or unlikely serious as highlighted by the OAA). Initial results indicated a slim error rate in a
small number of obstetric admissions.
• In November 2012, ICNARC undertook a full data review, surveying all participating CMP units
(n = 236).
• Based on initial results and further database interrogation, ICNARC focused the review on:
o all female admissions to critical care;
o admitted between 2006 and 2012; and
o reported to be ‘currently pregnant’ at the time of admission to critical care.
The total number of obstetric admissions revalidated was 1,260.
The review was concluded in June 2013.

Obstetric admissions to critical care 2009-2012 17 of 80
1 January 2009 to 31 December 2012
Report published: December 2013
Results
The results of the review show that the vast majority of obstetric admissions collected by CMP participating
units and subsequently validated by ICNARC were found to be accurate (Figure 4).
Figure 4. Results of revalidation of obstetric admissions
Result N (%)
Correct 1,109 (87.3)
Incorrect* 54 (4.3)
Unknown • non-responders • data unobtainable (units closed etc.)
106 (8.4)
* All data found to be incorrect have been recollected and revalidated accordingly.
Having carefully reviewed all data confirmed as incorrect, ICNARC have made additional adjustments to
the internal validation module.
In March 2013, ICNARC met with representatives from the Obstetric Anaesthetists’ Association to present
results from the investigation. Representatives were satisfied that the data collected and held in the CMP
Database was of a significantly high standard and expressed their thanks to all participating CMP units for
their hard work and accuracy in collecting these important data.
These results demonstrate the benefit of having a large, national database. It provides clinicians with an
opportunity to capture and evaluate rare and unusual events that they may never have exposure to in an
individual hospital or during the course of a single clinical career.

Obstetric admissions to critical care 2009-2012 18 of 80
1 January 2009 to 31 December 2012
Report published: December 2013
5. Results
5.1 Number and proportion of admissions
Between 1 January 2009 and 31 December 2012, 468,668 admissions to 214 adult, general critical care
units were recorded in the CMPD and are included in this descriptive analysis of obstetric admissions. Of
207,874 female admissions, 55,791 (26.8%) were aged between 16 and 50 years (deemed to be of child-
bearing age). Of female admissions aged 16-50 years, 1,188 (2.1%) were reported as ‘currently pregnant’
and 5,605 (10.0%) were reported as ‘recently pregnant’ (Figure 5). [Note: a further 12 admissions aged
less than 16 years and 13 admissions aged greater than 50 years were reported as either ‘currently
pregnant’ or ‘recently pregnant’.] Figure 6 and Figure 7 show the trend over time from 2009 to 2012 in
admissions reported as ‘currently pregnant’ and ‘recently pregnant’ as a percentage of all admissions and
as a percentage of female admissions aged 16-50 years, respectively.
Of female admissions aged 16-50 years reported as ‘currently pregnant’, the majority (91.3%) were
classified as being non-obstetric based on all available information, whereas for those reported as ‘recently
pregnant’ the majority (69.7%) were classified as obstetric-related (Figure 5). There were 244 admissions
(15 reported as ‘currently pregnant’ and 229 reported as ‘recently pregnant’) with insufficient information to
reliably classify as obstetric-related or not – these have been included in the non-obstetric category.
Trends in the percentage of admissions categorised as obstetric-related are shown in Figure 8. A
breakdown of the primary reasons for admission to the critical care unit for female admissions aged 16-50
reported as ‘currently pregnant’ and ‘recently pregnant’, split by those classified as obstetric-related and
non-obstetric, is reported in Table 4 to Table 2.
.

Obstetric admissions to critical care 2009-2012 19 of 80
1 January 2009 to 31 December 2012
Report published: December 2013
Figure 5. Flow diagram of female admissions to critical care aged 16-50 years reported as 'currently
pregnant', 'recently pregnant' or neither on admission to the critical care unit
All admissions to
critical care
468,668
Female admissions
207,874 (44.4%)
Female admissions
aged 16-50
55,791 (26.8%)
Currently pregnant
1,188 (2.1%)
Recently pregnant
5,605 (10.0%)
Neither
48,998 (87.8%)
Obstetric-related
admissions
103 (8.7%)
Non-obstetric
admissions
1,085 (91.3%)
Obstetric-related
admissions
3,909 (69.7%)
Non-obstetric
admissions
1,696 (30.3%)

Obstetric admissions to critical care 2009-2012 20 of 80
1 January 2009 to 31 December 2012
Report published: December 2013
Figure 6. Trend in admissions reported as ‘currently pregnant’ or ‘recently pregnant’ as a
percentage of all admissions, 2009 to 2012
251 325 305 3161230 1379 1527 1485
0.0
0.5
1.0
1.5
Pe
rce
nta
ge
of
all
ad
mis
sio
ns
(95
% C
I)
2009 2010 2011 2012Year of critical care unit admission
Currently pregnant Recently pregnant

Obstetric admissions to critical care 2009-2012 21 of 80
1 January 2009 to 31 December 2012
Report published: December 2013
Figure 7. Trend in admissions reported as ‘currently pregnant’ or ‘recently pregnant’ as a
percentage of female admissions aged 16-50 years, 2009 to 2012
250 323 302 3131224 1375 1523 1483
0
2
4
6
8
10
12
Pe
rce
nta
ge
of f
ema
le a
dm
issi
on
sa
ge
d 1
6-5
0 y
ea
rs (
95
% C
I)
2009 2010 2011 2012Year of critical care unit admission
Currently pregnant Recently pregnant

Obstetric admissions to critical care 2009-2012 22 of 80
1 January 2009 to 31 December 2012
Report published: December 2013
Figure 8. Trend in the percentage of female admissions aged 16-50 reported as ‘currently pregnant’
or ‘recently pregnant’ classified as obstetric-related, 2009 to 2012
248 325 306 3151172 1315 1466 1421
0
20
40
60
80
Pe
rce
nta
ge o
f a
dm
issi
on
s (9
5%
CI)
2009 2010 2011 2012Year of critical care unit admission
Currently pregnant Recently pregnant

Obstetric admissions to critical care 2009-2012 23 of 80
1 January 2009 to 31 December 2012
Report published: December 2013
Table 1. Primary reason for admission to the critical care unit for female admissions aged 16-50
years reported as ‘recently pregnant’ – obstetric-related admissions (N=3,909)
Primary reason for admission to the critical care unit – body system (bold text) or specific condition (regular text)
N (%*)
Respiratory 10 (0.2)
Spinal injection or infusion 7 (0.1)
Incomplete code 3 (0.1)
Cardiovascular 155 (2.8)
Hypovolaemic shock 100 (1.8)
Cardiogenic pulmonary oedema 19 (0.3)
Other cardiomyopathies 10 (0.2)
Left ventricular failure 7 (0.1)
Bi-ventricular failure 5 (0.1)
Septic shock (no underlying condition given) 5 (0.1)
Inferior vena caval obstruction or thrombosis 1 (0.0)
Instrumental damage to abdominal aorta or iliac vessels 1 (0.0)
Incomplete code 7 (0.1)
Gastrointestinal 66 (1.2)
Acute fatty liver of pregnancy 31 (0.6)
Instrumental damage to large bowel 13 (0.2)
Instrumental damage to small bowel 13 (0.2)
Abdominal wound dehiscence 1 (0.0)
Instrumental damage to duodenum 1 (0.0)
Instrumental damage to liver or biliary tree 1 (0.0)
Instrumental damage to renal or splanchnic vessels 1 (0.0)
Incomplete code 5 (0.1)
Neurological (including eyes) 10 (0.2)
Epidural injection or infusion 8 (0.1)
Epidural or subdural abscess 2 (0.0)
Genito-urinary 3644 (65.0)
Peri- and postpartum haemorrhage 2014 (35.9)
Ectopic pregnancy 289 (5.2)
Pre-eclampsia 227 (4.1)

Obstetric admissions to critical care 2009-2012 24 of 80
1 January 2009 to 31 December 2012
Report published: December 2013
Primary reason for admission to the critical care unit – body system (bold text) or specific condition (regular text)
N (%*)
Caesarean section 203 (3.6)
HELLP syndrome 144 (2.6)
Antepartum haemorrhage 143 (2.6)
Uterine rupture or perforation 109 (1.9)
Eclampsia 80 (1.4)
Infected retained products of conception 78 (1.4)
Amnionitis 62 (1.1)
Intrauterine death 42 (0.7)
Instrumental damage to uterus, ovaries or fallopian tubes 36 (0.6)
Haemorrhage from uterus 34 (0.6)
Threatened miscarriage 26 (0.5)
Amniotic fluid embolus 24 (0.4)
Septic abortion 24 (0.4)
Pelvic infection or abscess 14 (0.2)
Instrumental damage to bladder or urethra 13 (0.2)
Uterine cavity infection 9 (0.2)
Septic shock (following intrauterine death) 8 (0.1)
Haemorrhage from ovary or fallopian tubes 6 (0.1)
Peri- and postpartum haemorrhage (following intrauterine death) 4 (0.1)
Molar pregnancy 3 (0.1)
Pre-eclampsia (following intrauterine death) 3 (0.1)
Antepartum haemorrhage (following intrauterine death) 2 (0.0)
Septicaemia (following intrauterine death) 2 (0.0)
Cardiogenic pulmonary oedema (following intrauterine death) 1 (0.0)
Cystitis, pyocystis or urethritis (following intrauterine death) 1 (0.0)
Infected retained products of conception (following intrauterine death) 1 (0.0)
Instrumental damage to kidney, ureter or vessels 1 (0.0)
Uterine rupture or perforation (following intrauterine death) 1 (0.0)
Incomplete code 40 (0.7)
Endocrine, metabolic, thermoregulation and poisoning 5 (0.1)
Ovarian hyperstimulation 1 (0.0)

Obstetric admissions to critical care 2009-2012 25 of 80
1 January 2009 to 31 December 2012
Report published: December 2013
Primary reason for admission to the critical care unit – body system (bold text) or specific condition (regular text)
N (%*)
Incomplete code 4 (0.1)
Haematological/immunological 17 (0.3)
Disseminated intravascular coagulation 8 (0.1)
Septicaemia (no underlying condition given) 5 (0.1)
Pro-coagulant states 1 (0.0)
Incomplete code 3 (0.1)
Dermatological 2 (0.0)
Incomplete code 2 (0.0)
* Percentage of all female admissions aged 16-50 years reported as ‘recently pregnant’ on admission to the critical
care unit.

Obstetric admissions to critical care 2009-2012 26 of 80
1 January 2009 to 31 December 2012
Report published: December 2013
Table 2. Primary reason for admission to the critical care unit for female admissions aged 16-50
years reported as ‘recently pregnant’ – non-obstetric admissions (N=1,696)
Primary reason for admission to the critical care unit – body system (bold text) or specific condition (regular text)
N (%*)
Respiratory 486 (8.7)
Pneumonia 242 (4.3)
Non-cardiogenic pulmonary oedema (ARDS) 87 (1.6)
Asthma attack in new or known asthmatic 32 (0.6)
Drug, procedure or transfusion induced bronchospasm in non-asthmatic 15 (0.3)
Lung collapse or atelectasis 12 (0.2)
Anoxic or ischaemic coma or encephalopathy 10 (0.2)
Pneumonitis due to food and vomit 10 (0.2)
Angio-neurotic oedema due to drug or treatment reaction 7 (0.1)
Pleural effusion 5 (0.1)
Lung abscess 4 (0.1)
COPD 3 (0.1)
Extrinsic compression of airway by thyroid or lymphoid tissue 3 (0.1)
Lung collapse due to pneumothorax 3 (0.1)
Non-traumatic haemothorax 3 (0.1)
Airway compression by extrinsic abscess 2 (0.0)
Exacerbation of bronchiectasis 2 (0.0)
Extrinsic compression of airway by abscess 2 (0.0)
Guillain-Barré syndrome 2 (0.0)
Laryngospasm 2 (0.0)
Neurogenic pulmonary oedema 2 (0.0)
Obstruction by foreign body 2 (0.0)
Parasitic pneumonia 2 (0.0)
Pulmonary haemorrhage not defined 2 (0.0)
Sputum retention 2 (0.0)
Traumatic pneumothorax 2 (0.0)
Tuberculosis 2 (0.0)
Upper airway bleeding not defined 2 (0.0)
Airway obstruction by foreign body 1 (0.0)

Obstetric admissions to critical care 2009-2012 27 of 80
1 January 2009 to 31 December 2012
Report published: December 2013
Primary reason for admission to the critical care unit – body system (bold text) or specific condition (regular text)
N (%*)
Alveolar proteinosis 1 (0.0)
Bronchial haemorrhage 1 (0.0)
Bronchial tumour 1 (0.0)
Congenital chest wall deformity 1 (0.0)
Cystic fibrosis 1 (0.0)
Empyema or infected effusion 1 (0.0)
Extrinsic compression of airway by haematoma 1 (0.0)
Inhalation pneumonitis (smoke or gases) 1 (0.0)
Mediastinal tumour 1 (0.0)
Obstructive sleep apnoea 1 (0.0)
Parkinson's Disease 1 (0.0)
Pulmonary fibrosis or fibrosing alveolitis 1 (0.0)
Secondary lung tumour 1 (0.0)
Tracheomalacia 1 (0.0)
Traumatic haemothorax or haemopneumothorax 1 (0.0)
Incomplete code 8 (0.1)
Cardiovascular 311 (5.6)
Pulmonary embolus (thrombus) 52 (0.9)
Anaphylaxis 45 (0.8)
Hypovolaemic shock 32 (0.6)
Cardiogenic pulmonary oedema 28 (0.5)
Cardiogenic shock 16 (0.3)
Other cardiomyopathies 16 (0.3)
Supra-ventricular tachycardia, atrial fibrillation or flutter 16 (0.3)
Ventricular tachycardia or fibrillation 16 (0.3)
Septic shock (no underlying condition given) 10 (0.2)
Bi-ventricular failure 8 (0.1)
Heart block 7 (0.1)
Left ventricular failure 7 (0.1)
Idiopathic pulmonary hypertension 5 (0.1)
Abnormality of mitral valve 4 (0.1)

Obstetric admissions to critical care 2009-2012 28 of 80
1 January 2009 to 31 December 2012
Report published: December 2013
Primary reason for admission to the critical care unit – body system (bold text) or specific condition (regular text)
N (%*)
Essential hypertension 4 (0.1)
Hypertrophic cardiomyopathy 4 (0.1)
Acute myocardial infarction 3 (0.1)
Complex congenital cardiac abnormality 3 (0.1)
Pericardial effusion 3 (0.1)
Abnormality of prosthetic valve 2 (0.0)
Atrial premature beats or ectopics 2 (0.0)
Congenital ventricular septal defect 2 (0.0)
Mural or intracavity thrombus 2 (0.0)
Non-traumatic dissection of thoracic aorta 2 (0.0)
Right ventricular failure 2 (0.0)
Splanchnic artery aneurysm or dissection not defined 2 (0.0)
Abdominal aortic aneurysm, ruptured 1 (0.0)
Abnormality of aortic valve 1 (0.0)
Accelerated or malignant hypertension 1 (0.0)
Aortic or iliac dissection or aneurysm 1 (0.0)
CABG for acute myocardial infarction 1 (0.0)
Endocarditis of tricuspid valve 1 (0.0)
Ischaemic cardiomyopathy 1 (0.0)
Myocardial ischaemia without angina 1 (0.0)
Myocarditis 1 (0.0)
Non-valvular endocarditis 1 (0.0)
Traumatic dissection or rupture of abdominal aorta or iliac vessels 1 (0.0)
Traumatic inferior vena caval damage 1 (0.0)
Ventricular ectopics 1 (0.0)
Visceral infarction due to primary vascular disease 1 (0.0)
Incomplete code 4 (0.1)
Gastrointestinal 250 (4.5)
Acute pancreatitis 32 (0.6)
Appendicitis or appendix abscess 23 (0.4)
Functional obstruction/pseudo-obstruction 23 (0.4)

Obstetric admissions to critical care 2009-2012 29 of 80
1 January 2009 to 31 December 2012
Report published: December 2013
Primary reason for admission to the critical care unit – body system (bold text) or specific condition (regular text)
N (%*)
Non-traumatic large bowel perforation or rupture 18 (0.3)
Primary peritonitis 13 (0.2)
Small bowel adhesions 13 (0.2)
Acute cholecystitis, gangrenous gall bladder, or empyema of gall bladder 8 (0.1)
Crohn's disease of large bowel, rectum or anus 6 (0.1)
Duodenal perforation due to ulcers 6 (0.1)
Traumatic large bowel perforation or rupture 6 (0.1)
Intra-peritoneal abscess (not pelvic) 5 (0.1)
Non-traumatic small bowel perforation 5 (0.1)
Spontaneous subcapsular haematoma 5 (0.1)
Traumatic rupture or laceration of spleen 5 (0.1)
Large bowel infarction due to herniation, volvulus or adhesions 4 (0.1)
Traumatic rupture or laceration of liver 4 (0.1)
Biliary tree obstruction 3 (0.1)
Bleeding duodenal ulcer, duodentitis or duodenal diverticulum 3 (0.1)
Infective colitis or proctocolitis 3 (0.1)
Large bowel adhesions 3 (0.1)
Retroperitoneal abscess or infection 3 (0.1)
Abdominal wound dehiscence 2 (0.0)
Bleeding from the biliary tree 2 (0.0)
Bleeding gastric ulcer or gastritis 2 (0.0)
Crohn's disease of small bowel 2 (0.0)
Gastric perforation due to ulcers 2 (0.0)
Large bowel artery stenosis or occlusion 2 (0.0)
Large bowel inflammatory masses 2 (0.0)
Secondary hepatic tumour 2 (0.0)
Small bowel herniation 2 (0.0)
Small bowel volvulus 2 (0.0)
Spontaneous splenic rupture 2 (0.0)
Tonsil or pharyngeal infection 2 (0.0)
Toxic dilatation of large bowel 2 (0.0)

Obstetric admissions to critical care 2009-2012 30 of 80
1 January 2009 to 31 December 2012
Report published: December 2013
Primary reason for admission to the critical care unit – body system (bold text) or specific condition (regular text)
N (%*)
Ulcerative colitis 2 (0.0)
Autoimmune hepatitis 1 (0.0)
Colonic or rectal bleeding 1 (0.0)
Drug induced hepatitis or hepatic necrosis 1 (0.0)
Gastric tumour 1 (0.0)
Hepatic abscess 1 (0.0)
Hernia not defined 1 (0.0)
Infective enteritides 1 (0.0)
Infective hepatitis 1 (0.0)
Infective oesophagitis 1 (0.0)
Infective pancreatitis 1 (0.0)
Inflammatory perforation of small bowel 1 (0.0)
Instrumental damage to large bowel 1 (0.0)
Intra-oral or pharyngeal tumour 1 (0.0)
Large bowel fistula 1 (0.0)
Large bowel intussusception or prolapse 1 (0.0)
Large bowel tumour 1 (0.0)
Large bowel volvulus 1 (0.0)
Leaking small bowel anastomosis 1 (0.0)
Malignant neoplasm of oropharynx 1 (0.0)
Other chronic pancreatitis 1 (0.0)
Portal vein occlusion or thrombosis 1 (0.0)
Small bowel infarction due to herniation, volvulus or adhesions 1 (0.0)
Small bowel tumour 1 (0.0)
Traumatic damage to splanchnic vessels 1 (0.0)
Traumatic small bowel perforation 1 (0.0)
Tuberculous peritonitis 1 (0.0)
Variceal bleeding 1 (0.0)
Incomplete code 4 (0.1)
Neurological (including eyes) 197 (3.5)
Status epilepticus or uncontrolled seizures 85 (1.5)

Obstetric admissions to critical care 2009-2012 31 of 80
1 January 2009 to 31 December 2012
Report published: December 2013
Primary reason for admission to the critical care unit – body system (bold text) or specific condition (regular text)
N (%*)
Intracerebral haemorrhage 18 (0.3)
Bacterial meningitis, not meningococcal 10 (0.2)
Non-traumatic subarachnoid haemorrhage 9 (0.2)
Thrombo-occlusive disease of brain 8 (0.1)
Post-anaesthetic encephalopathy aetiology uncertain 7 (0.1)
Encephalitis 6 (0.1)
Meningitis, unspecified 6 (0.1)
Venous sinus thrombosis 6 (0.1)
Pseudocholinesterase deficiency 5 (0.1)
Metabolic coma or encephalopathy 4 (0.1)
Primary brain or meningeal tumour 4 (0.1)
Toxic or drug-induced coma or encephalopathy 4 (0.1)
Embolic brain lesions causing respiratory failure 3 (0.1)
Central hypoventilation (Ondine's curse) 2 (0.0)
Non-traumatic subdural haemorrhage 2 (0.0)
Secondary hydrocephalus 2 (0.0)
Spina bifida or meningomyelocele 2 (0.0)
Berry or other intracranial aneurysm 1 (0.0)
Focal brain injury 1 (0.0)
Mouth, mandible, pharynx, or facial bones trauma 1 (0.0)
Myasthenia gravis 1 (0.0)
Non-accidental injury to brain 1 (0.0)
Primary (diffuse) brain injury 1 (0.0)
Secondary intracranial tumour 1 (0.0)
Spinal cord haematoma 1 (0.0)
Viral meningitis 1 (0.0)
Incomplete code 5 (0.1)
Genito-urinary 247 (4.4)
Pelvic infection or abscess 107 (1.9)
Acute renal failure 46 (0.8)
Pyelonephritis or pyonephrosis 33 (0.6)

Obstetric admissions to critical care 2009-2012 32 of 80
1 January 2009 to 31 December 2012
Report published: December 2013
Primary reason for admission to the critical care unit – body system (bold text) or specific condition (regular text)
N (%*)
Cystitis, pyocystis or urethritis 10 (0.2)
Renal failure due to hyperkalaemia 6 (0.1)
Retroperitoneal haemorrhage 6 (0.1)
Haemorrhage from bladder 4 (0.1)
Ureteric or renal obstruction 4 (0.1)
Haemorrhage from uterus 3 (0.1)
Ovarian cyst 3 (0.1)
Uterine tumour 3 (0.1)
Chronic renal failure 2 (0.0)
Hypovolaemic shock (following intrauterine death) 2 (0.0)
Toxic shock syndrome 2 (0.0)
Traumatic perforation or rupture of bladder 2 (0.0)
Tubo-ovarian abscess 2 (0.0)
Acute alcoholic hepatitis (following intrauterine death) 1 (0.0)
Bladder outlet obstruction 1 (0.0)
Diabetic ketoacidosis (following intrauterine death) 1 (0.0)
Haemorrhage from ovary or fallopian tubes 1 (0.0)
Instrumental damage to uterus, ovaries or fallopian tubes 1 (0.0)
Nephrotic syndrome 1 (0.0)
Perinephric abscess 1 (0.0)
Renal or ureteric tumour 1 (0.0)
Traumatic perforation or rupture of urethra 1 (0.0)
Uterine rupture or perforation 1 (0.0)
Incomplete code 2 (0.0)
Endocrine, metabolic, thermoregulation and poisoning 91 (1.6)
Diabetic ketoacidosis 32 (0.6)
Failure of reversal of non-depolarising neuromuscular blockers 10 (0.2)
Lactic acidosis 6 (0.1)
Morbid obesity 5 (0.1)
Accidental poisoning with narcotics 3 (0.1)
Accidental poisoning with sedatives or hypnotics 3 (0.1)

Obstetric admissions to critical care 2009-2012 33 of 80
1 January 2009 to 31 December 2012
Report published: December 2013
Primary reason for admission to the critical care unit – body system (bold text) or specific condition (regular text)
N (%*)
Hyperchloraemic acidosis 3 (0.1)
Self poisoning with sedatives or hypnotics 3 (0.1)
Self poisoning with tri- and tetracyclic antidepressants 3 (0.1)
Ovarian tumour 2 (0.0)
Self poisoning with insulin 2 (0.0)
Accidental hypothermia 1 (0.0)
Accidental poisoning with paracetamol 1 (0.0)
Addison's disease 1 (0.0)
Adrenal haemorrhage 1 (0.0)
Diabetes insipidus (central) 1 (0.0)
Diabetes mellitus 1 (0.0)
Excess parenteral fluids 1 (0.0)
Hyperthyroidism 1 (0.0)
Induced or post-operative hypothermia 1 (0.0)
Pituitary tumour not defined 1 (0.0)
Self poisoning with agent not defined 1 (0.0)
Self poisoning with alcohol 1 (0.0)
Self poisoning with narcotics 1 (0.0)
Self poisoning with paracetamol 1 (0.0)
Thyroid crisis 1 (0.0)
Water intoxication 1 (0.0)
Incomplete code 3 (0.1)
Haematological/immunological 45 (0.8)
Sickle cell disease 10 (0.2)
Thrombotic thrombocytopaenic purpura 10 (0.2)
Disseminated intravascular coagulation 8 (0.1)
Septicaemia (no underlying condition given) 8 (0.1)
Transfusion reaction 5 (0.1)
Acute myeloblastic leukaemia 1 (0.0)
Anaemias 1 (0.0)
Drug induced thrombocytopaenia 1 (0.0)

Obstetric admissions to critical care 2009-2012 34 of 80
1 January 2009 to 31 December 2012
Report published: December 2013
Primary reason for admission to the critical care unit – body system (bold text) or specific condition (regular text)
N (%*)
Incomplete code 1 (0.0)
Musculoskeletal 27 (0.5)
Infective arthritis 4 (0.1)
Systemic lupus erythromatosis 4 (0.1)
Haemorrhage from or haematoma of pelvis, long bones or joints 3 (0.1)
Kyphoscoliosis 3 (0.1)
Pelvic fracture 3 (0.1)
Abscess of muscle or connective tissue 2 (0.0)
Trauma to abdominal wall 2 (0.0)
Congenital muscular dystrophy 1 (0.0)
Haemorrhage from or haematoma of muscle or connective tissue 1 (0.0)
Multiple long bone fractures 1 (0.0)
Myositis 1 (0.0)
Primary tumour in vertebral column 1 (0.0)
Primary tumour of bone 1 (0.0)
Dermatological 38 (0.7)
Necrotising fasciitis 33 (0.6)
Cutaneous cellulitis 5 (0.1)
Psychiatric 2 (0.0)
Depression 1 (0.0)
Mania or manic depression 1 (0.0)
* Percentage of all female admissions aged 16-50 years reported as ‘recently pregnant’ on admission to the critical
care unit.
Obstetric admissions to critical care 2009-2012 35 of 80
1 January 2009 to 31 December 2012
Report published: December 2013
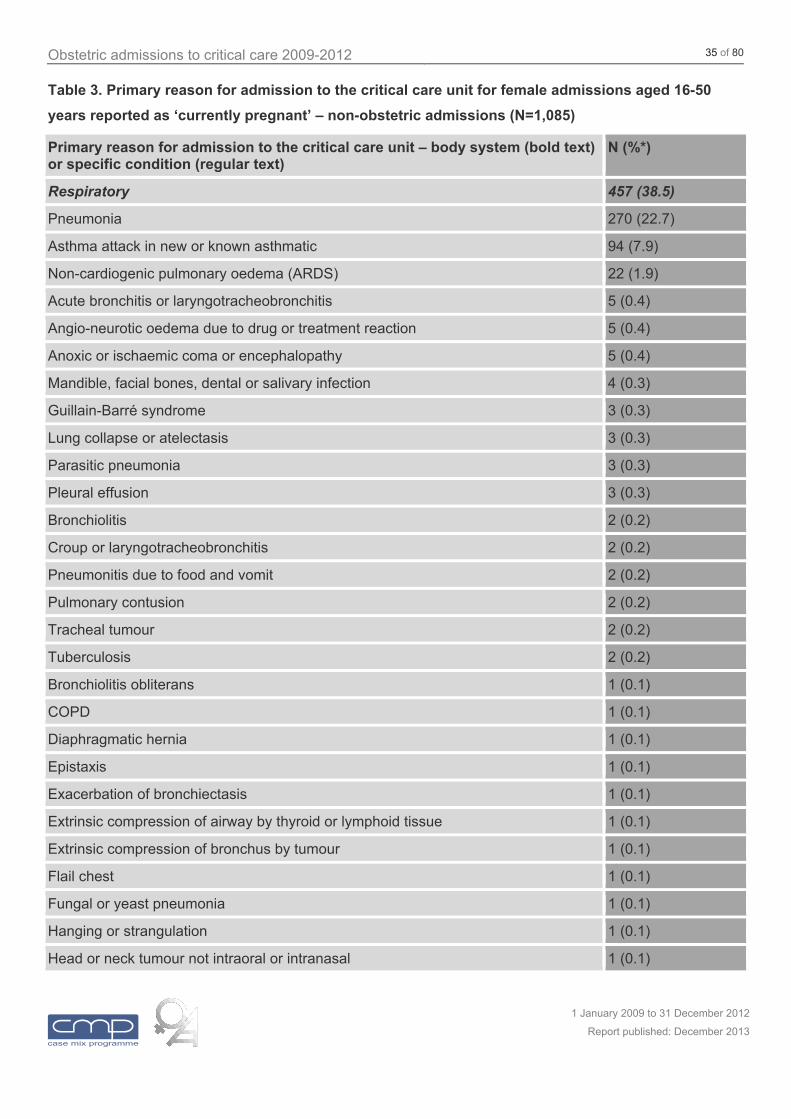
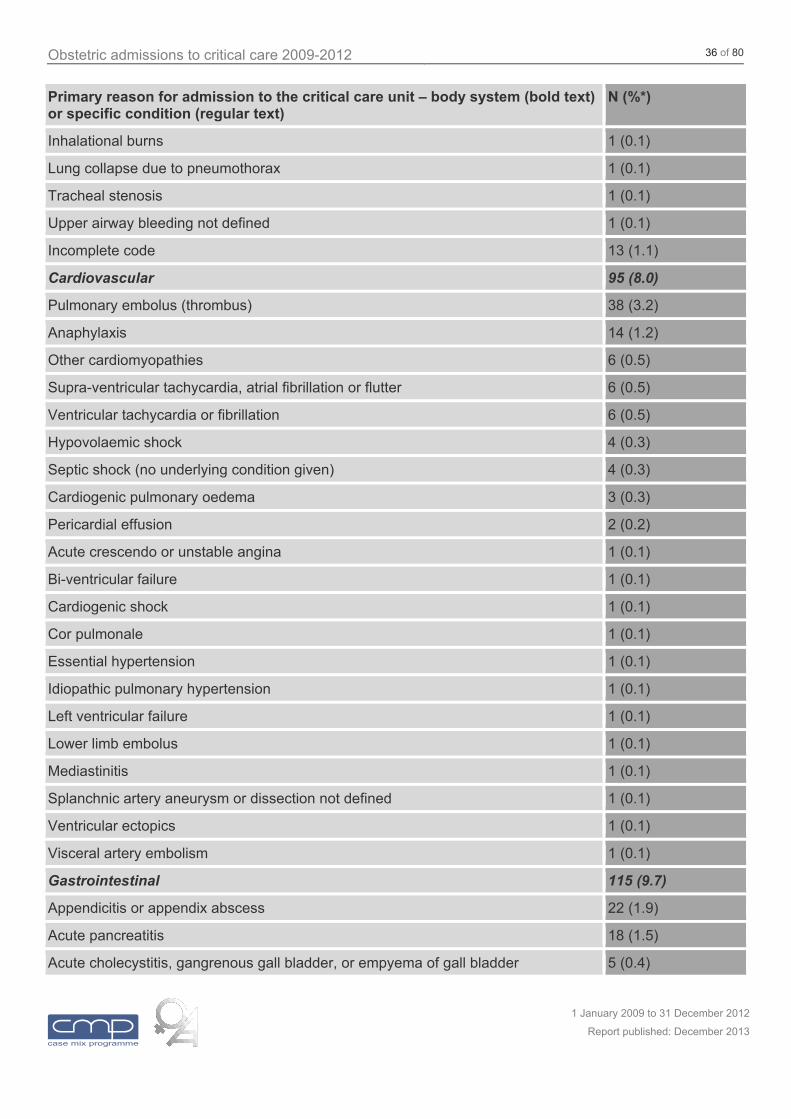
Table 3. Primary reason for admission to the critical care unit for female admissions aged 16-50
years reported as ‘currently pregnant’ – non-obstetric admissions (N=1,085)
Primary reason for admission to the critical care unit – body system (bold text) or specific condition (regular text)
N (%*)
Respiratory 457 (38.5)
Pneumonia 270 (22.7)
Asthma attack in new or known asthmatic 94 (7.9)
Non-cardiogenic pulmonary oedema (ARDS) 22 (1.9)
Acute bronchitis or laryngotracheobronchitis 5 (0.4)
Angio-neurotic oedema due to drug or treatment reaction 5 (0.4)
Anoxic or ischaemic coma or encephalopathy 5 (0.4)
Mandible, facial bones, dental or salivary infection 4 (0.3)
Guillain-Barré syndrome 3 (0.3)
Lung collapse or atelectasis 3 (0.3)
Parasitic pneumonia 3 (0.3)
Pleural effusion 3 (0.3)
Bronchiolitis 2 (0.2)
Croup or laryngotracheobronchitis 2 (0.2)
Pneumonitis due to food and vomit 2 (0.2)
Pulmonary contusion 2 (0.2)
Tracheal tumour 2 (0.2)
Tuberculosis 2 (0.2)
Bronchiolitis obliterans 1 (0.1)
COPD 1 (0.1)
Diaphragmatic hernia 1 (0.1)
Epistaxis 1 (0.1)
Exacerbation of bronchiectasis 1 (0.1)
Extrinsic compression of airway by thyroid or lymphoid tissue 1 (0.1)
Extrinsic compression of bronchus by tumour 1 (0.1)
Flail chest 1 (0.1)
Fungal or yeast pneumonia 1 (0.1)
Hanging or strangulation 1 (0.1)
Head or neck tumour not intraoral or intranasal 1 (0.1)
Obstetric admissions to critical care 2009-2012 36 of 80
1 January 2009 to 31 December 2012
Report published: December 2013
Primary reason for admission to the critical care unit – body system (bold text) or specific condition (regular text)
N (%*)
Inhalational burns 1 (0.1)
Lung collapse due to pneumothorax 1 (0.1)
Tracheal stenosis 1 (0.1)
Upper airway bleeding not defined 1 (0.1)
Incomplete code 13 (1.1)
Cardiovascular 95 (8.0)
Pulmonary embolus (thrombus) 38 (3.2)
Anaphylaxis 14 (1.2)
Other cardiomyopathies 6 (0.5)
Supra-ventricular tachycardia, atrial fibrillation or flutter 6 (0.5)
Ventricular tachycardia or fibrillation 6 (0.5)
Hypovolaemic shock 4 (0.3)
Septic shock (no underlying condition given) 4 (0.3)
Cardiogenic pulmonary oedema 3 (0.3)
Pericardial effusion 2 (0.2)
Acute crescendo or unstable angina 1 (0.1)
Bi-ventricular failure 1 (0.1)
Cardiogenic shock 1 (0.1)
Cor pulmonale 1 (0.1)
Essential hypertension 1 (0.1)
Idiopathic pulmonary hypertension 1 (0.1)
Left ventricular failure 1 (0.1)
Lower limb embolus 1 (0.1)
Mediastinitis 1 (0.1)
Splanchnic artery aneurysm or dissection not defined 1 (0.1)
Ventricular ectopics 1 (0.1)
Visceral artery embolism 1 (0.1)
Gastrointestinal 115 (9.7)
Appendicitis or appendix abscess 22 (1.9)
Acute pancreatitis 18 (1.5)
Acute cholecystitis, gangrenous gall bladder, or empyema of gall bladder 5 (0.4)

Obstetric admissions to critical care 2009-2012 37 of 80
1 January 2009 to 31 December 2012
Report published: December 2013
Primary reason for admission to the critical care unit – body system (bold text) or specific condition (regular text)
N (%*)
Small bowel adhesions 5 (0.4)
Large bowel volvulus 4 (0.3)
Tonsil or pharyngeal infection 4 (0.3)
Crohn's disease of large bowel, rectum or anus 3 (0.3)
Non-traumatic large bowel perforation or rupture 3 (0.3)
Non-traumatic small bowel perforation 3 (0.3)
Traumatic rupture or laceration of liver 3 (0.3)
Bleeding duodenal ulcer, duodentitis or duodenal diverticulum 2 (0.2)
Bleeding gastric ulcer or gastritis 2 (0.2)
Crohn's disease of small bowel 2 (0.2)
Drug induced hepatitis or hepatic necrosis 2 (0.2)
Infective colitis or proctocolitis 2 (0.2)
Infective pancreatitis 2 (0.2)
Leaking oesophageal anastomosis 2 (0.2)
Spontaneous rupture of oesophagus 2 (0.2)
Traumatic rupture of oesophagus 2 (0.2)
Bleeding gastric varices 1 (0.1)
Cholelithiasis 1 (0.1)
Functional obstruction/pseudo-obstruction 1 (0.1)
Hepatic abscess 1 (0.1)
Hernia not defined 1 (0.1)
Hydatid disease 1 (0.1)
Infective enteritides 1 (0.1)
Intra-oral or pharyngeal tumour 1 (0.1)
Ischaemic colitis 1 (0.1)
Large bowel adhesions 1 (0.1)
Large bowel artery stenosis or occlusion 1 (0.1)
Large bowel tumour 1 (0.1)
Malignant large bowel tumour 1 (0.1)
Mallory-Weiss or other tear 1 (0.1)
Oesophagitis or oesophageal ulcers 1 (0.1)

Obstetric admissions to critical care 2009-2012 38 of 80
1 January 2009 to 31 December 2012
Report published: December 2013
Primary reason for admission to the critical care unit – body system (bold text) or specific condition (regular text)
N (%*)
Pyloric obstruction 1 (0.1)
Small bowel inflammatory masses 1 (0.1)
Small bowel volvulus 1 (0.1)
Spontaneous splenic rupture 1 (0.1)
Traumatic large bowel perforation or rupture 1 (0.1)
Traumatic rupture or laceration of spleen 1 (0.1)
Ulcerative colitis 1 (0.1)
Incomplete code 5 (0.4)
Neurological (including eyes) 106 (8.9)
Status epilepticus or uncontrolled seizures 49 (4.1)
Primary brain or meningeal tumour 6 (0.5)
Intracerebral haemorrhage 5 (0.4)
Meningitis, unspecified 5 (0.4)
Bacterial meningitis, not meningococcal 4 (0.3)
Encephalitis 4 (0.3)
Non-traumatic subarachnoid haemorrhage 4 (0.3)
Traumatic subdural haemorrhage 3 (0.3)
Epidural injection or infusion 2 (0.2)
Secondary hydrocephalus 2 (0.2)
Skull fracture 2 (0.2)
Thrombo-occlusive disease of brain 2 (0.2)
Viral meningitis 2 (0.2)
Berry or other intracranial aneurysm 1 (0.1)
Cervical cord injury 1 (0.1)
Extradural haemorrhage 1 (0.1)
Intracranial arterio-venous malformation 1 (0.1)
Mouth, mandible, pharynx, or facial bones trauma 1 (0.1)
Myasthenia gravis 1 (0.1)
Primary (diffuse) brain injury 1 (0.1)
Toxic or drug-induced coma or encephalopathy 1 (0.1)
Traumatic subarachnoid haemorrhage 1 (0.1)

Obstetric admissions to critical care 2009-2012 39 of 80
1 January 2009 to 31 December 2012
Report published: December 2013
Primary reason for admission to the critical care unit – body system (bold text) or specific condition (regular text)
N (%*)
Incomplete code 7 (0.6)
Genito-urinary 131 (11.0)
Pyelonephritis or pyonephrosis 87 (7.3)
Cystitis, pyocystis or urethritis 16 (1.3)
Pelvic infection or abscess 8 (0.7)
Renal hypokalaemia 5 (0.4)
Acute renal failure 4 (0.3)
Ureteric or renal obstruction 3 (0.3)
Ovarian cyst 2 (0.2)
Chronic renal failure 1 (0.1)
Renal failure due to hyperkalaemia 1 (0.1)
Uterine tumour 1 (0.1)
Incomplete code 3 (0.3)
Endocrine, metabolic, thermoregulation and poisoning 141 (11.9)
Diabetic ketoacidosis 66 (5.6)
Self poisoning with agent not defined 7 (0.6)
Hyperchloraemic acidosis 6 (0.5)
Lactic acidosis 6 (0.5)
Self poisoning with sedatives or hypnotics 6 (0.5)
Hypoglycaemia due to insulin therapy 5 (0.4)
Self poisoning with paracetamol 5 (0.4)
Self poisoning with tri- and tetracyclic antidepressants 5 (0.4)
Alcohol withdrawal seizures 3 (0.3)
Diabetes mellitus 3 (0.3)
Parathyroid tumour 3 (0.3)
Eating disorder 2 (0.2)
Hypercalcaemia 2 (0.2)
Hyperthyroidism 2 (0.2)
Hypoglycaemia not due to excess insulin 2 (0.2)
Self poisoning with industrial or agricultural chemicals 2 (0.2)
Self poisoning with non-cyclic antidepressants 2 (0.2)

Obstetric admissions to critical care 2009-2012 40 of 80
1 January 2009 to 31 December 2012
Report published: December 2013
Primary reason for admission to the critical care unit – body system (bold text) or specific condition (regular text)
N (%*)
Accidental poisoning with agent not defined 1 (0.1)
Accidental poisoning with paracetamol 1 (0.1)
Excess parenteral fluids 1 (0.1)
Gastric fluid loss 1 (0.1)
Ovarian tumour 1 (0.1)
Paraneoplastic hypokalaemia 1 (0.1)
Self poisoning with alcohol 1 (0.1)
Self poisoning with narcotics 1 (0.1)
Thyroid crisis 1 (0.1)
Water intoxication 1 (0.1)
Incomplete code 4 (0.3)
Haematological/immunological 24 (2.0)
Sickle cell disease 8 (0.7)
Malaria 4 (0.3)
Septicaemia (no underlying condition given) 4 (0.3)
Thrombotic thrombocytopaenic purpura 3 (0.3)
Autoimmume haemolysis 2 (0.2)
Disseminated intravascular coagulation 1 (0.1)
Idiopathic thrombocytopaenic purpura 1 (0.1)
Porphyria 1 (0.1)
Musculoskeletal 13 (1.1)
Pelvic fracture 3 (0.3)
Multiple long bone fractures 2 (0.2)
Single long bone fracture 2 (0.2)
Abscess of muscle or connective tissue 1 (0.1)
Myositis 1 (0.1)
Non-accidental injury to muscles or connective tissue 1 (0.1)
Rhabdomyolysis 1 (0.1)
Thoracic spine fracture or ligamentous injury 1 (0.1)
Incomplete code 1 (0.1)
Dermatological 2 (0.2)

Obstetric admissions to critical care 2009-2012 41 of 80
1 January 2009 to 31 December 2012
Report published: December 2013
Primary reason for admission to the critical care unit – body system (bold text) or specific condition (regular text)
N (%*)
Burns caused by dry heat 1 (0.1)
Cutaneous cellulitis 1 (0.1)
Psychiatric 1 (0.1)
Depression 1 (0.1)
* Percentage of all female admissions aged 16-50 years reported as ‘currently pregnant’ on admission to the critical
care unit.

Obstetric admissions to critical care 2009-2012 42 of 80
1 January 2009 to 31 December 2012
Report published: December 2013
Table 4. Primary reason for admission to the critical care unit for female admissions aged 16-50
years reported as ‘currently pregnant’ – obstetric-related admissions (N=103)
Primary reason for admission to the critical care unit – body system (bold text) or specific condition (regular text)
N (%*)
Cardiovascular 2 (0.2)
Cardiogenic pulmonary oedema 1 (0.1)
Hypovolaemic shock 1 (0.1)
Gastrointestinal 3 (0.3)
Acute fatty liver of pregnancy 3 (0.3)
Genito-urinary 78 (6.6)
Pre-eclampsia 25 (2.1)
HELLP syndrome 8 (0.7)
Ectopic pregnancy6 7 (0.6)
Eclampsia 6 (0.5)
Threatened miscarriage 6 (0.5)
Antepartum haemorrhage 5 (0.4)
Intrauterine death6 4 (0.3)
Peripartum haemorrhage 4 (0.3)
Uterine rupture or perforation 4 (0.3)
Haemorrhage from uterus 2 (0.2)
Amnionitis 1 (0.1)
Amniotic fluid embolus 1 (0.1)
Haemorrhage from ovary or fallopian tubes 1 (0.1)
Infected retained products of conception6 1 (0.1)
Septic abortion6 1 (0.1)
Septicaemia (following intrauterine death)6 1 (0.1)
Incomplete code 1 (0.1)
Endocrine, metabolic, thermoregulation and poisoning 20 (1.7)
Ovarian hyperstimulation 10 (0.8)
Incomplete code 10 (0.8)
6 Confirmed as pre-surgical admissions, except one post-surgical admission for ectopic pregnancy confirmed to have
a second viable pregnancy ongoing.

Obstetric admissions to critical care 2009-2012 43 of 80
1 January 2009 to 31 December 2012
Report published: December 2013
* Percentage of all female admissions aged 16-50 years reported as ‘currently pregnant’ on admission.

Obstetric admissions to critical care 2009-2012 44 of 80
1 January 2009 to 31 December 2012
Report published: December 2013
5.2 Extrapolation and comparison with national figures
The estimated total number of admissions to all adult, general critical care units in England, Wales and
Northern Ireland in each year were obtained by calculating the rate of admissions in that year (number of
observed admissions divided by proportion of the year for which data were collected) for each unit in the
CMPD, averaging over the units, and multiplying by the total number of adult, general critical care units in
England, Wales and Northern Ireland. This was assumed to be 232 units.
The proportion of admissions in the CMPD during each year that were reported as ‘currently pregnant’ or
‘recently pregnant’ female admissions to critical care aged 16-50 was calculated. These proportions were
then applied to the estimated total number of admissions for each year to estimate the extrapolated total
numbers of admissions to all adult, general critical care units in England, Wales and Northern Ireland that
were currently or recently pregnant women aged 16-50.
This extrapolated figure was compared with population figures obtained from the Office for National
Statistics (www.ons.gov.uk) and Northern Ireland Statistics and Research Agency (www.nisra.gov.uk) for
the number of maternities (pregnancies ending in stillbirths or live births) in England, Wales and Northern
Ireland. Over the entire time period of 2009 to 2012, the extrapolated figures of 1,490 currently pregnant
admissions and 7,020 recently pregnant admissions were estimated to represent approximately 0.5 and 2.4
admissions per 1,000 maternities, respectively. The annual trend in the extrapolated total numbers of
admissions and numbers of admissions per 1,000 maternities are shown in Figure 9 and Figure 10,
respectively.

Obstetric admissions to critical care 2009-2012 45 of 80
1 January 2009 to 31 December 2012
Report published: December 2013
Figure 9. Trend in extrapolated total number of currently and recently pregnant admissions to adult,
general critical care units in England, Wales and Northern Ireland, 2009 to 2012
251 325 305 3161230 1379 1527 1485
0
500
1000
1500
2000
Ext
rap
ola
ted
to
tal n
umb
er
of a
dm
issi
on
s
2009 2010 2011 2012Year of critical care unit admission
Currently pregnant Recently pregnant

Obstetric admissions to critical care 2009-2012 46 of 80
1 January 2009 to 31 December 2012
Report published: December 2013
Figure 10. Trend in estimated rate of currently and recently pregnant admissions to adult, general
critical care units in England, Wales and Northern Ireland per 1,000 maternities, 2009 to 2012
251 325 305 3161230 1379 1527 1485
0
1
2
3
Adm
issi
ons
per
1,00
0 m
ate
rniti
es
(95%
CI)
2009 2010 2011 2012Year of critical care unit admission
Currently pregnant Recently pregnant
5.3 Case mix, outcome and resource use
The case mix of female admissions aged 16-50 reported as ‘currently pregnant’ and ‘recently pregnant’
compared with all other female admissions aged 16-50 is presented in Table 5. Annual trends in the case
mix factors from 2009 to 2012 are shown in Figure 11 to Figure 14.
The outcomes of female admissions aged 16-50 reported as ‘currently pregnant’ and ‘recently pregnant’
compared with all other female admissions aged 16-50 is presented in Table 6. Annual trends in outcomes
from 2009 to 2012 are shown in Figure 15 and Figure 16.
The resource use of female admissions aged 16-50 reported as ‘currently pregnant’ and ‘recently pregnant’
compared with all other female admissions aged 16-50 is presented in Table 7. Annual trends in the
percentage of critical care unit bed-days occupied by admissions reported as ‘currently pregnant’ or
‘recently pregnant’, by level of care, from 2009 to 2012 are shown in Figure 17.

Obstetric admissions to critical care 2009-2012 47 of 80
1 January 2009 to 31 December 2012
Report published: December 2013
Table 5. Case mix of female admissions to critical care aged 16-50 years reported as ‘currently
pregnant’, ‘recently pregnant’ or neither on admission to the critical care unit
Female admissions aged 16-50 years Currently pregnant
Recently pregnant
Neither
Number of admissions 1,188 5,605 48,998
Age (years), mean (SD) 28.1 (6.7) 30.7 (6.4) 36.4 (9.6)
Ethnicity, n (%) White 922 (77.6) 4,073 (72.7) 42,861 (87.5)
Mixed 22 (1.9) 87 (1.6) 532 (1.1)
Asian 115 (9.7) 666 (11.9) 1,975 (4.0)
Black 74 (6.2) 458 (8.2) 1,940 (4.0)
Other 28 (2.4) 182 (3.2) 569 (1.2)
Not stated 27 (2.3) 139 (2.5) 1,121 (2.3)
Surgical status, n (%) Non-surgical 1,060 (89.2) 2,659 (47.4) 34,304 (70.0)
Elective/scheduled 23 (1.9) 272 (4.9) 8,174 (16.7)
Emergency/urgent 105 (8.8) 2,674 (47.7) 6,514 (13.3)
Last non-transient location prior to admission to critical care, n (%)
Ward 434 (36.5) 662 (11.8) 25,507 (52.1)
Obstetrics area 375 (31.6) 4,227 (75.4) 18 (<0.1)
Other intermediate care area 29 (2.4) 94 (1.7) 1,141 (2.3)
Level 3 bed in adult ICU or ICU/HDU
27 (2.3) 69 (1.2) 1,280 (2.6)
Level 2 bed in adult ICU or ICU/HDU
12 (1.0) 40 (0.7) 499 (1.0)
Adult HDU 31 (2.6) 76 (1.4) 1,165 (2.4)
Paediatric/neonatal ICU/HDU 0 (0) 0 (0) 15 (<0.1)
Not in hospital 280 (23.6) 437 (7.8) 19,373 (39.5)
ICNARC Physiology Score, mean (SD) 12.3 (6.8) 11.6 (6.4) 14.9 (8.8)
APACHE II Score*, mean (SD) 11.3 (5.0) 10.1 (4.6) 12.4 (6.6)
* The performance of the APACHE II model has previously been assessed in obstetric admissions in the CMPD.7 The
APACHE II score was found to have good discrimination, but the risk predictions overestimated mortality.
7 Harrison DA, Penny JA, Yentis SM, Fayek S, Brady A. Case mix, outcome and activity for obstetric admissions to
adult, general critical care units: a secondary analysis of the ICNARC Case Mix Programme Database. Crit Care
2005; 9:S25-37

Obstetric admissions to critical care 2009-2012 48 of 80
1 January 2009 to 31 December 2012
Report published: December 2013
Figure 11. Trend in mean age of female admissions aged 16-50 reported as ‘currently pregnant’ or
‘recently pregnant’, 2009 to 2012
250 323 302 3131224 1375 1523 1483
0
10
20
30
40
Me
an
age
+/-
SD
2009 2010 2011 2012Year of critical care unit admission
Currently pregnant Recently pregnant

Obstetric admissions to critical care 2009-2012 49 of 80
1 January 2009 to 31 December 2012
Report published: December 2013
Figure 12. Trend in percentage of admissions from theatre for female admissions aged 16-50
reported as ‘currently pregnant’ or ‘recently pregnant’, 2009 to 2012
250 323 302 3131224 1375 1523 1483
0
20
40
60
Adm
issi
ons
from
thea
tre,
pe
rcen
t (9
5% C
I)
2009 2010 2011 2012Year of critical care unit admission
Currently pregnant Recently pregnant

Obstetric admissions to critical care 2009-2012 50 of 80
1 January 2009 to 31 December 2012
Report published: December 2013
Figure 13. Trend in mean ICNARC Physiology Score for female admissions aged 16-50 reported as
‘currently pregnant’ or ‘recently pregnant’, 2009 to 2012
250 323 302 3131224 1375 1523 1483
0
5
10
15
20
Mea
n IC
NA
RC
Ph
ysio
logy
Sco
re +
/- S
D
2009 2010 2011 2012Year of critical care unit admission
Currently pregnant Recently pregnant

Obstetric admissions to critical care 2009-2012 51 of 80
1 January 2009 to 31 December 2012
Report published: December 2013
Figure 14. Trend in mean APACHE II Score for female admissions aged 16-50 reported as ‘currently
pregnant’ or ‘recently pregnant’, 2009 to 2012
247 311 292 2981174 1313 1445 1417
0
5
10
15
20
Me
an A
PA
CH
E I
I S
core
+/-
SD
2009 2010 2011 2012Year of critical care unit admission
Currently pregnant Recently pregnant
Table 6. Outcomes for female admissions to critical care aged 16-50 years reported as ‘currently
pregnant’, ‘recently pregnant’ or neither on admission to the critical care unit
Female admissions aged 16-50 years Currently pregnant
Recently pregnant
Neither
Number of admissions 1,188 5,605 48,998
Critical care unit mortality, deaths (%) [95% CI] 20 (1.7) [1.1, 2.6]
73 (1.3) [1.0, 1.6]
4,299 (8.8) [8.5, 9.0]
Acute hospital mortality*, deaths (%) [95% CI] 30 (2.7) [1.9, 3.8]
97 (1.8) [1.5, 2.2]
5,325 (11.6) [11.3, 11.9]
Location of death, n (% of deaths)
Original critical care unit admission
19 (63.3) 67 (69.1) 3,986 (74.9)
Subsequent critical care unit admission†
7 (23.3) 22 (22.7) 552 (10.4)
Acute hospital – following discharge from critical care‡
4 (13.3) 8 (8.2) 787 (14.8)
* Excluding readmissions to the critical care unit within the same acute hospital stay.
† Following transfer to another critical care unit or readmission to the original critical care unit.
‡ May include some deaths in other critical care units not participating in the CMP.

Obstetric admissions to critical care 2009-2012 52 of 80
1 January 2009 to 31 December 2012
Report published: December 2013
Figure 15. Trend in critical care unit mortality for female admissions aged 16-50 reported as
‘currently pregnant’ or ‘recently pregnant’, 2009 to 2012
250 323 302 3131224 1375 1523 1483
0
2
4
6
Crit
ica
l ca
re u
nit
mo
rta
lity,
pe
rce
nt
(95
% C
I)
2009 2010 2011 2012Year of critical care unit admission
Currently pregnant Recently pregnant

Obstetric admissions to critical care 2009-2012 53 of 80
1 January 2009 to 31 December 2012
Report published: December 2013
Figure 16. Trend in acute hospital mortality for female admissions aged 16-50 reported as ‘currently
pregnant’ or ‘recently pregnant’, 2009 to 2012
237 301 286 2991180 1341 1472 1436
0
2
4
6
Acu
te h
ospi
tal m
ort
ality
, pe
rcen
t (95
% C
I)
2009 2010 2011 2012Year of critical care unit admission
Currently pregnant Recently pregnant
Table 7. Resource use for female admissions to critical care aged 16-50 years reported as ‘currently
pregnant’, ‘recently pregnant’ or neither on admission to the critical care unit
Female admissions aged 16-50 years Currently pregnant
Recently pregnant
Neither
Number of admissions 1,188 5,605 48,998
Critical care unit length of stay (days), median (IQR)
All admissions 2.0 (1.1, 3.9) 1.1 (0.7, 2.1) 1.9 (0.9, 4.4)
Critical care unit survivors 2.0 (1.1, 3.9) 1.1 (0.7, 2.1) 1.9 (1.0, 4.2)
Critical care unit non-survivors 5.1 (1.4, 15.6) 1.5 (0.6, 5.1) 2.2 (0.8, 6.3)
Level of care, mean days
Level 3 2.2 1.4 3.0
Level 2 2.4 1.6 2.1
Level 1/0 0.3 0.2 0.3
Destination following discharge from critical care, n (%)
Ward 607 (52.0) 1,218 (22.0) 34,261 (76.6)
Obstetrics area 336 (28.8) 3,741 (67.6) 12 (<0.1)
Other intermediate care area 12 (1.0) 79 (1.4) 877 (2.0)
Level 3 bed in adult ICU or ICU/HDU
63 (5.4) 126 (2.3) 1,568 (3.5)

Obstetric admissions to critical care 2009-2012 54 of 80
1 January 2009 to 31 December 2012
Report published: December 2013
Level 2 bed in adult ICU or ICU/HDU
21 (1.8) 62 (1.1) 779 (1.7)
Adult HDU 64 (5.5) 229 (4.1) 2,801 (6.3)
Paediatric/neonatal ICU/HDU 0 (0) 0 (0) 33 (0.1)
Recovery (as temporary critical care area)
1 (0.1) 17 (0.3) 179 (0.4)
Not in hospital 64 (5.5) 60 (1.1) 4,189 (9.4)
Readmission to the critical care unit within the same acute hospital stay, n (% of survivors)
7 (3.5) 26 (2.6) 384 (5.1)
Acute hospital length of stay* (days), median (IQR)
All patients 8 (5, 14) 7 (5, 12) 9 (4, 20)
Acute hospital survivors 8 (5, 13) 7 (5, 12) 9 (4, 20)
Acute hospital non-survivors 7 (2, 24) 5 (1, 19) 6 (2, 18)
* Excluding readmissions to the critical care unit within the same acute hospital stay.
Figure 17. Trend in the percentage of critical care bed-days by level of care for female admissions
aged 16-50 reported as ‘currently pregnant’ or ‘recently pregnant’, 2009 to 2012
251 325 305 3161230 1379 1527 1485
0.0
0.1
0.2
0.3
0.4
Pe
rce
nta
ge
of
criti
cal c
are
uni
t be
d-d
ays
2009 2010 2011 2012Year of critical care unit admission
Currently pregnant: Level 3 Level 2
Recently pregnant: Level 3 Level 2

Obstetric admissions to critical care 2009-2012 55 of 80
1 January 2009 to 31 December 2012
Report published: December 2013
5.4 Obstetric-related data for admissions reported as ‘currently pregnant’
Of the 1,188 female admissions aged 16-50 years reported as ‘currently pregnant’ on admission to the
critical care unit, 12 (1.0%) were missing data for both gestation on admission and expected date of
delivery. When gestation was not recorded, it was calculated from the expected date of delivery. The
median gestation was 25 weeks (interquartile range 18 to 31 weeks); the distribution of gestation is shown
in weeks in Figure 18 and in trimesters in Figure 19.

Obstetric admissions to critical care 2009-2012 56 of 80
1 January 2009 to 31 December 2012
Report published: December 2013
Figure 18. Gestation (weeks) for female admissions aged 16-50 reported as ‘currently pregnant’ on
admission to the critical care unit
0
2
4
6
Pe
rce
nta
ge o
f a
dm
issi
on
s
0 5 10 15 20 25 30 35 40Gestation (weeks)

Obstetric admissions to critical care 2009-2012 57 of 80
1 January 2009 to 31 December 2012
Report published: December 2013
Figure 19. Gestation (trimesters) for female admissions aged 16-50 reported as ‘currently pregnant’
on admission to the critical care unit
0
10
20
30
40
50
Pe
rce
nta
ge o
f a
dm
issi
on
s
<13 13-27 28+Gestation (weeks)
5.5 Obstetric-related data for admissions reported as ‘recently pregnant’
Of the 5,605 female admissions aged 16-50 years reported as ‘recently pregnant’ on admission to the
critical care unit, 81 (1.4%) were missing data for use of assisted conception and for a further 1,401
(25.0%) the assisted conception status was unknown. Of the remaining admissions, assisted conception
was used in 320 (7.8%).
Outcomes were classified as live birth(s), stillbirth(s), both live and stillbirths, termination, ectopic and
miscarriage based on the fields outcome of recent pregnancy, number of live births (babies) from recent
pregnancy and number of stillbirths from recent pregnancy. There was insufficient data to make this
classification for 93 admissions (1.7%). The distribution of outcome is shown in Figure 20 and the trend
over time in the percentage of admissions following one or more live and/or stillbirths is shown in Figure 21.
Gestation at delivery of recent pregnancy was missing for 182 admissions (3.2%). The median gestation
was 38 weeks (interquartile range 35 to 40 weeks) for admissions following one or more live and/or
stillbirths and 9 weeks (6 to 16 weeks) for admissions following termination, ectopic or miscarriage; the
distribution of gestation, split by outcome, is shown in weeks in Figure 22 and in trimesters in Figure 23. Of
admissions following one or more live and/or stillbirths, 3,209 (67.6%) were term deliveries (gestation 37

Obstetric admissions to critical care 2009-2012 58 of 80
1 January 2009 to 31 December 2012
Report published: December 2013
weeks or more) and 1,539 (32.4%) were preterm (gestation less than 37 weeks). The trend over time in
the percentage of admissions following preterm delivery is shown in Figure 24.
Actual date of delivery of recent pregnancy was missing for 71 admissions (1.3%). The distribution of the
number of days from delivery to admission to the critical care unit, by outcome, is shown in Figure 25.
Molar pregnancy associated with recent pregnancy was missing for 91 admissions (1.6%). Of the
remaining admissions, 18 (0.3%) were reported to be molar pregnancies.
Number of live births (babies) or stillbirths from previous pregnancies and number of previous Caesarean
sections excluding most recent pregnancy were missing for 140 (2.5%) and 167 (3.0%) admissions,
respectively. The distributions of these fields are shown in Figure 26 and Figure 27.
For admissions following one or more live and/or stillbirths, the mode of delivery of the recent pregnancy is
shown in Figure 28 and the trend over time in the percentage of admissions following Caesarean is shown
in Figure 29.
Number of live births (babies) from recent pregnancy and number of stillbirths from recent pregnancy were
missing for 34 (0.7%) and 60 (1.2%) admissions, respectively (excluding admissions following termination
or ectopic pregnancy). The distributions of these fields for admissions following one or more live and/or
stillbirths are shown in Figure 30 and Figure 31. Considering both live and stillbirths combined, 396
admissions (8.3%) were following multiple pregnancies; the trend in this percentage over time is shown in
Figure 32.
Among admissions following at least one live birth, number of babies in NICU following recent pregnancy
was missing for 34 admissions (0.7%); the distribution of this field is shown overall in Figure 33 and split by
term versus preterm deliveries in Figure 34.
Hysterectomy at/since delivery of recent pregnancy was missing for 20 admissions (0.4%) (excluding
admissions following termination or ectopic pregnancy). Of the remaining admissions, 761 (15.5%) were
reported to have had a hysterectomy.

Obstetric admissions to critical care 2009-2012 59 of 80
1 January 2009 to 31 December 2012
Report published: December 2013
Figure 20. Outcome of recent pregnancy for female admissions aged 16-50 reported as ‘recently
pregnant’ on admission to the critical care unit
0
20
40
60
80
Per
cen
tag
e o
f a
dm
issi
on
s
Live birth(s) Stillbirth(s) Both live andstillbirths
Termination Ectopic Miscarriage
Outcome of recent pregnancy

Obstetric admissions to critical care 2009-2012 60 of 80
1 January 2009 to 31 December 2012
Report published: December 2013
Figure 21. Trend in percentage of admissions following live and/or stillbirths for female admissions
aged 16-50 reported as ‘recently pregnant’ on admission to the critical care unit
1184 1355 1501 14720
20
40
60
80
100
Liv
e a
nd/o
r st
illb
irth
s, p
erc
en
t* (
95
% C
I)
2009 2010 2011 2012Year of critical care unit admission
*Percentage of recently pregnant admissions

Obstetric admissions to critical care 2009-2012 61 of 80
1 January 2009 to 31 December 2012
Report published: December 2013
Figure 22. Gestation (weeks) for female admissions aged 16-50 reported as ‘recently pregnant’ on
admission to the critical care unit (by outcome of recent pregnancy)
0
5
10
15
20
25
Pe
rce
nta
ge
of
ad
mis
sio
ns
0 5 10 15 20 25 30 35 40 45Gestation (weeks)
Live and/or stillbirths Termination/ectopic/miscarriage

Obstetric admissions to critical care 2009-2012 62 of 80
1 January 2009 to 31 December 2012
Report published: December 2013
Figure 23. Gestation (trimesters) for female admissions aged 16-50 reported as ‘recently pregnant’
on admission to the critical care unit (by outcome of recent pregnancy)
0
20
40
60
80
100
Pe
rce
nta
ge
of
ad
mis
sio
ns
<13 13-27 28+Gestation (weeks)
Live and/or stillbirths Termination/ectopic/miscarriage

Obstetric admissions to critical care 2009-2012 63 of 80
1 January 2009 to 31 December 2012
Report published: December 2013
Figure 24. Trend in percentage of preterm deliveries (gestation less than 37 weeks) for female
admissions aged 16-50 reported as ‘recently pregnant’ on admission to the critical care unit (live
and/or stillbirths only)
1018 1165 1314 12510
10
20
30
40
Pre
term
de
live
ries,
pe
rce
nt*
(9
5%
CI)
2009 2010 2011 2012Year of critical care unit admission
*Percentage of recently pregnant admissions following one or more live or stillbirths

Obstetric admissions to critical care 2009-2012 64 of 80
1 January 2009 to 31 December 2012
Report published: December 2013
Figure 25. Days from delivery to critical care admission for female admissions aged 16-50 reported
as ‘recently pregnant’ on admission to the critical care unit (by outcome of recent pregnancy)
0
20
40
60
Pe
rce
nta
ge
of
ad
mis
sio
ns
0 1 - 7 8 - 14 15 - 28 29 - 42Days from delivery to critical care unit admission
Live and/or stillbirths Termination/ectopic/miscarriage

Obstetric admissions to critical care 2009-2012 65 of 80
1 January 2009 to 31 December 2012
Report published: December 2013
Figure 26. Number of live births and/or stillbirths from previous pregnancies for female admissions
aged 16-50 reported as ‘recently pregnant’ on admission to the critical care unit
0
10
20
30
40
50
Pe
rce
nta
ge o
f a
dm
issi
on
s
0 1 2 3 4 5 or moreNumber of live births and/or stillbirths from previous pregnancies

Obstetric admissions to critical care 2009-2012 66 of 80
1 January 2009 to 31 December 2012
Report published: December 2013
Figure 27. Number of previous Caesarean sections (excluding most recent pregnancy) for female
admissions aged 16-50 reported as ‘recently pregnant’ on admission to the critical care unit
0
20
40
60
80
100
Pe
rce
nta
ge o
f a
dm
issi
on
s
0 1 2 3 or moreNumber of previous Caesarean sections (excluding most recent pregnancy)

Obstetric admissions to critical care 2009-2012 67 of 80
1 January 2009 to 31 December 2012
Report published: December 2013
Figure 28. Mode of delivery for female admissions aged 16-50 reported as ‘recently pregnant’ on
admission to the critical care unit (live and/or stillbirths only)
0
10
20
30
40
50
60
70
Pe
rce
nta
ge
of
de
live
rie
s*
Spontaneous Assisted CaesareanMode of delivery of recent pregnancy
*Recently pregnant admissions following one or more live or stillbirths

Obstetric admissions to critical care 2009-2012 68 of 80
1 January 2009 to 31 December 2012
Report published: December 2013
Figure 29. Trend in percentage of admissions following Caesarean for female admissions aged 16-
50 reported as ‘recently pregnant’ on admission to the critical care unit (live and/or stillbirths only)
1029 1177 1319 12600
20
40
60
80
100
Ad
mis
sio
ns
follo
win
g C
ae
sare
an
, p
erc
ent*
(9
5%
CI)
2009 2010 2011 2012Year of critical care unit admission
*Percentage of recently pregnant admissions following one or more live or stillbirths

Obstetric admissions to critical care 2009-2012 69 of 80
1 January 2009 to 31 December 2012
Report published: December 2013
Figure 30. Number of live births from recent pregnancy for female admissions aged 16-50 reported
as ‘recently pregnant’ on admission to the critical care unit (live and/or stillbirths only)
0
20
40
60
80
100
Pe
rce
nta
ge
of
de
live
rie
s*
0 1 2 3 or moreNumber of live births from recent pregnancy
*Recently pregnant admissions following one or more live or stillbirths

Obstetric admissions to critical care 2009-2012 70 of 80
1 January 2009 to 31 December 2012
Report published: December 2013
Figure 31. Number of stillbirths from recent pregnancy for female admissions aged 16-50 reported
as ‘recently pregnant’ on admission to the critical care unit (live and/or stillbirths only)
0
20
40
60
80
100
Pe
rce
nta
ge
of
de
live
rie
s*
0 1 2 or moreNumber of stillbirths from recent pregnancy
*Recently pregnant admissions following one or more live or stillbirths

Obstetric admissions to critical care 2009-2012 71 of 80
1 January 2009 to 31 December 2012
Report published: December 2013
Figure 32. Trend in multiple births for female admissions aged 16-50 reported as ‘recently pregnant’
on admission to the critical care unit (live and/or stillbirths only), 2009-2012
1019 1167 1312 12570
2
4
6
8
10
Mu
ltip
le b
irth
s, p
erc
en
t* (
95
% C
I)
2009 2010 2011 2012Year of critical care unit admission
*Percentage of recently pregnant admissions following one or more live or stillbirths

Obstetric admissions to critical care 2009-2012 72 of 80
1 January 2009 to 31 December 2012
Report published: December 2013
Figure 33. Number of babies in NICU following recent pregnancy for female admissions aged 16-50
reported as ‘recently pregnant’ on admission to the critical care unit (live births only)
0
10
20
30
40
50
60
70
Per
cen
tage
of
de
live
rie
s*
0 1 2 or moreNumber of babies in NICU following recent pregnancy
*Recently pregnant admissions following one or more live births

Obstetric admissions to critical care 2009-2012 73 of 80
1 January 2009 to 31 December 2012
Report published: December 2013
Figure 34. Number of babies in NICU following recent pregnancy, split by term (gestation 37 weeks
or more) and preterm (gestation less than 37 weeks), for female admissions aged 16-50 reported as
‘recently pregnant’ on admission to the critical care unit (live births only)
0
20
40
60
80
Pe
rce
nta
ge
of
de
live
ries
*
0 1 2 or moreNumber of babies in NICU following recent pregnancy
Term (37 weeks or more) Preterm (less than 37 weeks)
*Recently pregnant admissions following one or more live births

Obstetric admissions to critical care 2009-2012 74 of 80
1 January 2009 to 31 December 2012
Report published: December 2013
Appendix 1. Flow diagrams and definitions for obstetric-related fields in Version 3.0 and later of the Case Mix Programme dataset

Obstetric admissions to critical care 2009-2012 75 of 80
1 January 2009 to 31 December 2012
Report published: December 2013
Case Mix Programme definitions
• Actual date of delivery of recent pregnancy - specifies the actual date of delivery of recent
pregnancy. Recently pregnant is defined as any woman who has had a miscarriage, a termination of
pregnancy, a stillbirth or a live birth (baby) within 42 days of the date of admission to the unit.
• Admission currently/recently pregnant - specifies whether the admission is currently or recently or
not pregnant at admission to your unit. The options are:
o Currently pregnant is defined as any woman who is pregnant (including following fertility
treatment or in whom a positive pregnancy test indicates woman was pregnant) at time of
admission to the unit even if test done after admission.
o Recently pregnant is defined as any woman who has had a miscarriage, a termination of
pregnancy, a stillbirth or a live birth (baby) within 42 days of the date of admission to the unit.
o Not known to be pregnant is defined as any woman who is not pregnant or not known to be
pregnant and includes any woman who has had a miscarriage, a termination of pregnancy, a
stillbirth or a live birth (baby) greater than 42 days before the date of admission to the unit (i.e.
not Recently pregnant)
• Assisted conception used for recent pregnancy - specifies whether recent pregnancy was assisted
defined as treatment to assist the admission in becoming pregnant - treatment includes any form of
drug/chemical or physical intervention that has assisted fertilisation or embryo implantation.
• Expected date of delivery of current pregnancy - the expected date of delivery of current pregnancy.
If estimated date of delivery from antenatal clinic is available, based on last normal menstrual period or
sonography, this estimate is used. If estimated date of delivery is not available from antenatal clinic,
calculated from last normal menstrual period.
• Gestation at delivery of recent pregnancy - specifies the duration of gestation of recent pregnancy in
completed weeks. Gestation is defined as the number of weeks of pregnancy and is calculated from the
last normal menstrual period.
• Gestation of current pregnancy - specifies the duration of gestation of current pregnancy in
completed weeks.
• Hysterectomy at/since delivery of recent pregnancy - hysterectomy is defined as the surgical
removal of the uterus at/since delivery of recent pregnancy includes all hysterectomies (with or without

Obstetric admissions to critical care 2009-2012 76 of 80
1 January 2009 to 31 December 2012
Report published: December 2013
removal of the ovaries); a hysterectomy may be total (uterus and cervix removed) or subtotal (uterus
removed but cervix conserved). Excludes other operations (e.g. operations for bleeding) where the
uterus is retained.
• Molar pregnancy associated with recent pregnancy - molar pregnancy is defined as trophoblastic
disease – any proliferative disorder of the trophoblast and includes hydatidiform mole and
Choriocarcinoma.
• Number of babies in NICU following recent pregnancy - specifies the number of babies admitted to
NICU (neonatal intensive care unit) within 24 hours following delivery of recent pregnancy. A NICU is a
neonatal intensive care unit in any hospital. Any formal admission to NICU is sufficient to be counted,
however short the stay.
• Number of live births (babies)/ Number of stillbirths - specifies the total number of births delivered
(both live births (babies) and stillbirths) from recent pregnancy. A live birth (baby) is defined as delivery
of a baby which, after complete separation from its mother, shows any signs of life (there is no
recognised gestation or weight qualifier in UK law on birth registration such that any
birth at any gestation or birth weight which fulfils this criteria should be registered as a live birth (baby)).
A stillbirth is defined as delivery of a baby at or after 24 weeks’ gestation which, after complete
separation from its mother, shows no signs of life. Neither miscarriage (defined as delivery of a baby up
to 24 weeks which, after complete separation from its mother, shows no signs of life) nor termination of
pregnancy including multiple pregnancy reduction at any gestation, are counted as a stillbirth.
• Outcome of recent pregnancy - the most invasive method for multiple live births (babies) and/or when
multiple outcomes exist (most to least invasive - termination of pregnancy, ectopic pregnancy,
Caesarean section, assisted vaginal and spontaneous vaginal) for the recent pregnancy. The options
are:
o Termination of pregnancy is defined as a pregnancy ended spontaneously (miscarriage –
defined as delivery of a baby up to 24 weeks which, after complete separation from its mother,
shows no signs of life) or by medical treatment – medical treatments include drugs (a medical
termination) or surgery (a surgical termination).
o Ectopic pregnancy is defined as laparoscopic or open surgery where the fallopian tube
containing the ectopic pregnancy was injected, surgically opened (salpingotomy) or surgically
removed (salpingectomy).

Obstetric admissions to critical care 2009-2012 77 of 80
1 January 2009 to 31 December 2012
Report published: December 2013
o Caesarean section is defined as a live birth (baby) and/or a stillbirth being delivered by means of
an operation through the abdomen on the mother’s uterus (hysterotomy).
o Assisted vaginal is defined as a live birth (baby) and/or a stillbirth being delivered vaginally with
the need of instruments – includes medical assistance using either a vacuum cup (ventouse) or
using forceps.
o Spontaneous vaginal is defined as a live birth (baby) and/or a stillbirth being delivered vaginally
without the need of instruments except those required for episiotomy.
• Number of live births (babies) and/or stillbirths from previous pregnancies/ Number of previous
Caesarean sections excluding most recent pregnancy - specifies whether admission has had a
previous live birth (baby) and/or stillbirth before outcome of recent pregnancy.

Obstetric admissions to critical care 2009-2012 78 of 80
1 January 2009 to 31 December 2012
Report published: December 2013
Appendix 2. Case Mix Programme and CCMDS definitions
Case Mix Programme definitions
• Age – age in whole years on the date of admission to the critical care unit.
• Ethnicity – ethnicity was categorised as White, Mixed, Asian or Asian British, Black or Black British,
Other ethnic group or Not stated based on the NHS ethnic codes.
• Surgical status – surgical admissions are defined as those admissions to the adult, general critical
care unit directly from theatre and recovery. Surgical admissions were divided into emergency/urgent
or elective/scheduled cases based on the NCEPOD (National Confidential Enquiry into Perioperative
Deaths) classification. All other admissions were non-surgical.
• Last non-transient location prior to admission to critical care – the last non-transient location from
which this admission was admitted to the critical care unit either directly, or indirectly via one or more
transient locations (e.g. emergency department or theatre). The options are:
o Ward – ward in the hospital;
o Obstetric area – delivery suite, labour ward or obstetric ward in the hospital;
o Other intermediate care area – CCU or other area in the hospital where the level of care is
greater than the normal ward but is not an ICU or combined ICU/HDU or HDU;
o Paediatric/neonatal ICU/HDU – paediatric or neonatal ICU or combined ICU/HDU or HDU in the
hospital;
o Level 3 bed in adult ICU or ICU/HDU – level 3 bed in either an adult ICU or a combined
ICU/HDU in the hospital;
o Level 2 bed in adult ICU or ICU/HDU – level 2 bed in either an adult ICU or a combined
ICU/HDU in the hospital;
o Adult HDU – adult HDU or equivalent step-up/step-down unit in the hospital;
o Not in hospital – a location not in hospital.
• ICNARC Physiology Score – acute severity of illness score developed using the Case Mix Programme
Database (Harrison et al. 1091-98).
• APACHE II Score – widely used severity of illness score encompassing acute severity, age and chronic
health (Knaus et al. 818-29).
• Critical care unit mortality – status of the admission at discharge from the critical care unit.

Obstetric admissions to critical care 2009-2012 79 of 80
1 January 2009 to 31 December 2012
Report published: December 2013
• Acute hospital mortality – status of the admission at ultimate discharge from acute hospital.
• Location of death – the location of death in acute hospital based on data from the admission record
and from record linkage to identify deaths during subsequent admissions to the same critical care unit
or other critical care units participating in the Case Mix Programme.
• Critical care unit length of stay – the duration from the date and time of admission to the critical care
unit to the date and time of discharge for those admissions discharged alive from the unit, the date and
time of death for those admissions that died on the unit or the date and time of brainstem death for
those admissions declared brainstem dead.
• Level of care – the mean number of days spent at each Level of care (see definitions below).
• Destination following discharge from critical care – the location to which the admission was
discharged directly from the critical care unit. The options are as for Last non-transient location prior to
admission to critical care with the addition of Recovery (used as a temporary critical care area).
• Readmissions within the same acute hospital stay – critical care unit survivors that were
subsequently readmitted to the critical care at least once during their stay in acute hospital (reported as
a percentage of all critical care unit survivors discharged to a location in the same hospital).
• Total acute hospital length of stay – the duration from the date of admission to acute hospital (which
may be prior to admission to critical care) to the date of discharge from acute hospital for those
admissions that were discharged alive from acute hospital or the date of death within acute hospital for
those admissions that died before discharge from acute hospital.
Level of care definitions from the Critical Care Minimum Data Set (CCMDS)
• Level 3 – indicated by one or more of the following:
o admissions receiving advanced respiratory monitoring and support due to an acute illness;
o admissions receiving advanced cardiovascular monitoring and support due to an acute illness;
o admissions receiving monitoring and support for two or more organ system dysfunctions
(excluding gastrointestinal support) due to an acute illness;
• admissions solely receiving basic respiratory monitoring and support and basic
cardiovascular monitoring and support due to an acute illness only meet Level 2.
• Level 2 – indicated by one or more of the following:
o admissions receiving monitoring and support for one organ system dysfunction (excluding
gastrointestinal support) due to an acute illness;

Obstetric admissions to critical care 2009-2012 80 of 80
1 January 2009 to 31 December 2012
Report published: December 2013
• admissions solely receiving advanced respiratory monitoring and support due to an
acute illness meet Level 3;
• admissions solely receiving advanced cardiovascular monitoring and support due to an
acute illness meet Level 3;
• admissions solely receiving basic respiratory and basic cardiovascular monitoring and
support due to an acute illness meet Level 2.
o admissions receiving pre-surgical optimisation including invasive monitoring and treatment to
improve organ system function;
o admissions receiving extended post-surgical care either because of the procedure and/or the
condition of the admission;
o admissions stepping down to Level 2 from Level 3 care.
• Level 1 – indicated by one or more of the following:
o admission recently discharged from a higher level of care;
o admissions receiving a greater degree of observation, monitoring, intervention(s), clinical input
or advice than Level 0 care;
o admissions receiving critical care outreach service support fulfilling the medium-score group, or
higher, as defined by NICE Guidelines 50.
• Level 0 – indicated by:
o admissions in hospital and receiving normal ward care.