feminization of entrepreneurship in developing countries ... · caribbean, there is gender inequity...
TRANSCRIPT
Munich Personal RePEc Archive
Feminization of entrepreneurship in
developing countries? Evidence from
GEM data
Jorge, Velilla
University of Zaragoza
3 July 2017
Online at https://mpra.ub.uni-muenchen.de/79997/
MPRA Paper No. 79997, posted 03 Jul 2017 14:51 UTC

Feminization of entrepreneurship in developing countries?
Evidence from GEM data*
Jorge Velilla
University of Zaragoza (Spain)
Abstract
Certain analyses have studied gender differences in entrepreneurial activity, but, in general, the lack
of specific controls may have led to biased results. In this paper, we analyze whether male or female
individuals have a higher probability of becoming entrepreneurs in developing regions (Eastern
Europe, Latin America and the Caribbean, South-East Asia, and Africa). Using GEM data from 2009
to 2014, we avoid the potential confounding problems arising from the definition of entrepreneurship.
We find that the descriptive statistics show constant gender gaps in entrepreneurial activity in favor
of males, for all the regions. However, when individual and environmental entrepreneurial
characteristics are taken into account, these gaps diminish significantly in Eastern Europe, disappear
in Asia and Africa, and are reversed in Latin America.
Keywords: Gender; Feminist; Entrepreneurship; Developing countries; GEM Data
* Corresponding author. J. Velilla. Address: C. Gran Vía 2, 50005 Zaragoza, Spain.
Email: [email protected]
1. Introduction
Gender differences have been analyzed in a range of economic settings, including
entrepreneurial activity, and in general it is found that women are less willing to be
entrepreneurs and have lower rates of success in doing so (Boden and Nucci, 2000; Du Rietz
and Henreckson, 2000; Fairlie and Robb, 2009; Robinson and Stubberud, 2009), although it
is not known exactly whether these differences are tied to personal attributes or to universal
phenomena (Minniti and Nardone, 2007). However, as proposed in Artz (2016), most of these
analyses suffer from a lack of key controls, biasing conclusions. Examples of such controls
are individual heterogeneity (Cliff, 1998), scale (Robb and Watson, 2012), and business size
(Artz, 2016). Further, many of these studies are carried out in the context of developed
economies.
In developing countries, there has been an increasing interest in the promotion of
entrepreneurship in recent years (Naudé, 2010; Minniti and Naudé, 2010). Despite that,
entrepreneurship in the developing countries remains an under-researched phenomenon
(Naudé, 2008). In these countries, women still have lower rates of labor force participation
(Mondragón-Vélez and Peña, 2010; Giménez-Nadal, Molina and Ortega, 2012), although
female labor force participation tends to grow in the developing areas (Campaña, Giménez-
Nadal and Molina, 2017a). Among the reasons for the focus on entrepreneurship in
developing economies are: the promotion of growth through entrepreneurship, the effects on
household welfare, and the reduction of poverty (Acs, 1992; Audretsch, Keilbach and
Lehmann, 2006; Audretsch, 2007; Naudé et al., 2008; Campaña, Giménez-Nadal and Molina,
2017b). In particular, Terjesen and Amorós (2010) find that, in Latin America and the
Caribbean, there is gender inequity with respect to entrepreneurship, but women are gaining
in importance. (See Naudé (2010) for a review of entrepreneurial activity in the developing
countries and its links to development.)
The study of women’s entrepreneurship has attracted the attention of researchers in
recent years. Minniti and Naudé (2010) show how the study of female entrepreneurship has
evolved from the 1970s to the present. According to Cabrera and Mauricio (2017),
entrepreneurial activities of women have increased over the past decade to about two-thirds
the level of men’s (Blanchflower, 2004; Carter and Shaw, 2006; O’Shea, Chugh and Allen,
2008; Kelley et al., 2016). Entrepreneurial activities of women perform poorly compared to
those of men for a range of reasons (Kanzawa, 2005; Allen, Langowitz and Minniti, 2007;
Coleman, 2007; Minniti and Naudé, 2010; Elam and Terjesen, 2010; Klapper and Parker,
2011; Kelley et al., 2016; Artz, 2016). Minniti (2010) studies and reviews the causes of
gender differences in entrepreneurial activity. Minniti (2009), Jennings and Brush (2013),
and Cabrera and Mauricio (2017) provide reviews of the literature on women’s
entrepreneurship, and De Vita, Mari, and Poggesi (2013) present a review of women’s
entrepreneurship in the particular case of the developing economies.
In the study of entrepreneurship, the Global Entrepreneurship Monitor (GEM) is “the
world’s foremost study of entrepreneurship” (http://www.gemconsortium.org). GEM
researchers and experts provide high quality data and reports to the scientific community, in
order to analyze, promote, and understand global entrepreneurial activity (Global
Entrepreneurship Monitor, 2017). Cacciotti and Hayton (2015) and Stephan, Hart and Drews
(2015) offer recent reviews of the existing literature on GEM, using GEM data. (See Kelley
et al. (2016) for the most recent report about women’s entrepreneurship from the point of
view of GEM, where it is shown how gender gaps in entrepreneurial activity have narrowed,
especially in some countries of Latin America and the Caribbean, Asia, and Africa; also see
Allen et al., 2008; Kelley et al., 2011; Kelley et al., 2013, for previous GEM reports on
women’s entrepreneurship).
Against this background, the present paper aims to empirically analyze the individual
participation in entrepreneurial activity, in four developing regions (Eastern Europe, South-
East Asia, Latin America, and Africa), emphasizing the role of gender and controlling for
certain attributes related to the individual appreciation of the entrepreneurial environment
and social norms, and for the features and characteristics of entrepreneurial spirit. To the best
of our knowledge, the combination of these macro- and micro-economic variables is not a
common approach in entrepreneurship empirical models, but may meaningfully reduce the
unobservable factors and provide more accurate results, hence avoiding confounding
problems. A linear probability model on the dummy identifying entrepreneurs is developed
using the GEM Adult Population Survey (APS) data for the years 2009 to 2014, and we find
that, in Europe, men are or become entrepreneurs at a rate that is slightly, but significantly
higher than women, while the opposite happens in Latin American countries. In Asia and

Africa, no gender gaps are found at the regional level, although different patterns emerge at
country level. This document is an updated version of Molina, Ortega and Velilla (2017),
where the data used, the sample size, the number of countries analyzed and the conceptual
framework have been revisited.
The contributions of the paper are twofold: First, we use six waves of the GEM APS
data to show how, according to descriptive results, men are or become entrepreneurs more
frequently than women in the four regions analyzed, with the entrepreneurial rates in Latin
America and Africa being significantly higher than in Eastern Europe and Asia. The use of
several waves of the GEM APS data is, to the best of the authors’ knowledge, new in the
literature on entrepreneurship. Second, we define from the GEM data specific entrepreneurial
controls at individual and country-environment levels, and find that the previous gaps
significantly decrease in Eastern Europe, disappear in Asia and Africa, and reverse in Latin
America, where women are found to be more prone to be or become entrepreneurs than are
men. We repeat the analysis at country level to confirm these results.
The rest of the paper is laid out as follows: the data and summary statistics are shown in
Section 2; the conceptual framework is described in Section 3, and Section 4 sets the
econometric strategy and presents our empirical results. Finally, Section 5 contains our main
conclusions.
2. Data and summary statistics
The data is taken from the GEM 2009 to 2014 Adult Population Survey (APS) databases,
which contain harmonized, cross-sectional micro-data on entrepreneurial-related factors of
individuals worldwide. The major advantage of this data is the definition of entrepreneur,
arising from the contribution to the TEA (Total Early-Stage Entrepreneurial Activity) Index,
which assesses the percentage of the population that is either about to begin, or has already
established an entrepreneurial activity, for a maximum of 42 months). (More information
about GEM data can be found at http://www.gemconsortium.org/data/sets.)
Our sample is limited to those individuals who are not retired or (not temporarily)
disabled, between 18 and 64 years old, and living in developing areas of Eastern Europe

(Hungary, Romania, Poland, Lithuania, Latvia, Croatia, Slovenia, Bosnia & Herzegovina,
Macedonia, and Slovakia), Latin America and the Caribbean (Peru, Mexico, Argentina,
Brazil, Colombia, Guatemala, Panama, Ecuador and Uruguay), South-East Asia (Malaysia,
Thailand, South Korea, China, India, and Taiwan), and Africa (South Africa, Algeria,
Tunisia, Nigeria, Angola, Uganda, Zambia and Botswana). These restrictions leave us with
a selection of 363,950 individuals; 176,997 males and 186,953 females. The selection of the
countries of the sample arises from the availability of data, given that the countries for which
the GEM APS data is available vary across years. A detailed summarization of the countries
that make up the sample, by year, is shown in Table 1.
(Table 1 about here)
The variable of interest of our analysis is the entrepreneurial participation of individuals,
measured through the dummy variable “entrepreneur”, that identifies entrepreneurs (value
1), against non-entrepreneurs (value 0). This variable is defined from the GEM data from the
individual contribution to the TEA index, i.e., it identifies those individuals who are about to
begin, or have begun in the last 42 months, an entrepreneurial activity.
In general, there is no consensus about how entrepreneurs should be defined, e.g., self-
employed (Blanchflower and Oswald, 1998; Molina, Ortega and Velilla, 2016; Campaña,
Giménez-Nadal and Molina, 2017a; 2017b), business owners (Cagetti and De Nardi, 2006);
businessmen without employees (Artz, 2016); or all together (Akyol and Athreya, 2009). As
explained in Mondragón-Vélez and Peña (2010), the identification of entrepreneurs may not
be important in countries such as the US, but is especially important in other cases, such as
Colombia. Within this framework, GEM’s definition and data have achieved great
importance in the scientific field and have become a source of agreement. Consequently, we
directly adopt this definition of entrepreneur given by GEM, which prevents us from
selection biases.
The key independent variable to analyze in this study, in relation to entrepreneurial
activity, is the gender of individuals, which is also defined as a dummy variable that identifies
males (value 1) and females (value 0). From the 363,950 individuals of the whole sample,
176,997 are males and 186,953 are females. Further, 15.55% of the total population are
entrepreneurs, i.e., there are 56,599 entrepreneurs in the sample, of whom 31,654 are males

and 24,945 females, with this difference being statistically significant at the 99% level. Given
the major proportion of females in the whole sample, it seems a priori that men are more
prone to entrepreneur than women, given the higher number of male entrepreneurs. This
result is in line with prior research, where it is generally found that men are or become
entrepreneurs more frequently than women (Blanchflower, 2000; Boden and Nucci, 2000;
Du Rietz and Henreckson, 2000; Fairlie and Robb, 2009; Robinson and Stubberud, 2009;
Mussurov and Arabsheibani, 2015; Artz, 2016; Molina, Velilla and Ortega, 2016, 2017)
Table 2 shows, by region, that 12.5% of Eastern European male individuals are
entrepreneurs, against 6.1% of the females. In the case of Asian countries, 13.2% and 10.0%
of the males and females are entrepreneurs, respectively. In Latin America and Africa, these
proportions are markedly higher, with 21.1% of males and 16.6% of females being
entrepreneurs in Latin America, and 23.2% and 19.4% in Africa, respectively. All of the
differences across gender are significant at the 99% level. These summary statistics show
that, overall, individuals tend to be or become entrepreneurs most often in Africa, followed
by Latin America, Asia and, finally, Eastern Europe. Figure 1 shows the evolution of male
and female entrepreneurial levels from 2009 to 2014, by region. It can be seen how the greater
relative differences across gender are found in Eastern Europe, where there is more than
double the number of male than female entrepreneurs. Furthermore, it appears that the
differences have remained constant in the analyzed period, with only a small sign of
convergence in the case of Africa. Finally, the entrepreneurial levels have followed a positive
trend in Eastern Europe and in Latin America, in contrast with a negative slope in Asia and
a constant linear fit in Africa.
Despite this empirical evidence, we cannot yet conclude that men are more prone to be
or become entrepreneurs than women, given the degree of unobserved heterogeneity and the
lack of specific controls that may be interacting in the complex entrepreneurial phenomena
(Coduras et al., 2016; Orazem, Jolly and Yu, 2015; Artz, 2016). Several variables have been
found to determine entrepreneurship, both at individual or at country-institutional level (the
Institutional Theory, North, 1990). In this present study, since we are specifically analyzing
the entrepreneurial activity from a micro-economic perspective, the point of view of
individuals, which has been shown to predominate over the macro-economic context (see
Giménez-Nadal et al., 2016), we primarily consider individual characteristics, but also the

effect of Media and social norms. In particular, we consider the following independent
variables from the GEM APS databases: formal education (defined through three dummies:
basic education, secondary education, and University education), consideration of
entrepreneurial opportunities, consideration of own entrepreneurial skills, peer effects
(whether individuals have met other entrepreneurs), and consideration of the appearance of
entrepreneurship in the Media. These variables have been defined as dummies. We also
include the dummies for fear of failure, may consider being n entrepreneur in the future, have
helped other entrepreneurs, and have invested in other business; along with, averaged at the
national level, desire for equity, social status of entrepreneurs, and social status of business
success (taking values between 0 and 1). The descriptive statistics of these variables, by
gender and group of countries, are shown in Table 2.
(Table 2 about here)
3. Conceptual framework
We propose a conceptual framework based on the existing literature to determine the
direction of the relationship between the features described in the previous section, and the
dependent variable, i.e. participation in entrepreneurial activity. In particular, Figure 2 shows
the scheme of the proposed model, which can be summarized as follows:
Hypothesis 1: age. Young individuals are more prone to be or become entrepreneurs than
females (Davidsson, 1989; Schott and Bagger, 2004; Kelley, 2009; Wennekers et al., 2010;
Giménez-Nadal et al., 2016).
Hypothesis 2: education. Highly educated individuals with specific entrepreneurial skills, or
who perceive entrepreneurial opportunities in their background, are more prone to be or
become entrepreneurs (Cooper, Gimeno-Gascon and Woo, 1994; Kostova, 1997; Bosma et
al., 2004; Clarysse and Moray, 2004; Minniti and Nardone, 2007; Minniti, 2009; Jenssen and
Aasheim, 2010; Levie and Autio, 2013; Reynolds et al., 2013; Brixiová, Ncube and Bicaba,
2015; Fritsch et al., 2015; Kyrö, 2015). Skills and opportunities are related to formal
education, since individuals who want to acquire skills, or who perceive opportunities, may
pursue specific courses or University degrees. On the other hand, it may also be that

individuals who have attended specific courses have acquired the required skills to be an
entrepreneur, or that the courses give them the ability to identify an entrepreneurial
opportunity (Gnyawali and Fogel, 1994; Glaeser et al., 2004; Castro and Santero, 2014; Cho,
2014; Velilla and Ortega, 2017).
Hypothesis 3: specific entrepreneurial individual attributes. Existing studies have found that
certain psychological and idiosyncratic individual characteristics, such as calling and
vocation (Orazem Jolly and Yu, 2015; Viinikainen et al., 2016), innovation (Schumpeter,
1934; Holmes and Schmitz, 1990; Baumol, 2002; Audretsch, 2004; Acs et al., 2005; Gilbert,
McDougall and Audretsch, 2006; Braunerhjerlm et al., 2010; Jenson, et al., 2016)
entrepreneurial attitudes (Beynon, Jones and Pickernell, 2016), and positivism (Dawson et
al., 2015; Molina, Velilla and Ortega, 2016; Viinikainen et al., 2016), may make individuals
more prone to be an entrepreneur. The GEM APS data contains information on certain
psychological and individual characteristics: fear of failure, consider being an entrepreneur
in the future, help others to become an entrepreneur, and invest in a business. Thus, we
develop a Principal Components Analysis of these four variables, by region, to extract the
most information possible and avoid confounding results. We find that a single principal
factor emerges, with an eigenvalue greater than 1 (see Table A1 in Appendix A), which is
negatively related to the fear of failure, and positively related to the rest of these features.
That is to say, individuals with little fear of failure, who may consider being an entrepreneur
in the future, who have helped others with their entrepreneurial activities, and who have
invested in another business, have a higher value of that principal factor, which we define as
“entrepreneurial spirit”.
Hypothesis 4: the entrepreneurial environment. Individuals in an appropriate environment,
in which entrepreneurship is well considered, will be more likely to be or become an
entrepreneur (Acs, 1992; Kostova, 1997; Minniti, 2005; Cooper and Yin, 2005; Terjesen and
Szerb, 2008; Santos, Curral and Caetano, 2010; Wennekers et al., 2005; Wennekers et al.,
2010; Barrado and Molina, 2015; Coduras et al., 2016; Roskruge, Poot and King, 2016;
Giménez-Nadal et al., 2016; Velilla and Ortega, 2017). The GEM data contains information
about the individual perceptions of the social consideration of entrepreneurs, the social
consideration of success in business, the desire for equity, and the importance given by the
Media to entrepreneurship. Given the high level of multicollinearity arising from the three

former features (with a mean Variance Inflation Factor value of 4.08), we develop a PCA to
find that a single variable should be defined (according to the eigenvalues), at country level.
This principal factor, which we call “social norms”, is positively related to the three initial
variables (see Table A2 in Appendix A). Finally, the GEM data also contains information on
peer effects, which can also be considered as environmental features, and have been found
to influence entrepreneurship (Holcomb et al., 2009; Klyver, Hunter and Watne, 2012;
Blumberg and Pfann, 2015; Giménez-Nadal et al., 2016; Okumura and Usui, 2016;
Viinikainen et al., 2016).
(Figure 2 about here)
4. Empirical analysis
A linear probability model is developed as follows: for an individual “i” residing in
country “j” in year “t”, let !"#$ be the dummy variable determining whether he/she is an
entrepreneur (value 1 for entrepreneurs, 0 in other case), %"# be the gender (1 for males, 0 for
females), and &#$" a vector of individual and social controls. We then OLS estimate the
following equation:
!"#$ = () + (+%"# + (,&"#$ + -# + -$ + ." 1
where -# and -$ are country and year fixed-effects, respectively, and ." are unmeasured
factors. Under this specification, the sign of the coefficient associated with gender, (+ , would
determine whether men are or become entrepreneurs more frequently than women ((+ > 0),
whether women are or become entrepreneurs more frequently than men ((+ < 0), or if there
are no significant differences in entrepreneurial participation between males and females ((+
not statistically different than 0).
4.1. Results by region
We estimate Equation 1 for each region in Table 3, first using a simple specification in
which only gender, age, and formal education are considered (Columns (1), (3), (5) and (7)),
and then a complete model in which all the features are included, to show the importance of
including specific variables to control by observed individual and social heterogeneity and
avoid confounding results (Columns (2), (4), (6) and (8)).
Columns (1) and (2) in Table 3 show estimates for Eastern Europe. We can see how the
parameter (+ decreases from 0.064 to 0.010 when the complete model is estimated, in
contrast to the simple model, showing a decrease of more than 80 percentage points in the
effect of gender over the probability of being an entrepreneur. However, the effect of being
male remains positive and significant, showing that, although gender gaps tend to decrease,
they do not disappear. The inclusion of controls in Column (2) also affects the other
regressors in Column (1), since education turns from having a significant and positive effect
to having a non-significant effect, in favor of the effect of entrepreneurial skills. Peer effects
are also significant and positively related to entrepreneurship, as are the factor of
entrepreneurial spirit. Age, opportunity, Media, and social norms appear not to have a
significant relationship with the probability of being an entrepreneur in the case of Eastern
Europe.
Columns (3) and (4) contain estimates for South-East Asia, showing that, in the presence
of the controls, the effect of gender meaningfully decreases from a significant 0.033 in
Column (3) to a non-significant 0.002 in Column (4), showing no evidence of significant
gender gaps in the entrepreneurial activity in Asia, in the presence of the controls. Regarding
the rest of the regressors, we find that University education shows a negative coefficient,
while skills are positive and significantly related to entrepreneurship. This may suggest that
highly-skilled individuals who do not consider that they have skills may prefer to look for
regular wages and salaries, rather than establish a business. Peer effects are significant and
positively correlated with entrepreneurship, as is entrepreneurial spirit. In contrast to the case
of Europe, Media in Asia presents a significantly positive (at the 90% level) conditional
correlation with entrepreneurial activity.
Estimates for the Latin American and Caribbean countries are shown in Columns (5) and
(6). In this case, the parameter (+ turns from a positive and significant 0.045 in the estimates
of Column (5) to a negative and significant -0.012 in Column (6), showing how gender gaps
not only disappear in the presence of the control regressors, but even reverse, and that women
are more prone to be or become entrepreneurs than men in Latin American and Caribbean

regions, when the rest of the variables are considered. It is also found that age is positively
related to entrepreneurship in Column (6), in contrast to Hypothesis 1; individuals who have
a secondary education level are less likely to be entrepreneurs, and skills, peer effects, and
the entrepreneurial spirit are significant and positively related to the entrepreneurial
participation of individuals.
Finally, Columns (1) and (2) in Table 3 show estimates for Africa. As in the case of Asia,
the parameter (+ is significant and equal to 0.040 in the absence of controls, but becomes a
non-significant 0.000 in Column (8). Thus, we find an absolute disappearance of gender gaps
in entrepreneurial activity in Africa, in the presence of controls. Regarding the rest of the
variables, as in the previous cases, skills, peer effects, and the entrepreneurial spirit are
significant and positively correlated with entrepreneurship. Finally, we find that individuals
who have gone to University are less prone to be entrepreneurs in Africa. This result may be
due to the specific labor conditions of the region, where highly-skilled individuals may prefer
high-qualified job positions, as is also the case in Asia.
In sum, we find that, in general, the inclusion of controls significantly conditions the
results, since the significant and positive gender gaps found turn out not to be significant gaps
in Asia and Africa, meaningfully decrease in Eastern Europe, and even turn in favor of
women in Latin America. Furthermore, we find no evidence in favor of Hypothesis 1, while
the positive effect of education is mainly concentrated through entrepreneurial skills
(Hypothesis 2). The individual features capturing the entrepreneurial spirit of individuals are
positive and significantly correlated with entrepreneurship, as expected (Hypothesis 3), and
peer effects are positively related to entrepreneurship, perhaps capturing the effect of Media
(partially supporting Hypothesis 4).
4.2. Results by country
We now repeat the estimates for each of the countries in the sample, in order to study
differences within regions. Estimated coefficients associated with gender, (+ , are shown in

Table 4.1 We can see that, among Eastern European countries, in seven of the ten cases
(Hungary, Lithuania, Latvia, Croatia, Slovenia, Macedonia, and Slovakia) the conditional
correlation between being male and being an entrepreneur is positive, indicating that men
tend to be entrepreneurs more often than women. On the other hand, in Romania the
estimated coefficient is negative (-0.009) and significant, while in Poland and Bosnia
estimated (+’s are positive but not significant.
In the case of Latin American countries, estimated (+ are negative in seven of the nine
cases, but only negative and significant in five countries (Mexico, Brazil, Guatemala,
Panama, and Ecuador). These negative parameters vary, from a maximum decrease in the
probability of an entrepreneur being male, relative to female, of 3 percentage points in Brazil,
to 1 percentage point in Mexico. In Peru and Uruguay, estimates are positive, but only
significant in the latter country, and in Argentina and Colombia, estimates are negative but
not significant.
In the case of Asian countries, we find mixed results, with Malaysia, China and South
Korea showing no significant difference from zero estimated (+’s, a slightly positive, and
significant, parameter in the case of Taiwan, and two meaningful and significant parameters
of 0.033 and -0.033 in South Korea and Thailand, respectively, which may compensate for
each other in the pool estimation. Nonetheless, in general the parameters for the case of Asia
are positive (except in Thailand).
Finally, in Africa we estimate three positive parameters in Algeria, Tunisia, and Nigeria,
with this being significant in the first two (0.024 and 0.027, respectively). The five remaining
cases show negative estimates of (+ , although only slightly significant in the case of Uganda.
To sum up, Table 4 shows that, in general, the small gender gaps in favor of men are
confirmed in the Eastern European economies, and the same happens with the gaps in favor
of women in Latin American and Caribbean countries. However, in Asia and Africa, where
no gender gaps were found in the pooled estimates at regional level, the cross-country
estimates show significant differences within regions, with countries where men are more
often entrepreneurs, others where women predominate, and others where no gaps are found.
1 Tables B1 to B4 in Appendix B show the additional estimates for Eastern Europe, Latin America, South-East
Asia, and Africa, respectively.

Nevertheless, the higher overall coefficients, which are found in the cases of Thailand and
South Korea, are of -0.033 and 0.033 respectively, indicating a relatively small variation of
3.3 percentage points in the probability of becoming an entrepreneur, ceteris paribus the rest
of the features considered (see Appendix B), depending on gender.
5. Conclusions
We use the GEM APS data from years 2009 to 2014 to determine gender differences in
entrepreneurial participation in Eastern Europe, Latin America, South-East Asia, and Africa.
Results show that, even when descriptive statistics and simple models demonstrate that men
are more prone to be or become entrepreneurs, when controlling for both individual and
environmental entrepreneurial variables, gaps decrease in Europe, reverse in Latin America,
and tend to disappear in Asia and Africa, with these latter cases showing different results
within regions. These findings are partially in line with those of the work of Kelley et al.
(2016) on the GEM Report on Women’s Entrepreneurship, in regard to the trends of female
entrepreneurial activity at the country level. In addition, some general rules are found with
regard to control features, with entrepreneurial activity exhibiting positive conditional
correlations with peer effects, managerial and entrepreneurial skills, and individual
entrepreneurial characteristics, measured through the entrepreneurial spirit.
The limitations of our study are due, mainly, to the nature of the data. Since the GEM
data is an international database, but countries where the GEM operates vary in time, we do
not have a sufficiently large and homogenized number of observations to propose cross-
country results for all the countries in the analyzed region. Then, we must acknowledge
certain selection biases. Further, cross-sectional analyses have the limitation of not allowing
us to perform causality analyses, and only conditional correlations can be estimated.
References
Acs, Z. (1992). Small business economics: A global perspective. Challenge 35(6): 38-44.
Acs, Z.J., Audretsch, D.B., Braunerhjelm, P. & Carlsson, B. (2005). Growth and
Entrepreneurship: An Empirical Assessment. Papers on entrepreneurship, growth and
public policy No. 3205

Akyol, A. & Athreya, K. (2009). Credit and self-employment. Federal Reserve Bank of
Richmond Working Paper no. 09-05.
Allen, E., Langowitz, N. and Minniti, M. (2007). The 2006 Global Entrepreneurship Monitor
Special Topic Report: Women in Entrepreneurship. Wellesley, MA: Babson College.
Allen, E., Elam, A., Langowitz, N. & Dean, N. (2008). 2007 Report on Women
Entrepreneurship. Wellesley, MA: Babson College.
Artz, B. (2016). Gender and entrepreneurial success: evidence from survey data. Applied
Economic Letters 24(3), 163-166.
Audretsch, D. B. (2004). Sustaining innovation and growth: Public policy support for
entrepreneurship. Industry and Innovation 11(3): 167-191.
Audretsch, D. (2007). Entrepreneurship capital and economic growth. Oxford Review of
Economic Policy 23(1): 63–78.
Audretsch, D.B., Keilbach, M.C. & Lehmann, E.E. (2006). Entrepreneurship and Economic
Growth. Oxford: Oxford University Press.
Barrado, B. & Molina, J.A. (2015). Macroeconomic factors that stimulate entrepreneurship.
An analysis for developed and developing countries. DTECONZ 2015-06.
Baumol, W.J. (2002) The Free-Market Innovation Machine: Analyzing the Growth Miracle
of Capitalism. Princeton University Press.
Beynon, M.J., Jones, P. & Pickernell, D. (2016). Country-Based Comparison Analysis Using
fsQCA Investigating Entrepreneurial Attitudes and Activity. Journal of Business
Research 69(4): 1271–1276
Blanchflower, D.G. (2000). Self-employment in OECD countries. Labour Economics 7(5):
471-505.
Blanchflower, D.G. (2004) Self-employment: More may not be better. Swedish Economic
Policy Review 11: 15–73.
Blanchflower, D.G. & Oswald, A. (1998). What makes an entrepreneur? Journal of Labor
Economics 16(1), 26–60.
Blumberg. B. & Pfann, G. (2015). Roads leading to self-employment: comparing
transgenerational entrepreneurs and self-made starts-ups. IZA DP 9155.
Boden, R.J. & Nucci, A.R. (2000). On the survival prospects of men’s and women’s new
business ventures. Journal of Business Venturing 15(4), 347-362.

Bosma, N., van Praag, M., Thurik, R. & de Wit, G. (2004). The value of human and social
capital investments for the business performance of start-ups. Small Business Economics
23(3): 227-236.
Braunerhjelm, P., Acs, Z.J., Audretsch, D.B. & Carlsson, B. (2010). The missing link:
knowledge diffusion and entrepreneurship in endogenous growth. Small Business
Economics 34(2): 105-125.
Brixiová, Z., Ncube, M. & Bicaba, Z. (2015) Skills and youth entrepreneurship in Africa:
Analysis with evidence from Swaziland. World Development 67: 11-26.
Cabrera, E.M. & Mauricio, D. (2017). Factors affecting the success of women’s
entrepreneurship: a review of literature. International Journal of Gender and
Entrepreneurship 9(1): 31-65.
Cacciotti, G. & Hayton, J.C. (2015). Fear and entrepreneurship: A review and research
agenda. International Journal of Management Reviews 17(2): 165-190.
Cagetti, M. & De Nardi, M. (2006). Entrepreneurship, frictions, and wealth. Journal of
Political Economy 114(5), 835–70.
Campaña, J.C., Giménez-Nadal, J.I. & Molina, J.A. (2017a). Self-employment and
educational childcare time: Evidence from Latin America. MPRA Paper 77360.
Campaña, J.C., Giménez-Nadal, J.I. & Molina, J.A. (2017b). Differences between self-
employed and employed mothers in balancing family and work responsibilities:
Evidence from Latin American countries. MPRA Paper 77964.
Carter, S. & Shaw, E. (2006). Women’s business ownership: Recent research and policy
developments. Report to the Small Business Service. DTI.
Castro, B. & Santero, R. (2014). Characterisation of self-employment in Spain. An analysis
from the gender perspective. Esik Market Economics and Business Journal 45(3): 461-
485.
Cho, Y. (2014). Entrepreneurship Programs in Developing Countries: A Meta Regression
Analysis. Labour Economics 28: 110–130.
Clarysse, B. & Moray, N. (2004) A process study of entrepreneurial team formation: the case
of a research-based spin-off. Journal of Business Venturing 19(1): 55-79.
Cliff, J.E. (1998). Does one size fit all? Exploring the relationship between attitudes towards
growth, gender and business size. Journal of Business Venturing 13(6), 523-542.
Coduras, A., Clemente, J.A. & Ruiz, J. (2016). A novel application of fuzzy-set qualitative

comparative analysis to GEM data. Journal of Business Research 69(4), 1265-1270.
Coleman, S. (2007). The role of human and financial capital in the profitability and growth
of women-owned small firms. Journal of Small Business Management 45(3): 303–319.
Cooper, A.C., Gimeno-Gascon, F. & Woo, C.Y. (1994) Initial human and financial capital
as predictors of new venture performance. Journal of Business Venturing 9(5): 371-395.
Cooper, A.C. & Yin, X. (2005). Entrepreneurial networks, in The Blackwell encyclopedia of
management –entrepreneurship, Hitt MA, Ireland RD (eds.). Malden, MA: Blackwell,
98-100.
Davidsson, P. (1989). Entrepreneurship –and after? A study of growth willingness in small
firms. Journal of Business Venturing 4(3): 211-226.
Dawson, C., de Meza, D., Henley, A. & Arabsheibani, G.R. (2015). The power of (non)
positive thinking: selfemployed pessimists earn more than optimists. IZA DP 9242.
De Vita, L., Mari, M. & Poggesi, S. (2014). Women entrepreneurs in and from developing
countries: Evidence from the literatura. European Management Journal 32(3): 451-460.
Du Rietz, A. & Henreckson, M. (2000). Testing the female underperformance hypothesis.
Small Business Economics 14(1), 1-10.
Elam, A. & Terjesen, S. (2010). Gendered Institutions and Cross-National Patterns of
Business Creation for Men and Women. European Journal of Development Research
22(3): 331-348.
Fairlie, R.W. & Robb, A.M. (2009). Gender differences in business performance: Evidence
from the characteristics of business owners survey. Small Business Economics 33(4),
375-395.
Gilbert, B.A., McDougall, P.P. & Audretsch, D.B. (2006). New venture growth: A review
and extension. Journal of Management 32(6): 926-950.
Giménez-Nadal, J.I., Molina, J.A. & Ortega, R. (2012). Self-employed mothers and the work-
family conflict. Applied Economics 44(17), 2133-2147.
Giménez-Nadal, J.I., Lafuente, M., Molina, J.A. & Velilla, J. (2016). Resampling and
bootstrap to assess the relevance of variables: A new algorithmic approach with
applications to entrepreneurship data. IZA DP 9938.
Glaeser, E.L., La Porta, R., López-De-Sillanes, F. & Shleifer, A. (2004). Do Institutions
Cause Growth? Journal of Economic Growth 9(3): 271–303.

Global Entrepreneurship Monitor (2017). GEM Global Report 2016-2017. Wellesley, MA:
Babson College.
Gnyawali, D.R., & Fogel, D.S. (1994). Environments for Entrepreneurship Development:
Key Dimensions and Research Implications. Entrepreneurship Theory and Practice, 18:
43–62.
Holcomb, T.R., Ireland, R.D., Holmes, R.M. & Hitt, M.A. (2009). Architecture of
entrepreneurial learning: exploring the link among heuristics, knowledge, and action.
Entrepreneurship Theory and Practice 33(1): 167-192.
Holmes, T.J. & Schmitz Jr., J.A. (1990). A theory of entrepreneurship and its application to
the study of business transfers. Journal of political Economy 98(2): 265-294.
Jennings, J.E. & Brush, C.G. (2013). Research on Women Entrepreneurs: Challenges to (and
from) the Broader Entrepreneurship Literature? The Academy of Management Annals
7(1): 661-713.
Jenson, I., Leith, P., Doyle, R., West, J. & Miles, M.P. (2016). Testing Innovation Systems
Theory Using Qualitative Comparative Analysis. Journal of Business Research 69(4):
1283–1287.
Jenssen, J.I. & Aasheim, K. (2010) Organizational innovation promoters and performance
effects in small, knowledge-intensive firms. International Journal of Entrepreneurship
and Innovation 11(1): 19-27.
Kanazawa, S. (2005) Is ‘discrimination’ necessary to explain the sex gap in earnings? Journal
of Economic Psychology 26(2): 269–287.
Kelley, D. (2009). Growth aspirations as a function of entrepreneurial motivations and
perceptions. Babson Faculty Research Working Papers 49.
Kelley, D., Brush, C., Greene, P., Litovsky, Y. (2011). 2010 Report: Women Entrepreneurs
Worldwide. Wellesley, MA: Babson College.
Kelley, D., Brush, C., Greene, P., Litovsky, Y. (2013). Global Entrepreneurship Monitor
2012 Women’s Report. Wellesley, MA: Babson College.
Kelley, D., Brush, C., Greene, P., Herrington, M., Ali, A. & Kew, P. (2016). GEM Special
Report: Women’s Entrepreneurship 2015. Wellesley, MA: Babson College.
Klyver, K., Hunter, E. & Watne, T. (2012). Entrepreneurial ties and innovativeness in the
start-up decisión. International Journal of Entrepreneurship and Innovation 13(3): 153-
163.

Kostova, T. (1997). Country institutional profiles concept and measurement. Academy of
Management and Proceedings 97: 180-184.
Kyrö, P. (2015). The conceptual contribution of education to research on entrepreneurship
education. Entrepreneurship and Regional Development 27(9-10): 1-20.
Levie, J. & Autio, E. (2013). Growth and growth intentions: A meta-analysis of existing
evidence. Enterprise Research Centre, ERC White Papers 1.
Minniti, M. (2005). Entrepreneurship and network externalities. Journal of Economic
Behavior and Organization 57(1): 1-27.
Minniti, M. (2009). Gender issues in entrepreneurship. Foundations and Trends in
Entrepreneurship 5(7-8): 497-621.
Minniti, M. (2010). Female entrepreneurship and economic activity. European Journal of
Development Research 22(3): 294-312.
Minniti, M. & Nardone, C. (2007). Being in someone else’s shoes: the role of gender in
nascent entrepreneurship. Small Business Economics 28(2-3), 223-238.
Minniti, M. & Naudé, W. (2010). What do we know about the patterns and determinants of
female entrepreneurship across countries? European Journal of Development Research
22(3): 277-293.
Molina J.A., Velilla, J. & Ortega, R. (2016). The decision to become an entrepreneur in
Spain: The role of the household finances. International Journal of Entrepreneurship
20(1): 57-73.
Molina J.A., Ortega, R. & Velilla, J. (2016). Feminization of entrepreneurship in developing
countries. MPRA Paper 76981.
Molina J.A., Ortega, R. & Velilla, J. (2017). Older entrepreneurs-by-necessity using fuzzy
set methods: differences between developed and developing countries. MPRA Paper
76982.
Mondragón-Vélez, C. & Peña, X. (2010). Business Ownership and Self-Employment in
Developing Economies: The Colombian Case. In International differences in
entrepreneurship (pp. 89-127). University of Chicago Press.
Mussurov, A. & Arabsheibani, G.R. (2015). Informed self-employment in Kazakhstan. IZA
Journal of Labor & Development 4(9): 1-19.
Naudé, W. (2008). Entrepreneurship in Economic Development. UNU-WIDER Research
Paper 2008/20.

Naudé, W. (2010). Entrepreneurship, developing countries, and development economics:
new approaches and insights. Small Business Economics 34(1): 1-12.
Naudé, W., Gries, T., Wood, E., & Meintjies, A. (2008). Regional determinants of
entrepreneurial start-ups in a developing country. Entrepreneurship and Regional
Development 20(2): 111-124.
North, D.C. (1990). Institutions, Institutional Change and Economic Performance.
Cambridge, UK: Cambridge University Press.
O’Shea, R.P., Chuch, H. & Allen, T.J. (2008). Determinants and consequences of university
spinoff activity: a conceptual framework. The Journal of Technological Transfer 33(6):
653-666.
Okumura, T. & Usui, E. (2016). Intergenerational Transmission of Skills and Differences in
Labor Market Outcomes for Blacks and Whites. IZA DP 9662.
Orazem, P.F., Jolly, R. & Yu, L. (2015). Once an entrepreneur, always an entrepreneur? The
impact of skills developed before, during and after college on firm start-ups. IZA Journal
of Labor Economics 4:9.
Reynolds, P., Bygrave, W.D., Autio, E., Cox, L.W. & Hay, M. (2003). Global
Entrepreneurship Monitor 2002 exclusive report. Wellesley, MA: Babson College.
Robb, A.M. & Watson, J. (2012). Gender differences in firm performance: Evidence from
New Ventures in the United States. Journal of Business Venturing 27(5), 544-558.
Robinson, S. & Stubberud, H.A. (2009). Sources of advice in entrepreneurship: gender
differences in business owners'social networks. International Journal of
Entrepreneurship 13: 83-101.
Roskruge, M.J., Poot, J. & King, L. (2016). Social capital, entrepreneurship and living
standards: differences between immigrants and the native born. IZA DP 9874.
Santos, S.C., Curral, L. & Caetano, A. (2010). Cognitive maps in early entrepreneurship
stages. From motivation to implementation. International Journal of Entrepreneurship
and Innovation 11(1): 29-44.
Schott, T. & Bager, T. (2004). Growth expectations by entrepreneurs in nascent firms, baby
business and mature firms. In The growth of Danish firms (Part 2 of the Global
Entrepreneurship Monitor), Bager T, Hancock M (eds.). Copenhagen, DK:
BorsensForlag; 219-230.
Schumpeter A. 1934. The Theory of Economic Development. Cambridge, MA: Harvard
University Press.

Stephan, U., Hart, M. & Drews, C.C. (2015). Understanding motivations for
entrepreneurship: A review of recent research evidence. Rapid Evidence Assessment
paper.
Terjesen, S. & Amorós, J.E. (2010). Female Entrepreneurship in Latin America and the
Caribbean: Characteristics, Drivers and Relationship to Economic Development.
European Journal of Development Research 22(3): 313-330.
Terjesen, S. & Szerb, L. (2008). Dice thrown from the beginning? An empirical investigation
of firm level growth expectations. Estudios de Economía 35(2): 157-178.
Velilla, J. & Ortega, R. (2017). Determinants of entrepreneurship using fuzzy-set methods:
Europe vs non-Europe. Applied Economics Letters (forthcoming): 1-7.
Viinikainen, J., Heineck, G., Bockerman, P., Hintsanen, M. & Raitakar, O. (2016). Born
entrepreneur? Adolescents' personality characteristics and self-employment in
adulthood. IZA DP 9805.
Wennekers, S., Van Stel, A., Carree, M. & Thurik, R. (2010). The Relationship between
Entrepreneurship and Economic Development: is it U-shaped? Now Publishers Inc.
Wennekers, S., Van Wennekers, A., Thurik, R. & Reynolds, P. (2005). Nascent
Entrepreneurship and the Level of Economic Development. Small Business Economics
24(3): 293–309.
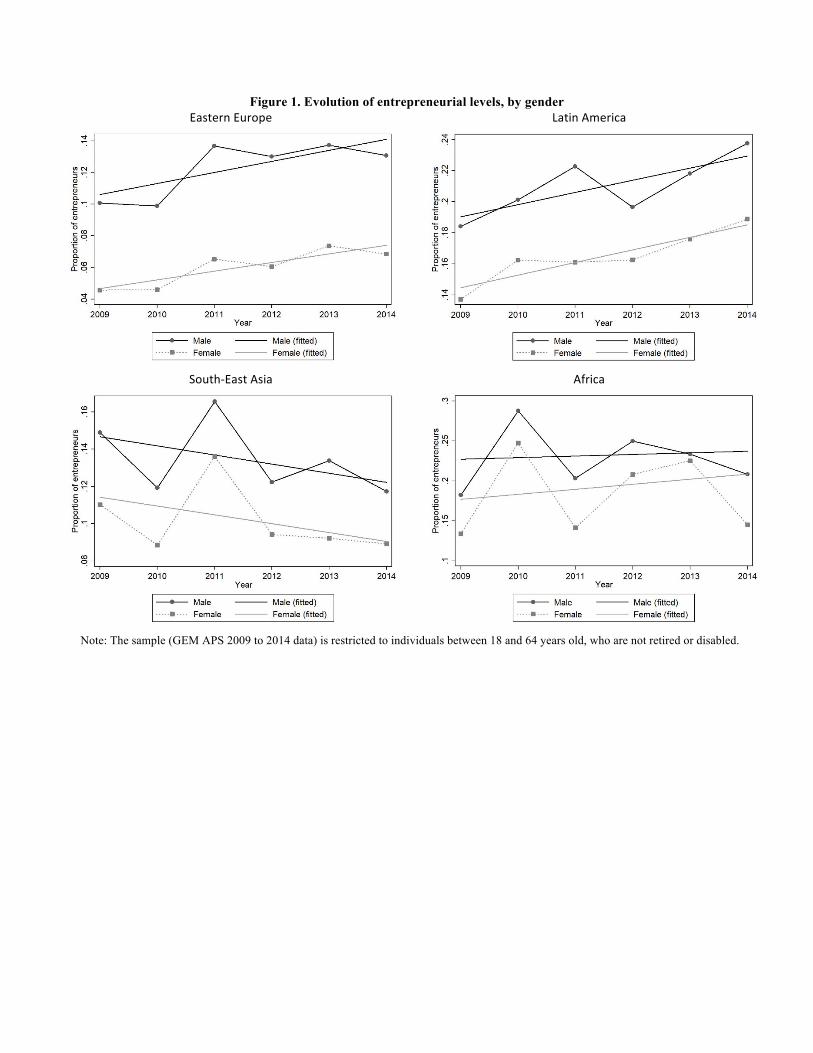
Figure 1. Evolution of entrepreneurial levels, by gender
EasternEurope
LatinAmerica
South-EastAsia
Africa
Note: The sample (GEM APS 2009 to 2014 data) is restricted to individuals between 18 and 64 years old, who are not retired or disabled.

Figure 2. Theoretical framework

Table 1. Countries of the sample, by year
Year
Country 2009 2010 2011 2012 2013 2014
Eastern Europe
Hungary X X X X X X
Romania X X X X X X
Poland X X X X
Lithuania X X X
Latvia X X X X X X
Croatia X X X X X X
Slovenia X X X X X X
Bosnia X X X X X
Macedonia X X X X
Slovakia
X X X X
Latin America
Peru X X X X X X
Mexico X X X X X
Argentina X X X X X X
Brazil X X X X X X
Colombia X X X X X X
Guatemala X X X X X
Panama X X X X X
Ecuador X X X X X
Uruguay
X X X X X X
South-East Asia
Malaysia X X X X X X
Thailand X X X X
S. Korea X X X X X X
China X X X X X X
India X X X
Taiwan
X X X X X
Africa
South Africa X X X X X
Algeria X X X X X
Tunisia X X X X
Nigeria X X X
Angola X X X
Uganda X X X X
Zambia X X X
Botswana X X X

Table 2. Summary statistics, by region and gender
Eastern Europe South-East Asia Latin America Africa
VARIABLES Male Female p-value Male Female p-value Male Female p-value Male Female p-value
Being an entrepreneur 0.125 0.061 (<0.001) 0.132 0.100 (<0.001) 0.211 0.166 (<0.001) 0.232 0.194 (<0.001)
(0.330) (0.240) (0.339) (0.300) (0.408) (0.372) (0.422) (0.395)
Age 38.99 39.16 (0.019) 37.98 38.14 (0.077) 36.28 37.06 (<0.001) 33.67 33.68 (0.874)
(12.38) (12.05) (12.08) (11.94) (12.57) (12.54) (11.56) (11.61)
Basic education 0.043 0.058 (<0.001) 0.097 0.134 (<0.001) 0.189 0.227 (<0.001) 0.197 0.235 (<0.001)
(0.204) (0.234) (0.296) (0.340) (0.391) (0.419) (0.398) (0.424)
Secondary education 0.718 0.653 (<0.001) 0.650 0.646 (0.336) 0.667 0.647 (<0.001) 0.653 0.630 (<0.001)
(0.450) (0.476) (0.477) (0.478) (0.471) (0.477) (0.475) (0.482)
University education 0.239 0.289 (<0.001) 0.253 0.219 (<0.001) 0.143 0.124 (<0.001) 0.149 0.134 (<0.001)
(0.426) (0.453) (0.434) (0.413) (0.350) (0.330) (0.356) (0.340)
Entrepreneurial Opportunities 0.227 0.191 (<0.001) 0.319 0.273 (<0.001) 0.531 0.471 (<0.001) 0.537 0.486 (<0.001)
(0.418) (0.393) (0.466) (0.445) (0.499) (0.499) (0.498) (0.499)
Entrepreneurial Skills 0.560 0.390 (<0.001) 0.393 0.283 (<0.001) 0.640 0.537 (<0.001) 0.660 0.583 (<0.001)
(0.496) (0.487) (0.488) (0.450) (0.479) (0.498) (0.473) (0.492)
Peer effects 0.441 0.339 (<0.001) 0.466 0.378 (<0.001) 0.502 0.394 (<0.001) 0.623 0.530 (<0.001)
(0.496) (0.473) (0.498) (0.485) (0.499) (0.488) (0.484) (0.499)
Entrepreneurship in Media 0.425 0.424 (0.091) 0.649 0.654 (0.002) 0.588 0.586 (0.047) 0.553 0.564 (<0.001)
(0.140) (0.139) (0.191) (0.189) (0.201) (0.202) (0.237) (0.235)
Entrepreneurial spirit 0.171 -0.190 (<0.001) 0.088 -0.075 (<0.001) 0.131 -0.129 (<0.001) 0.106 -0.108 (<0.001)
(1.294) (1.016) (1.125) (1.008) (1.212) (1.064) (1.199) (1.081)
Fear of failure 0.378 0.472 (<0.001) 0.362 0.393 (<0.001) 0.285 0.352 (<0.001) 0.247 0.264 (<0.001)
(0.485) (0.499) (0.480) (0.488) (0.451) (0.477) (0.431) (0.411)
May entrepreneur in the future 0.247 0.160 (<0.001) 0.229 0.191 (<0.001) 0.407 0.343 (<0.001) 0.441 0.393 (<0.001)
(0.431) (0.366) (0.420) (0.393) (0.491) (0.478) (0.496) (0.488)
Have helped other entrepreneurs 0.125 0.065 (<0.001) 0.105 0.075 (<0.001) 0.169 0.118 (<0.001) 0.196 0.147 (<0.001)
(0.331) (0.247) (0.306) (0.216) (0.374) (0.322) (0.397) (0.354)
Have invested in others’ business 0.069 0.039 (<0.001) 0.051 0.036 (<0.001) 0.067 0.038 (<0.001) 0.135 0.090 (<0.001)
(0.253) (0.193) (0.220) (0.187) (0.250) (0.191) (0.342) (0.286)
Social norms -0.283 -0.279 (0.226) -0.496 -0.432 (<0.001) 0.401 0.392 (0.278) 0.016 0.068 (<0.001)
(1.283) (1.300) (1.418) (1.411) (1.640) (1.645) (1.807) (1.771)
Desire for equity 0.631 0.633 (0.048) 0.458 0.463 (0.076) 0.609 0.608 (0.857) 0.493 0.497 (<0.001)
(0.183) (0.186) (0.245) (0.248) (0.187) (0.188) (0.186) (0.182)
Social status of entrepreneurs 0.517 0.520 (<0.001) 0.547 0.556 (<0.001) 0.689 0.688 (0.291) 0.634 0.642 (<0.001)
(0.162) (0.164) (0.176) (0.174) (0.224) (0.224) (0.233) (0.228)
Social status of business success 0.542 0.539 (<0.001) 0.591 0.599 (<0.001) 0.631 0.629 (0.159) 0.652 0.658 (<0.001)
(0.612) (0.163) (0.170) (0.168) (0.194) (0.194) (0.240) (0.236)
Observations 42,399 45,277 35,613 35,265 65,463 72,558 33.522 33.853
Note: Statistics shown: means, and standard deviations in parentheses. The sample (GEM APS 2009 to 2014 data) is restricted to individuals between 18 and 64 years old, who are not retired
or disabled. All variables are dummies, except variables Entrepreneurial spirit and Social norms, which are Principal Components (see Appendix A), and thus are normally distributed; and
Age, which is measured in years. P-values of Kruskal-Wallis test for the differences in parentheses.

Table 3. Linear Probability Model Estimates, by region
Eastern Europe South-East Asia Latin America Africa
(1) (2) (3) (4) (5) (6) (7) (8)
VARIABLES Simple Controls Simple Controls Simple Controls Simple Controls
Being male 0.064*** 0.010*** 0.033** 0.002 0.045*** -0.012** 0.040*** -0.000
(0.004) (0.003) (0.012) (0.008) (0.011) (0.004) (0.006) (0.006)
Age -
0.001***
0.000 -0.000 0.000 -0.000 0.001** 0.000 -0.000
(0.000) (0.000) (0.000) (0.000) (0.000) (0.000) (0.001) (0.001)
Secondary ed. 0.032*** 0.002 0.015 -0.012 0.037** -0.014** 0.026** -0.009
(0.008) (0.008) (0.007) (0.008) (0.014) (0.005) (0.009) (0.007)
University ed. 0.076*** 0.011 0.021** -0.028* 0.084** -0.016 0.022 -
0.036***
(0.011) (0.009) (0.006) (0.012) (0.029) (0.011) (0.018) (0.010)
Entrep. Opportunities 0.004 0.016** 0.001 -0.001
(0.003) (0.005) (0.007) (0.001)
Entrep. Skills 0.040*** 0.065*** 0.036*** 0.059***
(0.005) (0.016) (0.008) (0.011)
Peer effects 0.080*** 0.074*** 0.158*** 0.128***
(0.009) (0.014) (0.023) (0.018)
Entrep. in Media 0.038 0.049* 0.067 0.142
(0.037) (0.020) (0.078) (0.125)
Social norms -0.006 -0.002 -0.011 -0.018
(0.005) (0.002) (0.009) (0.013)
Entrep. spirit 0.106*** 0.107*** 0.154*** 0.131***
(0.004) (0.009) (0.006) (0.013)
Constant 0.058*** 0.024 0.038 0.037 0.160*** 0.048 0.047 0.055
(0.014) (0.019) (0.033) (0.024) (0.025) (0.056) (0.040) (0.098)
Observations 87,676 87,676 70,878 70,878 138,021 138,021 67,375 67,375
R-squared 0.027 0.286 0.032 0.259 0.017 0.326 0.094 0.266
Note: Robust standard errors clustered at country level in parentheses. The sample (GEM APS 2009 to 2014 data) is restricted to
individuals between 18 and 64 years old, who are not retired or disabled. Estimates include country and year fixed effects. Reference
category for education: basic education. ***: significance at the 99%. **: significance at the 95%. *: significance at the 90%.

Table 4. Cross-country estimates of gender
Gender
Coefficient (St. Error)
Eastern Europe
Hungary 0.009* (0.005)
Romania -0.009* (0.005)
Poland 0.011 (0.007)
Lithuania 0.020*** (0.007)
Latvia 0.017*** (0.005)
Croatia 0.009* (0.005)
Slovenia 0.016*** (0.004)
Bosnia 0.005 (0.006)
Macedonia 0.017*** (0.006)
Slovakia 0.012* (0.006)
Latin America
Peru 0.004 (0.007)
Mexico -0.010* (0.005)
Argentina -0.003 (0.007)
Brazil -0.029*** (0.005)
Colombia -0.009 (0.006)
Guatemala -0.015** (0.007)
Panama -0.014** (0.006)
Ecuador -0.025*** (0.008)
Uruguay 0.018*** (0.007)
South-East Asia
Malaysia 0.001 (0.005)
Thailand -0.033*** (0.007)
S. Korea 0.033*** (0.005)
China 0.003 (0.005)
India 0.003 (0.006)
Taiwan 0.013** (0.005)
Africa
South Africa -0.001 (0.005)
Algeria 0.024*** (0.005)
Tunisia 0.027*** (0.006)
Nigeria 0.011 (0.012)
Angola -0.004 (0.013)
Uganda -0.019* (0.011)
Zambia -0.012 (0.012)
Botswana -0.009 (0.010)
Note: Robust standard errors in parentheses. The sample
(GEM APS 2009 to 2014 data) is restricted to individuals
between 18 and 64 years old, who are not retired or
disabled. Estimates include year fixed effects. Only
parameters !" are shown. Complete estimates are shown in
Tables B1, B2, B3 and B4 in Appendix B. ***: significance
at the 99%. **: significance at the 95%. *: significance at
the 90%.

Appendix A: Principal Components Analyses
Table A1. Entrepreneurial spirit, by region
VARIABLES
Eastern
Europe
Coefficient
South-East Asia
Coefficient
Latin America
Coefficient
Africa
Coefficient
Fear of failure -0.249 -0.231 -0.228 -0.139
May entrepreneur in the future 0.607 0.631 0.600 0.604
Have helped other entrepreneurs 0.624 0.610 0.612 0.547
Have invested in others’ business 0.425 0.479 0.462 0.563
Observations 87,676 70,878 138,021 67,375
Eigenvalue 1.398 1.366 1.317 1.311
Proportion of explained variance 0.350 0.592 0.329 0.338
Note: The sample (GEM APS 2009 to 2014 data) is restricted to individuals between 18 and 64 years old, who are not
retired or disabled. In the four cases, the following principal component would have an associated eigenvalue lesser
than 1.
Table A2. Social norms VARIABLES Coefficient
Desire for equity 0.542
Social status of entrepreneurs 0.593
Social status of business success
Observations
0.595
363,950
Eigenvalue 2.527
Proportion of explained variance 0.842
Note: The sample (GEM APS 2009 to 2014 data) is
restricted to individuals between 18 and 64 years old, who
are not retired or disabled. The following principal factor
would have an associated eigenvalue lesser than 1.

Appendix B: Cross-country estimates, additional results
Table B1. Cross-country estimates, Eastern Europe
Hungary Romania Poland Lithuania Latvia Croatia Slovenia Bosnia Macedonia Slovakia
VARIABLES (1) (2) (3) (4) (5) (6) (7) (8) (9) (10)
Being male 0.00878* -0.00923* 0.0112 0.0195*** 0.0170*** 0.00861* 0.0162*** 0.00483 0.0166*** 0.0119*
(0.00523) (0.00544) (0.00724) (0.00741) (0.00538) (0.00467) (0.00382) (0.00580) (0.00569) (0.00639)
Age 0.000885*** 0.000109 0.000714** -0.000303 -0.000319 0.000563*** 0.000292* 9.58e-05 0.000420** -0.000369
(0.000214) (0.000235) (0.000280) (0.000286) (0.000195) (0.000182) (0.000149) (0.000236) (0.000207) (0.000244)
Secondary ed. 0.0225*** -0.00669 -0.00645 0.0553 0.00191 0.0256*** 0.00351 -0.0203 -0.0124* 0.00143
(0.00569) (0.0141) (0.0184) (0.0343) (0.0168) (0.00727) (0.00665) (0.0151) (0.00709) (0.0220)
University ed. 0.0449*** 0.00523 -0.00785 0.0615* 0.00425 0.0266*** 0.00783 -0.0233 0.000870 0.0208
(0.00798) (0.0155) (0.0194) (0.0346) (0.0173) (0.00933) (0.00753) (0.0181) (0.00911) (0.0229)
Entrep. Opportunities 0.0122 -0.00679 -0.0138 0.0148 0.000200 0.00483 0.0222*** 0.00667 0.00818 -0.00205
(0.00874) (0.00802) (0.00968) (0.0106) (0.00724) (0.00818) (0.00709) (0.00864) (0.00706) (0.00915)
Entrep. Skills 0.0578*** 0.0375*** 0.0602*** 0.0322*** 0.0501*** 0.0289*** 0.0406*** 0.0170*** 0.0218*** 0.0434***
(0.00623) (0.00660) (0.00685) (0.00914) (0.00582) (0.00482) (0.00388) (0.00586) (0.00528) (0.00633)
Peer effects 0.0683*** 0.102*** 0.0879*** 0.116*** 0.121*** 0.0710*** 0.0430*** 0.0622*** 0.0766*** 0.0760***
(0.00632) (0.00674) (0.00736) (0.00858) (0.00624) (0.00541) (0.00387) (0.00621) (0.00620) (0.00595)
Entrep. spirit 0.0868*** 0.119*** 0.111*** 0.103*** 0.121*** 0.113*** 0.0849*** 0.108*** 0.0827*** 0.115***
(0.00412) (0.00432) (0.00539) (0.00497) (0.00324) (0.00383) (0.00447) (0.00444) (0.00429) (0.00396)
Constant 0.00386 0.0591*** 0.0124 -0.0372 0.0497*** -0.00593 0.0134 0.0374* 0.0102 0.0606**
(0.0109) (0.0167) (0.0223) (0.0362) (0.0191) (0.0129) (0.00926) (0.0207) (0.0118) (0.0248)
Observations 10,405 8,995 7,039 5,506 11,088 9,463 12,037 8,733 7,146 7,264
R-squared 0.203 0.335 0.279 0.297 0.348 0.350 0.189 0.314 0.219 0.323
Note: Robust standard errors clustered at country level in parentheses. The sample (GEM APS 2009 to 2014 data) is restricted to individuals between 18 and 64 years old, who are
not retired or disabled. Estimates include year fixed effects. Reference category for education: basic education. ***: significance at the 99%. **: significance at the 95%. *: significance
at the 90%.

Table B2. Cross-country estimates, Latin America
Peru Mexico Argentina Brazil Colombia Guatemala Panama Ecuador Uruguay
VARIABLES (1) (2) (3) (4) (5) (6) (7) (8) (9)
Being male 0.00393 -0.00964* -0.00296 -0.0293*** -0.00928 -0.0148** -0.0143** -0.0248*** 0.0182***
(0.00706) (0.00539) (0.00688) (0.00523) (0.00618) (0.00714) (0.00580) (0.00774) (0.00668)
Age 0.000459 0.000398* 0.000936*** -0.000208 0.000881*** 0.00139*** -5.04e-05 0.00102*** -7.99e-05
(0.000283) (0.000220) (0.000260) (0.000213) (0.000236) (0.000288) (0.000242) (0.000297) (0.000244)
Secondary ed. -0.0369*** 0.0221*** -0.0183* -0.0297*** -0.00976 -0.00785 0.00943 -0.0105 -0.0208*
(0.00936) (0.00792) (0.0102) (0.00625) (0.00836) (0.00767) (0.00963) (0.00868) (0.0106)
University ed. -0.0666*** 0.00714 -0.0252* -0.0412*** 0.00670 -0.0383** -0.00484 -0.0265** -0.00678
(0.0133) (0.0109) (0.0132) (0.00897) (0.0104) (0.0191) (0.0116) (0.0132) (0.0154)
Entrep. Opportunities 0.0127 0.0183*** 0.000773 0.0154*** -0.0159** -0.00698 0.0316*** 0.000832 -0.00552
(0.00772) (0.00585) (0.00773) (0.00540) (0.00631) (0.00770) (0.00746) (0.00851) (0.00719)
Entrep. Skills 0.0355*** 0.00372 0.0322*** 0.0736*** 0.0357*** 0.0109 0.0200*** 0.0506*** 0.0295***
(0.00726) (0.00543) (0.00701) (0.00561) (0.00623) (0.00772) (0.00664) (0.00838) (0.00638)
Peer effects 0.159*** 0.105*** 0.170*** 0.113*** 0.236*** 0.108*** 0.106*** 0.194*** 0.136***
(0.00702) (0.00497) (0.00844) (0.00587) (0.00778) (0.00760) (0.00678) (0.00945) (0.00721)
Entrep. spirit 0.170*** 0.165*** 0.160*** 0.117*** 0.141*** 0.177*** 0.184*** 0.154*** 0.144***
(0.00355) (0.00319) (0.00457) (0.00356) (0.00328) (0.00416) (0.00431) (0.00373) (0.00419)
Constant 0.110*** 0.0284** 0.119*** 0.181*** 0.0319** 0.131*** 0.121*** 0.0817*** 0.107***
(0.0160) (0.0142) (0.0180) (0.0153) (0.0159) (0.0159) (0.0144) (0.0162) (0.0173)
Observations 11,842 14,322 10,376 26,242 35,789 10,826 9,555 9,861 9,208
R-squared 0.379 0.404 0.364 0.147 0.378 0.310 0.402 0.340 0.367
Note: Robust standard errors clustered at country level in parentheses. The sample (GEM APS 2009 to 2014 data) is restricted to individuals between 18 and 64 years
old, who are not retired or disabled. Estimates include year fixed effects. Reference category for education: basic education. ***: significance at the 99%. **: significance
at the 95%. *: significance at the 90%.

Table B3. Cross-country estimates, South-East Asia
Malaysia Thailand S. Korea China India Taiwan
VARIABLES (1) (2) (3) (4) (5) (6)
Being male 0.00145 -0.0328*** 0.0325*** 0.00297 0.00248 0.0127**
(0.00463) (0.00685) (0.00454) (0.00495) (0.00561) (0.00501)
Age 0.000438** -0.000191 0.00100*** -0.000164 0.000482** 3.08e-05
(0.000200) (0.000290) (0.000169) (0.000218) (0.000237) (0.000218)
Secondary ed. 0.000220 -0.0235** -0.00102 -0.0265*** 0.0202*** -0.0343***
(0.00681) (0.00969) (0.00883) (0.00851) (0.00734) (0.0112)
University ed. 0.00452 -0.0617*** -0.00171 -0.0523*** 0.00386 -0.0355***
(0.0122) (0.0103) (0.00995) (0.0117) (0.00827) (0.0117)
Entrep. Opportunities 0.00850 0.0123 0.0604*** 0.0126** 0.0196** 0.00312
(0.00581) (0.00765) (0.0114) (0.00639) (0.00766) (0.00592)
Entrep. Skills 0.0517*** 0.0436*** 0.0671*** 0.0963*** 0.00186 0.101***
(0.00708) (0.00759) (0.00767) (0.00639) (0.00607) (0.00799)
Peer effects 0.0243*** 0.120*** 0.0571*** 0.0873*** 0.0794*** 0.0653***
(0.00441) (0.00821) (0.00629) (0.00491) (0.00748) (0.00547)
Entrep. spirit 0.112*** 0.134*** 0.0815*** 0.0977*** 0.145*** 0.0839***
(0.00591) (0.00369) (0.00486) (0.00254) (0.00518) (0.00349)
Constant 0.0557*** 0.146*** 0.0134 0.137*** 0.0310** 0.0435***
(0.0140) (0.0177) (0.0139) (0.0142) (0.0127) (0.0167)
Observations 10,996 9,879 11,730 19,955 8,901 9,417
R-squared 0.248 0.282 0.181 0.222 0.397 0.249
Note: Robust standard errors clustered at country level in parentheses. The sample (GEM APS 2009 to 2014 data) is
restricted to individuals between 18 and 64 years old, who are not retired or disabled. Estimates include year fixed effects.
Reference category for education: basic education. ***: significance at the 99%. **: significance at the 95%. *:
significance at the 90%.

Table B4. Cross-country estimates, Africa
South Africa Algeria Tunisia Nigeria Angola Uganda Zambia Botswana
VARIABLES (1) (2) (3) (4) (5) (6) (7) (8)
Being male -0.000750 0.0242*** 0.0273*** 0.0105 -0.00387 -0.0191* -0.0117 -0.00944
(0.00463) (0.00512) (0.00608) (0.0117) (0.0127) (0.0112) (0.0121) (0.00958)
Age 0.000726*** -0.000349 8.02e-05 -0.00101* 0.00134** -0.00322*** -3.70e-06 0.00168***
(0.000191) (0.000229) (0.000251) (0.000562) (0.000586) (0.000455) (0.000534) (0.000485)
Secondary ed. 0.00979 -0.0215*** 0.00211 0.0177 0.00305 -0.0247* -0.0211 -0.0101
(0.00754) (0.00751) (0.00824) (0.0155) (0.0192) (0.0127) (0.0153) (0.0160)
University ed. 0.0229 -0.0459*** -0.0141 -0.0558*** 0.0305 -0.0778*** -0.0819*** -0.0531***
(0.0141) (0.00846) (0.00882) (0.0202) (0.0292) (0.0286) (0.0228) (0.0195)
Entrep. Opportunities -0.00742 0.00951 0.0147* 0.0358** 0.0110 -0.0114 -0.0158 -0.00844
(0.00600) (0.00602) (0.00812) (0.0163) (0.0140) (0.0133) (0.0140) (0.0100)
Entrep. Skills 0.0543*** 0.0293*** 0.0221*** 0.0988*** 0.0830*** 0.0830*** 0.0289* 0.0563***
(0.00589) (0.00536) (0.00557) (0.0162) (0.0136) (0.0148) (0.0150) (0.0103)
Peer effects 0.0833*** 0.0917*** 0.0719*** 0.201*** 0.127*** 0.118*** 0.206*** 0.218***
(0.00579) (0.00463) (0.00671) (0.0139) (0.0132) (0.0120) (0.0140) (0.0101)
Entrep. spirit 0.190*** 0.111*** 0.0909*** 0.144*** 0.111*** 0.0864*** 0.173*** 0.166***
(0.00564) (0.00388) (0.00537) (0.00535) (0.00524) (0.00508) (0.00486) (0.00492)
Constant 0.122*** 0.160*** 0.0881*** 0.118*** 0.0831*** 0.298*** 0.0729*** -0.00471
(0.0124) (0.0139) (0.0138) (0.0287) (0.0267) (0.0222) (0.0250) (0.0264)
Observations 13,041 11,937 7,588 7,155 6,426 9,009 6,006 6,213
R-squared 0.348 0.220 0.135 0.175 0.201 0.094 0.275 0.329
Note: Robust standard errors clustered at country level in parentheses. The sample (GEM APS 2009 to 2014 data) is restricted to individuals between
18 and 64 years old, who are not retired or disabled. Estimates include year fixed effects. Reference category for education: basic education. ***:
significance at the 99%. **: significance at the 95%. *: significance at the 90%.