fermentations phase of saccharomyces cerevisiae in wine ... · metabolic flux analysis during the...
TRANSCRIPT

Metabolic Flux Analysis during the Exponential GrowthPhase of Saccharomyces cerevisiae in WineFermentationsManuel Quirós1*, Rubén Martínez-Moreno1, Joan Albiol2, Pilar Morales1, Felícitas Vázquez-Lima2¤a,Antonio Barreiro-Vázquez2¤b, Pau Ferrer2, Ramon Gonzalez1
1 Instituto de Ciencias de la Vid y del Vino (Consejo Superior de Investigaciones Científicas, Universidad de la Rioja, Gobierno de La Rioja), Logroño, Spain,2 Department of Chemical Engineering, Universitat Autònoma de Barcelona, Barcelona, Spain
Abstract
As a consequence of the increase in global average temperature, grapes with the adequate phenolic and aromaticmaturity tend to be overripe by the time of harvest, resulting in increased sugar concentrations and imbalanced C/Nratios in fermenting musts. This fact sets obvious additional hurdles in the challenge of obtaining wines with reducedalcohols levels, a new trend in consumer demands. It would therefore be interesting to understand Saccharomycescerevisiae physiology during the fermentation of must with these altered characteristics. The present study aims todetermine the distribution of metabolic fluxes during the yeast exponential growth phase, when both carbon andnitrogen sources are in excess, using continuous cultures. Two different sugar concentrations were studied undertwo different winemaking temperature conditions. Although consumption and production rates for key metaboliteswere severely affected by the different experimental conditions studied, the general distribution of fluxes in centralcarbon metabolism was basically conserved in all cases. It was also observed that temperature and sugarconcentration exerted a higher effect on the pentose phosphate pathway and glycerol formation than on glycolysisand ethanol production. Additionally, nitrogen uptake, both quantitatively and qualitatively, was strongly influenced byenvironmental conditions. This work provides the most complete stoichiometric model used for Metabolic FluxAnalysis of S. cerevisiae in wine fermentations employed so far, including the synthesis and release of relevantaroma compounds and could be used in the design of optimal nitrogen supplementation of wine fermentations.
Citation: Quirós M, Martínez-Moreno R, Albiol J, Morales P, Vázquez-Lima F, et al. (2013) Metabolic Flux Analysis during the Exponential Growth Phaseof Saccharomyces cerevisiae in Wine Fermentations. PLoS ONE 8(8): e71909. doi:10.1371/journal.pone.0071909
Editor: Michael Polymenis, Texas A&M University, United States of America
Received April 26, 2013; Accepted July 4, 2013; Published August 13, 2013
Copyright: © 2013 Quirós et al. This is an open-access article distributed under the terms of the Creative Commons Attribution License, which permitsunrestricted use, distribution, and reproduction in any medium, provided the original author and source are credited.
Funding: This work was funded by the CDTI (Spanish Center for Technological Industrial Development) through the Ingenio 2010-CENIT Program andproject AGL 2009-07327 of the Spanish Ministry of Science and Innovation. M.Q. and R.M.-M. are recipients of a CSIC training JAE-Doc contract and aCSIC JAE-pre grant respectively, both co-funded by the European Social Fund of the EU. The funders had no role in study design, data collection andanalysis, decision to publish, or preparation of the manuscript.
Competing interests: The authors have declared that no competing interests exist.
* E-mail: [email protected]
¤a Current address: Greenaltech. Parc Científic de Barcelona, Barcelona, Spain¤b Current address: Bioingenium. Edifici Hèlix, Parc Científic de Barcelona, Barcelona, Spain
Introduction
Over the past few decades, the intensified emissions ofgreenhouse gases and aerosol particles mainly derived fromindustrial activity and transport have led to one of the majorchallenges in the history of mankind: global warming [1]. Apartfrom known consequences such as the melting of the polar icecaps, this phenomenon is also affecting agriculture. In fact, theincrease in temperature has already had a noteworthy effecton, among others, the grape and wine industry [2].
Global warming has been shown to cause lower yields inVitis vinifera, changes in plagues and microbiological diseasesand drastic modifications in grape physiology. With respect to
the latter, changes in acidity, phenolic maturation, tannincontent and sugar concentration have been proven to occur,especially in warm climates [3]. Among these parameters,increased sugar concentrations may cause important changesin the physiology of Saccharomyces cerevisiae, the yeastspecies mainly responsible for the alcoholic fermentation thattakes place during winemaking. High sugar concentrationsinduce an osmotic stress response in yeast, which can result instuck or sluggish fermentations and lead to increased formationof fermentation by-products such as glycerol and acetic acid[4,5].
Although the physiology of S. cerevisiae has been thoroughlystudied and characterized over the last century due to the
PLOS ONE | www.plosone.org 1 August 2013 | Volume 8 | Issue 8 | e71909

status of this yeast as model organism, the distribution ofmetabolic fluxes occurring during wine fermentations has notbeen tackled in depth. Due to the intrinsic dynamic nature ofthis process, yeast metabolism undergoes a series ofphysiological adaptive changes in response to the continuousenvironmental variations that take place, clearly hampering itsunderstanding.
During the last decade, several laboratories have aimed tostudy yeast physiology under winemaking conditions. Varela etal. [6] described the metabolic flux distribution of yeast duringsluggish and normal fermentations using batch cultures. Thisgroup has further extended this approach by developing agenome-scale dynamic flux balance model that allowsprediction of metabolite production in batch cultures [7]. In thiscontext, Clement et al. [8] studied the fermentation process in a“multistage bioreactor system”, where two or four fermenters,operating in continuous mode, were connected in tandemmimicking sequential stages of standard batch winefermentations. This allowed the achievement of a series ofmetabolic steady states resembling those found in each stageof wine fermentation. Nevertheless, this cultivation strategywas not used for further Metabolic Flux Analysis (MFA) studies.As an alternative, we have recently developed a simpleapproach for metabolic phenotyping of yeast during winefermentations. In short, batch fermentations are firstsystematically characterized, including measurements ofgrowth and consumption/production rates of the mainmetabolites along the whole process. Based on the evolution ofphysiological parameters, the fermentation is divided into threedefined phases: phase I, corresponding to the yeastexponential growth phase; phase II, when nitrogen becomes alimiting nutrient; and phase III, where most of the ethanol isproduced at near zero growth rate. Finally, based on the batchparameters, specific feeds are defined in order toindependently mimic each of these phases using continuouscultures [9]. This strategy allows for an easy and reliablecalculation of the distribution of metabolic fluxes [10].
In the present study, we investigated the impact of growthtemperature and sugar content on the distribution of metabolicfluxes of S. cerevisiae EC1118 growing under phase Iconditions at fermentation temperatures typical for red (28 °C)and white (16 °C) wines. Emulating an extreme increase insugar concentration motivated by global warming, we haveused a synthetic must with 280 g L-1 glucose and compared theobtained results with a control must containing 240 g L-1
glucose. A control must with 240 g L-1 glucose and another,emulating an extreme increase in sugar concentrationmotivated by global warming with 280 g L-1 glucose, have beenused. In all cases, media were supplemented with potassiummetabisulphite in order to mimic cellar conditions. During thisfirst phase, yeast reaches its maximum growth rate (μmax) thatdepends on fermentation temperature, organic and inorganicnitrogen sources are available and not growth-limiting, and highsugar and low ethanol concentrations are present in thefermenting must.
The proposed and validated model includes reactions fromcentral carbon and nitrogen metabolism. With regard topreviously used models, the latter has been expanded to
incorporate transport reactions for ammonium and 19 differentamino acids, their anabolism and/or catabolism and, for the firsttime, pathways involved in the synthesis of aroma precursors.Moreover, the present work combines the application of astoichiometric model for analyzing the metabolic fluxdistribution of S. cerevisiae under winemaking conditions usingcontinuous cultures in bioreactors.
Material and Methods
Strains and culture conditionsSaccharomyces cerevisiae LALVIN EC1118, the strain used
in this study, is a commercial wine yeast strain isolated fromthe Champagne region (France) produced and commercializedby Lallemand Inc. (Ontario, Canada). The strain was grown at28 °C and routinely maintained at 4 °C on YPD platescontaining 2% glucose (w/v), 2% peptone, 1% yeast extractand 2% agar, and in glycerol stocks at -80 °C.
Batch and continuous cultivationsA modification of a chemically defined synthetic must
previously described [11] was used both for the batch and thecontinuous cultures. The medium contained the followingcomponents (expressed per litre): glucose, 240 or 280 g; malicacid, 6 g; citric acid, 6 g; DifcoTM Yeast Nitrogen Base w/oamino acids and ammonium sulphate (BD, Sparks, USA), 1,7g; ammonium chloride, 306 mg; alanine, 97 mg; arginine, 245mg; aspartic acid, 29 mg; cysteine, 14 mg; glutamic acid, 80mg; glutamine, 333 mg; glycine, 12 mg; histidine, 23 mg;isoleucine, 22 mg; leucine, 32 mg; lysine, 11 mg; methionine,21 mg; phenylalanine, 25 mg; proline, 400 mg; serine, 52 mg;threonine, 50 mg; tryptophan, 116 mg; tyrosine, 13 mg; valine,29 mg; ergosterol, 15 mg; sodium oleate, 5 mg; Tween 80, 0.5mL and potassium metabisulphite, 60 mg. All cultures were runin a DASGIP parallel fermentation platform (DASGIP AG,Jülich, Germany) equipped with four SR0400SS vessels. Batchcultures were performed in duplicate using 300 mL as the initialworking volume and were used to establish the specificproduction and consumption rates of the main metabolites (e.g.glucose, glycerol, ethanol, CO2, biomass, acetic acid, lacticacid and succinic acid) throughout the whole fermentativeprocess. Continuous cultures were performed in duplicate at aconstant volume of 200 mL at near μmax dilution rate (D): 0.25h-1 for those fermentations performed at 28 °C and 0.1 h-1 forthose performed at 16 °C. These D values had beenexperimentally determined previously in the aforementionedbatch cultures. Agitation was maintained at 250 rpm and thetemperature kept at 28 or 16 °C using a water bath and a 1:1water/ethylenglycol-cooled chiller. During batch and continuouscultures, the pH of the medium was kept at 3.5 by theautomated addition of 2N NaOH. Anaerobic conditions weremaintained by gassing the headspace of the bioreactors withpure nitrogen gas (3.5 sL h-1). The use of spargers was avoidedin order to reduce ethanol stripping. The effluent fermentationgas measured every 30 s for determination of CO2
concentration with a GA4 gas analyzer (DASGIP AG). For theinoculation of both batch and continuous cultures, EC1118 wasgrown in Falcon tubes containing 25 mL YPD and incubated at
MFA of S. cerevisiae in Wine Fermentations
PLOS ONE | www.plosone.org 2 August 2013 | Volume 8 | Issue 8 | e71909

28 °C and 150 rpm orbital shaking for 48h in order to reachstationary phase. Cells were then washed twice in steriledeionized water, resuspended in 5 mL of the synthetic mustand inoculated to an initial OD600 0.2. Steady states weresampled only after all continuous cultures had been running forat least five residence times and the CO2 production rate, thebiomass values and the concentration of the main metaboliteswere constant.
Analysis of extracellular metabolitesHPLC quantification of main metabolites. The
concentration of glucose, glycerol, ethanol and lactic, aceticand succinic acid was determined following the protocoldescribed by Quirós et al. [12] using a Surveyor Pluschromatograph (Thermo, Fisher Scientific, Waltham, MA)equipped with a refraction index and a photodiode arraydetector (Surveyor RI Plus and Surveyor PDA Plus,respectively) on a 300 × 7.7 mm HyperREZTM XP CarbohydrateH+ (8 µm particle size) column and guard (Thermo, FisherScientific). The column was maintained at 50 °C and 1.5 mMH2SO4 was used as the mobile phase at a flow rate of 0.6 mLmin-1. Prior to injection in duplicate, samples were filteredthrough 0.22 µm pore size nylon filters (Symta, Madrid, Spain)and diluted when necessary 10 or 20-fold.
The concentration of each amino acid was analyzed induplicate according to the method of Gomez-Alonso et al. [13]using an Accela 600 chromatograph (Thermo, Fisher Scientific)equipped with a PDA detector and a 250 × 4.6 mm ACE C18-HL ID (5 µm particle size) column and guard (ACE, Aberdeen,Scotland).
The concentration of ammonium was determinedenzymatically using the R-Biopharm assay kit Cat. No. 11 112732 035 (Darmstadt, Germany).
GC-MS determination. The volatile fraction of steady stateswas analyzed using headspace solid-phase micro extractioncoupled with gas chromatography-mass spectrometry (HS-SPME/GCMS) by a modification of the protocol described byPozo-Bayon et al. [14]. A Thermo Scientific Trace GC Ultra gaschromatograph equipped with a Thermo Scientific TriplusAutosampler and coupled to a Thermo Scientific ISQ massdetector was used for gas chromatography-mass-spectrometry.
Five fusel alcohols (propanol, isoamyl alcohol, amyl alcohol,isobutanol and 2-phenylethanol) were quantified using 2 ml offermentation broth. One gram of sodium chloride was added tothe sample placed in a 20 mL headspace vial, followed by 10µL of 2000 ppm internal standard solution (4-methyl-2-pentanoland 1-nonanol in 0.5% ethanol). Briefly, the vial was tightlycapped with a PTFE/Silicone cap and then heated for 10 min at70 °C. Then, a Supelco 100 µm PDMS fiber was exposed tothe headspace of the sample vials for 30 min and desorbed inthe GC inlet for 4 min. The instrument was fitted with a 30 m ×0.25 mm TG-WAXMS A fused-silica capillary column, 0.25 mmfilm thickness (Thermo, Fisher Scientific). The GC temperatureprogram was as follows: 40 °C (5 min hold), 3 °C min-1 up to200 °C and 15 °C min-1 up to 240 °C (10 min hold), while the0.75 mm I.D. SPME liner was held at 180 °C. Helium was usedas the carrier gas at a flow rate of 1 mL min-1, operating in splitmode (ratio 30). For the MS detector, the temperatures of
transfer line and ion source were both 250 °C, ionization modewas electron impact at a voltage of 70 eV and acquisitionswere performed in SIM mode (dwell time 50 ms). Instrumentcontrol, data analysis and quantification results were carriedout with Xcalibur 2.1 software. Volatile compounds wereidentified and quantified by comparison with standards, andanalyses were carried out in duplicate.
Biomass composition analysesDetermination of cell growth and biomass dry
weight. To determine cell growth during the course of batchfermentations, the optical density (OD) was monitored using aShimadzu UV-1800 Spectrophotometer (Shimadzu, EuropeGmbH, Duisberg, Germany). When necessary, samples werediluted with deionized water to obtain OD600 measurements inthe linear range of 0.1-0.4 units. OD data were thentransformed to dry cell weight values using a calibration curvefor S. cerevisiae EC1118 in the synthetic must describedabove. When steady states were reached, biomass dry weightwas determined in triplicate by filtering 5 ml (for fermentationsrun at 28 °C) or 15 mL (for fermentations run at 16 °C) of thecultures followed by 10 mL distilled water through a 25 mm,0.45 µm pore size pre-dried and pre-weighed nitrocellulosefilter (Millipore, Billerica, USA). Filters were then heat dried inan oven at 70 °C until weight was constant (12-24 h).
Biomass lyophilization. Samples of cultivation broth fromall steady states were centrifuged at 10,000 rpm for 5 min andthe cell pellet was washed three times in sterile distilled water.The recovered pellet was immediately frozen by immersion inliquid nitrogen and lyophilized during 72 h. Once lyophilized,cell pellets were additionally dried in an oven at 65 °C for 24 h.
Total carbohydrate content. To determine the biomasstotal carbohydrate content, an aqueous solution of lyophilizedbiomass was prepared at a concentration of 0.1 g L-1 andsubjected in triplicate to the phenol-sulphuric acid method asdescribed by Segarra et al. [15] using a standard curve ofglucose (Sigma-Aldrich).
Total protein content and amino acid composition. Totalprotein content and amino acid composition of the biomasswas determined following the protocol described by Carnicer etal. [16]. This allowed us to estimate the molar fraction of eachamino acid in the average protein.
Elementary composition. Biomass recovered from 50 mLof each steady state was washed three times with deionizedwater, dried in an oven at 70 °C for 72 hours and crushedthoroughly using a porcelain mortar and pestle. The finepowdered biomass was dried again in the same conditions for24 h and 1 mg analyzed in an EA 1110 CHNS-O elementalanalyzer (CE-Instruments/Thermo Fisher Scientific) coupled toan E3200 autosampler and a thermoconductivity detector.
In order to determine the biomass ash content, the powderedbiomass was placed in a pre-weighted crucible and calcinatedin a muffle furnace at 800 °C for 24 h. The difference in weightwas measured with an AB204-S electronic precision scale(Mettler, Toledo, Columbus, USA).
MFA of S. cerevisiae in Wine Fermentations
PLOS ONE | www.plosone.org 3 August 2013 | Volume 8 | Issue 8 | e71909

Consistency check, data reconciliation and statisticalanalysis
Data obtained during continuous cultures were checked forconsistency and reconciled based on a χ2-test (p≤0.05) asproposed by Wang and Stephanopoulos [17]. The testproposed by Lange and Heijnen [18] was used for verificationof consistency and reconciliation of macromolecular andelementary biomass compositional data. This test allowed forthe estimation of the non-measured biomass lipid and nucleicacid content.
The physiological parameters and metabolic flux valuesobtained in all conditions were compared by means ofStudent’s t-test at 95% confidence level. Principal ComponentsAnalysis (PCA) was performed in order to identify relevantexperimental condition effects using IBM SPSS win 19.0software (IBM Corp., Armonk, USA).
Stoichiometric modelThe stoichiometric model used to represent the metabolic
network of S. cerevisiae EC1118 was adapted from the modelof Varela et al. [6] (see Appendix S1). While the reactionsinvolved in central carbon metabolism have been used withminor modifications, nitrogen metabolism has been thoroughlyrevised and expanded. Therefore, the uptake reactions forammonium and the 19 amino acids present in the mediumhave been included in the model (proline transport was notincluded as it is not degraded under anaerobic conditionsaccording to Ingledew et al. [19]). On the other hand, reactionsinvolved in either synthesis or catabolism of amino acids havebeen included according to the following criteria. When theratio “incorporation rate into the biomass/uptake rate” (molgDW-1 h-1/mol gDW-1 h-1) of a specific amino acid was ≥ 1, thebiosynthetic pathway for that amino acid was included. Incontrast, when this ratio was < 1, it has been assumed thatthere is an excess of such compound in the cell and, therefore,the corresponding degradation pathway was included. The totalcell content of each amino acid residue was estimated from themolar fraction of each amino acid in the total protein.
Additionally, some alternative amino acid degradation routes,such as the Ehrlich pathway, which involves the synthesis ofisoamyl alcohol, active amyl alcohol and isobutanol, amongothers, have also been included in the proposed stoichiometricmodel.
The final metabolic network consists of m=88 metabolitesand n=82 reactions (Appendix S1). The existence andstoichiometry of each reaction was verified using theSaccharomyces Genome Database (SGD,www.yeastgenome.org) and the Kyoto Encyclopedia of Genesand Genomes (KEGG, www.genome.jp/kegg/).
SoftwareAll numerical calculations were performed using Matlab
2010b (MathWorks Inc., Natick, MA, USA). CellDesigner 4.2(Systems Biology Institute, Tokio, Japan) was used formetabolic network design and Cell-Net-Analyzer 9.4 [20] forMFA.
Results and Discussion
Quantitative physiology of S. cerevisiae EC1118 duringanaerobic continuous cultures at near μmax dilution rate
General physiology. Although the metabolism of S.cerevisiae has been extensively described and studied underdifferent laboratory growth conditions, data regarding keyphysiological parameters in the different stages of winefermentation are not easily found in the literature. One of themain objectives of the present work is to contribute to theunderstanding of yeast physiology by providing accurateproduction and consumption rates of the main metabolitesduring the initial stages of wine fermentation in differentenological conditions. Since there are important physiologicaland transcriptional differences between laboratory andindustrial wine yeast strains [21], the broadly used wine yeaststrain EC1118 was chosen as a model in this work.
Results for consumption/production rates (Table S1) wereexperimentally obtained from two independent replicates foreach condition of glucose concentration, temperature anddilution rate (see Material and methods) and represent thebasis for all the calculations performed in this work. Due to theessential need for rates accuracy in order to achieve correctcalculated fluxes, special attention was paid in theirdetermination following the recommendations proposed byHeijnen and Verheijen [22]. All balances (carbon, nitrogen andredox) closed with >95% recovery in all cases.
From a general point of view, a strong effect of temperatureand dilution rate on the consumption or production rates of thedifferent metabolites could be observed, with higher rates at 28°C. As an example, glucose uptake rates, representing themain entrance of carbon into the system (carbon skeletons ofamino acids also contribute to C uptake) were approximatelythree times higher at 28 °C and D = 0.25 h-1 at both sugarconcentrations than at 16 °C and D = 0.1 h-1 (87.1 vs. 29.2 C-mmol gDW-1 h-1 at 240 g L-1 and 76.3 vs. 23.3 C-mmol gDW-1
h-1 at 280 g L-1, Figures 1 and 2). These differences must bemainly due to the difference in growth rate and not to the effectof temperature, as exactly the same relationship had beenpreviously observed between S. cerevisiae growing at 30 °C inglucose limited chemostats operated at D = 0.3 h-1 and D = 0.1h-1 [23]. On the other hand, an impact of sugar concentrationwas also observed, although this effect was less pronounced(Table S1). Several authors have described that bothtemperature and growth rate affect physiology of S. cerevisiae[21,24,25]. Our results showed that the combination of adecreased temperature and dilution rate always caused thesame effect, reducing the consumption or production rate of thedifferent metabolites. However, the maximum specific growthrate (µ) is strongly affected by temperature, which hampers thedissection of the effect due to temperature from that caused bythe specific growth rate [24]. In fact, a large overlap betweengenes reported to be regulated by temperature and genescontrolled by growth rate has also been demonstrated[21,24,26]. However, other relevant studies have also shownthat the effect of dilution rate on parameters such as glucoseconsumption, glycerol [23,27], ethanol [23], or biomassproduction [24] was stronger than the effect of temperature. In
MFA of S. cerevisiae in Wine Fermentations
PLOS ONE | www.plosone.org 4 August 2013 | Volume 8 | Issue 8 | e71909

our opinion, it would be very interesting to look deeper into thetemperature effect since Tai et al. [24] described the slightoverlap existing between transcriptomic databases of S.cerevisiae wine strain from previous low-temperatureadaptation studies [28] and lab strains [29–31]. This fact would
be due to the many peculiarities characterizing a grape mustsuch as low pH, high sugar concentration or mixed nitrogensources present at low concentration.
In all cases of this study, between 81.3 and 84.9% of carbonuptake was used in energy production (measured as ethanol
Figure 1. Distribution of metabolic fluxes at 240 g L-1 glucose expressed as C-mmol per 100 C-mmol glucose. Themeasured specific glucose uptake is shown next to the normalized value. Orange/purple boxes: measured and reconciled values;Green/blue boxes: calculated values.doi: 10.1371/journal.pone.0071909.g001
MFA of S. cerevisiae in Wine Fermentations
PLOS ONE | www.plosone.org 5 August 2013 | Volume 8 | Issue 8 | e71909
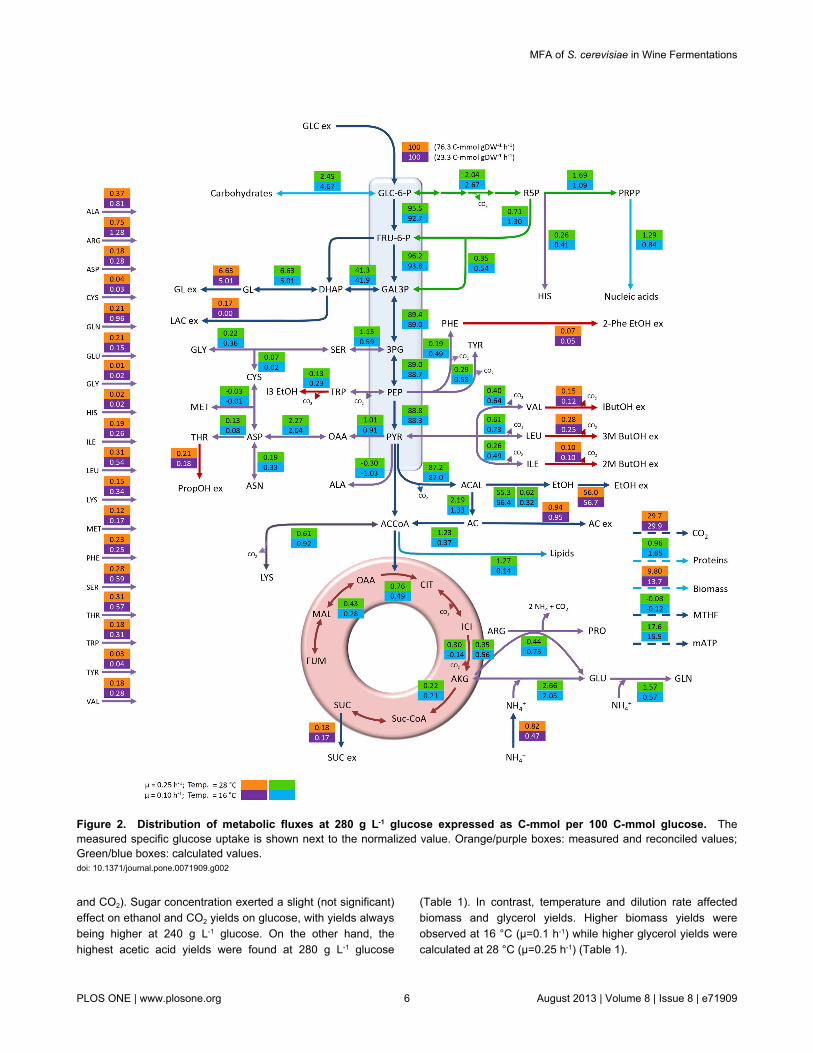
and CO2). Sugar concentration exerted a slight (not significant)effect on ethanol and CO2 yields on glucose, with yields alwaysbeing higher at 240 g L-1 glucose. On the other hand, thehighest acetic acid yields were found at 280 g L-1 glucose
(Table 1). In contrast, temperature and dilution rate affectedbiomass and glycerol yields. Higher biomass yields wereobserved at 16 °C (µ=0.1 h-1) while higher glycerol yields werecalculated at 28 °C (µ=0.25 h-1) (Table 1).
Figure 2. Distribution of metabolic fluxes at 280 g L-1 glucose expressed as C-mmol per 100 C-mmol glucose. Themeasured specific glucose uptake is shown next to the normalized value. Orange/purple boxes: measured and reconciled values;Green/blue boxes: calculated values.doi: 10.1371/journal.pone.0071909.g002
MFA of S. cerevisiae in Wine Fermentations
PLOS ONE | www.plosone.org 6 August 2013 | Volume 8 | Issue 8 | e71909
Pathways involved in energy production are stronglyregulated, regardless of culture conditions [32,33]. As a result,and as indicated above, not significant differences in ethanoland CO2 yields were observed between different growthconditions as previously reported by other authors [23]. On theother hand, glycerol, acetic acid and biomass yields are morerelated to the internal redox balance [34,35] and thereforepresented higher variability depending on growth conditions(Table 1). The distribution of carbon to different metabolites(and throughout the different metabolic pathways) will be moreextensively discussed in the following sections.
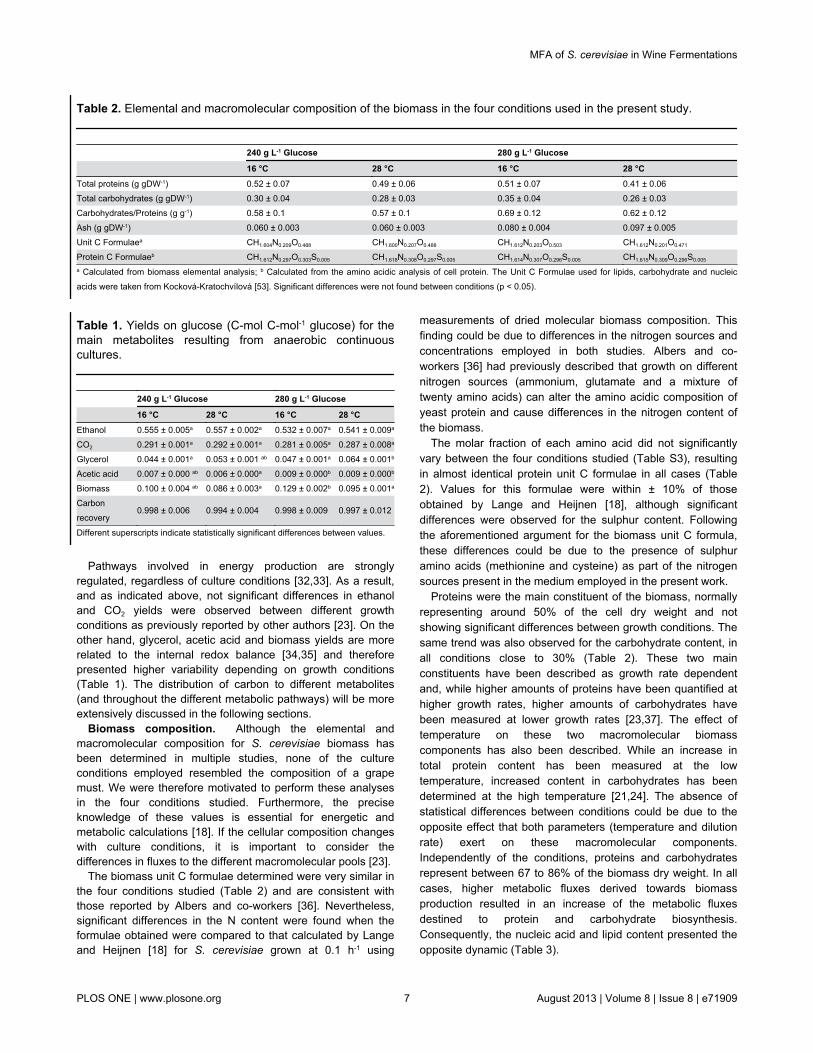
Biomass composition. Although the elemental andmacromolecular composition for S. cerevisiae biomass hasbeen determined in multiple studies, none of the cultureconditions employed resembled the composition of a grapemust. We were therefore motivated to perform these analysesin the four conditions studied. Furthermore, the preciseknowledge of these values is essential for energetic andmetabolic calculations [18]. If the cellular composition changeswith culture conditions, it is important to consider thedifferences in fluxes to the different macromolecular pools [23].
The biomass unit C formulae determined were very similar inthe four conditions studied (Table 2) and are consistent withthose reported by Albers and co-workers [36]. Nevertheless,significant differences in the N content were found when theformulae obtained were compared to that calculated by Langeand Heijnen [18] for S. cerevisiae grown at 0.1 h-1 using
Table 1. Yields on glucose (C-mol C-mol-1 glucose) for themain metabolites resulting from anaerobic continuouscultures.
240 g L-1 Glucose 280 g L-1 Glucose
16 °C 28 °C 16 °C 28 °CEthanol 0.555 ± 0.005a 0.557 ± 0.002a 0.532 ± 0.007a 0.541 ± 0.009a
CO2 0.291 ± 0.001a 0.292 ± 0.001a 0.281 ± 0.005a 0.287 ± 0.008a
Glycerol 0.044 ± 0.001a 0.053 ± 0.001 ab 0.047 ± 0.001a 0.064 ± 0.001b
Acetic acid 0.007 ± 0.000 ab 0.006 ± 0.000a 0.009 ± 0.000b 0.009 ± 0.000b
Biomass 0.100 ± 0.004 ab 0.086 ± 0.003a 0.129 ± 0.002b 0.095 ± 0.001a
Carbonrecovery
0.998 ± 0.006 0.994 ± 0.004 0.998 ± 0.009 0.997 ± 0.012
Different superscripts indicate statistically significant differences between values.
measurements of dried molecular biomass composition. Thisfinding could be due to differences in the nitrogen sources andconcentrations employed in both studies. Albers and co-workers [36] had previously described that growth on differentnitrogen sources (ammonium, glutamate and a mixture oftwenty amino acids) can alter the amino acidic composition ofyeast protein and cause differences in the nitrogen content ofthe biomass.
The molar fraction of each amino acid did not significantlyvary between the four conditions studied (Table S3), resultingin almost identical protein unit C formulae in all cases (Table2). Values for this formulae were within ± 10% of thoseobtained by Lange and Heijnen [18], although significantdifferences were observed for the sulphur content. Followingthe aforementioned argument for the biomass unit C formula,these differences could be due to the presence of sulphuramino acids (methionine and cysteine) as part of the nitrogensources present in the medium employed in the present work.
Proteins were the main constituent of the biomass, normallyrepresenting around 50% of the cell dry weight and notshowing significant differences between growth conditions. Thesame trend was also observed for the carbohydrate content, inall conditions close to 30% (Table 2). These two mainconstituents have been described as growth rate dependentand, while higher amounts of proteins have been quantified athigher growth rates, higher amounts of carbohydrates havebeen measured at lower growth rates [23,37]. The effect oftemperature on these two macromolecular biomasscomponents has also been described. While an increase intotal protein content has been measured at the lowtemperature, increased content in carbohydrates has beendetermined at the high temperature [21,24]. The absence ofstatistical differences between conditions could be due to theopposite effect that both parameters (temperature and dilutionrate) exert on these macromolecular components.Independently of the conditions, proteins and carbohydratesrepresent between 67 to 86% of the biomass dry weight. In allcases, higher metabolic fluxes derived towards biomassproduction resulted in an increase of the metabolic fluxesdestined to protein and carbohydrate biosynthesis.Consequently, the nucleic acid and lipid content presented theopposite dynamic (Table 3).
Table 2. Elemental and macromolecular composition of the biomass in the four conditions used in the present study.
240 g L-1 Glucose 280 g L-1 Glucose
16 °C 28 °C 16 °C 28 °CTotal proteins (g gDW-1) 0.52 ± 0.07 0.49 ± 0.06 0.51 ± 0.07 0.41 ± 0.06Total carbohydrates (g gDW-1) 0.30 ± 0.04 0.28 ± 0.03 0.35 ± 0.04 0.26 ± 0.03Carbohydrates/Proteins (g g-1) 0.58 ± 0.1 0.57 ± 0.1 0.69 ± 0.12 0.62 ± 0.12Ash (g gDW-1) 0.060 ± 0.003 0.060 ± 0.003 0.080 ± 0.004 0.097 ± 0.005Unit C Formulaea CH1.604N0.209O0.488 CH1.600N0.207O0.488 CH1.612N0.203O0.503 CH1.612N0.201O0.471
Protein C Formulaeb CH1.612N0.297O0.303S0.005 CH1.618N0.308O0.297S0.005 CH1.614N0.307O0.296S0.005 CH1.615N0.309O0.296S0.005
a Calculated from biomass elemental analysis; b Calculated from the amino acidic analysis of cell protein. The Unit C Formulae used for lipids, carbohydrate and nucleicacids were taken from Kocková-Kratochvílová [53]. Significant differences were not found between conditions (p < 0.05).
MFA of S. cerevisiae in Wine Fermentations
PLOS ONE | www.plosone.org 7 August 2013 | Volume 8 | Issue 8 | e71909
Metabolic flux analysisThe stoichiometric model used in this work is described in
the Materials and methods section. Besides the given details,additional particularities should be noted. Although a grapemust is being mimicked, glucose has been used as the onlycarbon source. A previous characterization of batch culturesusing equimolar amounts of glucose and fructose showed thatfructose uptake was much lower than glucose consumptionduring yeast exponential growth phase (data not shown). Forthis reason, and to improve the accuracy in the determinationof sugar uptake, we decided to use glucose as the sole carbonsource.
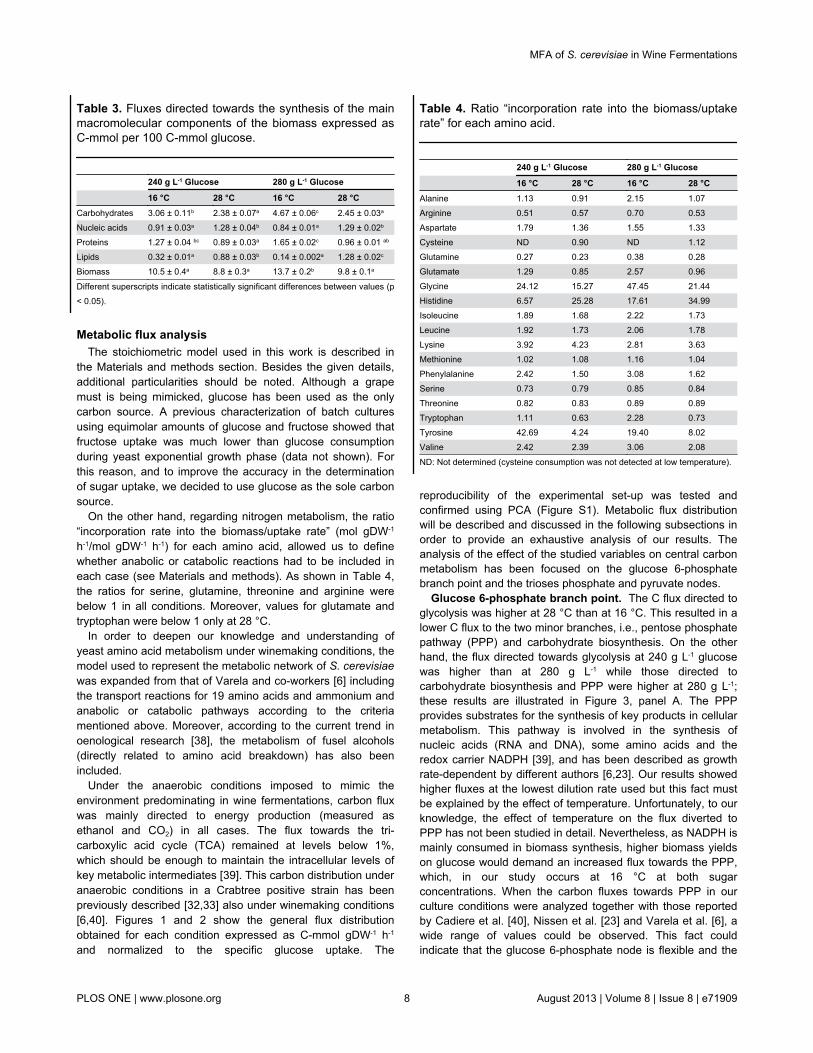
On the other hand, regarding nitrogen metabolism, the ratio“incorporation rate into the biomass/uptake rate” (mol gDW-1
h-1/mol gDW-1 h-1) for each amino acid, allowed us to definewhether anabolic or catabolic reactions had to be included ineach case (see Materials and methods). As shown in Table 4,the ratios for serine, glutamine, threonine and arginine werebelow 1 in all conditions. Moreover, values for glutamate andtryptophan were below 1 only at 28 °C.
In order to deepen our knowledge and understanding ofyeast amino acid metabolism under winemaking conditions, themodel used to represent the metabolic network of S. cerevisiaewas expanded from that of Varela and co-workers [6] includingthe transport reactions for 19 amino acids and ammonium andanabolic or catabolic pathways according to the criteriamentioned above. Moreover, according to the current trend inoenological research [38], the metabolism of fusel alcohols(directly related to amino acid breakdown) has also beenincluded.
Under the anaerobic conditions imposed to mimic theenvironment predominating in wine fermentations, carbon fluxwas mainly directed to energy production (measured asethanol and CO2) in all cases. The flux towards the tri-carboxylic acid cycle (TCA) remained at levels below 1%,which should be enough to maintain the intracellular levels ofkey metabolic intermediates [39]. This carbon distribution underanaerobic conditions in a Crabtree positive strain has beenpreviously described [32,33] also under winemaking conditions[6,40]. Figures 1 and 2 show the general flux distributionobtained for each condition expressed as C-mmol gDW-1 h-1
and normalized to the specific glucose uptake. The
Table 3. Fluxes directed towards the synthesis of the mainmacromolecular components of the biomass expressed asC-mmol per 100 C-mmol glucose.
240 g L-1 Glucose 280 g L-1 Glucose
16 °C 28 °C 16 °C 28 °CCarbohydrates 3.06 ± 0.11b 2.38 ± 0.07a 4.67 ± 0.06c 2.45 ± 0.03a
Nucleic acids 0.91 ± 0.03a 1.28 ± 0.04b 0.84 ± 0.01a 1.29 ± 0.02b
Proteins 1.27 ± 0.04 bc 0.89 ± 0.03a 1.65 ± 0.02c 0.96 ± 0.01 ab
Lipids 0.32 ± 0.01a 0.88 ± 0.03b 0.14 ± 0.002a 1.28 ± 0.02c
Biomass 10.5 ± 0.4a 8.8 ± 0.3a 13.7 ± 0.2b 9.8 ± 0.1a
Different superscripts indicate statistically significant differences between values (p< 0.05).
reproducibility of the experimental set-up was tested andconfirmed using PCA (Figure S1). Metabolic flux distributionwill be described and discussed in the following subsections inorder to provide an exhaustive analysis of our results. Theanalysis of the effect of the studied variables on central carbonmetabolism has been focused on the glucose 6-phosphatebranch point and the trioses phosphate and pyruvate nodes.
Glucose 6-phosphate branch point. The C flux directed toglycolysis was higher at 28 °C than at 16 °C. This resulted in alower C flux to the two minor branches, i.e., pentose phosphatepathway (PPP) and carbohydrate biosynthesis. On the otherhand, the flux directed towards glycolysis at 240 g L-1 glucosewas higher than at 280 g L-1 while those directed tocarbohydrate biosynthesis and PPP were higher at 280 g L-1;these results are illustrated in Figure 3, panel A. The PPPprovides substrates for the synthesis of key products in cellularmetabolism. This pathway is involved in the synthesis ofnucleic acids (RNA and DNA), some amino acids and theredox carrier NADPH [39], and has been described as growthrate-dependent by different authors [6,23]. Our results showedhigher fluxes at the lowest dilution rate used but this fact mustbe explained by the effect of temperature. Unfortunately, to ourknowledge, the effect of temperature on the flux diverted toPPP has not been studied in detail. Nevertheless, as NADPH ismainly consumed in biomass synthesis, higher biomass yieldson glucose would demand an increased flux towards the PPP,which, in our study occurs at 16 °C at both sugarconcentrations. When the carbon fluxes towards PPP in ourculture conditions were analyzed together with those reportedby Cadiere et al. [40], Nissen et al. [23] and Varela et al. [6], awide range of values could be observed. This fact couldindicate that the glucose 6-phosphate node is flexible and the
Table 4. Ratio “incorporation rate into the biomass/uptakerate” for each amino acid.
240 g L-1 Glucose 280 g L-1 Glucose
16 °C 28 °C 16 °C 28 °CAlanine 1.13 0.91 2.15 1.07Arginine 0.51 0.57 0.70 0.53Aspartate 1.79 1.36 1.55 1.33Cysteine ND 0.90 ND 1.12Glutamine 0.27 0.23 0.38 0.28Glutamate 1.29 0.85 2.57 0.96Glycine 24.12 15.27 47.45 21.44Histidine 6.57 25.28 17.61 34.99Isoleucine 1.89 1.68 2.22 1.73Leucine 1.92 1.73 2.06 1.78Lysine 3.92 4.23 2.81 3.63Methionine 1.02 1.08 1.16 1.04Phenylalanine 2.42 1.50 3.08 1.62Serine 0.73 0.79 0.85 0.84Threonine 0.82 0.83 0.89 0.89Tryptophan 1.11 0.63 2.28 0.73Tyrosine 42.69 4.24 19.40 8.02Valine 2.42 2.39 3.06 2.08
ND: Not determined (cysteine consumption was not detected at low temperature).
MFA of S. cerevisiae in Wine Fermentations
PLOS ONE | www.plosone.org 8 August 2013 | Volume 8 | Issue 8 | e71909

flux could be easily modulated depending on cell requirements,at least under anaerobic conditions.
The flux in the remaining branch of this node is directedtowards carbohydrate biosynthesis. Following the same trendobserved for the PPP, higher fluxes were calculated at 16 °Ccompared to 28 °C and at 280 g L-1 glucose compared to 240 gL-1.
As our work focuses on exponentially growing cells anddespite the osmotic pressure imposed by high sugarconcentrations, the carbon flux directed towards this branch isexpected to be destined to structural (mainly glucans andmannoproteins) rather than to reserve carbohydrates (glycogenand trehalose) [6,21,41], as recently observed for Pichiapastoris [16] and S. cerevisiae [18]. Higher fluxes directedtowards biomass synthesis were also observed at 16 °Ccompared to 28 °C and at 280 g L-1 of glucose compared to240 g L-1, which would therefore require a higher demand forstructural components.
Trioses phosphate node. Carbon fate at this branch pointwas mainly glycolysis in all conditions. However, slightdifferences were observed depending on the conditionsstudied. In this way, the glycolytic flux (always accounting formore than 93%) was higher at 16 °C than at 28 °C while theflux towards glycerol was higher at 28 °C. Regarding the sugar
concentration effect, the glycolytic flux was higher at 240 g L-1
glucose while that directed to glycerol biosynthesis was higherat 280 g L-1 (Figure 3, panel B).
Glycerol has been often referred to as a “secondarymetabolite” in wine fermentation due to its lower concentrationin wine when compared to ethanol. However, glycerol is not“secondary” from a metabolic point of view. Synthesis of thiscompound plays a major role during anaerobic growth,providing precursors for the synthesis of phospholipids,protecting yeast from high osmotic pressure (caused by highsugar concentrations found in winemaking) and maintainingcell redox balance [42,43]. However, the analysis of the effectof redox balance in the fluxes towards glycerol wastroublesome, mainly due to the interconnection of redoxbalance and nitrogen metabolism [34,36,44]. We can stillhypothesize that the lower flux towards glycerol production at16 °C could be partly explained by the higher uptake of aminoacids at this temperature as described below. The uptake andmetabolism of amino acids present in the medium involved ahigher consumption of NADH, and thereby, lower fluxestowards glycerol formation are needed to compensate redoxbalance. As the glycerol present in wine is mainly producedduring the first stages of fermentation, when yeast growth takesplace, this lower carbon flux towards glycerol formation at 16
Figure 3. Flux distribution at different nodes. A) Glucose 6-P branch point; B) Trioses phosphate node; C) Pyruvate branchpoint.PPP: Pentose phosphate pathway; DHAP: Di-hydroxy-acetone phosphate; GA3P: Glyceraldehyde 3-phosphate; BCAA: Brain-chainamino acids; TCA: Tri-carboxylic acid cycle; ACAL: Acetaldehyde. Boxes in light colours indicate 240 g of g L-1 glucose. Boxes indark colours indicate 280 g L-1 glucose. Blue indicates 16 °C. Red indicates 28 °C.doi: 10.1371/journal.pone.0071909.g003
MFA of S. cerevisiae in Wine Fermentations
PLOS ONE | www.plosone.org 9 August 2013 | Volume 8 | Issue 8 | e71909

°C could be partly responsible for the lower concentrations ofthis metabolite found by the end of wine batch fermentationscarried out in our laboratory when compared to 28 °C (data notshown). Supporting this finding, Gamero et al. [45] have alsorecently reported lower glycerol concentrations by the end ofbatch fermentations performed using several S. cerevisiaestrains at 12 °C compared to 28 °C.
The C flux towards acetic acid production was also higher at280 g L-1 glucose and was always accompanied by higherfluxes towards glycerol. This fact could be explained throughredox balance, as the excretion of 1 mol of acetate involves thesynthesis of 2 moles of NADH [37]. Additionally, higher C fluxtowards glycerol biosynthesis at 280 g L-1 glucose, irrespectiveof temperature, could be due to the increase in osmoticpressure.
The synthesis of lactic acid represents the remainingpathway at this node. Under anaerobic conditions, lactic acid issynthesized from dihydroxyacetone phosphate by themethylglyoxal bypass. This pathway has always beendescribed as functional at very low rates and under ‘overflowmetabolism’ conditions [32]. Our results showed small amountsof lactic acid at 28 °C (45 and 15 mg L-1, for 240 and 280 g L-1
of glucose, respectively) and concentrations below thedetection limit (5 mg L-1) in the cultures performed at 16 °C.Low levels of lactic acid are still likely to be produced at 16 °Cas all the conditions studied implied overflow metabolismthrough glycolysis (Figure 3, panel B).
Pyruvate branch point. The pyruvate node represents oneof the most important regulation points in carbon metabolismand the key to energy production [32]. In this way, carbon caneither follow catabolic reactions (acetaldehyde production andTCA cycle) or anabolic pathways (oxaloacetic acid production(OAA) and amino acid biosynthesis). The fate of pyruvate tobranched chain amino acid (BCAA) will be thoroughlydescribed in a following subsection.
In all cases, the C flux from pyruvate was mainly derivedtowards the formation of acetaldehyde, oscillating in a verynarrow range from 96.4 to 97.0%. Notably, the carbon flux toTCA was reduced in about 30% at 16 °C compared to 28 °C,regardless of sugar concentration. On the other hand, the fluxtowards OAA was not severely affected by the variablesstudied (Figure 3, panel C).
Around 99% of the C flux diverted to acetaldehyde was usedin the concomitant production of energy, CO2 and ethanol. Therest of the flux was directed to the production of acetic acid. Aclear effect of sugar concentration was observed in itsproduction, being higher at 280 g L-1 glucose. The increase inthe flux oscillated between 20% and 30% at 16 and 28 °C,respectively (Figure 3, panel C).
In general, the metabolic flux distribution calculated at thisbranch point in our work agrees with that proposed by otherauthors under anaerobic conditions [6,23,25,40]. Thesesimilarities could indicate the tight regulation of this node underanaerobic conditions, contrary to that observed at the glucose6-phosphate node. The slight differences found in the splitacetaldehyde/TCA cycle could be related to growth rate ascells were growing faster at 28 °C and, in consequence,
demanding higher amounts of building-blocks from the TCAcycle.
Nitrogen metabolism. Simultaneous uptake of ammoniumand amino acids was observed in all of the conditions studied.Analyzing data obtained in the control condition (240 g L-1
glucose at 28 °C), amino acids could be differentially groupedaccording to the percentage of consumption in the steadystates (Table S2). Thus, while the consumption of lysineaccounted for 98.2% of its original amount in the feed, theconsumption of several amino acids such as alanine,tryptophan or tyrosine, and ammonium was below 40%. Otheramino acids such as arginine, aspartic and glutamic acid,serine, glutamine, threonine, methionine, leucine, isoleucineand phenylalanine presented intermediate consumptionpercentages, ranging from 40 to 80%. Our results provideadditional information to previously reported data obtainedusing both winemaking conditions [46,47] and synthetic mediawith a complex mixture of nitrogen sources [36,48]. A recentstudy [49] has furthered the understanding of the co-consumption of organic and inorganic nitrogen sources andexplained it based on the kinetic characteristics of transportersas well as nitrogen catabolite repression (NCR) and Ssy1p-Ptr3p-Ssy5 (SPS)-mediated control, and allowed theclassification of the different nitrogen sources according to theirorder of consumption (Table S2).
When the consumption of amino acids was analyzed in thethree remaining conditions, it was observed to be stronglyaffected both by sugar concentration, with all cases higher at240 g L-1 glucose than at 280 g L-1 at both temperatures studied(except for tyrosine at 16 °C), and by temperature and dilutionrate, with all cases higher at 28 °C than at 16 °C (Table S2).However, it is interesting to point out that the intensity of theeffect exerted by these parameters clearly differed amongamino acids (their consumption did not increase or decrease tothe same extent). Interestingly, these differences did not seemto affect the amino acid composition of the cellular protein(Table S3) and, consequently, the C formulae of the proteindetermined for each condition (Table 2). The similarity in theamino acidic composition of cell proteins grown in differentconditions is consistent with data reported in literature and haseven been observed for S. cerevisiae cells grown on threedifferent nitrogen sources [36].
Temperature and dilution rate exerted a clear effect onnitrogen metabolism while that of sugar concentration wasnegligible. Table 5 (panel A) shows the uptake of organic andinorganic nitrogen sources, expressed as N-mmol gDW-1 h-1.Regardless of sugar concentration, an approximate 2.4 foldincrease in the total nitrogen uptake was observed at 28 °C (D= 0.25 h-1) compared to 16 °C (D = 0.1 h-1). This data is inaccordance with a previous study performed in nitrogen limitedanaerobic cultures of S. cerevisiae, which demonstrated theexistence of a linear relationship between dilution rate andammonium uptake rate [37]. However, due to the differentialglucose uptake observed between conditions, the amount ofnitrogen incorporated per C unit was higher at 16 °C (D = 0.1h-1) than at 28 °C (Table 5, panel B) although not significantlydifferent. In all cases, nitrogen was mostly incorporated in theform of amino acids. However, the organic/inorganic nitrogen
MFA of S. cerevisiae in Wine Fermentations
PLOS ONE | www.plosone.org 10 August 2013 | Volume 8 | Issue 8 | e71909

ratio changed with growth temperature. While ammoniumrepresented 37-38% of the total N incorporated at 28 °C and D= 0.25 h-1, this percentage significantly dropped toapproximately 15.5-18.5% at 16 °C and D = 0.1 h-1 (Table 5,panel C). This result could be explained by an alleviation ofNCR observed at low temperatures and deduced from theexpression of genes coding for ammonium and amino acidpermeases (MEP2 and GAP1) observed by other authors [50].
Considering amino acids individually, it is worth mentioningthat arginine, alanine and glutamine account for approximately60% of the total organic nitrogen incorporated (approx. 40, 10and 10%, respectively). Aspartic acid, serine and threoninerepresented approximately 19%, individually accounting foraround 6-7%. Another group formed by glutamic acid,
Table 5. Key physiological parameters related to nitrogenmetabolism: uptake rate of organic and inorganic nitrogensources expressed as N-mmol gDW-1 h-1; incorporation oftotal, organic and inorganic nitrogen normalized by glucoseuptake (N-mmol C-mol-1 Glucose); percentage of organicand inorganic nitrogen incorporated; contribution of eachamino acid (in percentage) to the incorporation of organicnitrogen.
240 g L-1 Glucose 280 g L-1 Glucose
N-mmol gDW-1 h-1 16 °C 28 °C 16 °C 28 °CTotal 0.70 ± 0.01a 1.74 ± 0.05b 0.70 ± 0.01a 1.58 ± 0.04b
Organic 0.57 ± 0.01a 1.09 ± 0.02b 0.59 ± 0.01a 0.98 ± 0.02b
Inorganic 0.13 ± 0.01a 0.64 ± 0.02b 0.11 ± 0.01a 0.60 ± 0.03b
N-mmol C-mol-1 Glucose Total 24.0 ± 0.6 19.9 ± 2.1 30.2 ± 1.5 21.5 ± 1.6Organic 19.5 ± 0.5 12.6 ± 1.4 25.5 ± 1.3 13.3 ± 1.0Inorganic 4.5 ± 0.3 7.4 ± 0.8 4.7 ± 0.5 8.2 ± 0.7
% of N incorporated Organic 81.3 ± 1.84a 63.0 ± 1.87b 84.4 ± 2.13a 61.9 ± 2.02b
Inorganic 18.7 ± 1.45a 37.0 ± 1.44b 15.6 ± 1.56a 38.1 ± 2.13b
Amino acid contribution to organic N uptake (%) Alanine 10.7 10.0 10.6 9.2Arginine 36.7 41.9 37.8 42.2Aspartate 4.9 6.2 5.5 6.7Cysteine 0.4 1.2 0.3 1.0Glutamine 14.3 6.6 15.1 6.3Glutamate 2.2 3.3 1.1 3.2Glycine 0.5 0.5 0.5 0.4Histidine 0.3 0.1 0.1 0.2Isoleucine 2.0 2.3 1.7 2.3Leucine 3.6 3.7 3.5 3.8Lysine 3.4 3.1 4.4 3.8Methionine 1.6 1.7 1.3 1.7Phenylalanine 1.3 1.9 1.1 1.9Serine 8.1 7.1 7.7 7.0Threonine 6.2 6.0 5.6 5.9Tryptophan 1.2 1.6 1.1 1.2Tyrosine 0.3 0.5 0.2 0.3Valine 2.5 2.3 2.2 2.7
Different superscripts indicate statistically significant differences between values (p< 0.05).
isoleucine, leucine, lysine, methionine, phenylalanine,tryptophan and valine accounted for around 19% of the totalorganic nitrogen incorporated, each of them never representingmore than 4%. The individual contribution of the remainingamino acids never exceeded 1%. Detailed data are shown inTable 5, panel D.
It should be highlighted that the individual contribution ofamino acids to the total nitrogen uptake differed betweenconditions. While the contribution of glutamine increased at lowtemperature, that of glutamic acid decreased (for more details,see Table 5, panel D). Overall, when the total amount ofnitrogen incorporated per gram of biomass (N-mmol gDW-1)was analyzed, significantly higher values were obtained for thecontinuous cultures performed at 16 °C at both sugarconcentrations. This implies that the biomass yield on nitrogen(gDW N-mmol-1) in a synthetic medium mimicking grape mustdecreases at low temperatures as had previously beenreported for the industrial strain CEN.PK 113-7D and EC1118in a medium that only presented inorganic nitrogen sources[21]. As commented in a previous section, it is important topoint out that this differential consumption of organic andinorganic nitrogen sources exerts an effect on the cell redoxbalance and, consequently, on the production of glycerol.
These results support the data presented by other authors[50] and indicate that the quantity and quality of yeast nitrogenrequirements during the exponential growth phase are not thesame at optimum and low temperatures. Improved nitrogensupplementations (for, for example, white wine fermentations)could be formulated on the basis of these findings. Indeed,Martinez-Moreno et al. [51] have already demonstrated thedifferential effect of organic nitrogen sources on biomassformation, yeast vitality and fermentation kinetics.
Metabolism of fusel alcohols and their amino acidicprecursors. Fusel alcohols produced by yeast during winefermentation have a strong impact on the sensorial propertiesof the final product [38]. For this reason and for the first time,five of the most relevant fusel alcohols (i.e., isoamyl alcohol,active amyl alcohol, phenyl 2-ethanol, n-propanol andisobutanol) have been analyzed and included in astoichiometric model. These compounds derive both from thecatabolism of different amino acids (leucine, isoleucine,phenylalanine, threonine and valine, respectively) and/oranabolic pathways from pyruvate [43]. As discussed above, thetotal amount of nitrogen supplied by these five amino acidsaccounts for 15.6% in the conditions studied, with threonine themost prevalent (Table 5, panel D). It should be noted that therelative contribution of these amino acids to the organic fractionof nitrogen incorporated, except for phenylalanine, was verystable between all conditions studied.
The production of each of these fusel alcohols normalized totheir amino acidic precursor is shown in Table 6. In general, theamount of fusel alcohol produced could be explained based onthe catabolism of each of its amino acidic precursors. However,it is interesting to point out the cases of isoamyl alcohol andisobutanol production. Regardless of the condition studied,both fusel alcohols demand a higher amount of amino acidicprecursors for their synthesis than that provided by the uptakefrom the medium. In fact, coefficients higher than 1.0 (Table 6)
MFA of S. cerevisiae in Wine Fermentations
PLOS ONE | www.plosone.org 11 August 2013 | Volume 8 | Issue 8 | e71909

indicate that their synthesis could not be supported exclusivelyfrom the amino acids present in the medium (leucine andvaline, respectively) at 240 g L-1 glucose and 28 °C. Taking intoaccount the data obtained for the rest of the fusel alcoholsincluded in this study and the fate of exogenous amino acidsinside the cells observed by Crépin [52], we could hypothesizethat the anabolic pathways involved in the synthesis of fuselalcohols are also active during the yeast exponential growthphase in all conditions studied. Additionally, this fact issupported by the results provided by our stoichiometric model.
The production of fusel alcohols normalized per gram ofbiomass (C-mmol gDW-1) was significantly higher in allcontinuous cultures performed at 28 °C (D = 0.25 h-1)compared to those performed at 16 °C. An effect of sugarconcentration was also observed, with higher effects at 240 gL-1 glucose than at 280 g L-1 at the two temperatures assayed.These findings could also be partly explained as a result of theredox balance in the cell. As in the case of glycerol, thebiosynthesis of these compounds could contribute to theregeneration of the NAD+.
Conclusions
In this work, metabolic flux analysis has been applied tostudy the physiology of S. cerevisiae during the exponentialgrowth phase in a winemaking process using two differentsugar concentrations at two different fermentationtemperatures. The stoichiometric model proposed in thepresent paper represents an extension of that described byVarela and co-workers [6] incorporating the synthesis andrelease of aroma compounds and represents the mostcomplete stoichiometric model used to study yeast metabolismin winemaking thus far. Clear differences have been found inconsumption and production rates of the main metabolitesanalyzed in the study depending mainly on temperature anddilution rate (Table S1). Despite these differences, thedistribution of carbon fluxes did not change drastically when thefour conditions were compared, likely due to the similarities inthe stress factors employed in all cases (high sugar and lownitrogen content). However, results obtained have shown thatthe variables studied (temperature and sugar concentration)exerted a higher effect on the pentose phosphate pathway andglycerol formation than on glycolysis and ethanol production.On the other hand, nitrogen metabolism was strongly affected
Table 6. Production of fusel alcohols expressed as C-mmolper C-mmol of amino acid precursor transported into thecell.
240 g L-1 Glucose 280 g L-1 Glucose
16 °C 28 °C 16 °C 28 °CAmyl alcohol / Isoleucine 0.37 0.70 0.38 0.54Propanol / Threonine 0.35 0.57 0.31 0.67Isoamyl alcohol / Leucine 0.55 1.08 0.47 0.92Isobutanol / Valine 0.37 1.86 0.42 0.83Phenyl ethanol / Phenylalanine 0.19 0.34 0.20 0.30
by the growth conditions studied. Specifically, clear differencesin the uptake of organic and inorganic nitrogen sources wereobserved. These findings could be employed in the design ofoptimal supplementation strategies of musts containing lowinitial nitrogen content in order to avoid stuck of sluggishfermentations. Furthermore, the reported data support thesimultaneous operation of anabolic and catabolic pathwaysinvolved in the synthesis of fusel alcohols. Additional studiesare being carried out in the remaining phases of fermentation inorder to contribute to the understanding of the impact ofnitrogen additions on fermentation kinetics and theimprovement of the aroma profile of the resulting wines.
Supporting Information
Figure S1. PCA performed to verify the reproducibility of thesteady states obtained for each condition. These twocomponents explained 87.6% of the variance.(TIF)
Appendix S1. Biochemical reactions included in thestoichiometric model.(DOCX)
Table S1. Measured consumption/production rates of thedifferent metabolites analyzed in the study. sd valuescorrespond to the standard deviation of the average valuemeasured in two independent biological replicates.Consumption rates are indicated with a minus sign. ND: Notdetected in the analysis.(DOC)
Table S2. Percentage of consumption of each amino acid inthe steady states of each condition ((mg L-1 in the steady state/mg L-1 in the feed)·100). Code: colour values given according tothe classification proposed by Crépin et al. [49]. Pink:prematurely consumed; Green: early consumed; Blue: lateconsumed. Those amino acids left in white were not classifiedby the authors; n.d.: not determined.(DOCX)
Table S3. Molar fraction of amino acids present in proteins.aNot properly quantified in the analysis. Data from taken fromLange and Heijnen [18]. Asx: Asn + Asp; Glx: Gln + Glu.(DOCX)
Acknowledgements
The authors would like to thank Cristina Juez Ojeda for theanalytical work using HPLC, Miguel Ángel Fernández Recio forthe determination of volatile compounds using GC-MS andTara Negrave for kindly revising the English grammar and styleon this manuscript.
Author Contributions
Conceived and designed the experiments: MQ RM-M JA PMPF RG. Performed the experiments: MQ RM-M PM FV-L AB.
MFA of S. cerevisiae in Wine Fermentations
PLOS ONE | www.plosone.org 12 August 2013 | Volume 8 | Issue 8 | e71909

Analyzed the data: MQ RM-M JA. Contributed reagents/materials/analysis tools: PM PF RG. Wrote the manuscript: MQRM-M PM RG.
References
1. Grassl H (2011) Climate Change Challenges. Surv Geophys 32:319-328. doi:10.1007/s10712-011-9129-z.
2. Mira de Orduña R (2010) Climate change associated effects on grapeand wine quality and production. Food Res Int 43: 1844-1855. doi:10.1016/j.foodres.2010.05.001.
3. Jones G, White M, Cooper O, Storchmann K (2005) Climate Changeand Global Wine Quality. Clim Change 73: 319-343. doi:10.1007/s10584-005-4704-2.
4. Erasmus DJ, Cliff M, van Vuuren HJJ (2004) Impact of yeast strain onthe production of acetic acid, glycerol, and the sensory attributes oficewine. Am J Enol Viticulture 55: 371-378.
5. Pigeau GM, Inglis DL (2005) Upregulation of ALD3 and GPD1 inSaccharomyces cerevisiae during Icewine fermentation. J ApplMicrobiol 99: 112-125. doi:10.1111/j.1365-2672.2005.02577.x.PubMed: 15960671.
6. Varela C, Pizarro F, Agosin E (2004) Biomass content governsfermentation rate in nitrogen-deficient wine musts. Appl EnvironMicrobiol 70: 3392-3400. doi:10.1128/AEM.70.6.3392-3400.2004.PubMed: 15184136.
7. Vargas FA, Pizarro F, Pérez-Correa JR, Agosin E (2011) Expanding adynamic flux balance model of yeast fermentation to genome-scale.BMC Systems Biol 5: 75. doi:10.1186/1752-0509-5-75. PubMed:21595919.
8. Clement T, Perez M, Mouret JR, Sablayrolles JM, Camarasa C (2011)Use of a continuous multistage bioreactor to mimic winemakingfermentation. Int J Food Microbiol 150: 42-49. doi:10.1016/j.ijfoodmicro.2011.07.016. PubMed: 21839532.
9. Barreiro-Vázquez A, Adelantado N, Vázquez-Lima F, Gonzalez R,Albiol J et al. (2010) Investigating the use of chemostat culturesmimicking different phases of winemaking fermentations as a tool forphysiological analysis and modeling. 4th Conference on Physiology ofYeast and Filamentous Fungi. Rotterdam, The Netherlands.
10. Hoskisson PA, Hobbs G (2005) Continuous culture - making acomeback? MicrobiolSGM 151: 3153-3159.
11. Bely M, Sablayrolles JM, Barre P (1990) Automatic detection ofassimilable nitrogen deficiencies during alcoholic fermentation inoenological conditions. J Ferment Bioeng 70: 246-252. doi:10.1016/0922-338X(90)90057-4.
12. Quirós M, Gonzalez-Ramos D, Tabera L, Gonzalez R (2010) A newmethodology to obtain wine yeast strains overproducingmannoproteins. Int J Food Microbiol 139: 9-14. doi:10.1016/j.ijfoodmicro.2010.02.014. PubMed: 20219260.
13. Gómez-Alonso S, Hermosín-Gutiérrez I, García-Romero E (2007)Simultaneous HPLC analysis of biogenic amines, amino acids, andammonium ion as aminoenone derivatives in wine and beer samples. JAgric Food Chem 55: 608-613. doi:10.1021/jf062820m. PubMed:17263449.
14. Pozo-Bayón MA, Pueyo E, Martín-Alvarez PJ, Polo MC (2001)Polydimethylsiloxane solid-phase microextraction-gas chromatographymethod for the analysis of volatile compounds in wines - Its applicationto the characterization of varietal wines. J Chromatogr A 922: 267-275.doi:10.1016/S0021-9673(01)00966-9. PubMed: 11486872.
15. Segarra I, Lao C, López-Tamames E, De La Torre-Boronat MC (1995)Spectrophotometric methods for the analysis of polysaccharide levelsin winemaking products. Am J Enol Viticulture 46: 564-570.
16. Carnicer M, Baumann K, Töplitz I, Sánchez-Ferrando F, Mattanovich Det al. (2009) Macromolecular and elemental composition analysis andextracellular metabolite balances of Pichia pastoris growing at differentoxygen levels. Microb Cell Factories 8: 65. doi:10.1186/1475-2859-8-65. PubMed: 20003217.
17. Wang NS, Stephanopoulos G (1983) Application of macroscopicbalances to the identification of gross measurement errors. BiotechnolBioeng 25: 2177-2208. doi:10.1002/bit.260250906. PubMed:18574815.
18. Lange HC, Heijnen JJ (2001) Statistical reconciliation of the elementaland molecular biomass composition of Saccharomyces cerevisiae.Biotechnol Bioeng 75: 334-344. doi:10.1002/bit.10054. PubMed:11590606.
19. Ingledew WM, Magnus CA, Sosulski FW (1987) Influence of oxygen onproline utilization during the wine fermentation. Am J Enol Viticulture38: 246-248.
20. Klamt S, Saez-Rodriguez J, Gilles ED (2007) Structural and functionalanalysis of cellular networks with CellNetAnalyzer. BMC Systems Biol1: 2. doi:10.1186/1752-0509-1-2. PubMed: 17408509.
21. Pizarro FJ, Jewett MC, Nielsen J, Agosin E (2008) Growth temperatureexerts differential physiological and transcriptional responses inlaboratory and wine strains of Saccharomyces cerevisiae. Appl EnvironMicrobiol 74: 6358-6368. doi:10.1128/AEM.00602-08. PubMed:18723660.
22. Ribéreau-Gayon P, Dubourdieu D, Donèche B, Lanvaud A (2004)Traité d’oenologie. Microbiologie du vin: Vinification. Paris: La vigne.
23. Nissen TL, Schulze U, Nielsen J, Villadsen J (1997) Flux distributions inanaerobic, glucose-limited continuous cultures of Saccharomycescerevisiae. Microbiology-UK 143: 203-218. doi:10.1099/00221287-143-1-203. PubMed: 9025295.
24. Tai SL, Daran-Lapujade P, Walsh MC, Pronk JT, Daran JM (2007)Acclimation of Saccharomyces cerevisiae to low temperature: Achemostat-based transcriptome analysis. Mol Biol Cell 18: 5100-5112.doi:10.1091/mbc.E07-02-0131. PubMed: 17928405.
25. Yu Z, Zhao H, Zhao M, Lei H, Li H (2012) Metabolic flux and nodescontrol analysis of brewer’s yeasts under different fermentationtemperature during beer brewing. Appl Biochem Biotechnol 168:1938-1952. doi:10.1007/s12010-012-9909-z. PubMed: 23065402.
26. Regenberg B, Grotkjaer T, Winther O, Fausbøll A, Akesson M et al.(2006) Growth-rate regulated genes have profound impact oninterpretation of transcriptome profiling in Saccharomyces cerevisiae.Genome Biol 7: R107. doi:10.1186/gb-2006-7-4-107. PubMed:17105650.
27. Boender LGM, de Hulster EAF, van Maris AJA, Daran-Lapujade PAS,Pronk JT (2009) Quantitative Physiology of Saccharomyces cerevisiaeat near-zero specific growth rates. Appl Environ Microbiol 75:5607-5614. doi:10.1128/AEM.00429-09. PubMed: 19592533.
28. Beltran G, Novo M, Leberre V, Sokol S, Labourdette D et al. (2006)Integration of transcriptomic and metabolic analyses for understandingthe global responses of low-temperature winemaking fermentations.FEMS Yeast Res 6: 1167-1183. doi:10.1111/j.1567-1364.2006.00106.x. PubMed: 17156014.
29. Murata Y, Homma T, Kitagawa E, Momose Y, Sato MS et al. (2006)Genome-wide expression analysis of yeast response during exposureto 4 degrees C. Extremophiles 10: 117-128. doi:10.1007/s00792-005-0480-1. PubMed: 16254683.
30. Sahara T, Goda T, Ohgiya S (2002) Comprehensive expressionanalysis of time-dependent genetic responses in yeast cells to lowtemperature. J Biol Chem 277: 50015-50021. doi:10.1074/jbc.M209258200. PubMed: 12379644.
31. Schade B, Jansen G, Whiteway M, Entian KD, Thomas DY (2004) Coldadaptation in budding yeast. Mol Biol Cell 15: 5492-5502. doi:10.1091/mbc.E04-03-0167. PubMed: 15483057.
32. Pronk JT, Steensma HY, van Dijken JP (1996) Pyruvate metabolism inSaccharomyces cerevisiae. Yeast 12: 1607-1633. doi:10.1002/(SICI)1097-0061(199612)12:16. PubMed: 9123965.
33. Rodrigues F, Ludovico P, Leão C (2006) Sugar metabolism in yeasts:an overview of aerobic and anaerobic glucose catabolism. In: G PéterCRosa. Biodiversity and Ecophysiology of Yeasts. Berlin Heidelberg:Springer Verlag. pp. 101-121.
34. Jain VK, Divol B, Prior BA, Bauer FF (2012) Effect of alternativeNAD(+)-regenerating pathways on the formation of primary andsecondary aroma compounds in a Saccharomyces cerevisiae glycerol-defective mutant. Appl Microbiol Biotechnol 93: 131-141. doi:10.1007/s00253-011-3431-z. PubMed: 21720823.
35. Overkamp K (2002) Mitochondrial oxidation of cytosolic NADH in yeast:physiological analysis and metabolic engineering. PhD Thesis, DelftUniversity of Technology. Delft, The Netherlands
36. Albers E, Larsson C, Lidén G, Niklasson C, Gustafsson L (1996)Influence of the nitrogen source on Saccharomyces cerevisiaeanaerobic growth and product formation. Appl Environ Microbiol 62:3187-3195. PubMed: 8795209.
37. Schulze U, Lidén G, Nielsen J, Villadsen J (1996) Physiological effectsof nitrogen starvation in an anaerobic batch culture of Saccharomycescerevisiae. Microbiology-UK 142: 2299-2310. doi:10.1099/13500872-142-8-2299.
MFA of S. cerevisiae in Wine Fermentations
PLOS ONE | www.plosone.org 13 August 2013 | Volume 8 | Issue 8 | e71909

38. Charnomordic B, David R, Dochain D, Hilgert N, Mouret JR et al.(2010) Two modelling approaches of winemaking: first principle andmetabolic engineering. Math Computer Modelling Dynamical Systems16: 535-553. doi:10.1080/13873954.2010.514701.
39. Villadsen J, Nielsen J, Lidén G (2011) Chemicals from metabolicpathways. Bioreaction Eng Princ Springer US: 7-62.
40. Cadière A, Ortiz-Julien A, Camarasa C, Dequin S (2011) Evolutionaryengineered Saccharomyces cerevisiae wine yeast strains withincreased in vivo flux through the pentose phosphate pathway. MetabEng 13: 263-271. doi:10.1016/j.ymben.2011.01.008. PubMed:21300171.
41. Albers E, Gustafsson L, Niklasson C, Lidén G (1998) Distribution ofC-14-labelled carbon from glucose and glutamate during anaerobicgrowth of Saccharomyces cerevisiae. Microbiology-UK 144:1683-1690. doi:10.1099/00221287-144-6-1683.
42. Reijenga K (2002) Dynamic control of yeast glycolysis. Amsterdam,The Nederlands. Amsterdam: Vrije Universiteit.
43. Swiegers JH, Bartowsky EJ, Henschke PA, Pretorius IS (2005) Yeastand bacterial modulation of wine aroma and flavour. Aust J Grape WineRes 11: 139-173. doi:10.1111/j.1755-0238.2005.tb00285.x.
44. Bakker BM, Overkamp KM, van Maris AJA, Kötter P, Luttik MAH et al.(2001) Stoichiometry and compartmentation of NADH metabolism inSaccharomyces cerevisiae. FEMS Microbiol Rev 25: 15-37. doi:10.1111/j.1574-6976.2001.tb00570.x. PubMed: 11152939.
45. Gamero A, Tronchoni J, Querol A, Belloch C (2013) Production ofaroma compounds by cryotolerant Saccharomyces species and hybridsat low and moderate fermentation temperatures. J Appl Microbiol 114:1405-1414. doi:10.1111/jam.12126. PubMed: 23294204.
46. Beltran G, Esteve-Zarzoso B, Rozès N. A, Guillamón JM (2005)Influence of the timing of nitrogen additions during synthetic grape must
fermentations on fermentation kinetics and nitrogen consumption.Journal of Agricultural and Food Chemistry 53: 996-1002
47. Beltran G, Novo M, Rozès N. A, Guillamón JM (2004) Nitrogencatabolite repression in Saccharomyces cerevisiae during winefermentations. FEMS Yeast Research 4: 625-632
48. Godard P, Urrestarazu A, Vissers S, Kontos K, Bontempi G et al.(2007) Effect of 21 different nitrogen sources on global geneexpression in the yeast Saccharomyces cerevisiae. Mol Cell Biol 27:3065-3086. doi:10.1128/MCB.01084-06. PubMed: 17308034.
49. Crépin L, Nidelet T, Sanchez I, Dequin S, Camarasa C (2012)Sequential use of nitrogen compounds by Saccharomyces cerevisiaeduring wine fermentation: a model based on kinetic and regulationcharacteristics of nitrogen permeases. Appl Environ Microbiol 78:8102-8111. doi:10.1128/AEM.02294-12. PubMed: 22983966.
50. Beltran G, Rozès N. A, Guillamón JM (2007) Effect of low-temperaturefermentation on yeast nitrogen metabolism. World Journal ofMicrobiology & Biotechnology 23: 809-815
51. Martínez-Moreno R, Morales P, Gonzalez R A, Beltran G (2012)Biomass production and alcoholic fermentation performance ofSaccharomyces cerevisiae as a function of nitrogen source. FEMSYeast Res 12: 477-485. doi:10.1111/j.1567-1364.2012.00802.x.PubMed: 22429249.
52. Crépin L (2012) Variabilité dans l’utilixation de l’azote chezSaccharomices cerevisae et cónsequences sur la production debiomasse en fermentation oenologique. PhD Thesis, UniversitéMontpellier II. Montpellier, France
53. Kocková-Kratochvílová A (1990) Yeast and yeast-like organisms. NewYork: VCH Publisher.
MFA of S. cerevisiae in Wine Fermentations
PLOS ONE | www.plosone.org 14 August 2013 | Volume 8 | Issue 8 | e71909