fertility management in drip-irrigated processing tomato ... · pdf filehow much n does a...
TRANSCRIPT

Fertility management in drip-irrigated processing tomato production

Nutrient uptake dynamics in drip-irrigated fields: 6 fields in 2007-08 FREP project (N/P/K, Hartz et al.) 14 fields in 2013 CTRI-sponsored project (N only, Horwath et al.)
Field locations: 8 Sacramento Valley 4 mid Valley/Delta 8 San Joaquin Valley

Mean 56 tons/acre total fruit yield
Mean 190 lb N/acre seasonal N application
Fruit yield and N fertilizer application in monitored fields

How much N does a tomato crop take up, and how is it partitioned?
Means
253 lb N total
156 lb N fruit
97 lb N vine
Fruit N content ranged from 1.9 - 3.6 lb N/ton, averaging 2.8 lb/ton Fruit represented 60-70% of total N uptake in most fields

Seasonal N uptake pattern:
peak N uptake about 4-5 lb/acre/day
N partitioning:

Assumptions: Fruit contains 2.6 lb N/ton Fruit represents 62% of crop N uptake
Note: this overstates actual N requirement because some of the survey fields had substantial luxury N uptake; N uptake requirement > 300 lb N/acre unlikely
How much N do high-yield tomatoes need to take up?

Fertilizer application vs. preplant soil residual NO3-N
Soil residual NO3-N varied from 23-219 lb/acre, averaged 80 lb/acre Grower N application did not reflect this difference; ranged from 115-320 lb/acre, averaged 190 lb/acre
Data only from Horwath et al., 2013

Simplified N balance:
Processing tomato typically recovers a significant amount of soil N - residual soil NO3-N - in-season soil N mineralization
N application – crop N uptake
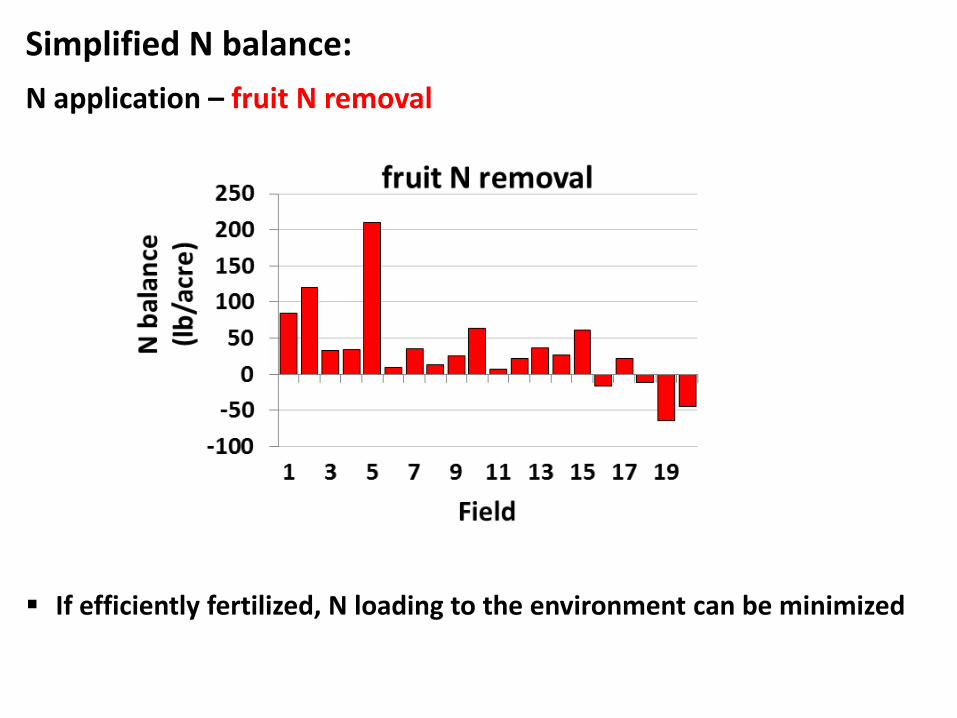
If efficiently fertilized, N loading to the environment can be minimized
N application – fruit N removal
Simplified N balance:

N management guidelines: - Develop a fertigation template based on realistic yield potential, and
soil type (in-season N mineralization potential)
Bottom line: The need for > 200 lb/acre seasonal N application is uncommon
N management guidelines: - Develop a fertigation template based on realistic yield potential, and
soil type (in-season N mineralization potential) - Determine residual soil NO3-N early in the season, and modify the
template to reflect the residual, primarily by delaying / reducing fertigation on the front end
- If irrigation water NO3-N is high, adjust for N content

How about Phosphorus and Potassium?
Uptake pattern roughly similar to N, but of different magnitude
P uptake varies from approximately 70-100 lb P2O5/acre K uptake varies more widely (250-500 lb K2O/acre) depending on
yield and soil K supply

How does drip irrigation change P and K management?
Full bloom stage 1996-97 furrow fields 2007-08 drip fields
Yield 38 tons 56 tons Leaf P 0.38% 0.27% Petiole P 2,700 PPM 1,600 PPM Leaf K 2.8% 2.3% Petiole K 6.8% 4.2% Fruit K 5.2% 3.6%
P and K fertilizer requirements will likely be higher than with
furrow irrigation

When: preplant, or at planting; with appropriate management, in-season application should not be necessary
How: get at least some P close to the transplant to support early growth
How much: soil test between > 15 PPM Olsen P - fruit removal rate (50-70 lb P2O5/acre) usually adequate soil test < 10 PPM Olsen P - crop removal rate, or more (> 80 lb P2O5/acre)
P fertilization

2007-08 fields:
Potassium is the most commonly deficient element in California tomato fields:

Exchangeable cations (PPM)
Percent cation saturation
Cation exchange capacity
Sample ID K Ca Mg Na K Ca Mg Na H (meq/100g) Smith Block 7 70 1147 992 272 1.2 37.3 53.8 7.7 0.0 15.4 Jones Block 2-N 331 4325 438 638 2.9 74.9 12.6 9.6 0.0 28.9 Miller Block 4 48 878 187 67 1.6 58.6 20.8 3.9 15.0 7.5 Ruiz Block 1W 416 2826 436 60 5.4 71.8 18.5 1.3 3.0 19.7
Predicting response to K fertilization
Soils tests give K availability both as PPM, and % of cation saturation
K fertilizer recommendation is an inexact science: < 150 PPM exchangeable K - yield response likely 150-200 PPM K, ≤ 2.5% cation saturation - good chance of yield response > 200 PPM, > 2.5% - declining chance of yield increase
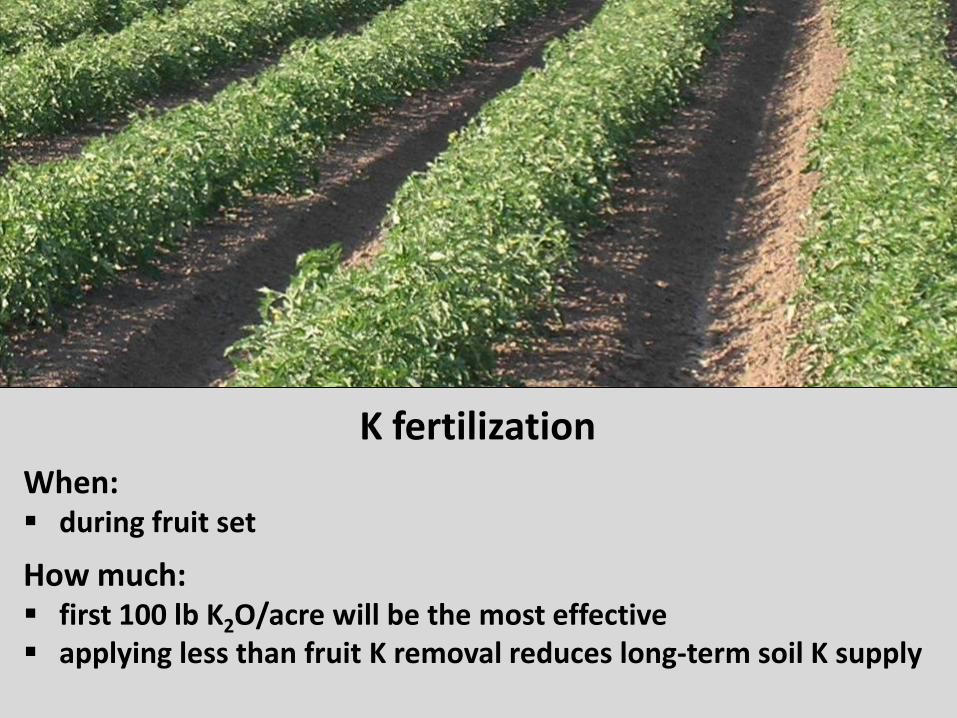
When: during fruit set
How much: first 100 lb K2O/acre will be the most effective applying less than fruit K removal reduces long-term soil K supply
K fertilization

Can K fertigation reduce fruit color disorders?
Yes, but ‘curing’ color disorders may take an impractical amount of K
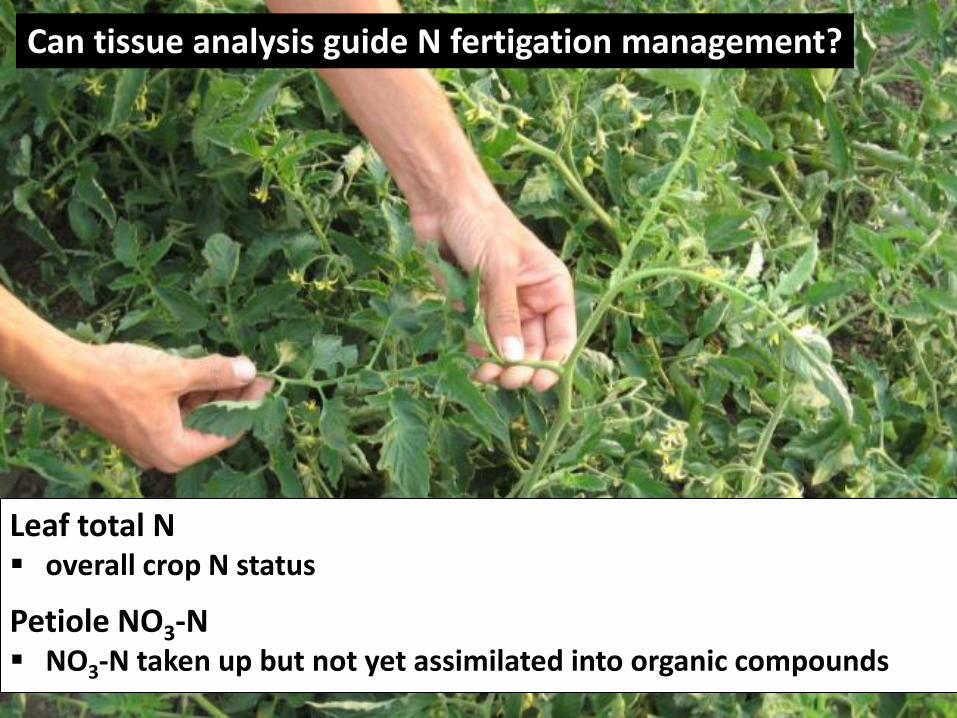
Leaf total N overall crop N status
Petiole NO3-N NO3-N taken up but not yet assimilated into organic compounds
Can tissue analysis guide N fertigation management?

High yield fields (60+ tons total fruit yield)

Petiole NO3-N affected by environmental variability
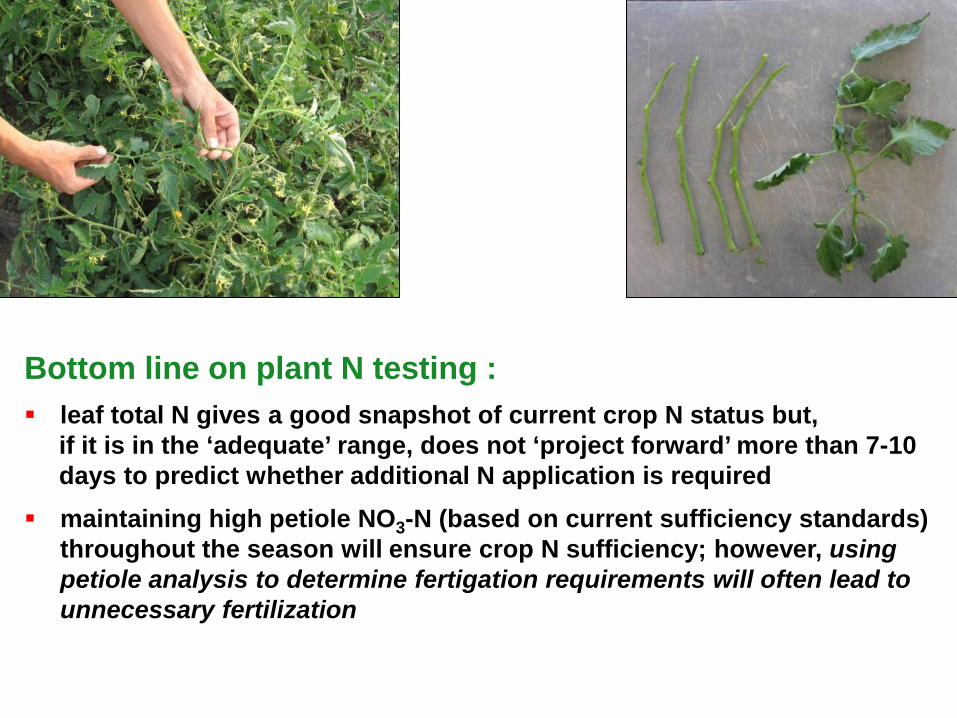
Bottom line on plant N testing :
leaf total N gives a good snapshot of current crop N status but, if it is in the ‘adequate’ range, does not ‘project forward’ more than 7-10 days to predict whether additional N application is required
maintaining high petiole NO3-N (based on current sufficiency standards) throughout the season will ensure crop N sufficiency; however, using petiole analysis to determine fertigation requirements will often lead to unnecessary fertilization

Questions ???