fertility treatment 2014 -...
TRANSCRIPT
Fertility treatment 2014Trends and figures
Published March 2016www.hfea.gov.uk

1Fertility treatment 2014 – Trends and figures Human Fertilisation and Embryology Authority
Contents
Chair’s foreword 2
Summary 3
Understanding the data 5
Our definitions and calculation methods 6
Clinics, patients and types of treatment 9
How many fertility clinics were there in the UK in 2014? 10
How many women received fertility treatment? 11
How old were the women receiving treatment? 12
Who funded the treatment? 12
What types of infertility were treated with IVF or ICSI? 13
What types of cycles were started? 13
How did the age of the women being treated affect which IVF treatment they received? 14
Fresh and frozen cycles 14
How many treatments involved donated sperm? 16
How many embryos were transferred during 2014? 18
How many embryos were transferred in each cycle? 18
Does the number of embryos transferred differ for cleavage or blastocyst transfers? 19
What proportion of transfers were elective SET, and how did this vary by the age of the woman? 20
Why are some cycles abandoned before the cycle is complete? 21
Egg freezing 22
How many patients are storing their eggs? 24
How many patients are thawing eggs for treatment? 26
Pregnancies and births 30
IVF cycles using a woman’s own fresh eggs 31
How many pregnancies resulted from IVF treatment using a woman’s own fresh eggs? 31
How is the pregnancy rate affected by the woman’s age? 31
Does the pregnancy rate differ when one or two cleavage or blastocyst embryos are transferred? 32
What is the multiple birth rate for IVF treatment using a woman’s own fresh eggs? 33
Does the multiple pregnancy rate differ when one or two cleavage or blastocyst embryos are transferred? 33
What is the live birth rate for IVF treatment using a woman’s own fresh eggs? 34
Donor conception treatment 38
Trends 41
Short term trends 42
Long-term trends 46
2 Fertility treatment 2014 – Trends and figures Human Fertilisation and Embryology Authority
Chair’s foreword
I am pleased to present our fifth annual fertility trends report. This is our flagship publication, covering key information about the numbers of patients treated, the different treatments used and the pregnancy rates for fertility treatment cycles carried out in 2014. We also report on the live birth rates for treatment cycles carried out in 2013.
The overall picture is a positive one. We have seen continued increases in pregnancy and live birth rates, while multiple pregnancy and multiple birth rates have continued to fall, representing a genuine public health success. In 2014, one in six pregnancies was a multiple pregnancy, compared with one in four in 2008. Now, around a quarter of cycles started using a woman’s own fresh eggs result in a live birth. For women aged under 35, this figure is one third.
Overall, this means that more people have the opportunity to create the family they want, through the safest clinical methods. Clinical practice continues to improve year on year, and it is a testament to the efforts of clinic staff working together with their patients to promote healthy outcomes from fertility treatment.
This year we have published figures on the emerging area of egg freezing for the first time. Freezing techniques are relatively new, and were very rare only five or six years ago. Interest from patients and the media has grown considerably in recent years, however, and we felt it was time to provide more clarity. The data is revealing: despite the number of IVF cycles increasing rapidly in the last ten years, fewer than 150 cycles per year actually involve thawed eggs, and success rates remain low.
This year marks the 25th anniversary of the HFEA and there has never been a greater choice of information and potential treatment options for patients. Through reports such as this one, we aim to keep patients, clinicians and researchers at the forefront of developments across the sector, ensuring that all those affected by assisted reproduction have the opportunity to access high quality care and treatment.
Sally Cheshire Chair

3Fertility treatment 2014 – Trends and figures Human Fertilisation and Embryology Authority
SummaryUnderstanding the data 5
Our definitions and calculation methods 6
4 Fertility treatment 2014 – Trends and figures Human Fertilisation and Embryology Authority
The HFEA is the independent regulator of fertility treatment in the UK. Part of our role is to collect data from every licensed fertility clinic about the 60,000 treatment cycles they perform each year.
Fertility Trends and Figures is an annual report in which we present information about the patients who are treated, the different treatments they have and how many of them lead to a pregnancy and birth. This year’s report contains pregnancy information about treatment cycles carried out in 2014 and birth information for treatment cycles carried out in 2013.
We show that the overall pregnancy and live birth rates have increased at a time of notable changes to clinical practice. More women than ever are opting to have only one embryo transferred in their treatment to reduce their risk of a multiple pregnancy1 and an increasing number of those transfers are of blastocyst stage embryos. We have also seen the overall multiple pregnancy and multiple birth rates continue to fall.
The key findings in this report are as follows:
• The number of IVF cycles using a woman’s own fresh eggs has stayed broadly similar between 2013 and 2014. However the number of cycles using thawed frozen embryos has increased substantially, by over 10%.
• The number of cycles using donated sperm or embryos has also continued to increase. 60% of women aged 45 and over having IVF use donated eggs compared to just over 2% of women aged under 35.
• The pregnancy and live birth rates have both shown a year-on-year increase. Now, around a quarter of cycles started using a woman’s own fresh eggs results in a live birth. For women aged under 35, this figure is one third.
• Multiple pregnancy and birth rates have continued to decline. In 2014, one in six pregnancies was a multiple pregnancy, compared with one in four in 2008.
• For the first time we are able to publish figures on the emerging area of freezing and thawing eggs. The number of egg freezing cycles have increased rapidly, but are still fewer than 1,000 a year, and the success rates remain low.
1. A multiple birth (twins, triplets or more) is the single greatest health risk of fertility treatment which carries risks to the health of the mother and the unborn child. For more information, go to the one at a time website.
5Fertility treatment 2014 – Trends and figures Human Fertilisation and Embryology Authority
Understanding the data
How we gathered the dataClinics in the UK are required by law to provide information to the HFEA about all licensed fertility treatments they carry out. We hold this information on the HFEA Register, which contains information about fertility patients, the treatment they received and its outcomes.
Results are published according to the year in which the treatment cycle was started and clinics then have around one year to report the results to us. Once submitted, data is checked, which takes time but is essential to ensure the figures are accurate.
How we analysed the dataIn this report we publish both live birth and pregnancy data. We are able to publish pregnancy information much sooner after the treatment cycle than live birth data. However, pregnancy rates do not show the full picture of success that a live birth rate does, as unfortunately not all pregnancies end in a live birth. Information on pregnancies is given to provide a more up-to-date picture of current clinical practice and outcomes.
The information that we publish is a snapshot of data provided to us by licensed clinics at a particular time. The figures supplied in this report are from the HFEA data warehouse containing Register data as at 31 December 2015. Before publication, we carefully check the data and ask the clinics to confirm its accuracy, for which they remain responsible.
As clinics may submit data relating to past cycles at any time, the figures published here may differ slightly to those published before or in the future.
Clinic-specific data is published on our clinic search tool, Choose a Fertility Clinic.
Accessing further dataThe data in this publication has, except in specific circumstances, been presented as percentages in order to draw comparisons and maintain understanding for lay readers. If you would like to access the absolute figures, these are available to download as an Excel file from our website www.hfea.gov.uk/10243.html.
We publish an anonymised version of our Register on our website. If you are a researcher at a UK institution you may be able to apply for access to identifiable data for a specific project. Please email Suzanne Hodgson, Researcher in Statistics and Epidemiology, for more information.
Revisions policyNo revisions are planned to this publication unless errors are found, which will be corrected.
Publication frequencyThis is an annual report.
Contact us regarding this publicationMedia: [email protected] Statistical: [email protected]
6 Fertility treatment 2014 – Trends and figures Human Fertilisation and Embryology Authority
Our definitions and calculation methods
InfertilityInfertility has been defined as a failure to conceive after regular unprotected sexual intercourse for one to two years2. Guidelines published by the National Institute for Health and Care Excellence (NICE) recommend that a woman of reproductive age who has not conceived after one year of unprotected vaginal sexual intercourse, in the absence of any known cause of infertility, should be offered further clinical assessment and investigation along with her partner.
A woman can be offered an earlier referral to a specialist if she is aged 36 years or over, there is a known clinical cause of infertility, or a history of predisposing factors for infertility.
Fertility problems are estimated to affect one in seven heterosexual couples in the UK. Most couples (about 84 out of every 100) who have regular unprotected sexual intercourse (that is, every two to three days) will get pregnant within a year. About 92 out of 100 couples who are trying to get pregnant will do so within two years3.
Fertility treatmentWe use the phrase ‘fertility treatment’ to cover the medical techniques which assist women to have children. Types of fertility treatment include in vitro fertilisation (IVF), intra-cytoplasmic sperm injection (ICSI) and donor insemination (DI).
In this publication, we use ‘IVF’ to cover both ‘standard’ IVF and ICSI, unless otherwise specified. In IVF, a woman’s eggs are removed from her ovaries by a doctor and are combined with sperm in a laboratory. If embryos develop, some or all of them are transferred to the woman’s uterus.
Treatment cycleFertility treatment, such as IVF, normally happens over a period of about two weeks or more. It is therefore called a cycle of treatment rather than a one-off procedure. The start of a cycle is usually taken to be when the woman starts taking drugs to stimulate egg production.
In this report we include data on all the cycles that were started, even if they were discontinued before they were completed.
2. National Institute for Health and Care Excellence (NICE). Fertility: assessment and treatment for people with fertility problems. NICE clinical guideline CG156, February 2013. Available at: http://guidance.nice.org.uk/CG156.
3. Ibid.
7Human Fertilisation and Embryology Authority Fertility treatment 2014 – Trends and figures
Live birth rate, pregnancy rate, and multiple pregnancy and birth ratesUnless otherwise stated, all the pregnancy rates we quote in this report are for one calendar year. They are calculated as follows:
Birth rates per cycle started: the percentage of cycles started in one year that resulted in a live birth4.
Pregnancy rates per embryo transfer: the percentage of embryo transfer procedures that resulted in a woman becoming pregnant (as confirmed by ultrasound)5. The pregnancy rate per embryo transfer is used to compare pregnancy rates after different types of embryo transfer have been performed (ie, elective single embryo transfer (eSET), double embryo transfer (DET), blastocyst stage embryo transfer or cleavage stage embryo transfer).
Multiple pregnancy rate: the percentage of all pregnancies (confirmed by ultrasound) that are of more than one fetus6.
Multiple birth rate: the percentage of all live births that resulted in the birth of more than one live baby7.
OutcomesOur data is presented by the year the treatment cycle started, not the year a resulting pregnancy or birth was reported in. Other data providers, such as the Office for National Statistics (ONS), publish birth rates according to the year the child was born.
There are different ways to account for the outcomes of treatment. Our live birth data counts all births where one or more babies were born showing some sign of life, including those who go on to die within the first month of life (neonatal deaths). Our multiple birth data counts only births where two or more babies were born alive, including those where one or more of the babies died within the first month of life.
Still births – where a baby is born after 24 weeks gestation showing no signs of life – are not included in either live birth or multiple birth counts. This means that a multiple pregnancy which results in the birth of one live baby and one stillborn baby is not counted by the HFEA as a multiple birth. The ONS, however, classes a multiple birth as a pregnancy resulting in the birth of more than one baby, whether alive or stillborn.
4. To calculate this, we divide the number of live births resulting from cycles started in a given year, by the number of cycles started in the same year. This is multiplied by 100 to give a percentage.
5. To calculate this, we divide the number of pregnancies (confirmed by ultrasound) by the number of embryo transfers. This is multiplied by 100 to give a percentage.
6. To calculate this, we divide the number of pregnancies which have two or more fetal sacs (multiple pregnancies) by the number of pregnancies which have confirmed one or more fetal sacs (all pregnancies). This is multiplied by 100 to give a percentage.
7. To calculate this, we divide the number of live births which include two or more babies showing some sign of life at birth (multiple births), by the number of births which included one or more babies born showing some sign of life at birth (all births). This is multiplied by 100 to give a percentage.
8 Fertility treatment 2014 – Trends and figures Human Fertilisation and Embryology Authority
Age bandings and percentagesWe have broken down most of the results presented here into standard age groups. The majority of cycles performed are in women under 40 years of age and as the age increases, the number of women in each group decreases.
We do not present percentages where the group size (for instance the number of cycles performed) is fewer than 50 as we do not think the rate would be robust. In groups where the numbers are less than five, identification of patients becomes a risk and so we aggregate age groups to make their size larger.
If there is only a small number of women in an age group it can make results appear to be very changeable, when expressed as a percentage. For instance, one year we may see that from 1,000 cycles performed in the youngest age group, there were 300 live births. This would give a live birth rate of 30%. We may see in the same time period that only 10 cycles were performed in the oldest age group, three of which resulted in live births. This also results in a live birth rate of 30%. If the number of cycles stayed the same in the subsequent year, but one less woman in each age group had a live birth, the percentages would change to 29.9% for the younger women (barely changing), and to 20% for the older age group (it appears the rate has dropped dramatically). As larger groups are less affected by small changes (possibly caused by chance occurrences), they tend to remain steadier.
9Human Fertilisation and Embryology Authority
Clinics, patients and types of treatment
Fertility treatment 2014 – Trends and figures
How many fertility clinics were there in the UK in 2014? 10
How many women received fertility treatment? 11
How old were the women receiving treatment? 12
Who funded the treatment? 12
What types of infertility were treated with IVF or ICSI? 13
What types of cycles were started? 13
How did the age of the women being treated affect which IVF treatment they received? 14
Fresh and frozen cycles 14
How many treatments involved donated sperm? 16
How many embryos were transferred during 2014? 18
How many embryos were transferred in each cycle? 18
Does the number of embryos transferred differ for cleavage or blastocyst transfers? 19
What proportion of transfers were elective SET, and how did this vary by the age of the woman? 20
Why are some cycles abandoned before the cycle is complete? 21
10 Fertility treatment 2014 – Trends and figures Human Fertilisation and Embryology Authority
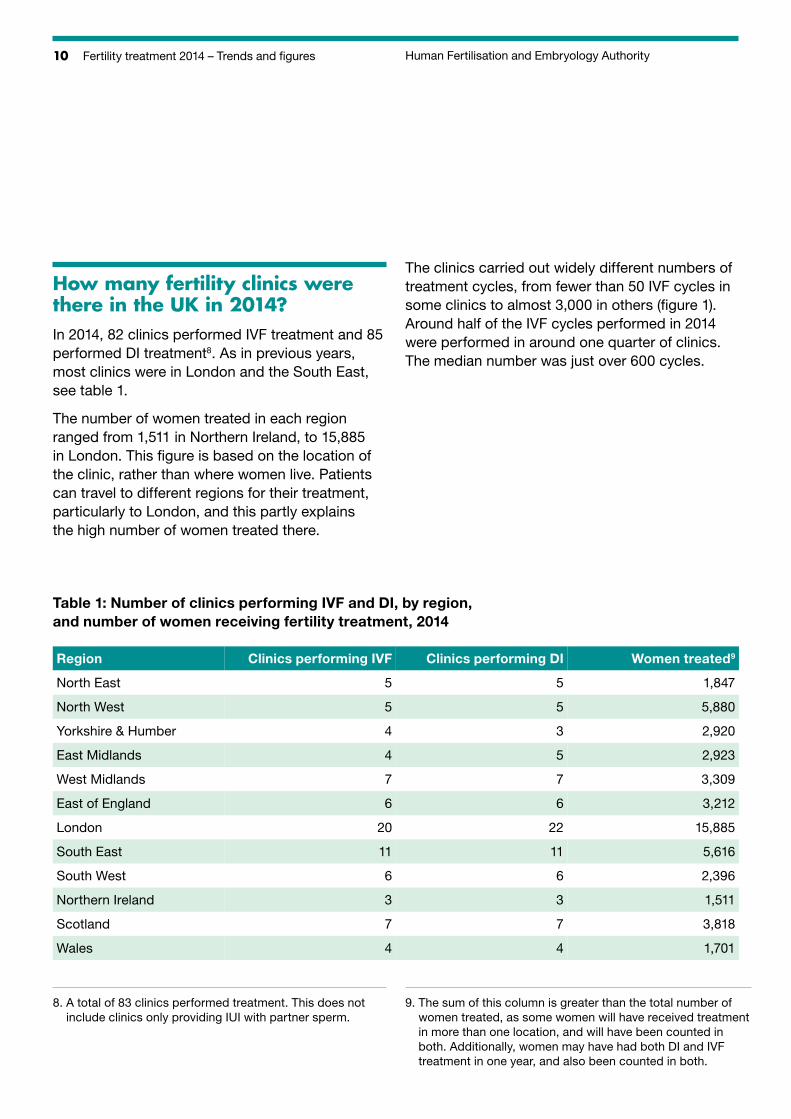
How many fertility clinics were there in the UK in 2014?In 2014, 82 clinics performed IVF treatment and 85 performed DI treatment8. As in previous years, most clinics were in London and the South East, see table 1.
The number of women treated in each region ranged from 1,511 in Northern Ireland, to 15,885 in London. This figure is based on the location of the clinic, rather than where women live. Patients can travel to different regions for their treatment, particularly to London, and this partly explains the high number of women treated there.
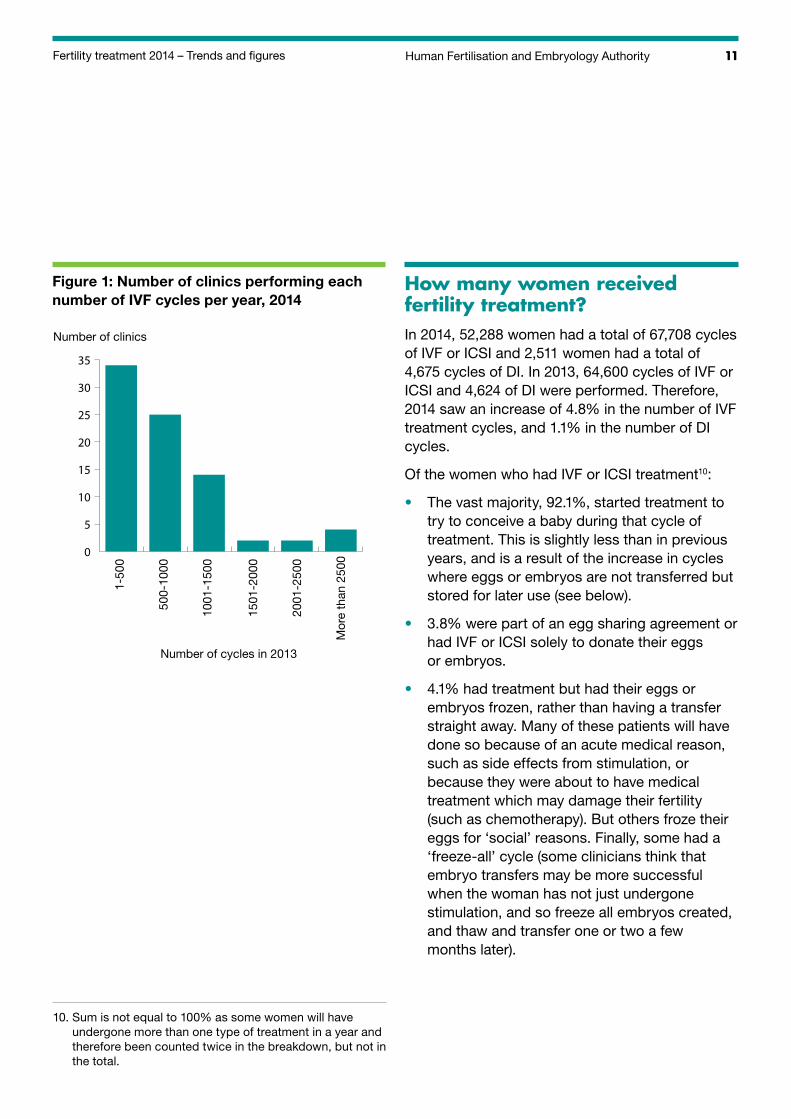
The clinics carried out widely different numbers of treatment cycles, from fewer than 50 IVF cycles in some clinics to almost 3,000 in others (figure 1). Around half of the IVF cycles performed in 2014 were performed in around one quarter of clinics. The median number was just over 600 cycles.
Table 1: Number of clinics performing IVF and DI, by region, and number of women receiving fertility treatment, 2014
Region Clinics performing IVF Clinics performing DI Women treated9
North East 5 5 1,847
North West 5 5 5,880
Yorkshire & Humber 4 3 2,920
East Midlands 4 5 2,923
West Midlands 7 7 3,309
East of England 6 6 3,212
London 20 22 15,885
South East 11 11 5,616
South West 6 6 2,396
Northern Ireland 3 3 1,511
Scotland 7 7 3,818
Wales 4 4 1,701
8. A total of 83 clinics performed treatment. This does not include clinics only providing IUI with partner sperm.
9. The sum of this column is greater than the total number of women treated, as some women will have received treatment in more than one location, and will have been counted in both. Additionally, women may have had both DI and IVF treatment in one year, and also been counted in both.
11Fertility treatment 2014 – Trends and figures Human Fertilisation and Embryology Authority
Number of clinics
1-50
0
500-
1000
1001
-150
0
1501
-200
0
2001
-250
0
Mor
e th
an 2
500
Number of cycles in 2013
0
5
10
15
20
25
30
35
Figure 1: Number of clinics performing each number of IVF cycles per year, 2014
How many women received fertility treatment?In 2014, 52,288 women had a total of 67,708 cycles of IVF or ICSI and 2,511 women had a total of 4,675 cycles of DI. In 2013, 64,600 cycles of IVF or ICSI and 4,624 of DI were performed. Therefore, 2014 saw an increase of 4.8% in the number of IVF treatment cycles, and 1.1% in the number of DI cycles.
Of the women who had IVF or ICSI treatment10:
• The vast majority, 92.1%, started treatment to try to conceive a baby during that cycle of treatment. This is slightly less than in previous years, and is a result of the increase in cycles where eggs or embryos are not transferred but stored for later use (see below).
• 3.8% were part of an egg sharing agreement or had IVF or ICSI solely to donate their eggs or embryos.
• 4.1% had treatment but had their eggs or embryos frozen, rather than having a transfer straight away. Many of these patients will have done so because of an acute medical reason, such as side effects from stimulation, or because they were about to have medical treatment which may damage their fertility (such as chemotherapy). But others froze their eggs for ‘social’ reasons. Finally, some had a ‘freeze-all’ cycle (some clinicians think that embryo transfers may be more successful when the woman has not just undergone stimulation, and so freeze all embryos created, and thaw and transfer one or two a few months later).
10. Sum is not equal to 100% as some women will have undergone more than one type of treatment in a year and therefore been counted twice in the breakdown, but not in the total.
12 Fertility treatment 2014 – Trends and figures Human Fertilisation and Embryology Authority
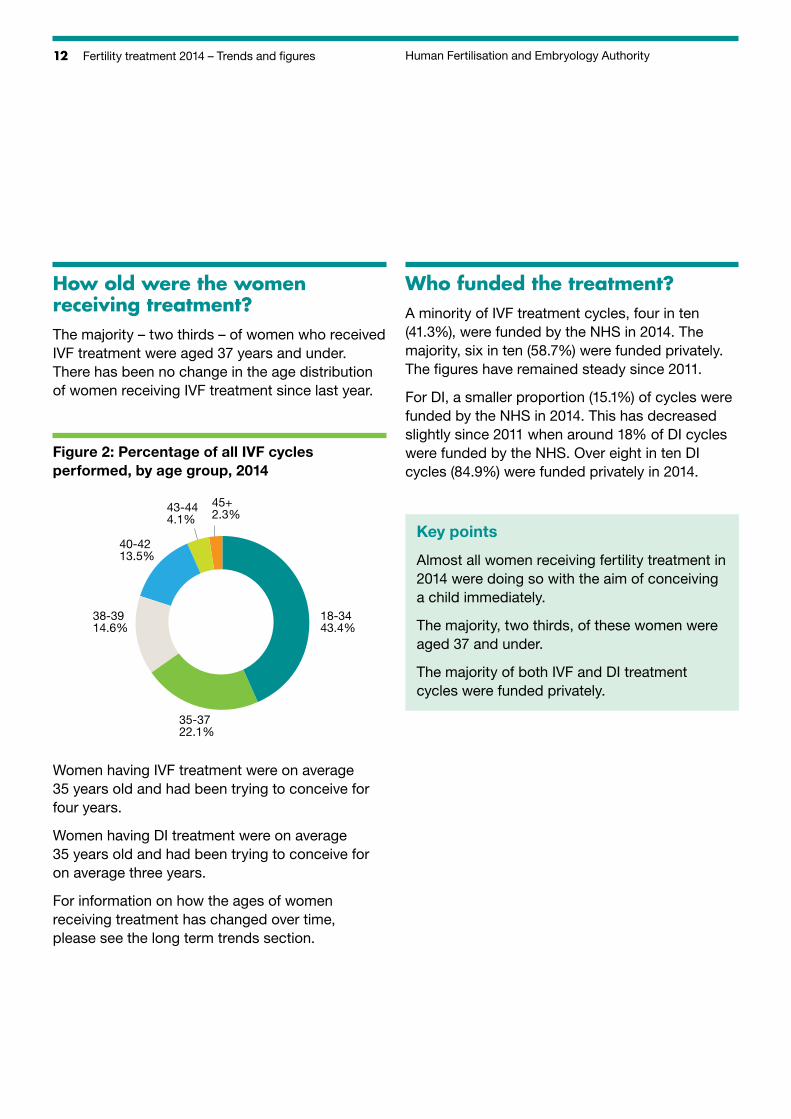
How old were the women receiving treatment?The majority – two thirds – of women who received IVF treatment were aged 37 years and under. There has been no change in the age distribution of women receiving IVF treatment since last year.
38-3914.6%
45+2.3%
18-3443.4%
35-3722.1%
40-4213.5%
43-444.1%
Figure 2: Percentage of all IVF cycles performed, by age group, 2014
Women having IVF treatment were on average 35 years old and had been trying to conceive for four years.
Women having DI treatment were on average 35 years old and had been trying to conceive for on average three years.
For information on how the ages of women receiving treatment has changed over time, please see the long term trends section.
Who funded the treatment?A minority of IVF treatment cycles, four in ten (41.3%), were funded by the NHS in 2014. The majority, six in ten (58.7%) were funded privately. The figures have remained steady since 2011.
For DI, a smaller proportion (15.1%) of cycles were funded by the NHS in 2014. This has decreased slightly since 2011 when around 18% of DI cycles were funded by the NHS. Over eight in ten DI cycles (84.9%) were funded privately in 2014.
Key points
Almost all women receiving fertility treatment in 2014 were doing so with the aim of conceiving a child immediately.
The majority, two thirds, of these women were aged 37 and under.
The majority of both IVF and DI treatment cycles were funded privately.
13Human Fertilisation and Embryology AuthorityFertility treatment 2014 – Trends and figures
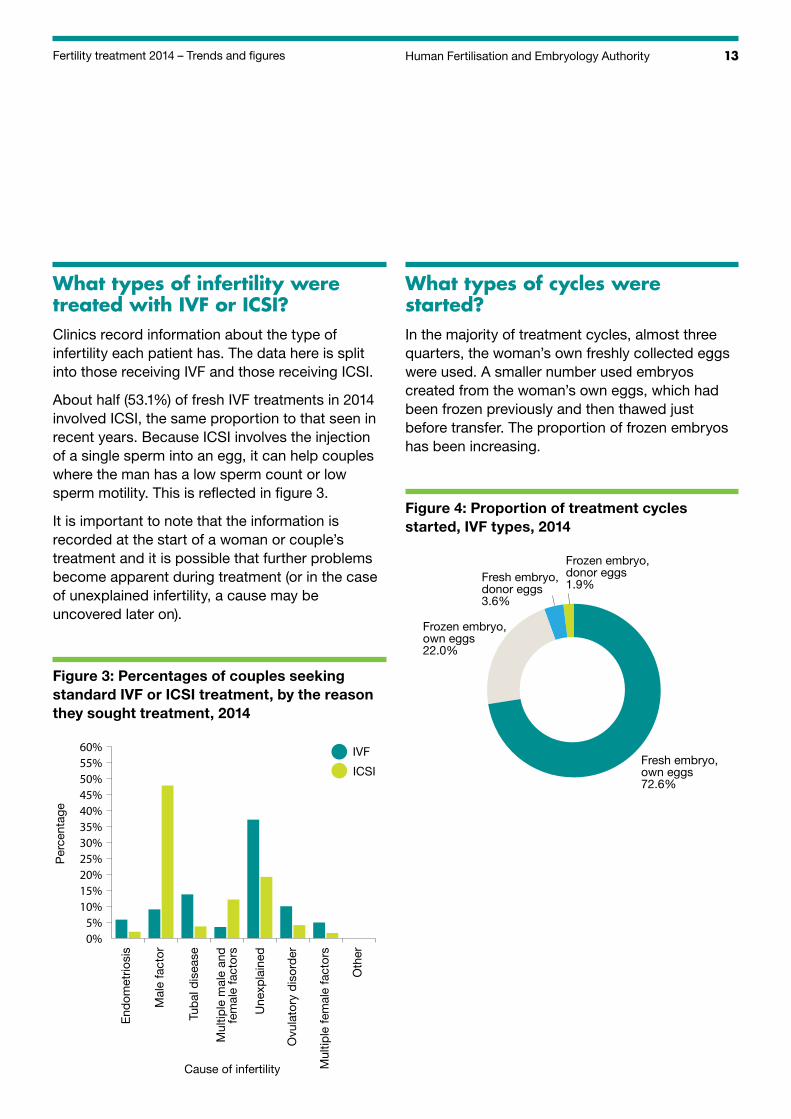
What types of infertility were treated with IVF or ICSI?Clinics record information about the type of infertility each patient has. The data here is split into those receiving IVF and those receiving ICSI.
About half (53.1%) of fresh IVF treatments in 2014 involved ICSI, the same proportion to that seen in recent years. Because ICSI involves the injection of a single sperm into an egg, it can help couples where the man has a low sperm count or low sperm motility. This is reflected in figure 3.
It is important to note that the information is recorded at the start of a woman or couple’s treatment and it is possible that further problems become apparent during treatment (or in the case of unexplained infertility, a cause may be uncovered later on).
Figure 3: Percentages of couples seeking standard IVF or ICSI treatment, by the reason they sought treatment, 2014
Per
cent
age
End
omet
riosi
s
Mal
e fa
ctor
Tub
al d
isea
se
Mul
tiple
mal
e an
d fe
mal
e fa
ctor
s
Une
xpla
ined
Ovu
lato
ry d
isor
der
Cause of infertility
0%5%
10%15%20%25%30%35%40%45%50%55%60%
Mul
tiple
fem
ale
fact
ors
Oth
er
IVF
ICSI
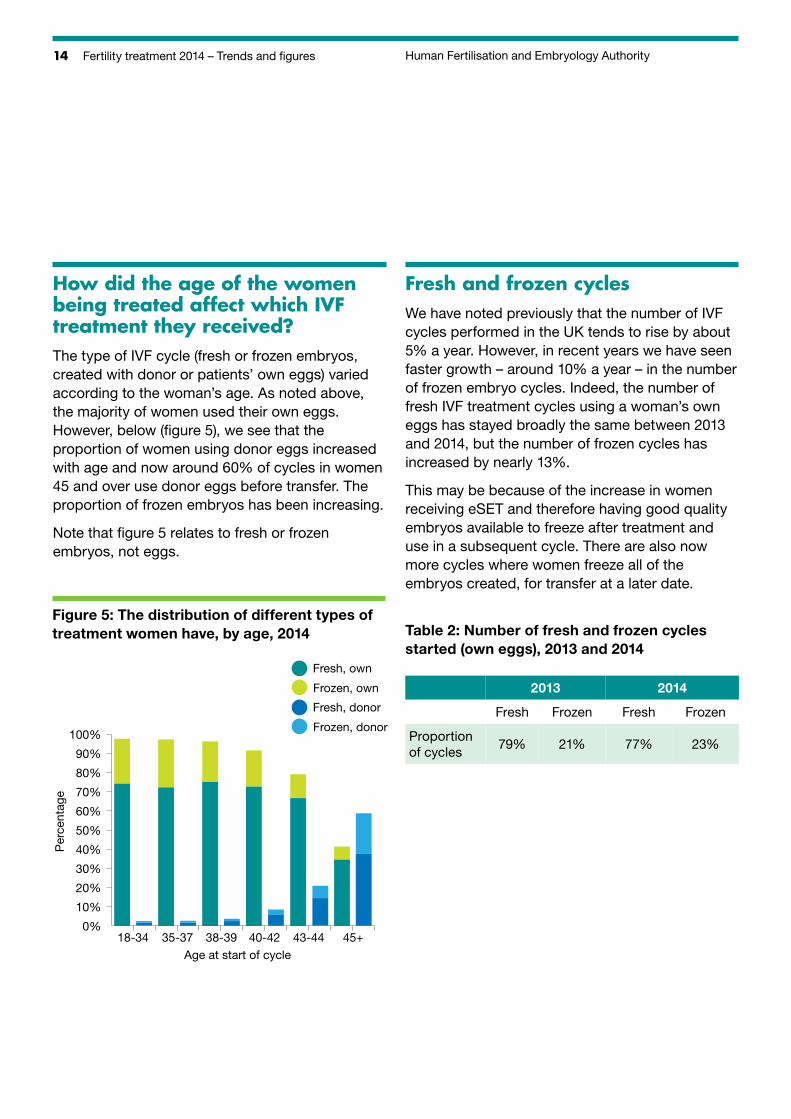
What types of cycles were started?In the majority of treatment cycles, almost three quarters, the woman’s own freshly collected eggs were used. A smaller number used embryos created from the woman’s own eggs, which had been frozen previously and then thawed just before transfer. The proportion of frozen embryos has been increasing.
Figure 4: Proportion of treatment cycles started, IVF types, 2014
Frozen embryo, own eggs22.0%
Fresh embryo, donor eggs3.6%
Fresh embryo, own eggs72.6%
Frozen embryo, donor eggs1.9%
14 Fertility treatment 2014 – Trends and figures Human Fertilisation and Embryology Authority
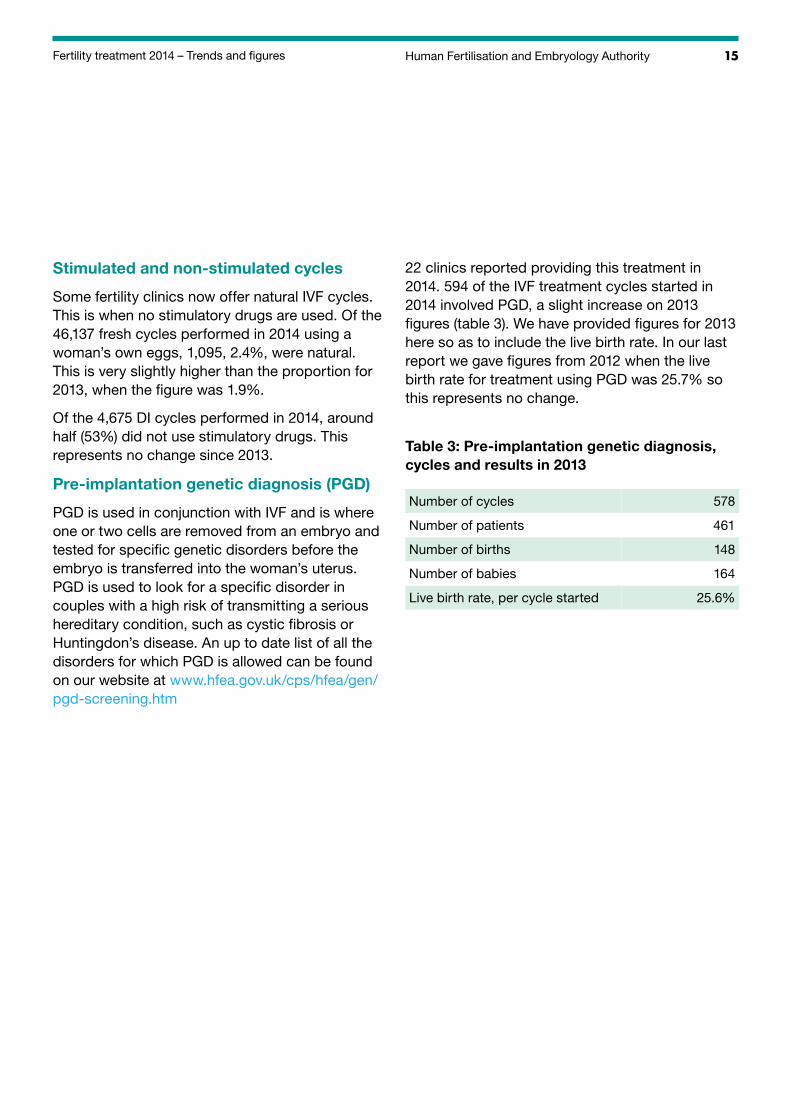
How did the age of the women being treated affect which IVF treatment they received? The type of IVF cycle (fresh or frozen embryos, created with donor or patients’ own eggs) varied according to the woman’s age. As noted above, the majority of women used their own eggs. However, below (figure 5), we see that the proportion of women using donor eggs increased with age and now around 60% of cycles in women 45 and over use donor eggs before transfer. The proportion of frozen embryos has been increasing.
Note that figure 5 relates to fresh or frozen embryos, not eggs.
Figure 5: The distribution of different types of treatment women have, by age, 2014
Per
cent
age
18-34 35-37 38-39 40-42 43-44 45+Age at start of cycle
0%
10%
20%
30%
40%
50%
60%
70%
80%
90%
100%
Fresh, own
Frozen, own
Fresh, donor
Frozen, donor
Fresh and frozen cyclesWe have noted previously that the number of IVF cycles performed in the UK tends to rise by about 5% a year. However, in recent years we have seen faster growth – around 10% a year – in the number of frozen embryo cycles. Indeed, the number of fresh IVF treatment cycles using a woman’s own eggs has stayed broadly the same between 2013 and 2014, but the number of frozen cycles has increased by nearly 13%.
This may be because of the increase in women receiving eSET and therefore having good quality embryos available to freeze after treatment and use in a subsequent cycle. There are also now more cycles where women freeze all of the embryos created, for transfer at a later date.
Table 2: Number of fresh and frozen cycles started (own eggs), 2013 and 2014
2013 2014
Fresh Frozen Fresh Frozen
Proportion of cycles
79% 21% 77% 23%
15Human Fertilisation and Embryology AuthorityFertility treatment 2014 – Trends and figures
Stimulated and non-stimulated cycles
Some fertility clinics now offer natural IVF cycles. This is when no stimulatory drugs are used. Of the 46,137 fresh cycles performed in 2014 using a woman’s own eggs, 1,095, 2.4%, were natural. This is very slightly higher than the proportion for 2013, when the figure was 1.9%.
Of the 4,675 DI cycles performed in 2014, around half (53%) did not use stimulatory drugs. This represents no change since 2013.
Pre-implantation genetic diagnosis (PGD)
PGD is used in conjunction with IVF and is where one or two cells are removed from an embryo and tested for specific genetic disorders before the embryo is transferred into the woman’s uterus. PGD is used to look for a specific disorder in couples with a high risk of transmitting a serious hereditary condition, such as cystic fibrosis or Huntingdon’s disease. An up to date list of all the disorders for which PGD is allowed can be found on our website at www.hfea.gov.uk/cps/hfea/gen/pgd-screening.htm
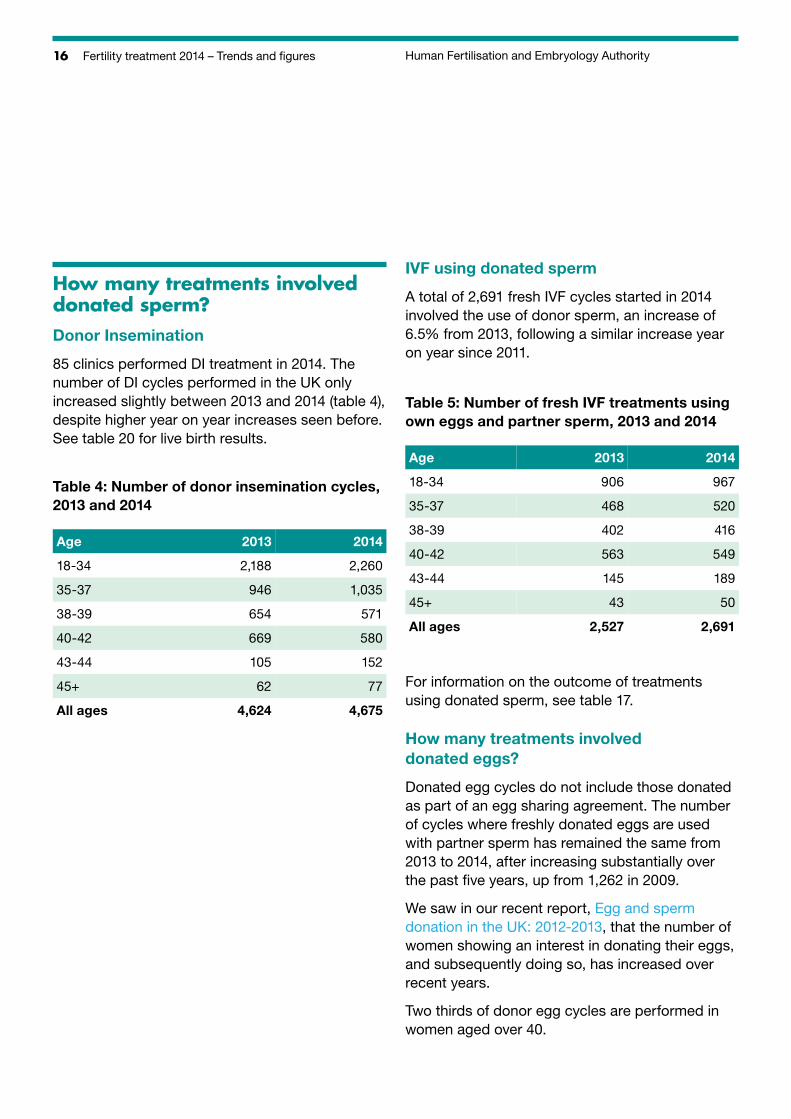
22 clinics reported providing this treatment in 2014. 594 of the IVF treatment cycles started in 2014 involved PGD, a slight increase on 2013 figures (table 3). We have provided figures for 2013 here so as to include the live birth rate. In our last report we gave figures from 2012 when the live birth rate for treatment using PGD was 25.7% so this represents no change.
Table 3: Pre-implantation genetic diagnosis, cycles and results in 2013
Number of cycles
Number of patients
Number of births
578
461
148
Number of babies 164
Live birth rate, per cycle started 25.6%
16 Fertility treatment 2014 – Trends and figures Human Fertilisation and Embryology Authority
How many treatments involved donated sperm?Donor Insemination
85 clinics performed DI treatment in 2014. The number of DI cycles performed in the UK only increased slightly between 2013 and 2014 (table 4), despite higher year on year increases seen before. See table 20 for live birth results.
Table 4: Number of donor insemination cycles, 2013 and 2014
Age
18-34
35-37
38-39
2013
2,188
946
654
2014
2,260
1,035
571
40-42 669 580
43-44 105 152
45+ 62 77
All ages 4,624 4,675
IVF using donated sperm
A total of 2,691 fresh IVF cycles started in 2014 involved the use of donor sperm, an increase of 6.5% from 2013, following a similar increase year on year since 2011.
Table 5: Number of fresh IVF treatments using own eggs and partner sperm, 2013 and 2014
Age 2013 2014
18-34 906 967
35-37 468 520
38-39 402 416
40-42 563 549
43-44 145 189
45+ 43 50
All ages 2,527 2,691
For information on the outcome of treatments using donated sperm, see table 17.
How many treatments involved donated eggs?
Donated egg cycles do not include those donated as part of an egg sharing agreement. The number of cycles where freshly donated eggs are used with partner sperm has remained the same from 2013 to 2014, after increasing substantially over the past five years, up from 1,262 in 2009.
We saw in our recent report, Egg and sperm donation in the UK: 2012-2013, that the number of women showing an interest in donating their eggs, and subsequently doing so, has increased over recent years.
Two thirds of donor egg cycles are performed in women aged over 40.
17Human Fertilisation and Embryology Authority Fertility treatment 2014 – Trends and figures
Table 6: Number of IVF cycles using fresh donated eggs and partner sperm, 2013 and 2014
Age 2013 2014
18-34 267 262
35-37 244 188
38-39 214 192
40-42 393 419
43-44 302 322
45+ 441 483
All ages 1,866 1,866
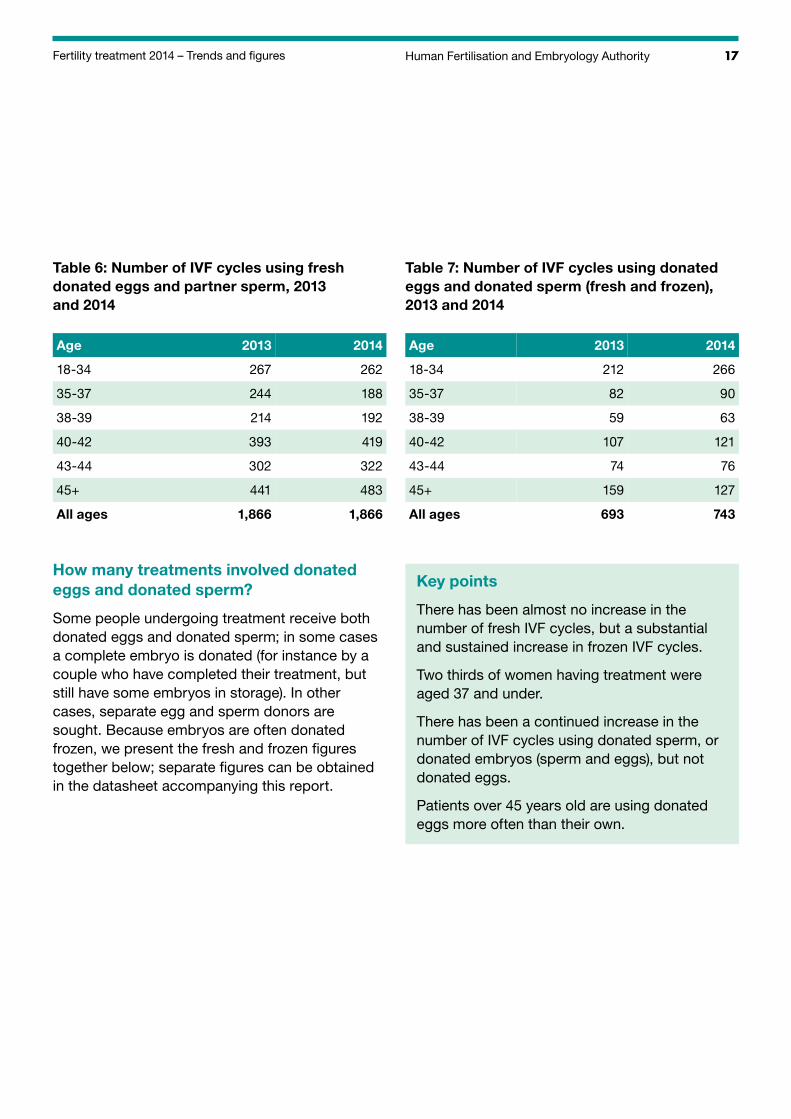
How many treatments involved donated eggs and donated sperm?
Some people undergoing treatment receive both donated eggs and donated sperm; in some cases a complete embryo is donated (for instance by a couple who have completed their treatment, but still have some embryos in storage). In other cases, separate egg and sperm donors are sought. Because embryos are often donated frozen, we present the fresh and frozen figures together below; separate figures can be obtained in the datasheet accompanying this report.
Table 7: Number of IVF cycles using donated eggs and donated sperm (fresh and frozen), 2013 and 2014
Age 2013 2014
18-34 212 266
35-37 82 90
38-39 59 63
40-42 107 121
43-44 74 76
45+ 159 127
All ages 693 743
Key points
There has been almost no increase in the number of fresh IVF cycles, but a substantial and sustained increase in frozen IVF cycles.
Two thirds of women having treatment were aged 37 and under.
There has been a continued increase in the number of IVF cycles using donated sperm, or donated embryos (sperm and eggs), but not donated eggs.
Patients over 45 years old are using donated eggs more often than their own.
18 Fertility treatment 2014 – Trends and figures Human Fertilisation and Embryology Authority
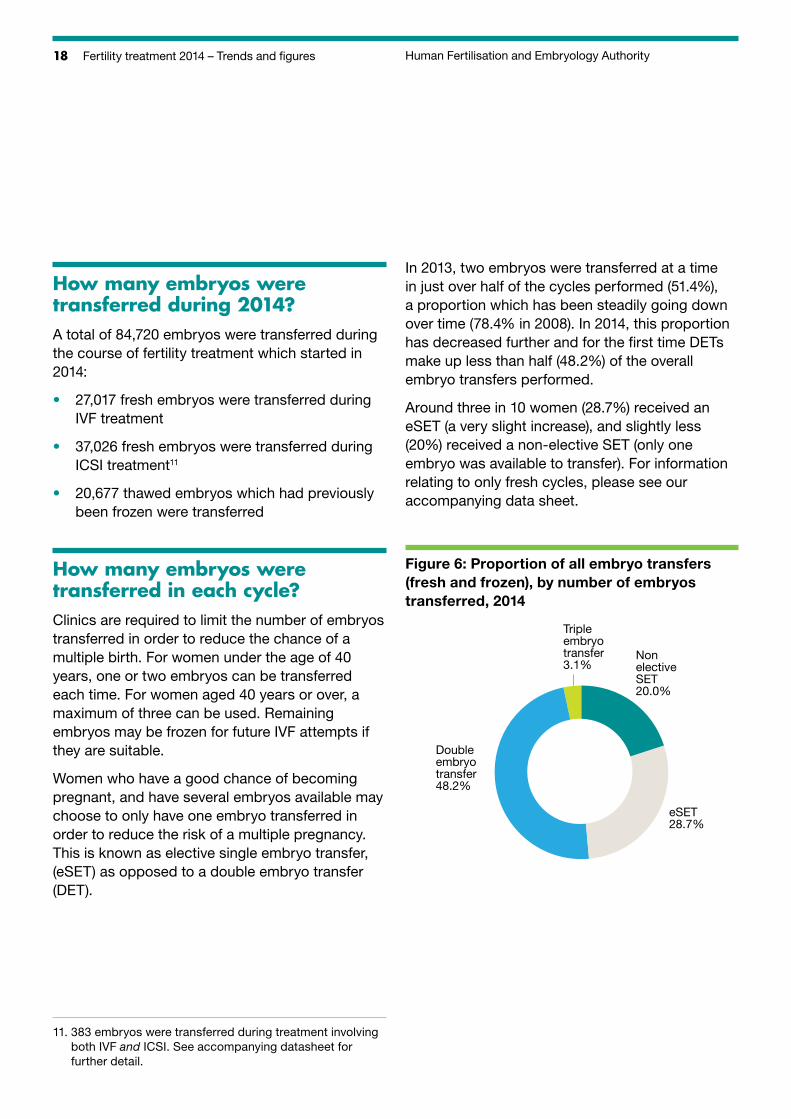
How many embryos were transferred during 2014?A total of 84,720 embryos were transferred during the course of fertility treatment which started in 2014:
• 27,017 fresh embryos were transferred during IVF treatment
• 37,026 fresh embryos were transferred during ICSI treatment11
• 20,677 thawed embryos which had previously been frozen were transferred
How many embryos were transferred in each cycle?Clinics are required to limit the number of embryos transferred in order to reduce the chance of a multiple birth. For women under the age of 40 years, one or two embryos can be transferred each time. For women aged 40 years or over, a maximum of three can be used. Remaining embryos may be frozen for future IVF attempts if they are suitable.
Women who have a good chance of becoming pregnant, and have several embryos available may choose to only have one embryo transferred in order to reduce the risk of a multiple pregnancy. This is known as elective single embryo transfer, (eSET) as opposed to a double embryo transfer (DET).
In 2013, two embryos were transferred at a time in just over half of the cycles performed (51.4%), a proportion which has been steadily going down over time (78.4% in 2008). In 2014, this proportion has decreased further and for the first time DETs make up less than half (48.2%) of the overall embryo transfers performed.
Around three in 10 women (28.7%) received an eSET (a very slight increase), and slightly less (20%) received a non-elective SET (only one embryo was available to transfer). For information relating to only fresh cycles, please see our accompanying data sheet.
Figure 6: Proportion of all embryo transfers (fresh and frozen), by number of embryos transferred, 2014
Double embryo transfer48.2%
Triple embryo transfer3.1%
Non elective SET20.0%
eSET28.7%
11. 3 83 embryos were transferred during treatment involving both IVF and ICSI. See accompanying datasheet for further detail.
19Human Fertilisation and Embryology AuthorityFertility treatment 2014 – Trends and figures
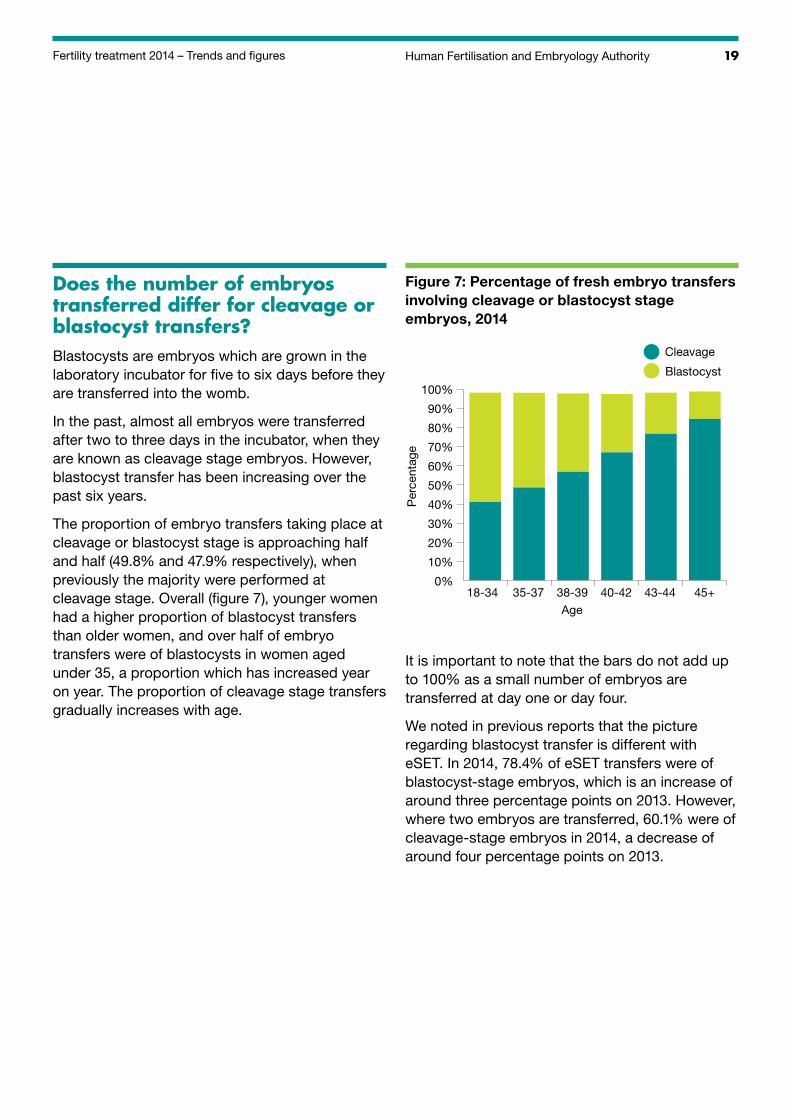
Does the number of embryos transferred differ for cleavage or blastocyst transfers?Blastocysts are embryos which are grown in the laboratory incubator for five to six days before they are transferred into the womb.
In the past, almost all embryos were transferred after two to three days in the incubator, when they are known as cleavage stage embryos. However, blastocyst transfer has been increasing over the past six years.
The proportion of embryo transfers taking place at cleavage or blastocyst stage is approaching half and half (49.8% and 47.9% respectively), when previously the majority were performed at cleavage stage. Overall (figure 7), younger women had a higher proportion of blastocyst transfers than older women, and over half of embryo transfers were of blastocysts in women aged under 35, a proportion which has increased year on year. The proportion of cleavage stage transfers gradually increases with age.
Figure 7: Percentage of fresh embryo transfers involving cleavage or blastocyst stage embryos, 2014
Per
cent
age
18-34 35-37 38-39 40-42 43-44 45+Age
0%
10%
20%
30%
40%
50%
60%
70%
80%
90%
100%
Cleavage
Blastocyst
It is important to note that the bars do not add up to 100% as a small number of embryos are transferred at day one or day four.
We noted in previous reports that the picture regarding blastocyst transfer is different with eSET. In 2014, 78.4% of eSET transfers were of blastocyst-stage embryos, which is an increase of around three percentage points on 2013. However, where two embryos are transferred, 60.1% were of cleavage-stage embryos in 2014, a decrease of around four percentage points on 2013.
20 Fertility treatment 2014 – Trends and figures Human Fertilisation and Embryology Authority
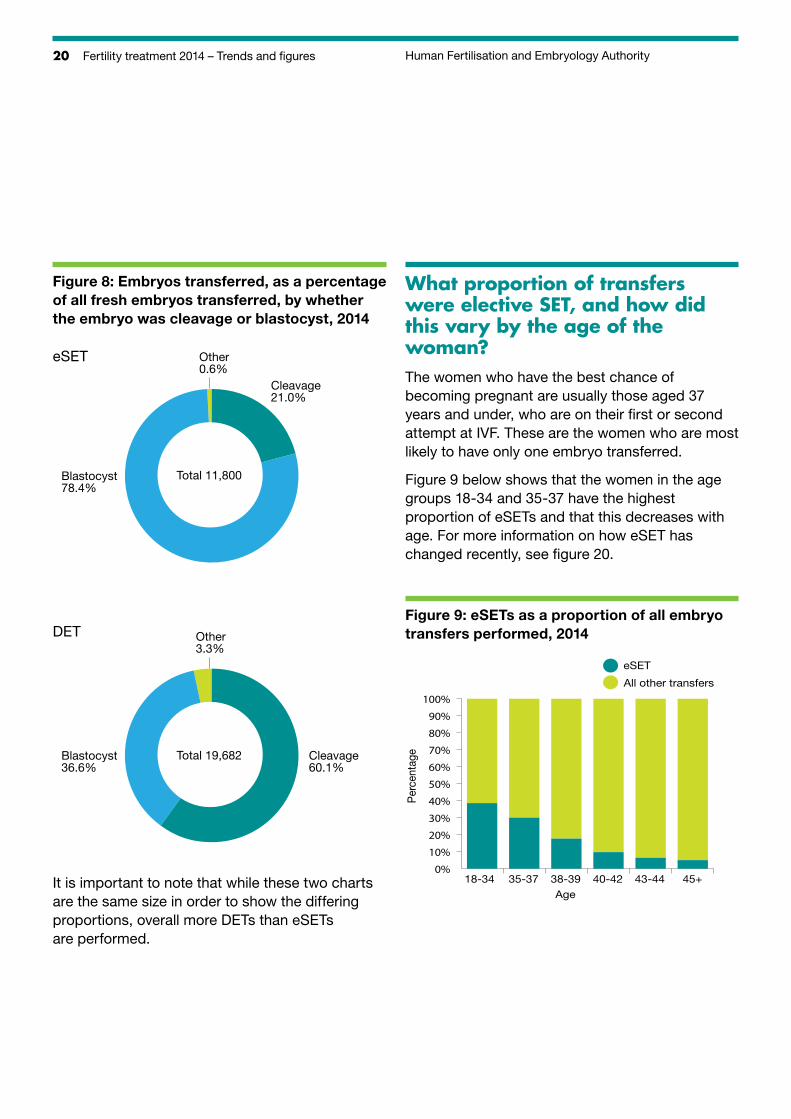
Figure 8: Embryos transferred, as a percentage of all fresh embryos transferred, by whether the embryo was cleavage or blastocyst, 2014
Blastocyst36.6%
Other3.3%
Cleavage60.1%
Total 19,682
DET
eSET
Blastocyst78.4%
Other0.6%
Cleavage21.0%
Total 11,800
It is important to note that while these two charts are the same size in order to show the differing proportions, overall more DETs than eSETs are performed.
What proportion of transfers were elective SET, and how did this vary by the age of the woman?The women who have the best chance of becoming pregnant are usually those aged 37 years and under, who are on their first or second attempt at IVF. These are the women who are most likely to have only one embryo transferred.
Figure 9 below shows that the women in the age groups 18-34 and 35-37 have the highest proportion of eSETs and that this decreases with age. For more information on how eSET has changed recently, see figure 20.
Figure 9: eSETs as a proportion of all embryo transfers performed, 2014
0%
10%
20%
30%
40%
50%
60%
70%
80%
90%
100%
Per
cent
age
18-34 35-37 38-39 40-42 43-44 45+Age
eSET
All other transfers
21Human Fertilisation and Embryology AuthorityFertility treatment 2014 – Trends and figures
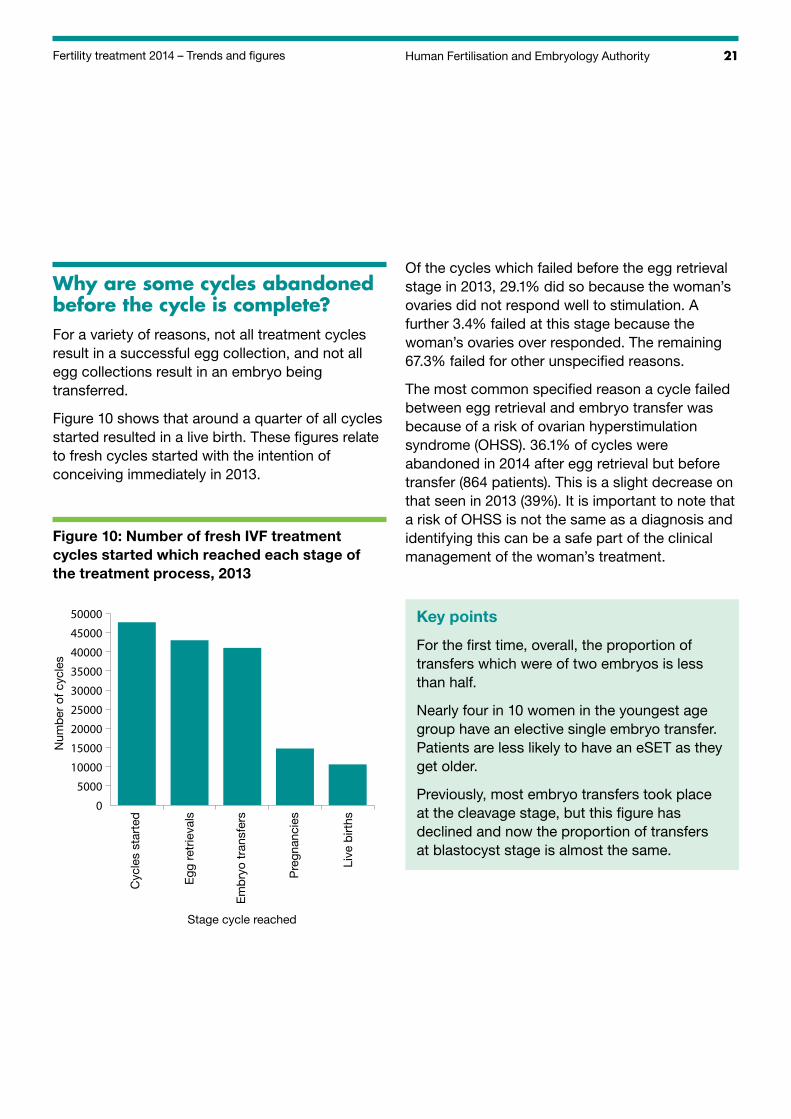
Why are some cycles abandoned before the cycle is complete?For a variety of reasons, not all treatment cycles result in a successful egg collection, and not all egg collections result in an embryo being transferred.
Figure 10 shows that around a quarter of all cycles started resulted in a live birth. These figures relate to fresh cycles started with the intention of conceiving immediately in 2013.
Figure 10: Number of fresh IVF treatment cycles started which reached each stage of the treatment process, 2013
0
5000
10000
15000
20000
25000
30000
35000
40000
45000
50000
Num
ber
of c
ycle
s
Stage cycle reached
Cyc
les
star
ted
Egg
ret
rieva
ls
Em
bry
o tr
ansf
ers
Pre
gnan
cies
Live
birt
hs
Of the cycles which failed before the egg retrieval stage in 2013, 29.1% did so because the woman’s ovaries did not respond well to stimulation. A further 3.4% failed at this stage because the woman’s ovaries over responded. The remaining 67.3% failed for other unspecified reasons.
The most common specified reason a cycle failed between egg retrieval and embryo transfer was because of a risk of ovarian hyperstimulation syndrome (OHSS). 36.1% of cycles were abandoned in 2014 after egg retrieval but before transfer (864 patients). This is a slight decrease on that seen in 2013 (39%). It is important to note that a risk of OHSS is not the same as a diagnosis and identifying this can be a safe part of the clinical management of the woman’s treatment.
Key points
For the first time, overall, the proportion of transfers which were of two embryos is less than half.
Nearly four in 10 women in the youngest age group have an elective single embryo transfer. Patients are less likely to have an eSET as they get older.
Previously, most embryo transfers took place at the cleavage stage, but this figure has declined and now the proportion of transfers at blastocyst stage is almost the same.
22 Fertility treatment 2014 – Trends and figures Human Fertilisation and Embryology Authority
Egg freezingHow many patients are storing their eggs? 24
How many patients are thawing eggs for treatment? 26
23Human Fertilisation and Embryology AuthorityFertility treatment 2014 – Trends and figures
Egg freezing has been around for some years, but very few women opted for it as a treatment and success rates were low.
Eggs are more fragile than embryos, and were less likely to survive the freeze-thaw process. However, the number of egg freezing cycles has increased in recent times as freezing methods have improved. We are therefore including, for the first time, data on this area of treatment. However, the number of women who have undergone the full process – storing and then thawing their own eggs for treatment – is still small.
The growth in this treatment area appears to be mainly due to the introduction of a new fast-freezing technique called vitrification, which is more effective than the slower freezing technique used more frequently in the past.
This section is concerned only with women storing eggs for their own future treatment, as opposed to those wishing to donate eggs to others. We collect only limited information regarding the reasons for seeking treatment, however women may freeze their eggs for their own use because, for instance:
• they have a condition, or are facing medical treatment for a condition, that may affect their fertility (for example chemotherapy for cancer)
• they are concerned about their fertility declining with age but are not currently in a position to have a child
• they are at risk of injury or death (eg, a member of the Armed Forces who is being deployed to a war zone)
• they are about to undergo gender reassignment.
Because of the relatively small numbers involved, we present figures here in two age groups, 37 years and under and 38 years and over, instead of the six we usually use. By the very nature of the treatment, many of the women freezing their eggs recently will not thaw them for several years to come. Here we present firstly information about the storage cycles (to freeze eggs) and then separately, the cycles using thawed eggs, and their results.
24 Fertility treatment 2014 – Trends and figures Human Fertilisation and Embryology Authority
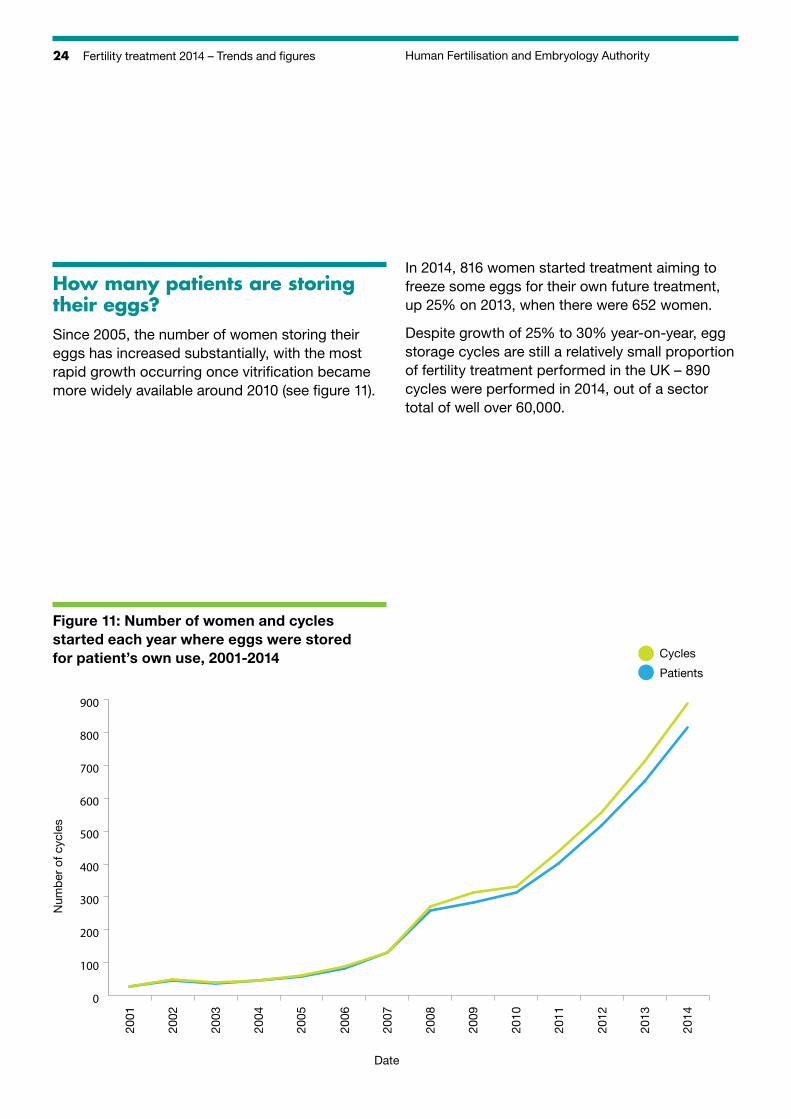
How many patients are storing their eggs?Since 2005, the number of women storing their eggs has increased substantially, with the most rapid growth occurring once vitrification became more widely available around 2010 (see figure 11).
In 2014, 816 women started treatment aiming to freeze some eggs for their own future treatment, up 25% on 2013, when there were 652 women.
Despite growth of 25% to 30% year-on-year, egg storage cycles are still a relatively small proportion of fertility treatment performed in the UK – 890 cycles were performed in 2014, out of a sector total of well over 60,000.
Figure 11: Number of women and cycles started each year where eggs were stored for patient’s own use, 2001-2014
Num
ber
of c
ycle
s
Date
2001
2002
2003
2004
2005
2006
2007
2008
2009
2010
2011
2012
2013
2014
0
100
200
300
400
500
600
700
800
900
Cycles
Patients
25Human Fertilisation and Embryology AuthorityFertility treatment 2014 – Trends and figures
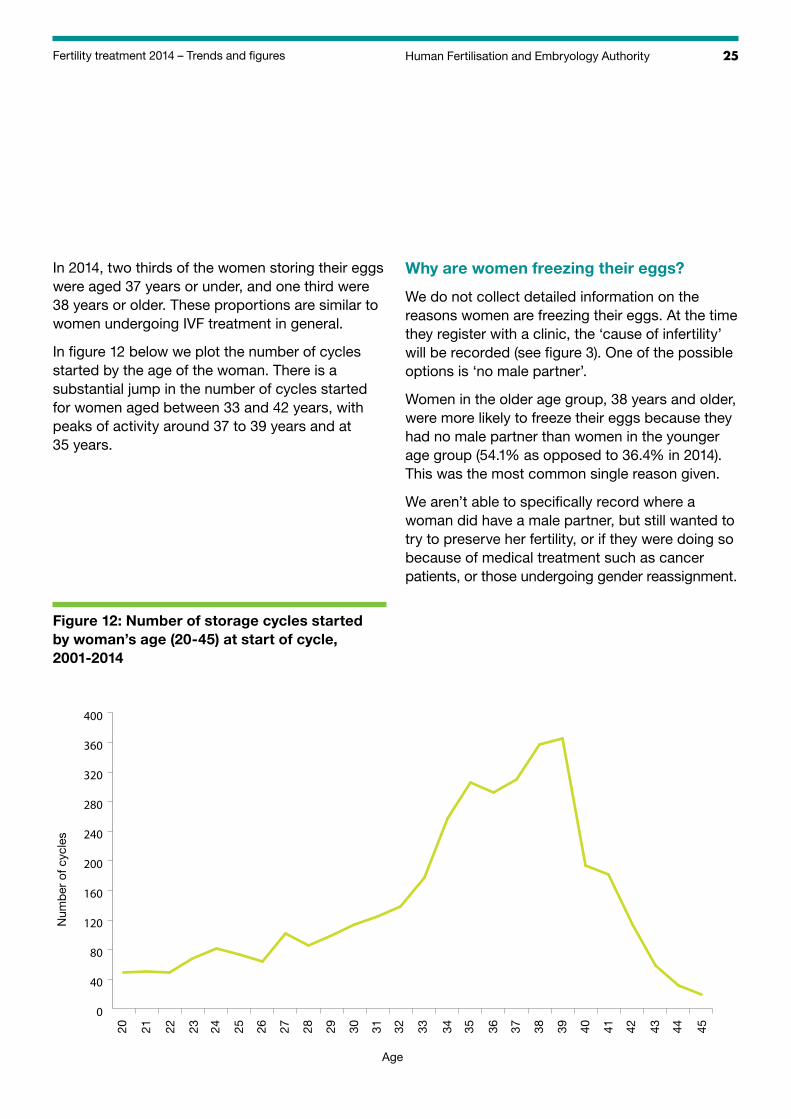
In 2014, two thirds of the women storing their eggs were aged 37 years or under, and one third were 38 years or older. These proportions are similar to women undergoing IVF treatment in general.
In figure 12 below we plot the number of cycles started by the age of the woman. There is a substantial jump in the number of cycles started for women aged between 33 and 42 years, with peaks of activity around 37 to 39 years and at 35 years.
Why are women freezing their eggs?
We do not collect detailed information on the reasons women are freezing their eggs. At the time they register with a clinic, the ‘cause of infertility’ will be recorded (see figure 3). One of the possible options is ‘no male partner’.
Women in the older age group, 38 years and older, were more likely to freeze their eggs because they had no male partner than women in the younger age group (54.1% as opposed to 36.4% in 2014). This was the most common single reason given.
We aren’t able to specifically record where a woman did have a male partner, but still wanted to try to preserve her fertility, or if they were doing so because of medical treatment such as cancer patients, or those undergoing gender reassignment.
Figure 12: Number of storage cycles started by woman’s age (20-45) at start of cycle, 2001-2014
Num
ber
of c
ycle
s
Age
20 21 22 23 24 25 26 27 28 29 30 31 32 44
0
40
80
120
160
200
240
280
320
360
400
33 34 35 36 37 38 39 40 41 42 43 45
26 Fertility treatment 2014 – Trends and figures Human Fertilisation and Embryology Authority
These are likely to be entered as ‘other’. In both groups, the second most common reason given was ‘other’ (32.1% for women aged 37 years or under and 16.0% for women aged 38 years and over).
Further given reasons are unexplained infertility, and low sperm count.
How many clinics perform this treatment?
65 clinics reported storing eggs for a patient’s own treatment in 2014, compared to 55 in 2013.
Most of these clinics only perform a handful of cycles each year. In 2014, eight clinics performed half of the total storage cycles; 39 clinics performed fewer than 10 cycles each.
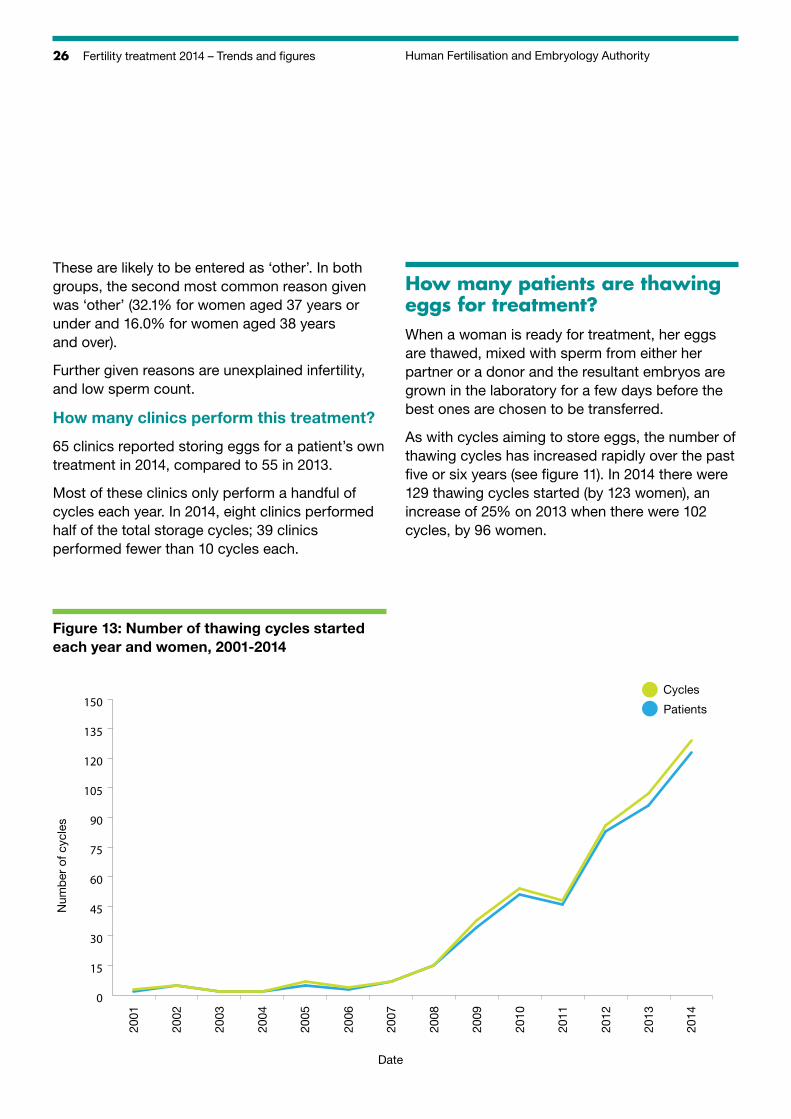
How many patients are thawing eggs for treatment?When a woman is ready for treatment, her eggs are thawed, mixed with sperm from either her partner or a donor and the resultant embryos are grown in the laboratory for a few days before the best ones are chosen to be transferred.
As with cycles aiming to store eggs, the number of thawing cycles has increased rapidly over the past five or six years (see figure 11). In 2014 there were 129 thawing cycles started (by 123 women), an increase of 25% on 2013 when there were 102 cycles, by 96 women.
Figure 13: Number of thawing cycles started each year and women, 2001-2014
0
15
30
45
60
75
90
105
120
135
150
Num
ber
of c
ycle
s
Date
2001
2002
2003
2004
2005
2006
2007
2008
2009
2010
2011
2012
2013
2014
Cycles
Patients
27Human Fertilisation and Embryology AuthorityFertility treatment 2014 – Trends and figures
How many clinics perform this treatment?
38 clinics reported thawing eggs for a patient’s own treatment in 2014, compared to 32 in 2013.
As with storing cycles, most of the clinics only do a handful of cycles each year. In 2014, only one centre performed more than 10 thawing cycles; in 2013, none did.
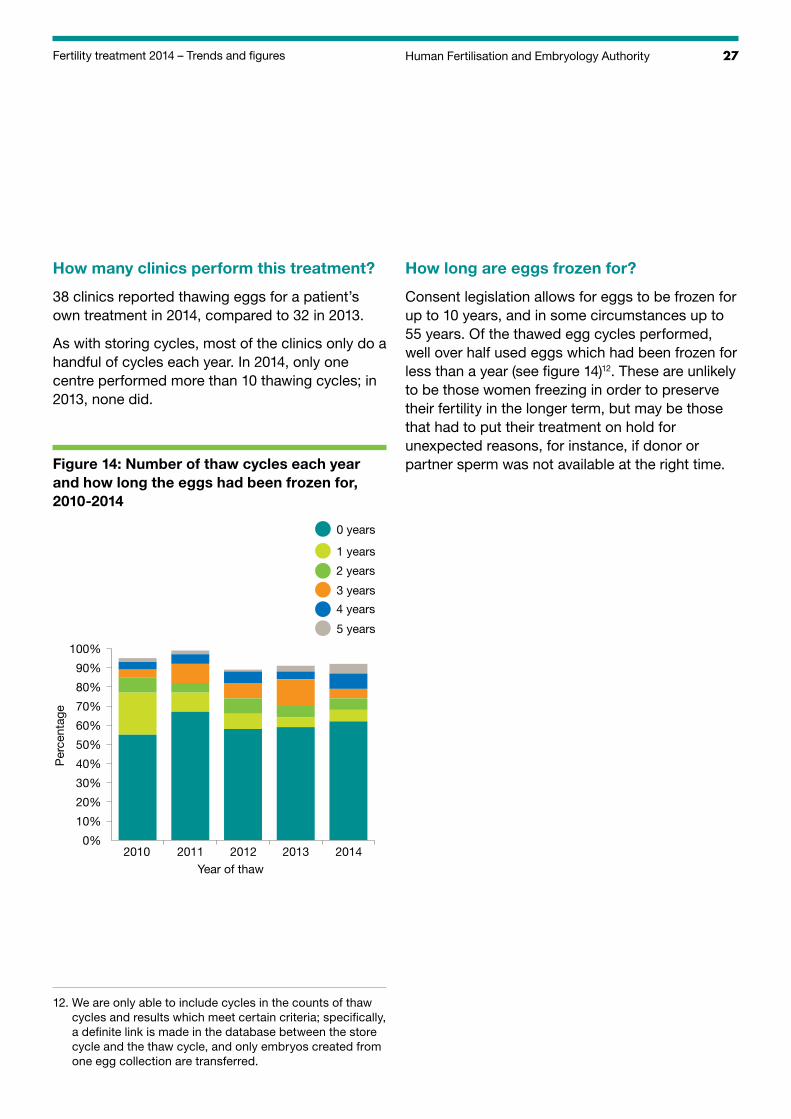
Figure 14: Number of thaw cycles each year and how long the eggs had been frozen for, 2010-2014
Per
cent
age
2010 2011 2012 2013 2014Year of thaw
0%
10%
20%
30%
40%
50%
60%
70%
80%
90%
100%
1 years
2 years
3 years
4 years
5 years
0 years
How long are eggs frozen for?
Consent legislation allows for eggs to be frozen for up to 10 years, and in some circumstances up to 55 years. Of the thawed egg cycles performed, well over half used eggs which had been frozen for less than a year (see figure 14)12. These are unlikely to be those women freezing in order to preserve their fertility in the longer term, but may be those that had to put their treatment on hold for unexpected reasons, for instance, if donor or partner sperm was not available at the right time.
12. W e are only able to include cycles in the counts of thaw cycles and results which meet certain criteria; specifically, a definite link is made in the database between the store cycle and the thaw cycle, and only embryos created from one egg collection are transferred.
28 Fertility treatment 2014 – Trends and figures Human Fertilisation and Embryology Authority
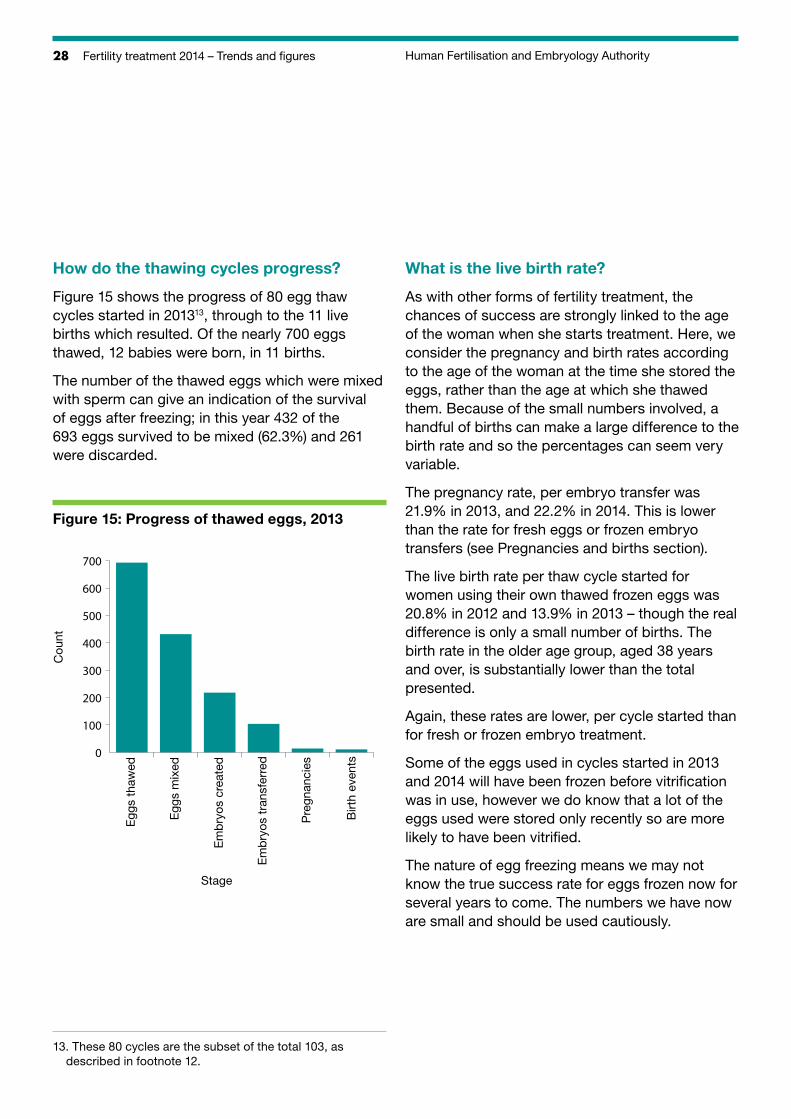
How do the thawing cycles progress?
Figure 15 shows the progress of 80 egg thaw cycles started in 201313, through to the 11 live births which resulted. Of the nearly 700 eggs thawed, 12 babies were born, in 11 births.
The number of the thawed eggs which were mixed with sperm can give an indication of the survival of eggs after freezing; in this year 432 of the 693 eggs survived to be mixed (62.3%) and 261 were discarded.
Figure 15: Progress of thawed eggs, 2013
Cou
nt
Egg
s th
awed
Egg
s m
ixed
Em
bry
os c
reat
ed
Em
bry
os t
rans
ferr
ed
Pre
gnan
cies
Birt
h ev
ents
Stage
0
100
200
300
400
500
600
700
What is the live birth rate?
As with other forms of fertility treatment, the chances of success are strongly linked to the age of the woman when she starts treatment. Here, we consider the pregnancy and birth rates according to the age of the woman at the time she stored the eggs, rather than the age at which she thawed them. Because of the small numbers involved, a handful of births can make a large difference to the birth rate and so the percentages can seem very variable.
The pregnancy rate, per embryo transfer was 21.9% in 2013, and 22.2% in 2014. This is lower than the rate for fresh eggs or frozen embryo transfers (see Pregnancies and births section).
The live birth rate per thaw cycle started for women using their own thawed frozen eggs was 20.8% in 2012 and 13.9% in 2013 – though the real difference is only a small number of births. The birth rate in the older age group, aged 38 years and over, is substantially lower than the total presented.
Again, these rates are lower, per cycle started than for fresh or frozen embryo treatment.
Some of the eggs used in cycles started in 2013 and 2014 will have been frozen before vitrification was in use, however we do know that a lot of the eggs used were stored only recently so are more likely to have been vitrified.
The nature of egg freezing means we may not know the true success rate for eggs frozen now for several years to come. The numbers we have now are small and should be used cautiously.
13. These 80 cycles are the subset of the total 103, as described in footnote 12.
29Human Fertilisation and Embryology AuthorityFertility treatment 2014 – Trends and figures
Key points
There has been a substantial and sustained increase in the number of patients freezing their eggs for their own future treatment. However, the overall numbers are still low – fewer than 1,000 patients a year – and represent a small fraction of the number of patients undergoing IVF, which is over 50,000.
The single most common reason given for freezing was having no male partner. Depending on age, between a third and half of the women froze their eggs because of this.
Two thirds of women freezing eggs were aged under 38 years; the most common age to freeze eggs is between 37 and 39.
Over half of the eggs thawed for use had been stored for less than a year.
The overall live birth rate per thawed cycle started in 2013 was 14%. The success rate is affected by the age of the woman at the time her eggs were frozen and was considerably lower for women in the older age group. The birth rate per cycle is lower than that for treatment using fresh eggs, or thawed frozen embryos.
Since 2001, fewer than 60 babies have been born to patients storing and thawing their own eggs. This is a low number considering the attention egg freezing receives, but this is a new, emerging treatment area which we will continue to monitor.
30 Fertility treatment 2014 – Trends and figures Human Fertilisation and Embryology Authority
Pregnancies and birthsIVF cycles using a woman’s own fresh own eggs 31
How many pregnancies resulted from IVF treatment using a woman’s own fresh eggs? 31
How is the pregnancy rate affected by the woman’s age? 31
Does the pregnancy rate differ when one or two cleavage or blastocyst embryos are transferred? 32
What is the multiple birth rate for IVF treatment using a woman’s own fresh eggs? 33
Does the multiple pregnancy rate differ when one or two cleavage or blastocyst embryos are transferred? 33
What is the live birth rate for IVF treatment using a woman’s own fresh eggs? 34
Donor conception treatment 38
31Human Fertilisation and Embryology AuthorityFertility treatment 2014 – Trends and figures
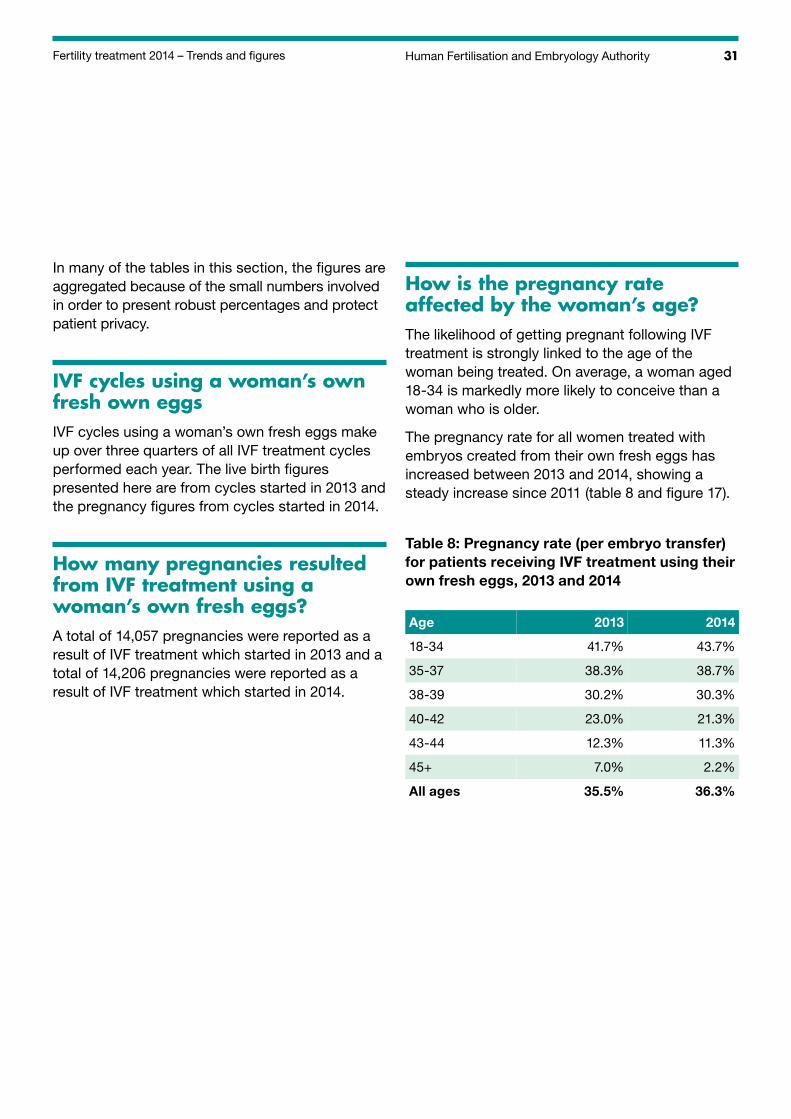
In many of the tables in this section, the figures are aggregated because of the small numbers involved in order to present robust percentages and protect patient privacy.
IVF cycles using a woman’s own fresh own eggsIVF cycles using a woman’s own fresh eggs make up over three quarters of all IVF treatment cycles performed each year. The live birth figures presented here are from cycles started in 2013 and the pregnancy figures from cycles started in 2014.
How many pregnancies resulted from IVF treatment using a woman’s own fresh eggs?A total of 14,057 pregnancies were reported as a result of IVF treatment which started in 2013 and a total of 14,206 pregnancies were reported as a result of IVF treatment which started in 2014.
How is the pregnancy rate affected by the woman’s age?The likelihood of getting pregnant following IVF treatment is strongly linked to the age of the woman being treated. On average, a woman aged 18-34 is markedly more likely to conceive than a woman who is older.
The pregnancy rate for all women treated with embryos created from their own fresh eggs has increased between 2013 and 2014, showing a steady increase since 2011 (table 8 and figure 17).
Table 8: Pregnancy rate (per embryo transfer) for patients receiving IVF treatment using their own fresh eggs, 2013 and 2014
Age 2013 2014
18-34 41.7% 43.7%
35-37 38.3% 38.7%
38-39 30.2% 30.3%
40-42 23.0% 21.3%
43-44 12.3% 11.3%
45+ 7.0% 2.2%
All ages 35.5% 36.3%
32 Fertility treatment 2014 – Trends and figures Human Fertilisation and Embryology Authority
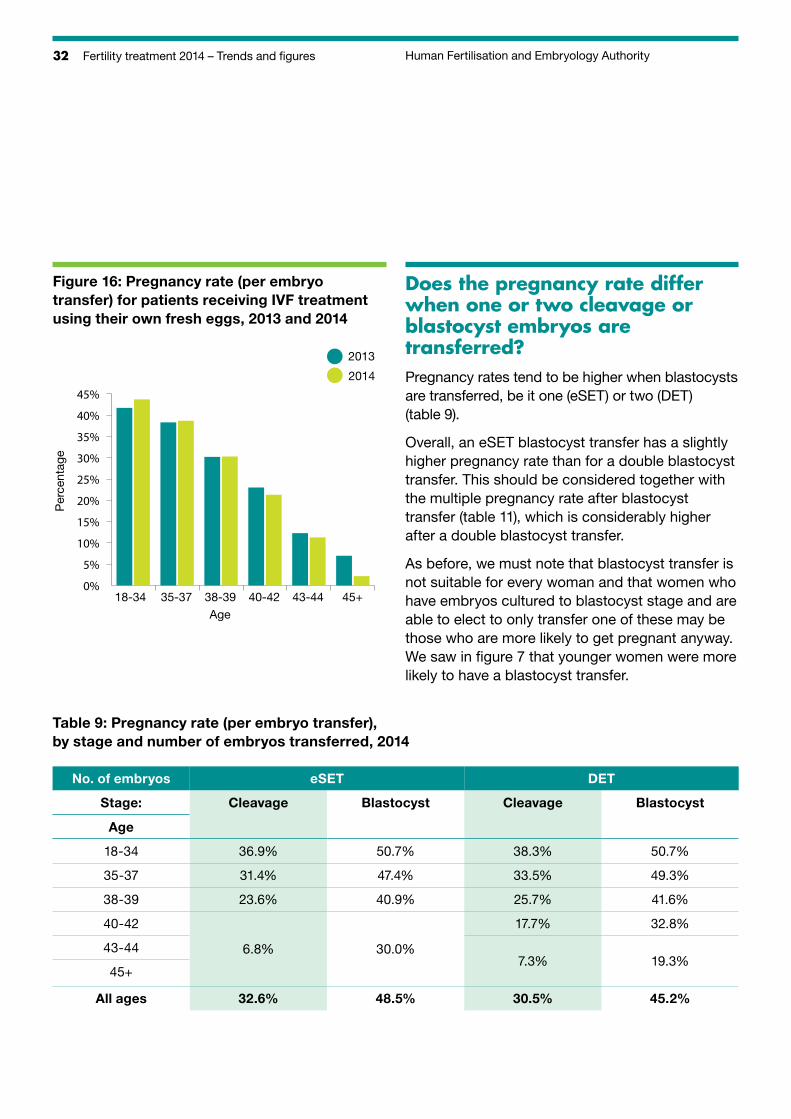
Figure 16: Pregnancy rate (per embryo transfer) for patients receiving IVF treatment using their own fresh eggs, 2013 and 2014
Per
cent
age
18-34 35-37 38-39 40-42 43-44 45+Age
0%
5%
10%
15%
20%
25%
30%
35%
40%
45%
2013
2014
Does the pregnancy rate differ when one or two cleavage or blastocyst embryos are transferred?Pregnancy rates tend to be higher when blastocysts are transferred, be it one (eSET) or two (DET) (table 9).
Overall, an eSET blastocyst transfer has a slightly higher pregnancy rate than for a double blastocyst transfer. This should be considered together with the multiple pregnancy rate after blastocyst transfer (table 11), which is considerably higher after a double blastocyst transfer.
As before, we must note that blastocyst transfer is not suitable for every woman and that women who have embryos cultured to blastocyst stage and are able to elect to only transfer one of these may be those who are more likely to get pregnant anyway. We saw in figure 7 that younger women were more likely to have a blastocyst transfer.
Table 9: Pregnancy rate (per embryo transfer), by stage and number of embryos transferred, 2014
No. of embryos eSET DET
Stage: Cleavage Blastocyst Cleavage Blastocyst
Age
18-34 36.9% 50.7% 38.3% 50.7%
35-37 31.4% 47.4% 33.5% 49.3%
38-39 23.6% 40.9% 25.7% 41.6%
40-42 17.7% 32.8%
43-44 6.8% 30.0%7.3% 19.3%
45+
All ages 32.6% 48.5% 30.5% 45.2%
33Human Fertilisation and Embryology AuthorityFertility treatment 2014 – Trends and figures
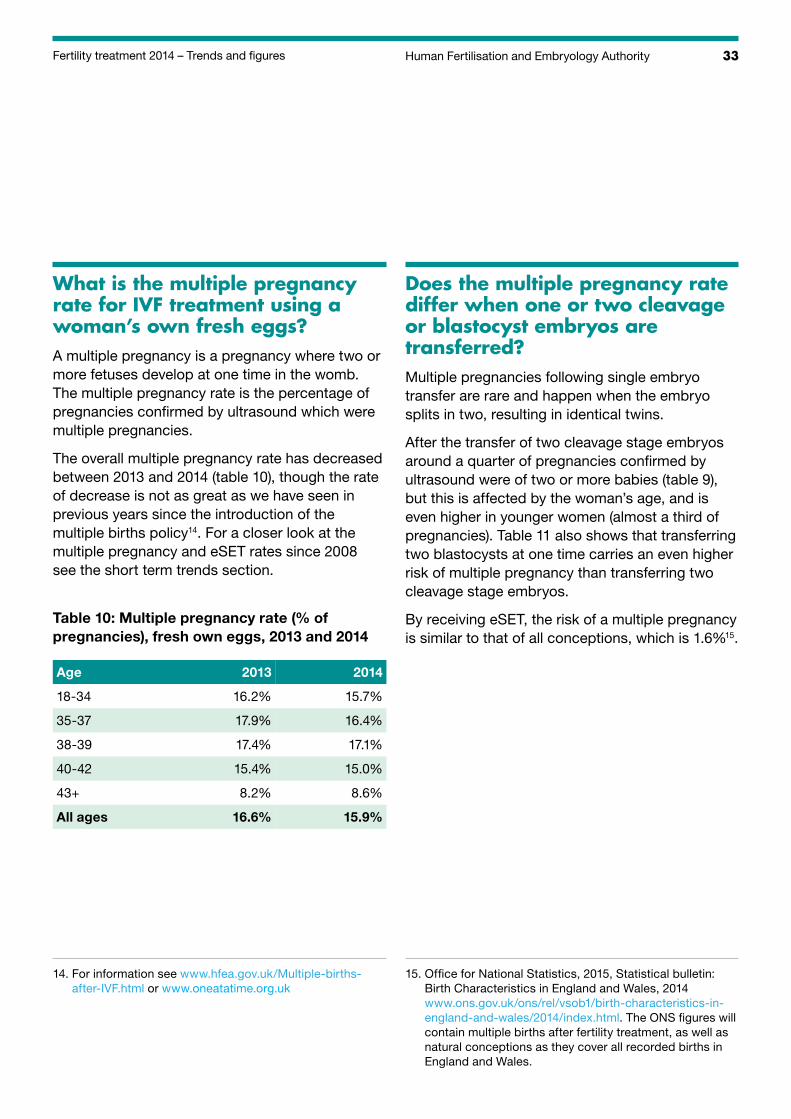
What is the multiple pregnancy rate for IVF treatment using a woman’s own fresh eggs?A multiple pregnancy is a pregnancy where two or more fetuses develop at one time in the womb. The multiple pregnancy rate is the percentage of pregnancies confirmed by ultrasound which were multiple pregnancies.
The overall multiple pregnancy rate has decreased between 2013 and 2014 (table 10), though the rate of decrease is not as great as we have seen in previous years since the introduction of the multiple births policy14. For a closer look at the multiple pregnancy and eSET rates since 2008 see the short term trends section.
Table 10: Multiple pregnancy rate (% of pregnancies), fresh own eggs, 2013 and 2014
Age 2013 2014
18-34 16.2% 15.7%
35-37 17.9% 16.4%
38-39 17.4% 17.1%
40-42 15.4% 15.0%
43+ 8.2% 8.6%
All ages 16.6% 15.9%
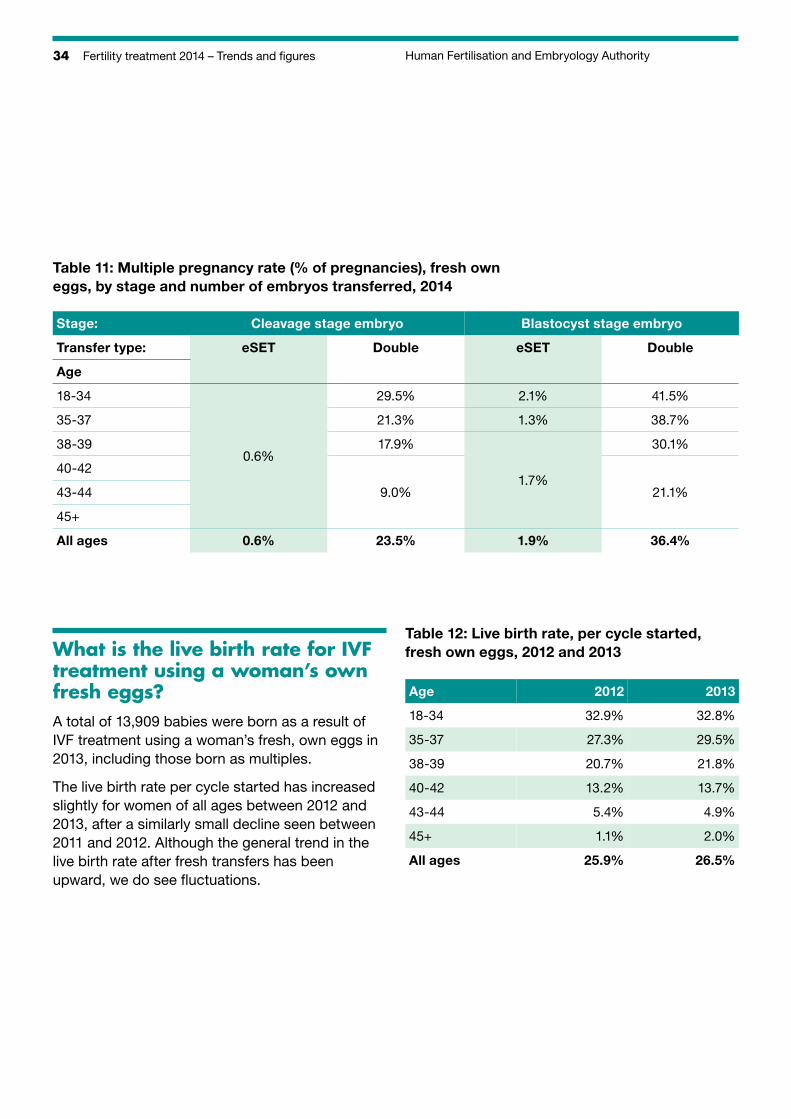
Does the multiple pregnancy rate differ when one or two cleavage or blastocyst embryos are transferred?Multiple pregnancies following single embryo transfer are rare and happen when the embryo splits in two, resulting in identical twins.
After the transfer of two cleavage stage embryos around a quarter of pregnancies confirmed by ultrasound were of two or more babies (table 9), but this is affected by the woman’s age, and is even higher in younger women (almost a third of pregnancies). Table 11 also shows that transferring two blastocysts at one time carries an even higher risk of multiple pregnancy than transferring two cleavage stage embryos.
By receiving eSET, the risk of a multiple pregnancy is similar to that of all conceptions, which is 1.6%15.
14. For information see www.hfea.gov.uk/Multiple-births-after-IVF.html or www.oneatatime.org.uk
15. Office for National Statistics, 2015, Statistical bulletin: Birth Characteristics in England and Wales, 2014 www.ons.gov.uk/ons/rel/vsob1/birth-characteristics-in-england-and-wales/2014/index.html. The ONS figures will contain multiple births after fertility treatment, as well as natural conceptions as they cover all recorded births in England and Wales.
34 Fertility treatment 2014 – Trends and figures Human Fertilisation and Embryology Authority
Table 11: Multiple pregnancy rate (% of pregnancies), fresh own eggs, by stage and number of embryos transferred, 2014
Stage: Cleavage stage embryo Blastocyst stage embryo
Transfer type: eSET Double eSET Double
Age
18-34 29.5% 2.1% 41.5%
35-37 21.3% 1.3% 38.7%
38-39 17.9% 30.1%0.6%
40-421.7%
43-44 9.0% 21.1%
45+
All ages 0.6% 23.5% 1.9% 36.4%
What is the live birth rate for IVF treatment using a woman’s own fresh eggs?A total of 13,909 babies were born as a result of IVF treatment using a woman’s fresh, own eggs in 2013, including those born as multiples.
The live birth rate per cycle started has increased slightly for women of all ages between 2012 and 2013, after a similarly small decline seen between 2011 and 2012. Although the general trend in the live birth rate after fresh transfers has been upward, we do see fluctuations.
Table 12: Live birth rate, per cycle started, fresh own eggs, 2012 and 2013
Age 2012 2013
18-34 32.9% 32.8%
35-37 27.3% 29.5%
38-39 20.7% 21.8%
40-42 13.2% 13.7%
43-44 5.4% 4.9%
45+ 1.1% 2.0%
All ages 25.9% 26.5%
35Human Fertilisation and Embryology AuthorityFertility treatment 2014 – Trends and figures
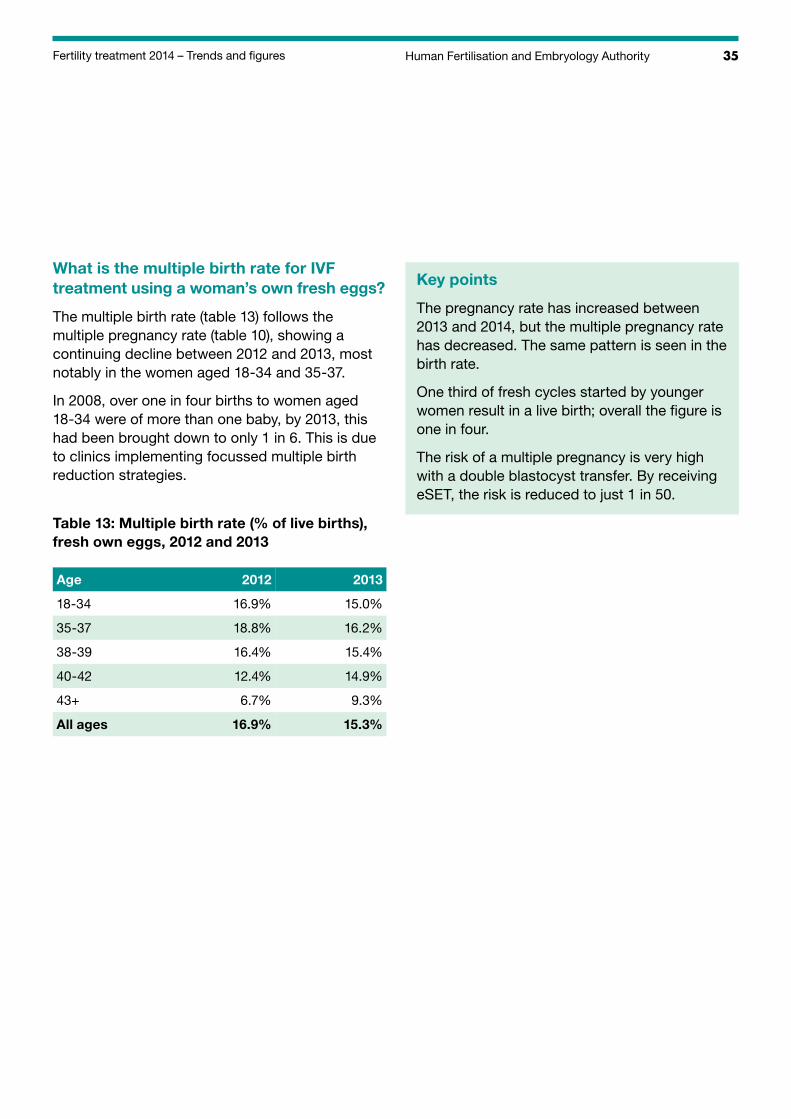
What is the multiple birth rate for IVF treatment using a woman’s own fresh eggs?
The multiple birth rate (table 13) follows the multiple pregnancy rate (table 10), showing a continuing decline between 2012 and 2013, most notably in the women aged 18-34 and 35-37.
In 2008, over one in four births to women aged 18-34 were of more than one baby, by 2013, this had been brought down to only 1 in 6. This is due to clinics implementing focussed multiple birth reduction strategies.
Table 13: Multiple birth rate (% of live births), fresh own eggs, 2012 and 2013
Age 2012 2013
18-34 16.9% 15.0%
35-37 18.8% 16.2%
38-39 16.4% 15.4%
40-42 12.4% 14.9%
43+ 6.7% 9.3%
All ages 16.9% 15.3%
Key points
The pregnancy rate has increased between 2013 and 2014, but the multiple pregnancy rate has decreased. The same pattern is seen in the birth rate.
One third of fresh cycles started by younger women result in a live birth; overall the figure is one in four.
The risk of a multiple pregnancy is very high with a double blastocyst transfer. By receiving eSET, the risk is reduced to just 1 in 50.
36 Fertility treatment 2014 – Trends and figures Human Fertilisation and Embryology Authority
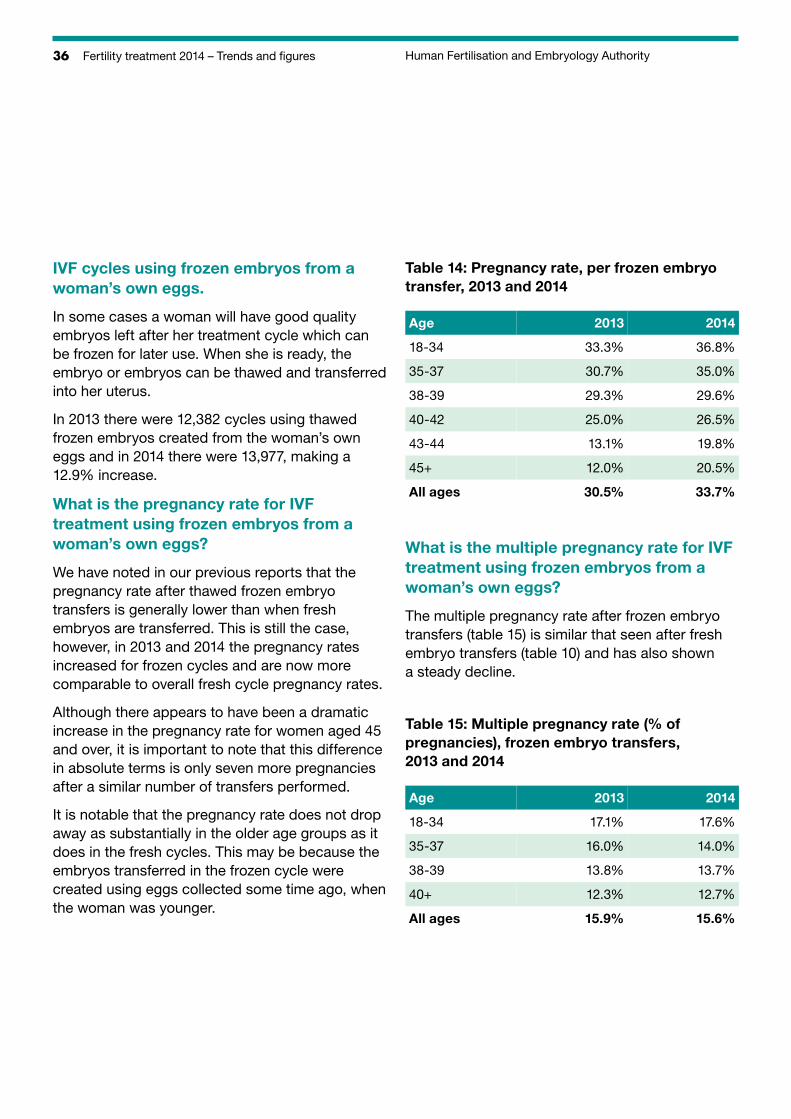
IVF cycles using frozen embryos from a woman’s own eggs.
In some cases a woman will have good quality embryos left after her treatment cycle which can be frozen for later use. When she is ready, the embryo or embryos can be thawed and transferred into her uterus.
In 2013 there were 12,382 cycles using thawed frozen embryos created from the woman’s own eggs and in 2014 there were 13,977, making a 12.9% increase.
What is the pregnancy rate for IVF treatment using frozen embryos from a woman’s own eggs?
We have noted in our previous reports that the pregnancy rate after thawed frozen embryo transfers is generally lower than when fresh embryos are transferred. This is still the case, however, in 2013 and 2014 the pregnancy rates increased for frozen cycles and are now more comparable to overall fresh cycle pregnancy rates.
Although there appears to have been a dramatic increase in the pregnancy rate for women aged 45 and over, it is important to note that this difference in absolute terms is only seven more pregnancies after a similar number of transfers performed.
It is notable that the pregnancy rate does not drop away as substantially in the older age groups as it does in the fresh cycles. This may be because the embryos transferred in the frozen cycle were created using eggs collected some time ago, when the woman was younger.
Table 14: Pregnancy rate, per frozen embryo transfer, 2013 and 2014
Age 2013 2014
18-34 33.3% 36.8%
35-37 30.7% 35.0%
38-39 29.3% 29.6%
40-42 25.0% 26.5%
43-44 13.1% 19.8%
45+ 12.0% 20.5%
All ages 30.5% 33.7%
What is the multiple pregnancy rate for IVF treatment using frozen embryos from a woman’s own eggs?
The multiple pregnancy rate after frozen embryo transfers (table 15) is similar that seen after fresh embryo transfers (table 10) and has also shown a steady decline.
Table 15: Multiple pregnancy rate (% of pregnancies), frozen embryo transfers, 2013 and 2014
Age 2013 2014
18-34 17.1% 17.6%
35-37 16.0% 14.0%
38-39 13.8% 13.7%
40+ 12.3% 12.7%
All ages 15.9% 15.6%
37Human Fertilisation and Embryology AuthorityFertility treatment 2014 – Trends and figures
What is the live birth rate for IVF treatment using frozen embryos from a woman’s own eggs?
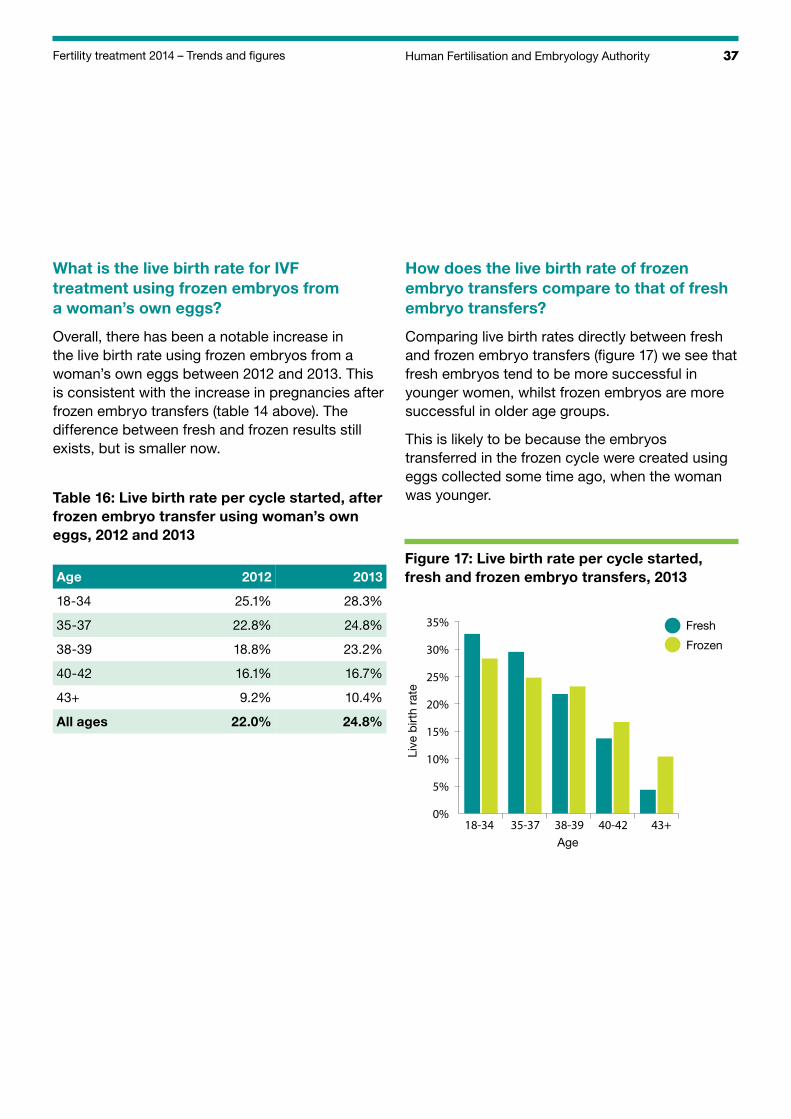
Overall, there has been a notable increase in the live birth rate using frozen embryos from a woman’s own eggs between 2012 and 2013. This is consistent with the increase in pregnancies after frozen embryo transfers (table 14 above). The difference between fresh and frozen results still exists, but is smaller now.
Table 16: Live birth rate per cycle started, after frozen embryo transfer using woman’s own eggs, 2012 and 2013
Age 2012 2013
18-34 25.1% 28.3%
35-37 22.8% 24.8%
38-39 18.8% 23.2%
40-42 16.1% 16.7%
43+ 9.2% 10.4%
All ages 22.0% 24.8%
How does the live birth rate of frozen embryo transfers compare to that of fresh embryo transfers?
Comparing live birth rates directly between fresh and frozen embryo transfers (figure 17) we see that fresh embryos tend to be more successful in younger women, whilst frozen embryos are more successful in older age groups.
This is likely to be because the embryos transferred in the frozen cycle were created using eggs collected some time ago, when the woman was younger.
Figure 17: Live birth rate per cycle started, fresh and frozen embryo transfers, 2013
Live
birt
h ra
te
18-34 35-37 38-39 40-42 43+Age
0%
5%
10%
15%
20%
25%
30%
35% Fresh
Frozen
38 Fertility treatment 2014 – Trends and figures Human Fertilisation and Embryology Authority
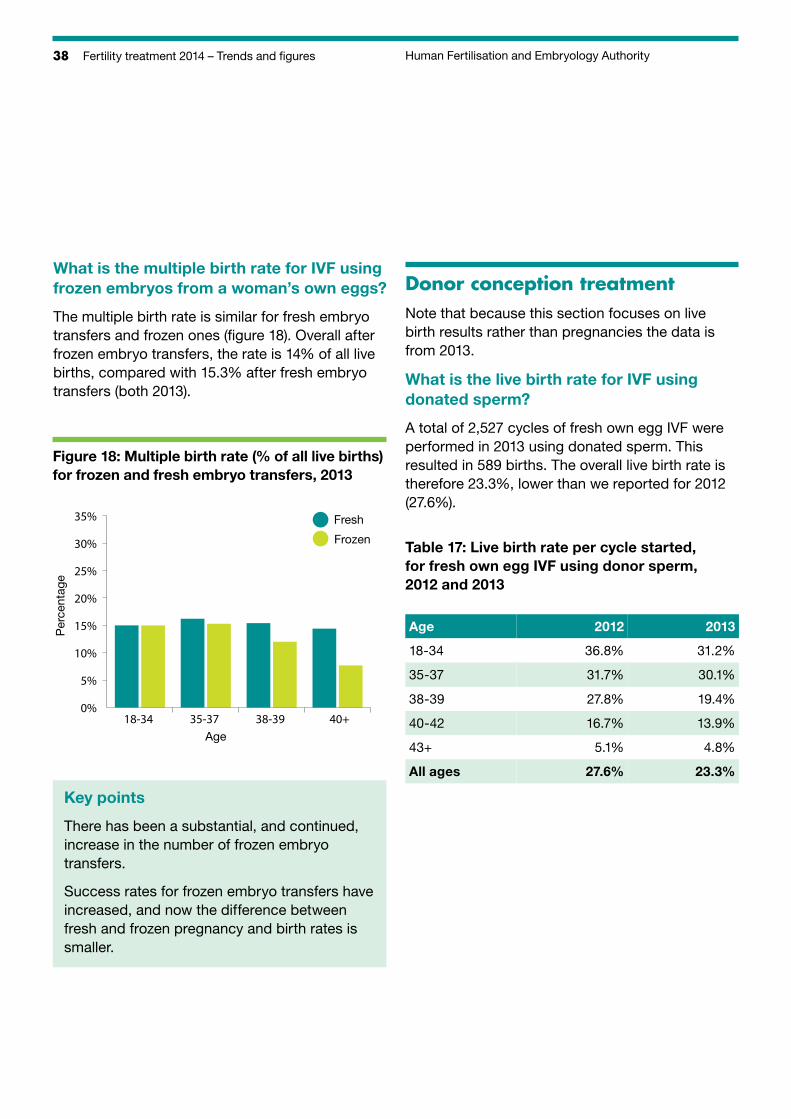
What is the multiple birth rate for IVF using frozen embryos from a woman’s own eggs?
The multiple birth rate is similar for fresh embryo transfers and frozen ones (figure 18). Overall after frozen embryo transfers, the rate is 14% of all live births, compared with 15.3% after fresh embryo transfers (both 2013).
Figure 18: Multiple birth rate (% of all live births) for frozen and fresh embryo transfers, 2013
Per
cent
age
18-34 35-37 38-39 40+0%
5%
10%
15%
20%
25%
30%
35% Fresh
Frozen
Age
Key points
There has been a substantial, and continued, increase in the number of frozen embryo transfers.
Success rates for frozen embryo transfers have increased, and now the difference between fresh and frozen pregnancy and birth rates is smaller.
Donor conception treatmentNote that because this section focuses on live birth results rather than pregnancies the data is from 2013.
What is the live birth rate for IVF using donated sperm?
A total of 2,527 cycles of fresh own egg IVF were performed in 2013 using donated sperm. This resulted in 589 births. The overall live birth rate is therefore 23.3%, lower than we reported for 2012 (27.6%).
Table 17: Live birth rate per cycle started, for fresh own egg IVF using donor sperm, 2012 and 2013
Age 2012 2013
18-34 36.8% 31.2%
35-37 31.7% 30.1%
38-39 27.8% 19.4%
40-42 16.7% 13.9%
43+ 5.1% 4.8%
All ages 27.6% 23.3%
39Human Fertilisation and Embryology AuthorityFertility treatment 2014 – Trends and figures
What is the live birth rate for IVF using donated eggs?
A total of 1,866 cycles of fresh donor egg IVF were performed in 2013 using partner sperm. This resulted in 597 births; the overall live birth rate was therefore 32.0%, a decrease on the rate seen in 2012 (37.1%), back to similar levels seen in 2010 (32.4%) and 2011 (32.8%).
Table 18: Live birth rate per IVF treatment cycle started using fresh donated eggs and partner sperm, 2012 and 2013
Age 2012 2013
18-34 35.1% 30.7%
35-37 40.8% 34.4%
38-39 39.3% 32.7%
40-42 40.3% 32.3%
43-44 33.0% 34.8%
45+ 35.3% 29.3%
All ages 37.1% 32.0%
What is the live birth rate for egg share cycles?
In 2013, 709 women donated eggs as part of an egg sharing cycle, 762 of which were performed. In the women donating eggs, this resulted in 290 live births (a live birth rate per cycle started of 38.1%), including 60 multiple births.
A total of 707 women received eggs as part of an egg sharing arrangement, in 734 cycles. This resulted in 257 live births (a live birth rate per cycle started of 35.0%), including 48 multiple births.
What is the live birth rate for IVF cycles using donated eggs and donated sperm?
As noted on page 19, some cycles use donated eggs and donated sperm, or donated embryos. We also noted that many embryos are donated frozen, so the following results are for both fresh and frozen cycles. Further data can be found in the accompanying datasheet.
Table 19: Live birth rate per IVF treatment cycle started using donated eggs and donated sperm, 2012 and 2013
Age 2012 2013
18-34 34.4% 30.2%
35-39 30.4% 28.4%
40-42 21.1% 28.0%
43+ 28.9% 29.6%
All ages 29.1% 29.3%
40 Fertility treatment 2014 – Trends and figures Human Fertilisation and Embryology Authority
What is the live birth rate for DI?
A total of 4,624 cycles of DI were performed in 2013. This resulted in 590 births.
Some women receive fertility drugs to boost egg production before the sperm is transferred and these stimulated cycles are presented separately from unstimulated cycles (where there is no treatment with fertility drugs before insemination), as the success rates are quite different.
The overall live birth rates (14.7% for stimulated DI and 11.2% for unstimulated DI) are around the same as those seen in previous years.
Table 20: Live birth rate per DI cycle started, 2013
Age Stimulated Unstimulated
18-34 21.6% 13.9%
35-37 12.0% 12.8%
38-39 8.8% 8.4%
40+ 4.8% 3.0%
All ages 14.6% 11.2%
How many couples in same-sex partnerships had treatment, and what were the live birth rates?
A total of 1285 cycles of IVF were performed in women who registered with a female partner in 2014, 20% more than in 2013; a similar year on year increase has been seen for at least 10 years. The 1070 cycles in 2013 resulted in 325 live births and 379 babies being born. The live birth rate per cycle started was therefore 30.4% a slight decrease 2012 (32.0%).
A total of 1,822 cycles of DI were performed in women who registered with a female partner in 2013, again around 20% more than in 2013. The 1533 cycles in 2013 resulted in 194 live births and 211 babies being born. The live birth rate per cycle started was therefore 12.7%, a slight decrease on 2012 (14.6%).
Data for more years can be found in the datasheet accompanying this report: www.hfea.gov.uk/10243.html
Key points
The number of treatment cycles using donated sperm (both IVF and DI) has increased between 2013 and 2014.
Stimulated DI cycles tend to have a higher success rate than unstimulated ones.

41Human Fertilisation and Embryology Authority Fertility treatment 2014 – Trends and figures
TrendsShort term trends 42
Long-term trends 46
42 Fertility treatment 2014 – Trends and figures Human Fertilisation and Embryology Authority
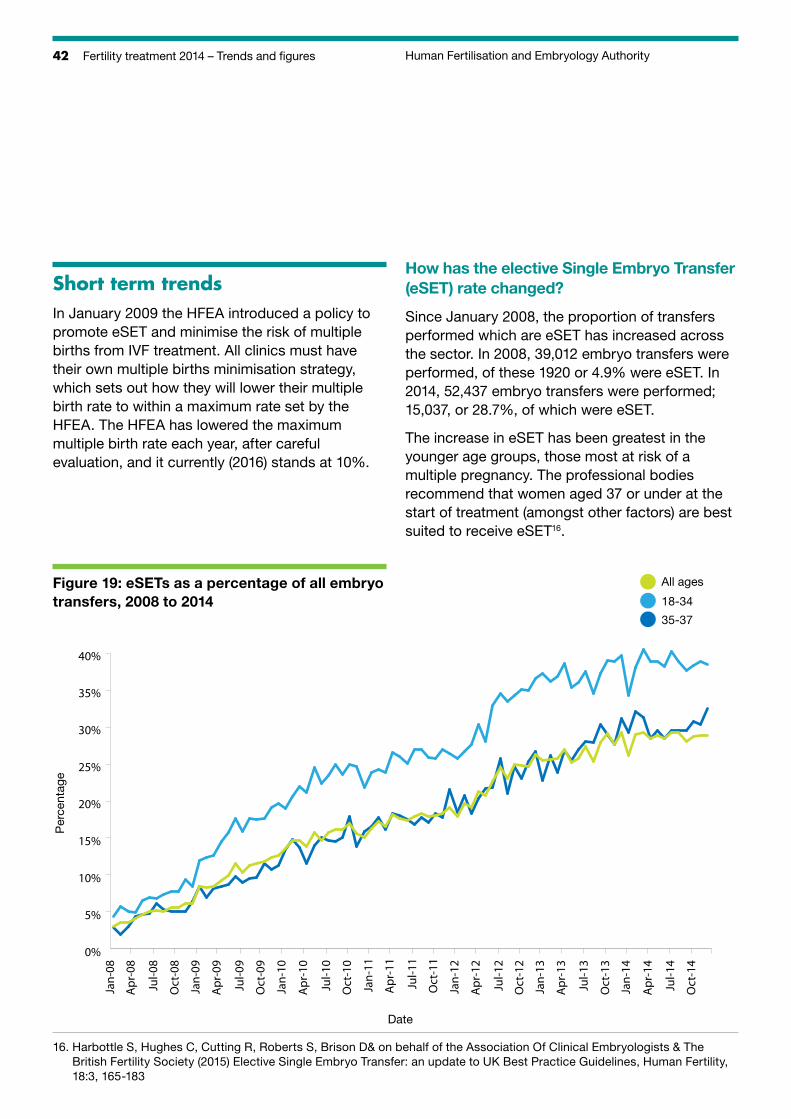
Short term trendsIn January 2009 the HFEA introduced a policy to promote eSET and minimise the risk of multiple births from IVF treatment. All clinics must have their own multiple births minimisation strategy, which sets out how they will lower their multiple birth rate to within a maximum rate set by the HFEA. The HFEA has lowered the maximum multiple birth rate each year, after careful evaluation, and it currently (2016) stands at 10%.
How has the elective Single Embryo Transfer (eSET) rate changed?
Since January 2008, the proportion of transfers performed which are eSET has increased across the sector. In 2008, 39,012 embryo transfers were performed, of these 1920 or 4.9% were eSET. In 2014, 52,437 embryo transfers were performed; 15,037, or 28.7%, of which were eSET.
The increase in eSET has been greatest in the younger age groups, those most at risk of a multiple pregnancy. The professional bodies recommend that women aged 37 or under at the start of treatment (amongst other factors) are best suited to receive eSET16.
Figure 19: eSETs as a percentage of all embryo transfers, 2008 to 2014
Per
cent
age
Date
0%
5%
10%
15%
20%
25%
30%
35%
40%
Jan-08
Jul-0
8
Jan-09
Jul-0
9
Jan-10
Jul-1
0
Jan-11
Jul-1
1
Jan-12
Jul-1
2
Jan-13
Jul-1
3
Jan-14
Jul-1
4
Apr-08
Oct-08
Apr-09
Oct-09
Apr-10
Oct-10
Apr-11
Oct-11
Apr-12
Oct-12
Apr-13
Oct-13
Apr-14
Oct-14
All ages
18-34
35-37
16. H arbottle S, Hughes C, Cutting R, Roberts S, Brison D& on behalf of the Association Of Clinical Embryologists & The British Fertility Society (2015) Elective Single Embryo Transfer: an update to UK Best Practice Guidelines, Human Fertility, 18:3, 165-183
43Human Fertilisation and Embryology AuthorityFertility treatment 2014 – Trends and figures
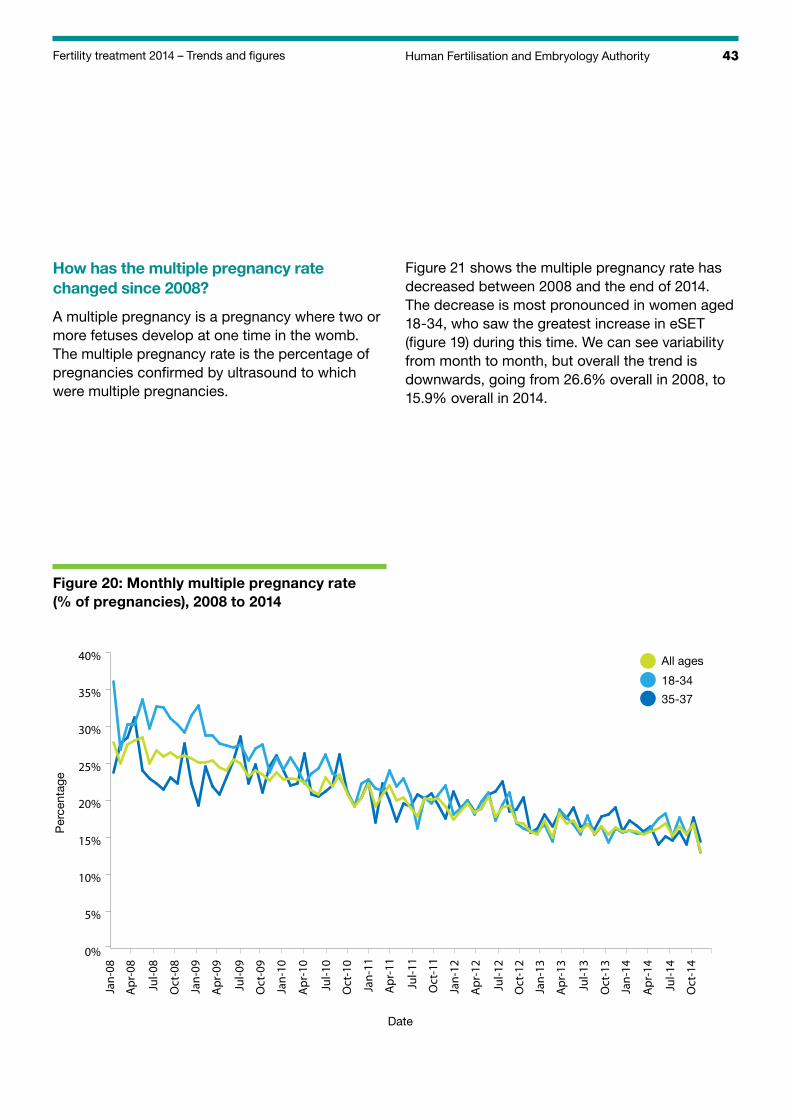
How has the multiple pregnancy rate changed since 2008?
A multiple pregnancy is a pregnancy where two or more fetuses develop at one time in the womb. The multiple pregnancy rate is the percentage of pregnancies confirmed by ultrasound to which were multiple pregnancies.
Figure 21 shows the multiple pregnancy rate has decreased between 2008 and the end of 2014. The decrease is most pronounced in women aged 18-34, who saw the greatest increase in eSET (figure 19) during this time. We can see variability from month to month, but overall the trend is downwards, going from 26.6% overall in 2008, to 15.9% overall in 2014.
Figure 20: Monthly multiple pregnancy rate (% of pregnancies), 2008 to 2014
Per
cent
age
Date
0%
5%
10%
15%
20%
25%
30%
35%
40%
Jan-08
Jul-0
8
Jan-09
Jul-0
9
Jan-10
Jul-1
0
Jan-11
Jul-1
1
Jan-12
Jul-1
2
Jan-13
Jul-1
3
Jan-14
Jul-1
4
Apr-08
Oct-08
Apr-09
Oct-09
Apr-10
Oct-10
Apr-11
Oct-11
Apr-12
Oct-12
Apr-13
Oct-13
Apr-14
Oct-14
All ages
18-34
35-37
44 Fertility treatment 2014 – Trends and figures Human Fertilisation and Embryology Authority
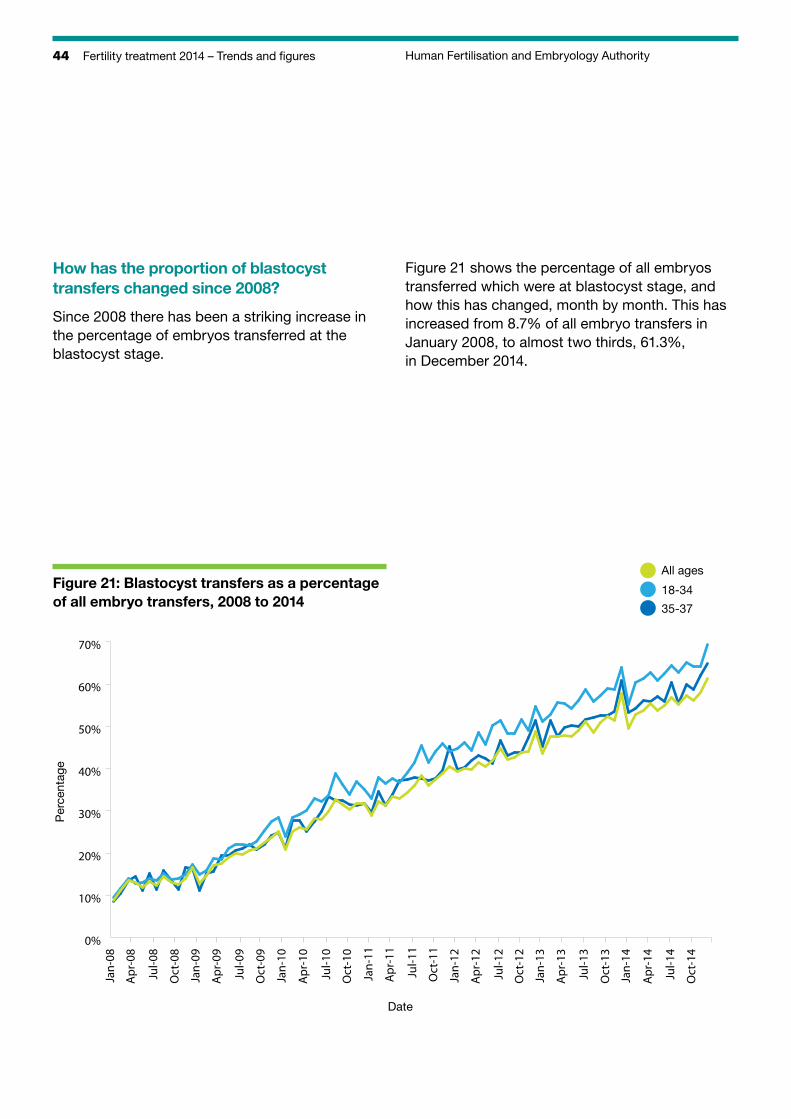
How has the proportion of blastocyst transfers changed since 2008?
Since 2008 there has been a striking increase in the percentage of embryos transferred at the blastocyst stage.
Figure 21 shows the percentage of all embryos transferred which were at blastocyst stage, and how this has changed, month by month. This has increased from 8.7% of all embryo transfers in January 2008, to almost two thirds, 61.3%, in December 2014.
Figure 21: Blastocyst transfers as a percentage of all embryo transfers, 2008 to 2014
Per
cent
age
Date
0%
10%
20%
30%
40%
50%
60%
70%
Jan-08
Jul-0
8
Jan-09
Jul-0
9
Jan-10
Jul-1
0
Jan-11
Jul-1
1
Jan-12
Jul-1
2
Jan-13
Jul-1
3
Jan-14
Jul-1
4
Apr-08
Oct-08
Apr-09
Oct-09
Apr-10
Oct-10
Apr-11
Oct-11
Apr-12
Oct-12
Apr-13
Oct-13
Apr-14
Oct-14
All ages
18-34
35-37
45Human Fertilisation and Embryology AuthorityFertility treatment 2014 – Trends and figures
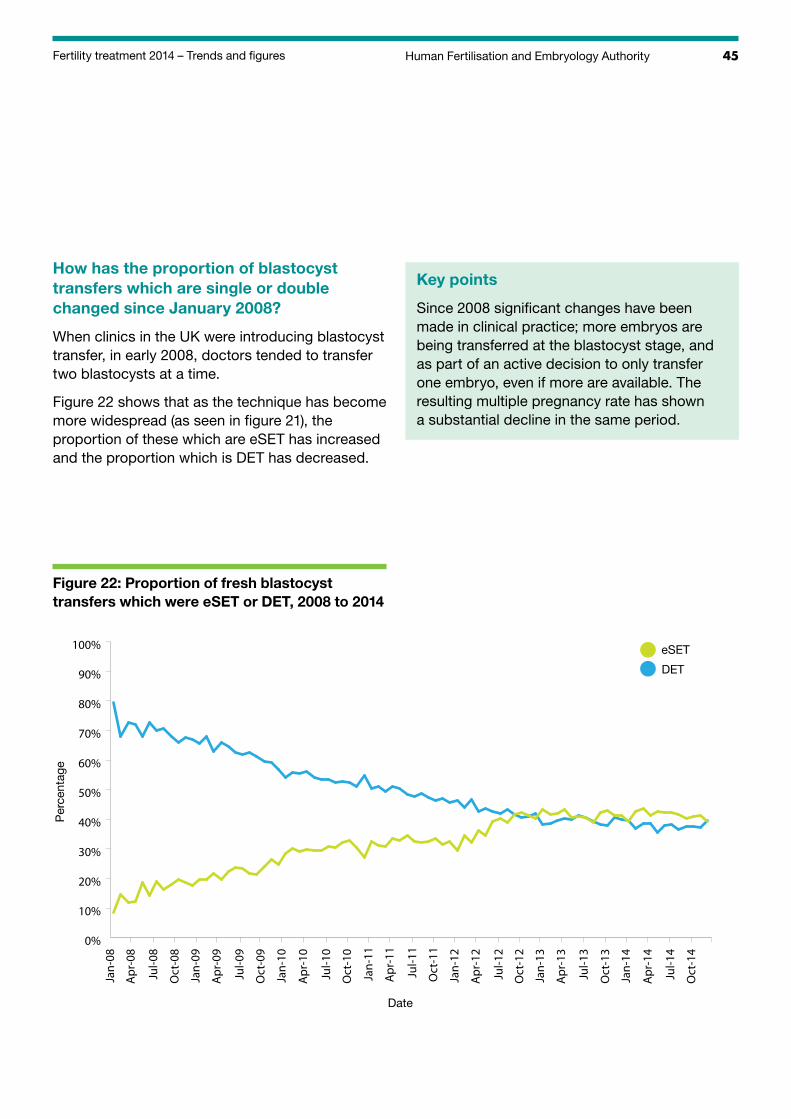
How has the proportion of blastocyst transfers which are single or double changed since January 2008?
When clinics in the UK were introducing blastocyst transfer, in early 2008, doctors tended to transfer two blastocysts at a time.
Figure 22 shows that as the technique has become more widespread (as seen in figure 21), the proportion of these which are eSET has increased and the proportion which is DET has decreased.
Key points
Since 2008 significant changes have been made in clinical practice; more embryos are being transferred at the blastocyst stage, and as part of an active decision to only transfer one embryo, even if more are available. The resulting multiple pregnancy rate has shown a substantial decline in the same period.
Figure 22: Proportion of fresh blastocyst transfers which were eSET or DET, 2008 to 2014
Per
cent
age
Date
0%
10%
20%
30%
40%
50%
60%
70%
80%
90%
100%
Jan-08
Jul-0
8
Jan-09
Jul-0
9
Jan-10
Jul-1
0
Jan-11
Jul-1
1
Jan-12
Jul-1
2
Jan-13
Jul-1
3
Jan-14
Jul-1
4
Apr-08
Oct-08
Apr-09
Oct-09
Apr-10
Oct-10
Apr-11
Oct-11
Apr-12
Oct-12
Apr-13
Oct-13
Apr-14
Oct-14
eSET
DET
46 Fertility treatment 2014 – Trends and figures Human Fertilisation and Embryology Authority
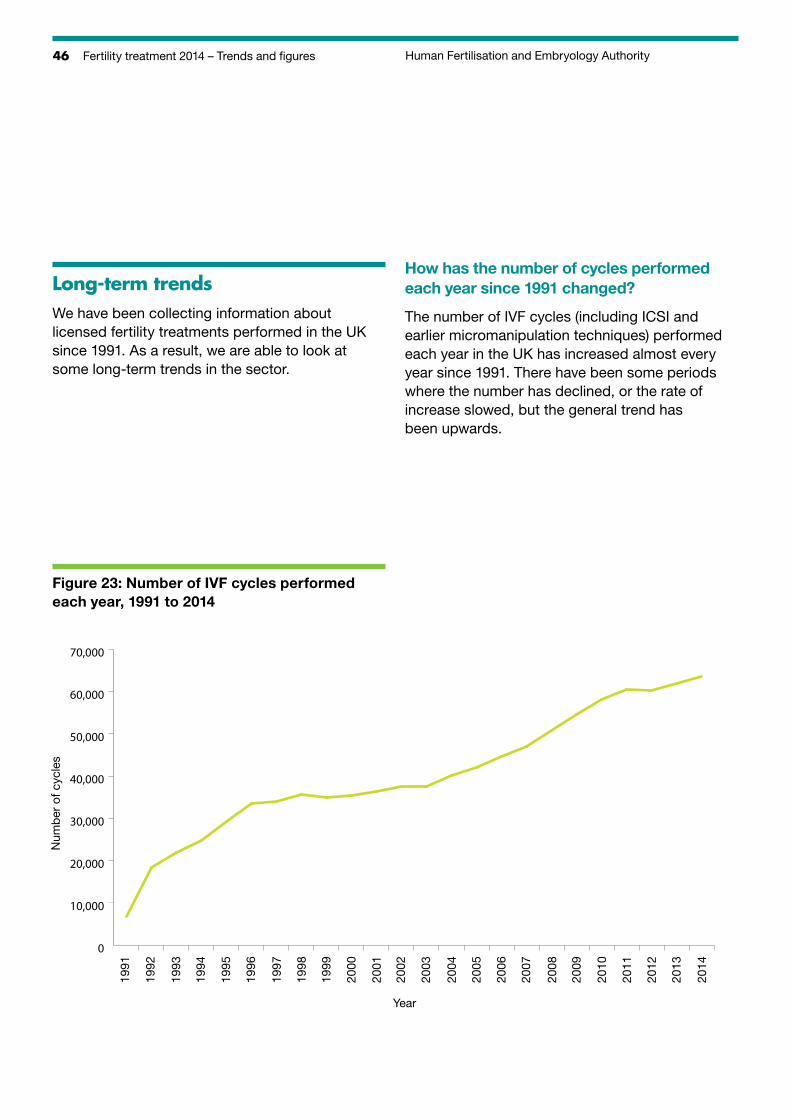
Long-term trendsWe have been collecting information about licensed fertility treatments performed in the UK since 1991. As a result, we are able to look at some long-term trends in the sector.
How has the number of cycles performed each year since 1991 changed?
The number of IVF cycles (including ICSI and earlier micromanipulation techniques) performed each year in the UK has increased almost every year since 1991. There have been some periods where the number has declined, or the rate of increase slowed, but the general trend has been upwards.
Figure 23: Number of IVF cycles performed each year, 1991 to 2014
Num
ber
of c
ycle
s
Year
1991
1992
1993
1994
1995
1996
1997
1998
1999
2000
2001
2002
2003
2004
2005
2006
2007
2008
2009
2010
2011
2012
2013
2014
0
10,000
20,000
30,000
40,000
50,000
60,000
70,000
47Human Fertilisation and Embryology AuthorityFertility treatment 2014 – Trends and figures
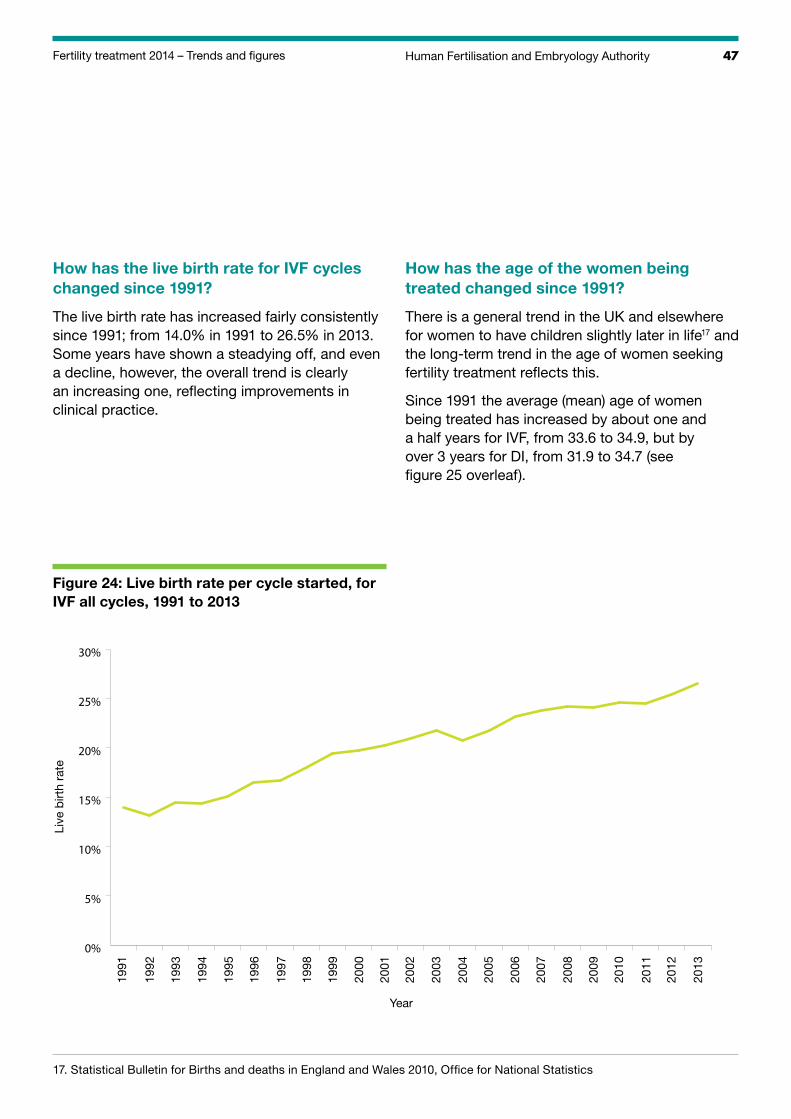
How has the live birth rate for IVF cycles changed since 1991?
The live birth rate has increased fairly consistently since 1991; from 14.0% in 1991 to 26.5% in 2013. Some years have shown a steadying off, and even a decline, however, the overall trend is clearly an increasing one, reflecting improvements in clinical practice.
How has the age of the women being treated changed since 1991?
There is a general trend in the UK and elsewhere for women to have children slightly later in life17 and the long-term trend in the age of women seeking fertility treatment reflects this.
Since 1991 the average (mean) age of women being treated has increased by about one and a half years for IVF, from 33.6 to 34.9, but by over 3 years for DI, from 31.9 to 34.7 (see figure 25 overleaf).
Figure 24: Live birth rate per cycle started, for IVF all cycles, 1991 to 2013
Live
birt
h ra
te
Year
1991
1992
1993
1994
1995
1996
1997
1998
1999
2000
2001
2002
2003
2004
2005
2006
2007
2008
2009
2010
2011
2012
2013
0%
5%
10%
15%
20%
25%
30%
17. S tatistical Bulletin for Births and deaths in England and Wales 2010, Office for National Statistics
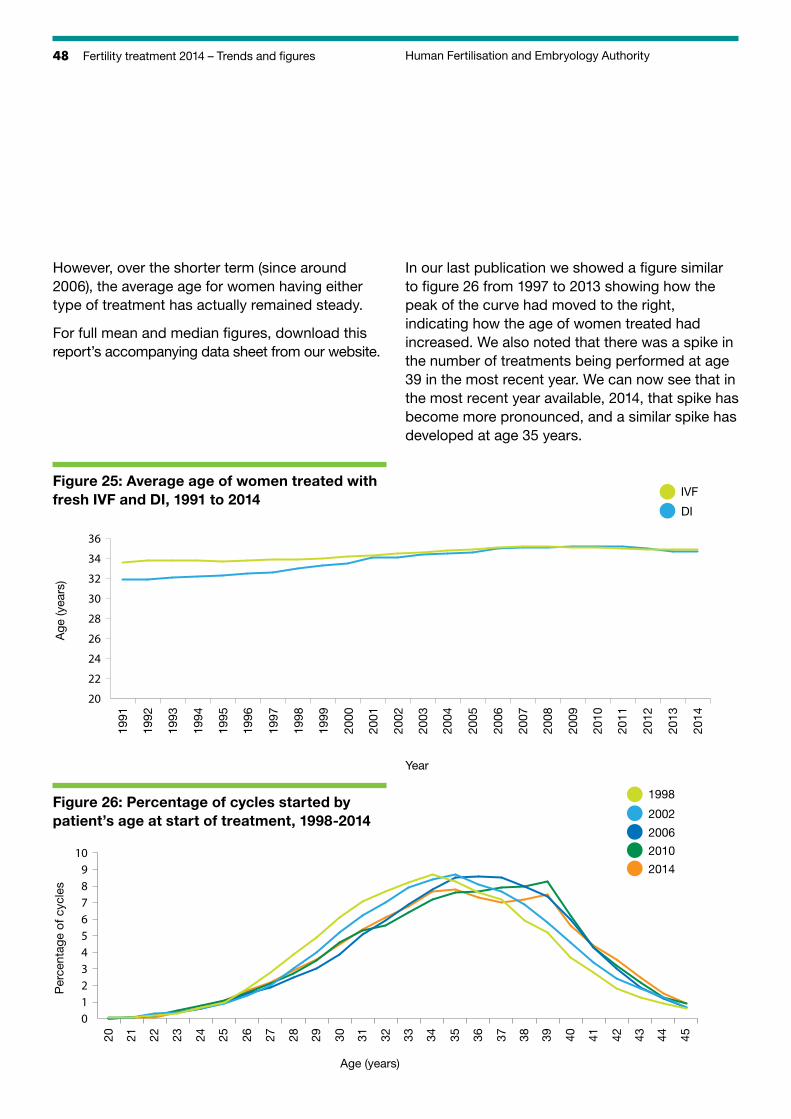
48 Fertility treatment 2014 – Trends and figures Human Fertilisation and Embryology Authority
However, over the shorter term (since around 2006), the average age for women having either type of treatment has actually remained steady.
For full mean and median figures, download this report’s accompanying data sheet from our website.
In our last publication we showed a figure similar to figure 26 from 1997 to 2013 showing how the peak of the curve had moved to the right, indicating how the age of women treated had increased. We also noted that there was a spike in the number of treatments being performed at age 39 in the most recent year. We can now see that in the most recent year available, 2014, that spike has become more pronounced, and a similar spike has developed at age 35 years.
Figure 25: Average age of women treated with fresh IVF and DI, 1991 to 2014
Age
(yea
rs)
1991
1992
1993
1994
1995
1996
1997
1998
1999
2000
2001
2002
2003
2004
2005
2006
2007
2008
2009
2010
2011
2012
2013
2014
20
22
24
26
28
30
32
34
36
IVF
DI
Per
cent
age
of c
ycle
s
Age (years)
20 21 22 23 24 25 26 27 28 29 30 31 32 33 34 35 36 37 38 39 40 41 42 43 44 45
0123456789
10
1998
2002
2006
2010
2014
Year
Figure 26: Percentage of cycles started by patient’s age at start of treatment, 1998-2014
49Fertility treatment 2014 – Trends and figures Human Fertilisation and Embryology Authority
How many babies in the UK have been born as a result of IVF treatment since 1991?
Since the first IVF baby was born in 1978, an estimated 5 million babies have been born worldwide after IVF treatment18. In the UK 240,724 babies have been born after IVF treatment between 1991 and 2013.
How has the proportion of babies born following IVF changed since 1992?
Since 1992, the number of babies born every year in the UK has fluctuated. The number declined through the 1990s, but picked up again and has increased sharply in the 2000s19.
During this time, the proportion of those babies born who were IVF babies has steadily increased. In 1992, 0.3% of all babies were born as a result of IVF treatment; in 2002 this had reached 1.4%. In 2013 2.1% of all babies born in the UK were conceived as a result of IVF treatment.
Key points
The number of IVF cycles performed each year has increased steadily since 1991.
The age of women seeking fertility treatment has increased since 1991, reflecting the wider trend in society for couples to start their families later, but remained steady over the last nine years.
The live birth rate after IVF has increased from only 14% in 1991, to just over a quarter by 2013.
In 2013, just over 2% of all the babies born in the UK had been conceived through IVF treatment.
18. European Society of Human Reproduction and Embryology (2014) ART Factsheet, published online www.eshre.eu/ESHRE/English/Guidelines-Legal/ART-fact-sheet/page.aspx/1061 accessed 22/02/2016.
19. E ngland and Wales: Office for National Statistics, Births Summary Tables, 2013, www.ons.gov.uk/ons/rel/vsob1/birth-summary-tables--england-and-wales/2013/index.html; Scotland: General Register Office for Scotland, http://www.nrscotland.gov.uk/statistics-and-data/statistics/statistics-by-theme/vital-events/general-publications/vital-events-reference-tables/2014/section-3-births; Northern Ireland: NISRA, Live births, 1887 to 2014, www.nisra.gov.uk/demography/default.asp8.htm