fertilizer industry handbook 2014 (slides only)
TRANSCRIPT

Yara Fertilizer Industry Handbook February 2014

IR – Date: February 2014
1
List of contents
Fertilizer industry overview – What is fertilizer? p. 2
– The fertilizer industry p. 16
Fertilizer industry dynamics p. 26
– Ammonia p. 28
– Urea p. 33
Industry value drivers p. 39
– Drivers of demand p. 42
– Drivers of supply p. 60
– Price relations p. 67
– Production economics p. 74
Industrial applications p. 80

What is fertilizer?

IR – Date: February 2014
3
Plants need nutrients to grow
Nutrient behavior
Nutrients have specific
and essential functions in plant
metabolisms
They cannot replace each
other, and lack of any one
nutrient limits crop growth
YIELD
Pota
ssiu
m
Phosphoru
s
Calc
ium
Soil conditions
& other growth
factors

IR – Date: February 2014
4
What is fertilizer?
Nitrogen is the main driver of yield

IR – Date: February 2014
5
Why mineral fertilizer ?
Mineral fertilizers are necessary to replace those nutrients that have been removed from the field
N Organic
substance, humus
Crop residues are decomposed to minerals
Mineralisation
• Export of nutrients with the harvest
• Growing demand
for food & feed
Supply of crop residues
and organic fertilizer
P K
S …
Mg
NPK

IR – Date: February 2014
6
61%
23%
16%
Nitrogen – the most important nutrient
Total 176 million
tons nutrients
Nutrient characteristics Primary
benefit Application Industry structure
Improve
crop quality
Increase crop
size
Most important
and commonly
lacking nutrient
Annual
application
not always
done
Annual
application
critical
Fewer suppliers,
production
discipline
Industry more
fragmented,
under
consolidation
More dynamic
prices, but stable
volume
Potassium
(K)
Phosphorus
(P)
Nitrogen
(N)
Source: IFA (season 2012/13 estimate, May 2013)

IR – Date: February 2014
7
Profitability of investment in mineral fertilizers
The investment in nitrogen fertilizer
is highly profitable for growers
Fertilizer investment: 248 USD/ha
Net return: 1,711 USD/ha
Net return > 7 x investment
0.0
1.0
2.0
3.0
4.0
5.0
6.0
7.0
8.0
9.0
10.0
0
500
1,000
1,500
2,000
2,500
3,000
0 50 100 150 200 250 300
Yield, ton/ha
Income USD/ha
Fertilizer application, kg N/ha
Source: Winter wheat yield data: Long term trial, Broadbalk, Rothamsted (since 1856).
Yield response (monetary value) to N fertilizer rate

IR – Date: February 2014
8
Seed 15 %
Fertilizer 24 %
Chemicals 4 %
Labour 4 %
Power & Machinery 24 %
Land 22 %
Other 7 %
Breakdown grain production costs
Source: USDA (Cost-of-production forecasts May 2013)
Example: 2013F average US corn production costs
2000 2002 2004 2006 2008 2010 2012 2014F
0%
5%
10%
15%
20%
25%
30%
Fertilizers as part of US corn production costs

IR – Date: February 2014
9
Nitrate is the most important fertilizer in Europe
Nitrate (NO3-) Ammonium (NH4
+)
Ammonium-N is fixed onto
clay minerals in the soil and
therefore immobile. The plant
roots have to grow actively
towards the nutrient.
Nitrate-N is always dissolved
in the soil water and is
transported passively together
with the water into the plant
root. Thus, nitrate is rapidly
effective.
Urea (CON2H4)
Urea-N needs to be
converted into ammonium-
N before it is plant
available.
Nitrates vs. urea

IR – Date: February 2014
10
0
25
50
75
100
AN Urea UAN
Nitrate-based fertilizers are superior to urea both
agronomical and environmentally
The agronomical efficiency of nitrates is superior to urea
The carbon footprint is lower than for Urea
Source: DEFRA (2006), NT26 project report; Fertilizer Europe; 2EMEP/EEA air pollutant emission inventory guidebook (2007); Yara
Nitrogen recovery (% of AN)
Urea requires up to 20% higher N application to achieve same cereal crop yield and quality as AN
Lifecycle carbon footprint (kg CO2 eq/kg N)
0
4
8
12
AN Urea
Although urea is more CO2 efficient in production, CO2 emissions and ammonia volatilization on application
more than offset for this

IR – Date: February 2014
11
Trial results in arable crops
8.2
8.4
8.6
8.8
9.0
Urea UAN CAN CN
Grain yield (t/ha)
Winter wheat trials in UK from 1994-98 Application rate of 160 kg of N/ha
Source: Levington Agriculture, UK (1999)

IR – Date: February 2014
12
100
1,016
0
200
400
600
800
1,000
1,200
Wheat/UK Oranges/Brazil
Index
Increase in crop production value using nitrates instead of urea
Nitrates’ agronomic advantage has higher value
for cash crops than for commodity crops
(160 kg N/ha) (180 kg N/ha)
1,553
3,192
0
500
1,000
1,500
2,000
2,500
3,000
3,500
Wheat/UK Oranges/Brazil
€/ha
Crop value with nitrates

IR – Date: February 2014
13
Fertilizer characteristics:
Organic compared to mineral fertilizer
Characteristics Organic fertilizer Mineral fertilizer
Nutrient
source
Crop residues and animal
manures
Nitrogen from the air and minerals
from the soil
Nutrient
concentration Low concentration High concentration
Nutrient
availability Variable Immediately available for the crop
Quality Often inconsistent Traceable and consistent

IR – Date: February 2014
14
Organic farming represents only a marginal
share of total cultivated land
0.0%
0.1%
0.2%
0.3%
0.4%
0.5%
0.6%
0.7%
0.8%
0.9%
-
5
10
15
20
25
30
35
40
2005 2006 2007 2008 2009 2010 2011
Ha, billions Share of cultivated land
Source: Organic-world.net
33%
29%
18%
10%
7%
3%
Oceania
Europe
Latin America
Asia
North America
Africa

IR – Date: February 2014
15
Fertilizer production routes
Ammonia plant
Nitric acid plant
Nitrophosphate plant
NH3
CO2
Urea
Phosphoric acid plant
Sulphuric acid plant
Natural gas Air
Air
Rock
HNO3
Rock
Salts of K, Mg, S
Rock
Ammonium nitrate
Calcium nitrate
NPK fertilizers
H2PO4 H2SO4
DAP / MAP
Rock
Triple Super Phosphate

The fertilizer industry

IR – Date: February 2014
17
Consumption per nutrient
0
20
40
60
80
100
120
140
1976 1980 1984 1988 1992 1996 2000 2004 2008 2012 2016F
Million tons nutrient
N 1.4% growth pa.
1.7% growth pa. P
K 2,8% growth pa.
Source: IFA, June 2013

IR – Date: February 2014
18
Nitrogen consumption in key regions
0
5
10
15
20
25
30
35
40
1999 2001 2003 2005 2007 2009 2011 2013F 2015F 2017F
Million tons nitrogen
China: 0.4% *
Europe: 1.6% *
North America: 0.0% *
Latin America: 3.6% *
Rest of Asia: 2.3% *
Source: IFA, June 2013 * CAGR 12-17

IR – Date: February 2014
19
Urea 56 %
UAN 5 %
AN/CAN 8 %
NPK 8 %
DAP/MAP 7 %
Ammonia 4 %
Other 12 %
MOP/SOP 72 %
NPK 26 %
Other 2 %
DAP/MAP 56 %
NPK 20 %
SSP 10 %
TSP 6 %
Other 9 %
Key global fertilizer products
108 million tons*
29 million tons 41 million tons
Nitrogen N
Potash K2O Phosphate P2O5
Source: IFA 2012 (nutrient totals) and 2011 (product split) * Does not include industrial nitrogen applications

IR – Date: February 2014
20
Nitrogen fertilizer demand – 5 key markets
Source: IFA 2011
China (33.8 mt)
India (17.4 mt)
West /central Europe (10.3 mt)
Brazil (3.6 mt)
USA (12.1 mt)
Urea 78%
NPK 3%
DAP/MAP 18%
Other 1 %
Urea 67%
ABC 17%
NPK 5%
DAP/MAP 9%
Other 2%
Urea 51%
Nitrates 17%
NPK 8%
DAP/MAP 11%
AS 12%
Urea 22%
Ammonia 27 %
Nitrates 2%
UAN 27%
NPK 8%
DAP/MAP 6%
Other 8% Urea
18%
Nitrates 43%
UAN 11%
NPK 16%
DAP/MAP 2%
Other 9%
IR – Date: February 2014
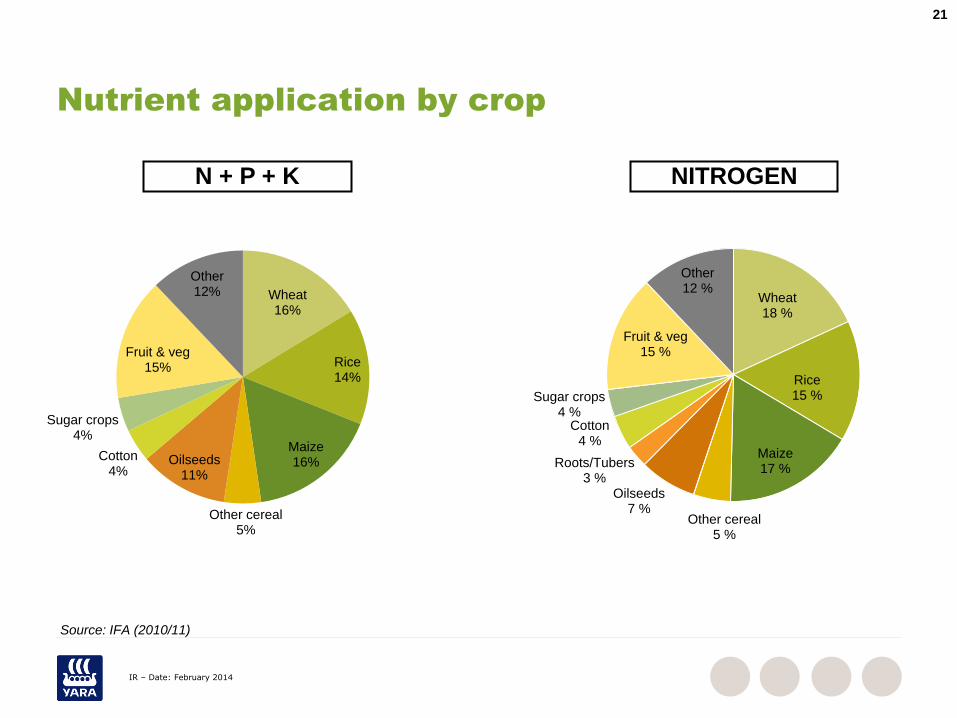
21
Wheat 16%
Rice 14%
Maize 16%
Other cereal 5%
Oilseeds 11%
Cotton 4%
Sugar crops 4%
Fruit & veg 15%
Other 12%
Nutrient application by crop
Source: IFA (2010/11)
N + P + K NITROGEN
Wheat 18 %
Rice 15 %
Maize 17 %
Other cereal 5 %
Oilseeds 7 %
Roots/Tubers 3 %
Cotton 4 %
Sugar crops 4 %
Fruit & veg 15 %
Other 12 %

IR – Date: February 2014
22
Wheat 24%
Rice 30%
Oilseeds 8%
Cotton 9%
Fruits & vegtables
6%
Other 24%
Nitrogen application by crop
Source: IFA 2010/11
Russia
India
EU-27
Brazil
USA
Wheat 48%
Other cereals
14%
Sugar crops 8%
Maize 7%
Oilseeds 2%
Other 21%
Maize 49%
Wheat 13%
Fruits & vegtables
2%
Other cereals
3%
Other 33%
Wheat 28%
Maize 13% Other
cereals 15%
Oilseeds 10%
Fruits & vegtables
7%
Other 27%
China
Fruits & vegtables
30%
Rice 15% Maize
15%
Wheat 14%
Oilseeds 6%
Cotton 3%
Wheat 16%
Maize 25%
Sugar crops 22%
Cotton 4%
Fruits & vegtables
10%
Rice 5%
Other 30%

IR – Date: February 2014
23
Source: Thomson Worldscope
Fertilizer company comparison
0 2 4 6 8 10 12 14 16 18
CF
ICL
K+S
PCS
Mosaic*
Agrium
Yara
L4Q 2012
Revenues - USD billion
* 12 months ending May 2013

IR – Date: February 2014
24
Yara – the leader in nitrogen fertilizers
* Incl. companies’ shares of JVs
Source: Yara & Fertecon Source: Fertilizer Europe Source: Fertilizer Europe
0
1
2
3
4
5
6
7
8
9
Yara CF GDF Agrium PCS
0
1
2
3
4
5
6
7
8
Yara* Euroc. Acron ZAT Rossosh
0
1
2
3
4
5
6
7
Yara Euroc. GDF Acron Agrofert
Production capacity* (mill t)
Global no 1 in ammonia Global no 1 in nitrates Global no 1 in NPK complex fertilizer
Production capacity* (mill t) Production capacity* (mill t)
Excluding China

IR – Date: February 2014
25
Yara – the European cost leader
Ammonia cost position Nitrate cost position
Production cost index: 100 = European FE average excl. Yara
Index Index
50
60
70
80
90
100
110
200
1
200
2
200
3
200
4
200
5
200
6
200
7
200
8
200
9
201
0
201
1
201
2
50
60
70
80
90
100
110
200
1
200
2
200
3
200
4
200
5
200
6
200
7
200
8
200
9
201
0
201
1
201
2
Average cost Yara’s European plants European average (excl. Yara)
Source: Fertilizer Europe

Fertilizer industry dynamics

IR – Date: February 2014
27
Potential industry concerns
and associated mitigants
Weaknesses and risks Mitigating factors
Over-investment at the top
of the cycle
Rising construction costs and lead times, reduced state
ownership
Weak players/lack of focus Spin-offs from chemical/energy companies followed by
consolidation
High cost of natural gas in Europe Long-term trend of gas price convergence between
regions, as pipeline and LNG investments increase liquidity
International trade restrictions WTO accession
Regulatory regimes Operational excellence
Terrorism, accidents, country, customer
and currency risk
Increased management awareness
of risk and better risk management

Ammonia

IR – Date: February 2014
29
Ammonia production
60
80
100
120
140
160
180
2002 2003 2004 2005 2006 2007 2008 2009 2010 2011 2012
Million tons
Total production
Source: IFA
2002-2012 trend growth rate = 2.3%/year
0
10
20
30
40
50
60
Ch
ina
Ru
ssia
Ind
ia
US
A
Ind
on
esia
Trin
idad
Ukra
ine
Ca
nad
a
Sa
udi A
rab
ia
Eg
yp
t
Million tons
10 largest producers

IR – Date: February 2014
30
Most of the ammonia produced is upgraded to
urea or other fertilizers
139
32
0
20
40
60
80
100
120
140
160
Fertilizer Industrial use
Million tons Ammonia use
Urea Nitrates DAP/MAP
NPK Other N Direct application
TotalSource: Fertecon
0
5
10
15
20
25
02 03 04 05 06 07 08 09 10 11 12
Million tons Ammonia trade
Total world trade
Yara trade
Source: Yara, IFA

IR – Date: February 2014
31
Global ammonia trade in 2012
Source: IFA
4.5
3.2
1.6
1.2 1.2 1.0
0.8 0.7 0.7 0.5
0.0
0.5
1.0
1.5
2.0
2.5
3.0
3.5
4.0
4.5
5.0
Trin
idad
Ru
ssia
Sa
udi A
rab
ia
Ukra
ine
Ca
nad
a
Ind
on
esia
Alg
eria
Eg
yp
t
Qata
r
Ira
n
Million tons
10 largest exporters
6.2
1.8
1.2
0.8 0.8 0.7 0.7 0.6 0.4 0.4
0.0
1.0
2.0
3.0
4.0
5.0
6.0
7.0
US
A
Ind
ia
Ko
rea
Mo
rocco
Fra
nce
Be
lgiu
m
Ta
iwa
n
Tu
rke
y
Germ
an
y
Sp
ain
Million tons 10 largest importers

IR – Date: February 2014
32
Main ammonia trade flows 2012
1.9
0.9 0.8 0.6
1.2
3.8
1.0
0.8 3.1
1.3
Million tonnes
0.4
Source: IFA

Urea

IR – Date: February 2014
34
Urea production in 2012
Source: IFA
22.5
6.9 6.5 6.2 4.6 4.4 4.2 4.1 3.8
0
10
20
30
40
50
60
Ch
ina
Ind
ia
Ind
on
esia
Ru
ssia
US
A
Qata
r
Eg
yp
t
Pa
kis
tan
Ira
n
Ca
nad
a
Million tons
10 largest producers
2002-2012 trend growth rate = 3.5% p.a.
60
80
100
120
140
160
180
2002 2003 2004 2005 2006 2007 2008 2009 2010 2011 2012
Million tons
Total production

IR – Date: February 2014
35
Global urea trade in 2012
Source: IFA
6.9
4.8
4.2
3.6
3.1 3.1 2.9
2.2
1.4
1.0
0.0
1.0
2.0
3.0
4.0
5.0
6.0
7.0
8.0
Ch
ina
Ru
ssia
Qata
r
Ukra
ine
Om
an
Sa
udi A
rab
ia
Ira
n
Eg
yp
t
Ca
nad
a
Ind
on
esia
Million tons
10 largest exporters
8.0
7.1
3.0
2.3 1.8
1.5 1.4 1.1
0.9 0.8
0.0
1.0
2.0
3.0
4.0
5.0
6.0
7.0
8.0
9.0
Ind
ia
US
A
Bra
zil
Th
aila
nd
Me
xic
o
Au
str
alia
Tu
rke
y
Pa
kis
tan
Italy
Fra
nce
Million tons
10 largest importers

IR – Date: February 2014
36
Main urea trade flows 2012
1.4
9.3 1.1
0.5 4.0
3.7 1.6 1.4
1.4
1.3
1.4
Source: IFA
Million tonnes
1.4
0.9
4.0
0.6
1.7

IR – Date: February 2014
37
Short-term urea balance impacted by Chinese
export taxes
0
1,000
2,000
3,000
4,000
5,000
6,000
7,000
8,000
Kilotons
Source: BOABC
2008
0 %
20 %
40 %
60 %
80 %
100 %
120 %
0
100
200
300
400
500
600
USD per ton Export tax
2011
2010
Accumulated urea exports Urea price and export tax
2012
2009
* Export tax during low tariff period depends on price level with 40 yuan/t (~2%) representing the minimum tax level
2013

IR – Date: February 2014
38
Chinese domestic urea price and export tax set
the export floor price
Source: China Fertilizer Market Week
1,200
1,400
1,600
1,800
2,000
2,200
2,400
2,600
RMB/t
Chinese domestic urea price

Industry value drivers

IR – Date: February 2014
40
Key value drivers
7.1 6.7
6.4 6.4 5.9 5.6
6.3 6.0 5.6 5.7 5.9
0
2
4
6
8
03 04 05 06 07 08 09 10 11 12 13
NOK/USD exchange rate
185 229 240 245
264
525
240
357
516 545
477
0
100
200
300
400
500
600
03 04 05 06 07 08 09 10 11 12 13
Ammonia fob Black Sea (USD/t)
139 175
220 223
308
499
249 289
423 407
341
0
100
200
300
400
500
600
03 04 05 06 07 08 09 10 11 12 13
Urea prilled fob Black Sea (USD/t)
143 164
187 214
244
466
240 261
379
337 316
0
100
200
300
400
500
03 04 05 06 07 08 09 10 11 12 13
CAN cif Germany (USD/t)
5.5 5.9
8.9
6.7 7.0
8.9
4.0 4.4 4.1
2.8
3.7
0
1
2
3
4
5
6
7
8
9
10
03 04 05 06 07 08 09 10 11 12 13
Henry Hub (USD/MMBtu)
28
38
54
65 73
97
62
80
104 105 104
0
20
40
60
80
100
120
03 04 05 06 07 08 09 10 11 12 13
Oil Brent blend spot (USD/bbl)
Average prices 2003 - 2013 Source: The Market, Fertecon, CERA, World Bank, Norges Bank
IR – Date: February 2014
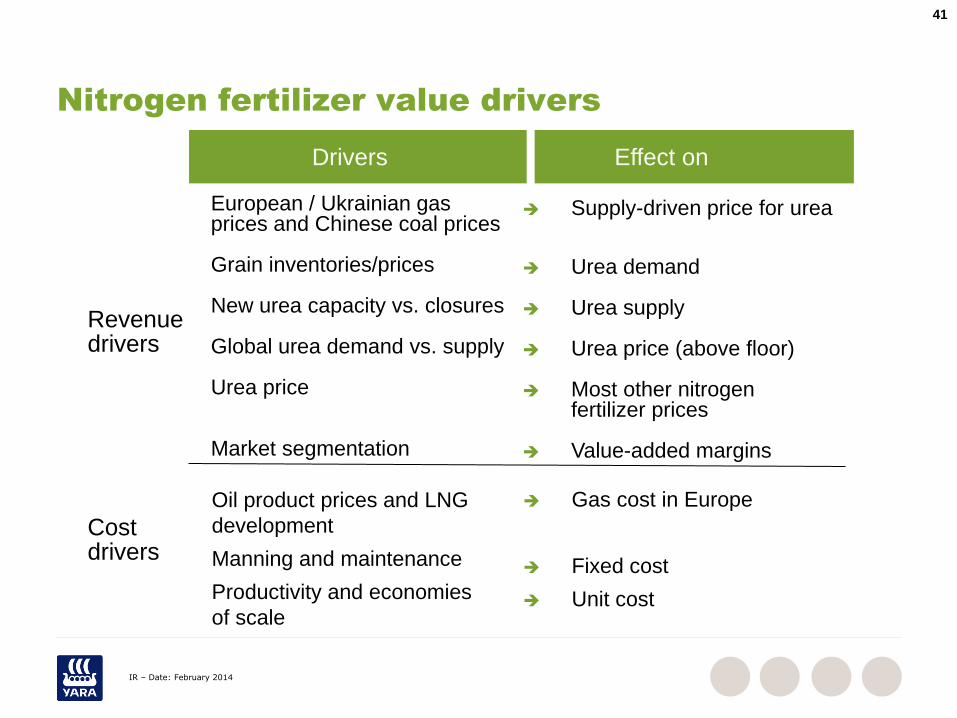
41
Supply-driven price for urea
Urea demand
Urea supply
Urea price (above floor)
Most other nitrogen fertilizer prices
Value-added margins
Nitrogen fertilizer value drivers
European / Ukrainian gas prices and Chinese coal prices Grain inventories/prices New urea capacity vs. closures Global urea demand vs. supply Urea price Market segmentation
Drivers Effect on
Gas cost in Europe
Fixed cost
Unit cost
Oil product prices and LNG
development
Manning and maintenance
Productivity and economies
of scale
Revenue drivers
Cost drivers

Drivers of demand

IR – Date: February 2014
43
Drivers of nitrogen consumption growth
Fertilizer consumption
– Population growth
– Economic growth (improved diets)
– More meat consumption in developing
countries
– More protein-rich diets
– More fruit and vegetables
– Reduce hunger
– Biofuels
Industrial consumption
– Economic growth
– Environmental limits (e.g. reduction of NOx
emissions)

IR – Date: February 2014
44
0
2
4
6
8
10
12
0
500
1,000
1,500
2,000
2,500
65 70 75 80 85 90 95 00 05 10 15E 20E 25E 30E 35E 40E 45E 50E
Billions Million tons
Population less developed regions Population more developed regions Grain consumption
Grain consumption growth stronger than
population growth
Source: US Department of Agriculture, United Nations
4% drop in production, low stocks, demand rationing and spiking prices
3% drop in production 3% drop in production, low stocks, demand rationing and spiking prices
US drought resulting in 3.5% drop in production, low stocks, demand rationing and spiking prices
IR – Date: February 2014
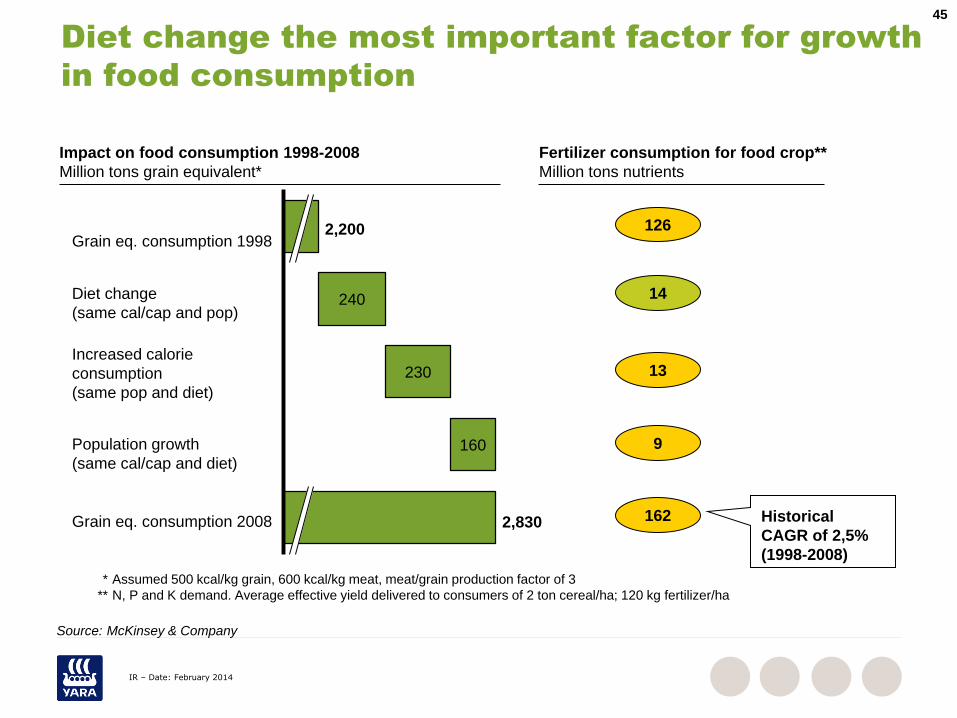
45
240
230
160
Diet change the most important factor for growth
in food consumption
2,200 Grain eq. consumption 1998
Diet change
(same cal/cap and pop)
Increased calorie
consumption
(same pop and diet)
Population growth
(same cal/cap and diet)
2,830 Grain eq. consumption 2008
126
14
13
9
162
Fertilizer consumption for food crop**
Million tons nutrients
Impact on food consumption 1998-2008
Million tons grain equivalent*
* Assumed 500 kcal/kg grain, 600 kcal/kg meat, meat/grain production factor of 3
** N, P and K demand. Average effective yield delivered to consumers of 2 ton cereal/ha; 120 kg fertilizer/ha
Historical
CAGR of 2,5%
(1998-2008)
Source: McKinsey & Company

IR – Date: February 2014
46
Higher meat consumption requires more feed
grain
0 20 40 60 80 100 120 140
Africa
Asia
Latin America
North America
EU
World
Kg/capita/year
Source: FAO
Significant potential for increasing meat consumption in emerging countries
0 1 2 3 4 5 6 7 8 9
Beef
Pork
Poultry
Kilograms of grain to produce 1kg of meat
Feed grain multipliers for meat production
2X
4X
7X

IR – Date: February 2014
47
0
2
4
6
8
10
0.0
0.1
0.2
0.3
0.4
0.5
1960 1970 1980 1990 2000 2010 2020E
Popula
tion (b
illion) H
ecta
res/p
ers
on
Hectares/person Population
Increasing population and reduced land
available for food production per capita
Source: IFA, Worldmarkets.com
Very limited potential to
increase farmable land
Improved living
standards increase
protein consumption per
person, requiring more
grain for animal feed
The only solution is to
increase agricultural
productivity

IR – Date: February 2014
48
Long-term grain price development underlines
productivity challenge
0
50
100
150
200
250
300
2002-2004=100
FAO Food price index
Food Price Index Cereals Price Index

IR – Date: February 2014
49
260
270
280
290
300
310
320
330
340
350
1960 1965 1970 1975 1980 1985 1990 1995 2000 2005 2010 2015
Kg/capita
Production per capita has improved but remains
lower today than in the 80s
Source: USDA (cereal production) and UN (population)
Peak: average 1983-1986: 326 kg/capita
Average 2002-2003 289 kg/capita
Average 2009-2012 319 kg/capita

IR – Date: February 2014
50
Source: USDA February 2014
Record 2013 crop add only 1 day of
consumption to global grain stocks
1,950
2,000
2,050
2,100
2,150
2,200
2,250
2,300
2,350
2,400
2,450
2,500
06 07 08 09 10 11 12 13E 14F
Million tons
Consumption Production
Grain consumption and production Days of consumption in stocks
55
60
65
70
75
80
85
06 07 08 09 10 11 12 13E 14F
Days

IR – Date: February 2014
51
0.0
0.5
1.0
1.5
2.0
2.5
3.0
3.5
4.0
4.5
1960 1970 1980 1990 2000 2010 2020E
Tons of cereals per hectare
Source: FAO, Worldmarkets.com, Yara
1 tonne of grain requires ~25kg nitrogen
Mineral fertilizer
Organic fertilizers
Existing soil nutrients
Mineral fertilizer essential
to sustain future yield increases
Increased production of
mineral fertilizers
necessary to meet future
nutrient demand
Limited potential for
recycling organic
material
Nutrient reserves in the
soil do not increase

IR – Date: February 2014
52
Key crops by producing
Source: USDA, 2012/13 season
United States 32%
China 24% Brazil
8%
EU-27 7%
Ukraine 3%
Other 26%
Maize-global production 840 mt
EU-27 20%
China 18%
India 14%
Russia 6%
US 10%
Other 32%
Wheat-global production 651 mt
China 31%
India 21% Indonesia
8%
Bangladesh 7%
Vietnam 6%
Other 27%
Rice-global production 464 mt
USA 35 %
Brazil 30%
Argentina 21%
China 5%
India 4%
Other 10%
Soybeans-global production 268 mt

IR – Date: February 2014
53
Agricultural profile – key regions
Source: IFA (2011/2012 season), FAO (2011/12 season)
China
India
EU
Brazil
USA
160 mill ha
Maize (34.0)
Soybean (29.9)
Wheat (18.5)
168 kg/ha
3 kg/ha
84 kg/ha
107 mill ha
Wheat (26.1)
Barley (11.9)
Maize (8.9)
116 kg/ha
153 kg/ha 112 mill ha
Maize (33.6)
Rice (30.3)
Wheat (24.3)
149 kg/ha
166 kg/ha
185 kg/ha
72 mill ha
Soybean (24.0)
Maize (13.2)
Sugarcane (9.6)
5 kg/ha
54 kg/ha
65 kg/ha
157 mill ha
Rice (44.0)
Wheat (29.0)
Millet(10.7)
113 kg/ha
137 kg/ha
Arable land, top 3 crops area harvested and nitrogen application.
* Total nitrogen applied (kg) divided by harvested area

IR – Date: February 2014
54
Large variations in yields across regions
Source: FAOSTAT 2012
0
1
2
3
4
5
6
7
8
9
US Argentina China Brazil Mexico
Tons/Ha
Maize yields
0
1
2
3
4
5
6
7
8
France China India US Russia
Tons/Ha Wheat yields
0
1
2
3
4
5
6
7
8
China Viet Nam Indonesia India Bangladesh
Tons/Ha Rice yields
0
1
1
2
2
3
3
Argentina US Brazil China India
Tons/Ha
Soybean yields

IR – Date: February 2014
55
Biofuels: high-level outlook
Source: PIRA, October 2013
0
500
1,000
1,500
2,000
2,500
2005 2006 2007 2008 2009 2010 2011 2012 2013E 2014E 2015E 2020E 2025E
MB/D
Global ethanol production
FSU
Africa
Asia/Pacific
Latin America
EU-28
Canada
U.S.

IR – Date: February 2014
56
N-fertilizer consumption from biofuels production
2.0
0.5
0.3
0.6
US - maize forethanol
Europe - rapeseedfor biodiesel
Brazil - sugarcane forethanol
Others
0.0
0.5
1.0
1.5
2.0
2.5
Million tons N
Source: IFA

IR – Date: February 2014
57
The effect on fertilizer consumption of
genetically modified crops
Herbicide tolerance
(HT) 100
Insect resistance
(IR) 23
HT + IR 41
Cropped area by trait, Million hectares
Source: ISAAA
Soybean 81
Maize 40
Cotton 19
Rapeseed 9
Cropped area by crop, Million hectares

IR – Date: February 2014
58
Fertilizer reduces carbon footprint from farming
Application
Nitrates better than urea
Precision farming (N-tester etc.)
Balanced fertilization (NPK)
Fertilizer - an efficient solar energy catalyst
Production marginal part of carbon footprint - efficient application more important
Huge positive effects of fertilizer use by lower land use
Production
Yara’s production more energy-efficient than competitor average
Yara developed N2O catalyst
© Yara 2010
PRODUCTION TRANSPORTATION FARMING HARVEST CONSUMPTION CAPTURE
3.6 kg CO2 eqv
0.1 kg CO2
5.6 kg CO2 eqv
75 kg CO2
75 kg CO2

IR – Date: February 2014
59
Seasonality in fertilizer consumption
Jul Aug Sep Oct Nov Dec Jan Feb Mar Apr May Jun Corn
USA
China
Europe
Brazil, first crop
Brazil, second crop
Wheat
China (winter wheat)
China (spring wheat)
India (Rabi)
USA (winter wheat)
USA (spring wheat)
Europe (winter wheat)
FSU (winter wheat)
Rice
China (single crop)
China (early double crop)
China.(late double crop)
India (Kharif)
India (Rabi)
Planting/seeding
Harvest
Source: USDA

Drivers of supply

IR – Date: February 2014
61
Nitrogen value chain
Nitrates
Nitric acid
Urea
Ammonia
C02
H, Ar, CO etc
Industrial nitrogen
chemicals
Environmental
products
Industrial gases
Ammonia
Industrial products
Calcium
Nitrate
Natural gas
Nitric acid
Raw material
Intermediate products
Finished products

IR – Date: February 2014
62
Nitrogen technology developments
0
50
100
150
200
250
300
350
400
450
1910 1915 1930 1950 1960 1975 2000
GJ/tN
Birkeland-Eyde electric arc method
Cyanamid method
Haber-Bosch synthesis Steam reforming natural gas
Theoretical minimum

IR – Date: February 2014
63
100 107
113 118 120
0
20
40
60
80
100
120
140
Energy consumption in ammonia production
China’s coal-fired
ammonia plants use 70%
more energy and emit 2.5
times more CO2
Yara
Europe
Europe
ex Yara
Russia Romania &
Bulgaria
US
Energy consumption
per ton ammonia
(relative index)
Source: Fertilizer Europe (2008)

IR – Date: February 2014
64
Source: Fertecon urea update December 2013 (August update in brackets). Consumption data source is IFA.
Year Driving regions Urea capacity growth relative
to nitrogen capacity
Excluding China Excluding China
2013 Qatar 26%
UAE 20% 1.2% (1.4%)
2014 Iran 28%
Algeria 26% 1.5% (1.8%)
2015 Algeria 23%
Iran 12% 3.8% (3.5%)
2016 USA 38%
Nigeria 12% 2.7% (3.2%)
2017 USA 28%
Iraq 27% 1.7% (1.5%)
Gross annual addition 2013-2017 ~2.2%
Assumed annual closures ~0.5%
Net annual addition 2011-2015 ~1.8%
Trend consumption growth from 2002 2.1%
Projected nitrogen capacity additions outside
China in line with historical consumption growth

IR – Date: February 2014
65
Business development Gas agreement
5 year typical construction time for nitrogen
fertilizer projects*
Feasibility phase
Concept selection phase
Prepare for execution
Construction Operation
4–6 years
6-12 months - check cost assumptions by approaching market - bidding for contracts and/or equipment
12-24 months depending on complexity
* Ammonia and urea plant example
30-36 months

IR – Date: February 2014
66
Global urea capacity utilization
70%
75%
80%
85%
90%
95%
100%
1999 2000 2001 2002 2003 2004 2005 2006 2007 2008 2009 2010 2011 2012 2013F2014F2015F2016F2017F
Urea capacity utilization
Excluding China
Source: Fertecon Aug 2013

Price relations

IR – Date: February 2014
68
0
100
200
300
400
500
600
700
800
900
Jan 01 Jan 02 Jan 03 Jan 04 Jan 05 Jan 06 Jan 07 Jan 08 Jan 09 Jan 10 Jan 11 Jan 12 Jan 13 Jan 14
USD/tonne
Urea fob Black Sea 0.6 * Ammonia fob Black sea + 15
Upgrading margins from ammonia to urea
Source: Average of international publications

IR – Date: February 2014
69
0
100
200
300
400
500
600
700
0
50
100
150
200
250
300
350
1982 1984 1986 1988 1990 1992 1994 1996 1998 2000 2002 2004 2006 2008 2010 2012
USD/t USD/mt
Corn Urea fob Middle East
Grain prices important for fertilizer demand
Source: World Bank, Fertilizer publications

IR – Date: February 2014
70
Only shorter periods with supply-
driven urea market
0
100
200
300
400
500
600
2004 2005 2006 2007 2008 2009 2010 2011 2012 2013 2014E
Europe oil index Ukraine (Fertecon) US China
Urea price, fob Yuzhny
Source: Fertecon (Ukraine), Yara estimates

IR – Date: February 2014
71
Nitrate premium is mainly a function of
crop prices and proper marketing
0
50
100
150
200
250
300
350
400
0
50
100
150
200
250
300
350
400
450
02/03 03/04 04/05 05/06 06/07 07/08 08/09 09/10 10/11 11/12 12/13
Wheat price, USD/t CAN price, USD/t
Adjusted urea* Nitrate premium, USD/t Wheat price
* Urea fob Black sea adjusted for import costs into Europe and nitrogen content similar to CAN

IR – Date: February 2014
72
Grain/oilseed prices – yearly averages
0
2
4
6
8
10
2003 2005 2007 2009 2011 2013
USD/bu Wheat (HRW US Gulf)
0
100
200
300
400
500
600
700
2003 2005 2007 2009 2011 2013
USD/t Rice (Thailand)
0
1
2
3
4
5
6
7
8
2003 2005 2007 2009 2011 2013
USD/bu Corn (US Gulf)
Source: World Bank, Dec 2013
0
5
10
15
20
2003 2005 2007 2009 2011 2013
USD/bu Soybeans (cif Rotterdam)
Average prices 2004-2013

IR – Date: February 2014
73
10-year fertilizer prices – monthly averages
Source: Average of international publications
0
200
400
600
800
1,000
2004 2005 2006 2007 2008 2009 2010 2011 2012 2013
USD/t Ammonia fob Black Sea
0
100
200
300
400
500
2004 2005 2006 2007 2008 2009 2010 2011 2012 2013
USD/t CAN cif Germany
0
200
400
600
800
2004 2005 2006 2007 2008 2009 2010 2011 2012 2013
USD/t Urea prilled fob Black Sea
Average prices 2004 - 2013
0
200
400
600
800
1,000
1,200
2004 2005 2006 2007 2008 2009 2010 2011 2012 2013
USD/t DAP fob US Gulf
Production economics

IR – Date: February 2014
75
7.2
62.8
0
10
20
30
40
50
60
70
80
Yara’s operating cash costs are mainly variable
Temporary plant closures can be
made speedy and with limited
stop/start costs
Example for ammonia/urea plants:
– Takes half a week to stop and a
week to start
– Cost of stopping is 2 days energy
consumption
– Cost of starting is 3 days energy
consumption
Operating cash costs 2012
NOK Billions
Variable costs (90%) - Dry raw materials - Energy - Freight - 3rd party finished fertilizer
Other cash cost (10%)

IR – Date: February 2014
76
Ammonia (NH3)
(82% N)
Ammonia cash cost build-up – example
Gas price: 8 USD/MMBtu
x Gas consumption: 36 MMBtu/mt NH3
= Gas cost: 288 USD/mt NH3
+ Other prod. cost: 26 USD/mt NH3
= Total cash cost 314 USD/mt NH3
Source: Blue Johnson & Associates.
Typical natural gas
consumption for
ammonia production
Excel file used
for calculation:
36 MMBtu natural
gas/tonne ammonia

IR – Date: February 2014
77
Ammonia (NH3)
(82% N)
Urea
(46% N)
Urea cash cost build-up – example
36 MMBtu natural gas/tonne ammonia
Ammonia price: 314 USD/mt NH3
x Ammonia use: 0.58 NH3/mt urea
= Ammonia cost 182 USD/mt urea
+ Process gas cost* 41 USD/mt urea
+ Other prod. cost**: 22 USD/mt urea
= Total cash cost 245 USD/mt urea
Source: Blue Johnson & Associates.
0.58 mt ammonia per tonne urea
CO
2
Excel file used
for calculation:
Same file as for
ammonia
** Including load-out
* Process gas cost is linked to natural gas price

IR – Date: February 2014
78
* There are several NPK formulas. 15-15-15 is just an example
Theoretical consumption factors
Ammonia (82% N)
Urea (46% N)
AN (33.5% N)
CAN (27% N)
NPK (15-15-15)*
P and K

IR – Date: February 2014
79
* P2O5 content of phosphate rock varies. This is an example.
** 1 ton of phosphoric acid requires 1 ton of sulphur.
Main phosphate processing routes
Phosphoric acid (100% P2O5)
DAP (18% N, 46% P2O5)
MAP (11% N, 52% P2O5)
TSP (46% P2O5)
Phosphate rock (72% BPL*, 33% P2O5 )
Sulphur**
Ammonia ( 82% N)
Rock production: 191
Rock exports: 31
Production: 42
Export: 4.4
Production: 33
Export: 16
Production: 21
Export: 5
Production: 6
Export: 3.8
2006 production and exports, million tons P2O5
Source: IFA

Industrial applications

IR – Date: February 2014
81
Ammonia
Nitric acid
CN
Melamine
DIPCAL®
NITCAL®
H2S abatement in sewage
Concentrated nitric acid
Combined products
Urea
Cleaning/ scrubbing
Aqueous ammonia
Glue
AdBlue ®/heavy-duty vehicles
Stationary sources
Industrial gases
N2O abatement
Emulsions
ANFO
TAN
Nitrogen Oxygen
Argon
Propane
Formates
Dry ice
Applic. LIC
LIC wholesale
NH3
Vessels (Yarwil)
CO2
H2S abatement in oil fields
NOX abatement
Acrylonitrile
Technical nitric acid
Industrial nitrogen applications

IR – Date: February 2014
82
Industrial use accounts for 19% of global
nitrogen consumption
~26 million tons N
19% of total N consumption
Environment 5%
Melamine 15%
Glue 64%
Other 16%
~8 million tons N as urea
10% of total urea consumption
Source: Yara estimates
Environment 3 %
Explosives 20%
Chemicals 77%

IR – Date: February 2014
83
Source: Fertecon
Million tons N
Estimated growth of Industrial applications is 10 million tons N (3.3 % annual growth)
0
5
10
15
20
25
30
35
40
2010 2015E 2020E
Urea
Nitric Acid
Ammonia, DeNOx
Ammonia, TAN
Ammonia, P-Chem
Global demand development of nitrogen
chemicals for industrial applications is strong

IR – Date: February 2014
84
Automotive, off and on road
Stationary
Maritime
Air1
NOxCare
Yarwil
AdBlue/DEF is a generic name for urea-based solution Air1 is Yara’s brand name for AdBlue/DEF
Nitrogen oxides emissions lead to ground ozone layer and acid rain Urea or ammonia combined with an SCR catalyst, eliminates up to 90% NOx emissions Legislation requires emission limits from mobile sources (transport fleets on land and at sea) and from industrial sources (power plants, cement factories, waste incinerators, refineries…)
Example
Urea and ammonia based solutions
to improve air quality

IR – Date: February 2014
85
Example
Technical Nitrates for Civil Explosives
Various grades of Ammonium Nitrate and Calcium Nitrate for use in the civil
explosives and mining industries

IR – Date: February 2014
86
Example:
CO2 has numerous industrial applications
Food additive:
High-quality CO2
for beverage carbonisation
Food care:
CO2 for greenhouses, chilling
and freezing, processing and
transport
Animal care:
Controlled atmosphere for
livestock stunning
Manufacturing:
Welding and cutting
gases
Industries Served :
Breweries
Dairies
Bakeries
Meat and Poultry processing
Fish Farming and processing
Greenhouses
Airline catering
Refrigerated transport
Blasting :
Multipurpose cleaning

IR – Date: February 2014
87
Calcium nitrate for H2S abatment
• Hydrogen Sulphide (H2S) is a
highly toxic, odorous, and
corrosive gas formed in
wastewater systems. It
represents a significant health
risk potentially causing loss of
smell, eye irritation, rhinitis and
respiratory difficulties amongst
other symptoms
• Yara’s calcium nitrate application
is a natural biological system that
removes and prevents the
formation of H2S in sewage
systems and waste water
treatment plants
Industries Served :
Municipalities
Wastewater treatment
plants
Dairies
Pulp and paper industry
Slaughter houses
Breweries
Oil fields

IR – Date: February 2014
88
Sources of market information
Fertilizer market information – FMB www.fmb-group.co.uk
– Fertecon www.fertecon.com
– Fertilizer Week www.cruonline.crugroup.com
– Profercy www.profercy.com
– The Market www.icispricing.com
– Green Markets (USA) www.greenmarkets.pf.com
– Beijing Orient Business (China) www.boabc.com
– China Fertilizer Market Week www.fertmarket.com
Fertilizer industry associations – International Fertilizer Industry Association (IFA) www.fertilizer.org
– Fertilizers Europe (EFMA) www.efma.org
Food and grain market information – Food and Agriculture Organization of the UN www.fao.org
– International Grain Council www.igc.org.uk
– Chicago Board of Trade www.cbot.com
– World Bank commodity prices www.worldbank.org
– US Department of Agriculture (USDA) www.usda.gov

www.yara.com