fertilizer/agro-chemical report kunsmis/ landbou-chemiese
TRANSCRIPT

Fertilizer/Agro-chemical reportKunsmis/
Landbou-chemiese verslag
Updated: September 2021 (Used International prices for August)
Opgedateer: September 2021 (Gebruik Internasionale pryse vir Augustus)
Disclaimer: The information herein has been obtained from various sources, the accuracy and/or completeness of which Grain SA does not guarantee and for which Grain SA accepts no liability. Any prices or levels contained herein are preliminary and indicative only and do not represent
bids or offers. These indications are provided solely for your information and consideration.
Chemical Prices/Chemikalieë Pryse

Onkruiddoders/HerbicidesInternasionale onkruiddoder pryse – Jaar-op-jaar veranderinge ($/t)/International herbicide prices - Year to Year change ($/t)
August-20 August-21 % change
USD/t USD/t
Glyphosate (95%) 3 408 8 607 +152,5
Acetochlor (92%) 3 000 3 924 +30,8
Atrazine (97%) 2 430 3 138 +29,1
Metolachlor (97%) 3 278 4 074 +24,3
Trifluralin (95%) 6 586 6 837 +3,8
R/$ 17,23 14,77 -14,3
Internasionale onkruiddoder pryse – Jaar-op-jaar veranderinge (R/t)/International herbicide prices - Year to Year change (R/t)
August-20 August-21 % changeR/t R/t
Glyphosate (95%) 58 722 127 119 +116,5
Acetochlor (92%) 51 694 57 956 +12,1
Atrazine (97%) 41 873 46 348 +10,7
Metolachlor (97%) 56 483 60 177 +6,5
Trifluralin (95%) 113 471 100 988 -11,0

Onkruiddoders/HerbicidesInternational herbicide prices - Month to month change ($/t)
July-21 August-21 % change
USD/t USD/tGlyphosate (95%) 8 354 8 607 +3,0
Acetochlor (92%) 3 921 3 924 +0,1
Atrazine (97%) 3 136 3 138 +0,1
Metolachlor (97%) 4 071 4 074 +0,1
Trifluralin (95%) 6 832 6 837 +0,1
R/$ 14,54 14,77 1,6
International herbicide prices - Month to Month change (R/t)
July-21 August-21 % change
R/t R/t
Glyphosate (95%) 121 472 127 119 +4,6
Acetochlor (92%) 57 010 57 956 +1,7
Atrazine (97%) 45 591 46 348 +1,7
Metolachlor (97%) 59 195 60 177 +1,7
Trifluralin (95%) 99 340 100 988 +1,7

Insekdoders/Insecticides
Internasionale insekdoders pryse - Jaar-op-jaar veranderinge ($/t)/International insecticide prices - Year to Year change ($/t)
August-20 August-21 % change
USD/t USD/t %
Imidacloprid (95%) 12 936 22 348 +72,8
Lambda-cyhalothrin (95%) 24 816 26 277 +5,9
Carbofuran (99%) 14 326 15 956 +11,4
Deltamethrin (98%) 77 898 86 483 +11,0
Acetamiprid (95%) 14 326 18 588 +29,7
Chlorpyrifos (95%) 5 919 5 894 -0,4
Cypermethrin (94%) 13 288 13 221 -0,5
R/$ 17,23 14,77 -14,3

Insekdoders/Insecticides
Internasionale insekdoders pryse - Jaar-op-jaar veranderinge (R/t)/International insecticide prices - Year to Year change (R/t)
August-20 August-21 % change
R/t R/t %
Imidacloprid (95%) 222 892 330 076 +48,1
Lambda-cyhalothrin (95%) 427 578 388 117 -9,2
Carbofuran (99%) 246 835 235 667 -4,5
Deltamethrin (98%) 1 342 184 1 277 360 -4,8
Acetamiprid (95%) 246 835 274 541 +11,2
Chlorpyrifos (95%) 101 976 87 056 -14,6
Cypermethrin (94%) 228 952 195 269 -14,7

Insekdoders/Insecticides
Internasionale insekdoders pryse - Maand-op-maand veranderinge($/t)/ International insecticide prices – Month to Month change ($/t)
July-21 August-21 % change
USD/t USD/t
Imidacloprid (95%) 22 556 22 348 -0,9
Lambda-cyhalothrin (95%) 26 257 26 277 +0,1
Carbofuran (99%) 15 944 15 956 +0,1
Deltamethrin (98%) 89 317 86 483 -3,2
Acetamiprid (95%) 18 574 18 588 +0,1
Chlorpyrifos (95%) 5 830 5 894 +1,1
Cypermethrin (94%) 13 066 13 221 +1,2
R/$ 14,54 14,77 1,6

Insekdoders/Insecticides
Internasionale insekdoders pryse - Maand-op-maand veranderinge ($/t)/
International insecticide prices –Month to Month change (R/t)
July-21 August-21 % change
R/t R/t
Imidacloprid (95%) 327 968 330 076 +0,6
Lambda-cyhalothrin (95%) 381 784 388 117 +1,7
Carbofuran (99%) 231 821 235 667 +1,7
Deltamethrin (98%) 1 298 672 1 277 360 -1,6
Acetamiprid (95%) 270 061 274 541 +1,7
Chlorpyrifos (95%) 84 762 87 056 +2,7
Cypermethrin (94%) 189 975 195 269 +2,8

Highlights in the Agrochemical sector
• According to Agribusiness Global, The price of the active ingredient inglyphosate appears to have reached a ceiling and that should eventuallybring an end to a series of price hikes for the popular herbicide.Glyphosate technical values in China have remained flat for the past threeor four weeks for the first time since January 2020. Unfortunately, thatdoes not mean there will be an immediate corresponding flattening out inprices of the herbicide. Manufacturers are still absorbing previous costincreases for the active ingredient and passing them along to farmers.
• According to the Environmental Protection Agency in the US, Chlorpyrifoswill be banned from use on food crops to protect children’s developingbrains. Farmers must stop using the pesticide within six months

Fertilizer Prices/Kunsmis Pryse

Year on year change August-20 August-21 % change
Kunsmis/Fertilizer Dollar/ton Dollar/ton %
Ammonia (Middle East) 231 608 +163,2
Urea (46) (Eastern Europe) 274 414 +51,1
DAP (USA Gulf) 334 673 +101,5
KCL (CIS) 209 486 +132,5
Rand/Dollar exchange rate 17,23 14,77 -14,3
International Fertilizer Prices/Internationale Kunsmispryse (Dollar Terms/ Dollar Waarde)

Gemiddelde Internasionale kunsmispryse(Rand waarde)/ Average International fertilizer prices (Rand
terms)Year on year change August-20 August-21 % change
Kunsmis/Fertilizer Rand/ton Rand/ton %
Ammonia (Middle East) 3980 8980 +125,6
Urea (46) (Eastern Europe) 4721 6115 +29,5
DAP (USA Gulf) 5755 9940 +72,7
KCL (CIS) 3601 7178 +99,3
Year on year change September-20 September-21 % change
Kunsmis/Fertilizer Rand/ton Rand/ton %
KAN (28) 6013 8775 +45,9
Ureum (46) 7301 10826 +48,3
MAP 9083 15455 +70,2
Kaliumchloried 6642 12956 +95,1
Local Fertilizer Prices/ Plaaslike Kunsmispryse (Rand Terms/Rand Waarde)

International Fertilizer Prices/Internationale Kunsmispryse (Dollar Terms/ Dollar Waarde)
Month to month change July-21 August-21 % Change
Kunsmis/Fertilizer Dollar/ton Dollar/ton %
Ammonia (Middle East) 601 608 +1,2
Urea (46) (Eastern Europe) 440 414 -5,9
DAP (USA Gulf) 672 673 +0,1
KCL (CIS) 431 486 +12,8
Rand/Dollar exchange rate 14,54 14,77 1,6

Local Fertilizer Prices/ Plaaslike Kunsmispryse(Rand Terms/Rand Waarde)
Month to month change August-21 September-21 % ChangeKunsmis/Fertiliser Rand/ton Rand/ton %
LAN (28) 8587 8775 +2,2
Urea (46) 10919 10826 -0,9
MAP 15498 15455 -0,3
KCL 10897 12956 +18,9
Month to month change July-21 August-21 % Change
Kunsmis/Fertiliser Rand/ton Rand/ton %
Ammonia (Middle East) 8739 8980 +2,8
Urea (46) (Eastern Europe) 6398 6115 -4,4
DAP (USA Gulf) 9771 9940 +1,7
KCL (CIS) 6267 7178 +14,5
Gemiddelde Internasionale kunsmispryse(Rand waarde)/Average International fertilizer prices (Rand
terms)

Highlights in the fertiliser market
• South Africa is faced with an ammonia shortage due to a drop in supply ofnatural gas from Mozambique, impacting the entire nitrogen value chain.
• According to Sasol their LAN stock levels are low; however they will supplyall their supply agreement holders with the volumes that have beencommitted to them for the season.

International Fertilizer Prices/Internationale Kunsmispryse
0,000
2,000
4,000
6,000
8,000
10,000
12,000
14,000
16,000
18,000
20,000
150
250
350
450
550
650
201
2 J
an
Ap
rJ
ul
Okt
201
3 J
an
Ap
rJ
uly
Oct
201
4 J
an
Ap
rJ
uly
Okt
201
5 J
an
Ap
rJ
uly
Oct
201
6 J
an
Ap
rJ
ul
Oct
201
7 J
an
Ap
rJ
uly
Oct
201
8 J
an
Ap
rJ
uly
Oct
201
9 J
an
Ap
rJ
uly
Oct
202
0 J
an
Ap
rJ
ul
Oct
202
1 J
an
Ap
rJ
ul
R/$
$ p
er
ton
Ammoniak Ureum DAP Kaliumchloried R/$ wisselkoers

International Fertilizer Prices/Internasionale Kunsmispryse
0
2
4
6
8
10
12
14
16
18
20
0
200
400
600
800
1000
1200
1400
2007 2008 2009 2010 2011 2012 2013 2014 2015 2016 2017 2018 2019 2020 2021
R/$$/
ton
Ammoniak / Ammonia Ureum / Urea DAP MOP R/$
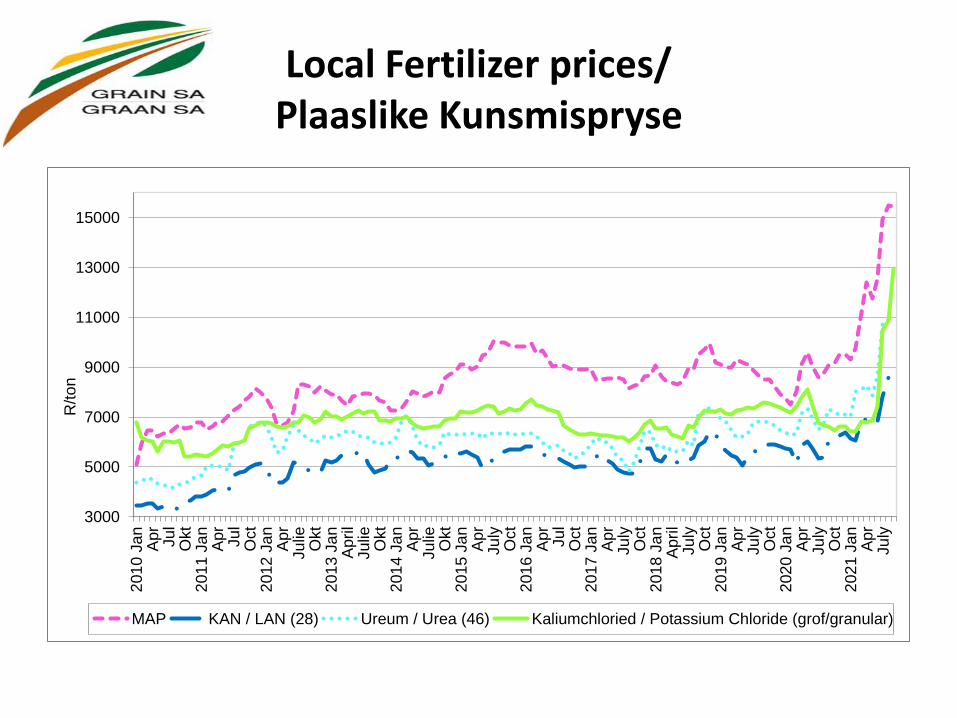
Local Fertilizer prices/Plaaslike Kunsmispryse
3000
5000
7000
9000
11000
13000
15000
201
0 J
an
Apr
Ju
lO
kt
201
1 J
an
Apr
Ju
lO
ct
201
2 J
an
Apr
Ju
lieO
kt
201
3 J
an
Apri
lJu
lieO
kt
201
4 J
an
Apr
Ju
lieO
kt
201
5 J
an
Apr
Ju
lyO
ct
201
6 J
an
Apr
Ju
lO
ct
201
7 J
an
Apr
Ju
lyO
ct
201
8 J
an
Apri
lJu
lyO
ct
201
9 J
an
Apr
Ju
lyO
ct
202
0 J
an
Apr
Ju
lyO
ct
202
1 J
an
Apr
Ju
ly
R/to
n
MAP KAN / LAN (28) Ureum / Urea (46) Kaliumchloried / Potassium Chloride (grof/granular)